Embed Size (px)
Citation preview
Evolution of Humans:
Characteristics of Humans:
• Humans are the most Dynamic force in world
• Human force is Active x Natural Resources are Passive
• H.R. are defines as the “ Energies, skill, talent and knowledge of the people which are applied to production of goods or rendering useful services.”
• So population can be an Asset or a Liability.
• Population increases in Geometric PROPORTION
Concept of Population Explosion
American Sociologist
Kingsley Davis coined :1) Population Explosion 2) Zero Population Growth
Population Explosion : Causes
a) High Fertility Rates:
1: Advances In Medicines
2:Low levels of Education
3: Cultural Factors
4: Rise in Food production
b) Low mortality Rates
c) High Migration Flows
Trends of World population GROWTH
• A – Period of Agricultural Revolution
B – Period of Industrial Revolution
C – Period of Population Explosion
Distribution of Human Population
*2/3 people live on just 7% land surface
*Half land surface supports only 5% population
*90% people live in Northern Hemisphere
*80% live between 20 N to 60N.Out of that , nearly 50 % lives between 20 N - 40 N in Asia
*Majority live on coast.
*Nearly 60% live below 200 meters height in coastal areas of the world.
* Ice caps, deserts, wet areas are avoided.

Population Density
Population Density is a measurement of the number of people in an area. Population Density is calculated by dividing the total Number of human population by an area. It is shown by number of persons per square kilometer or mile.
It is the man – land ratio
Density Areas: 3
• Thinly Populated Areas1: : Density < 10 persons
• a) Tropical Deserts: Sahara, California and Arizona ,Kalahari & Atacama, Great Australian, Thar & Saudi Arabia
• B) Cold Deserts: Alaska, Greenland,Siberia, Antarctica, N. Canada, Europe etc
• C)Hot & Humid Areas: Congo, Amazon basins
• D)Mountains & High Altitude Plateaus: Rocky, Andes, Himalayas,Alps, Plateau of Tibet
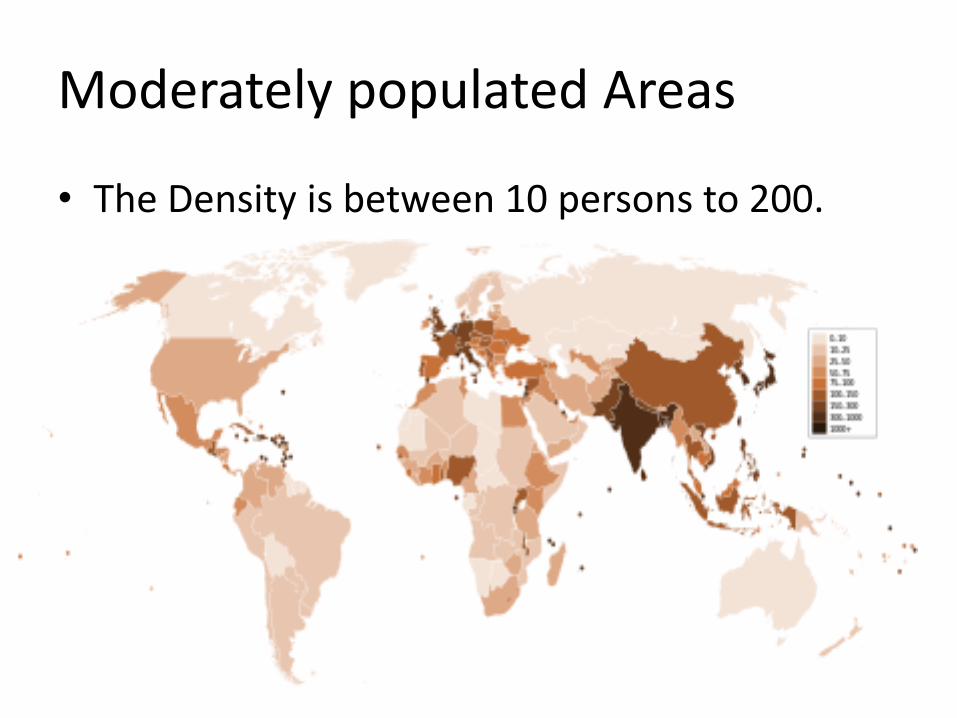
Moderately populated Areas
• The Density is between 10 persons to 200.
The Densely Populated AREAS : 4
1:S. Asia: India, Pak, Bangladesh, Shri Lanka
2: East& S.E. Asia: China, Japan, N & S Korea
3:North –Western Europe
4: N-E part of USA & S.E. Canada
Effects of Population Growth
• A) Degradation of Environment: Global Warming, Ozone depletion, changing climate patterns, environmental pollution
• B) Conflicts and Wars for Water & resources
• C) Rise in Unemployment
• D) High Cost of Living
Demographic Transition Model
• The D.T.M. was put forward by W.S.Thompsonin 1929 & then was fine tuned by F.W.Notestein in 1945.Demographic transition refers to a sequence of changes over a period of time occuring as a result of complex relationship among birth rate, death rate & overall population change.
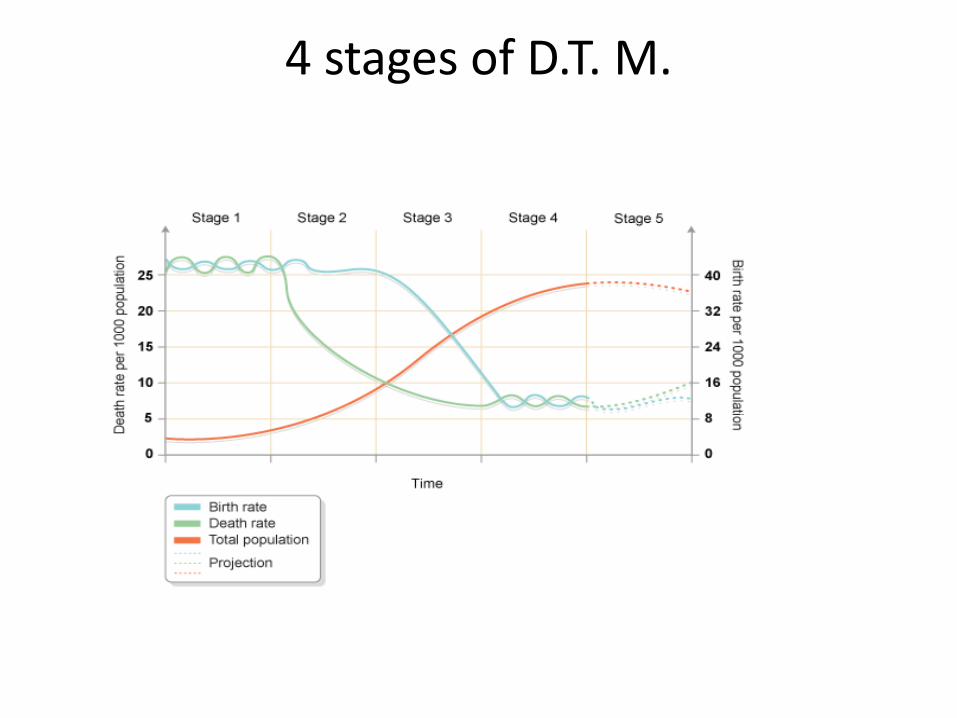
4 stages of D.T. M.
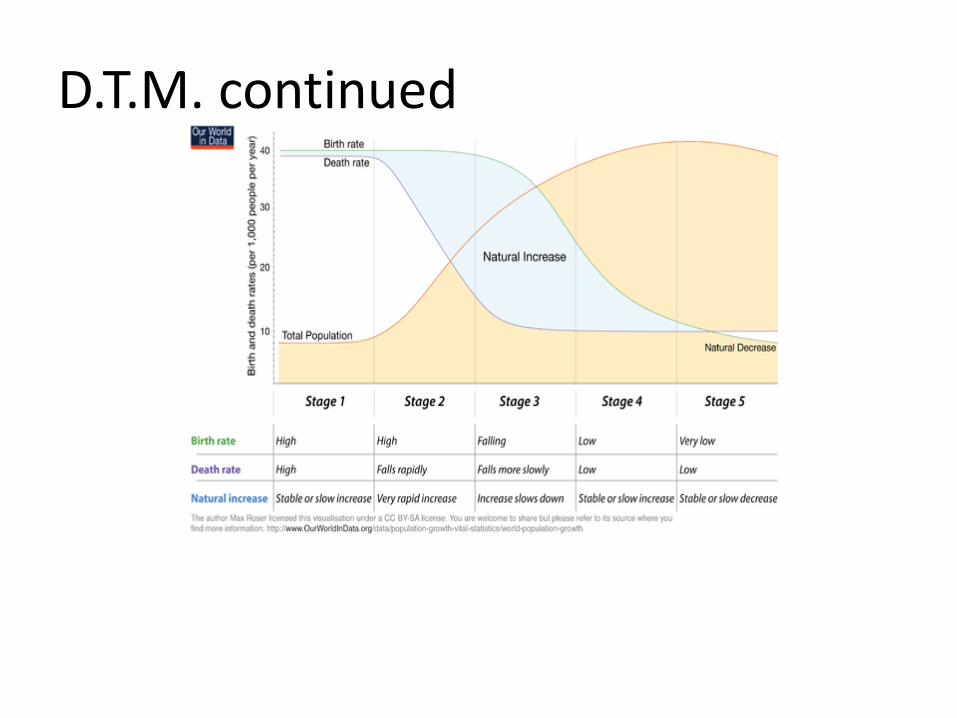
D.T.M. continued
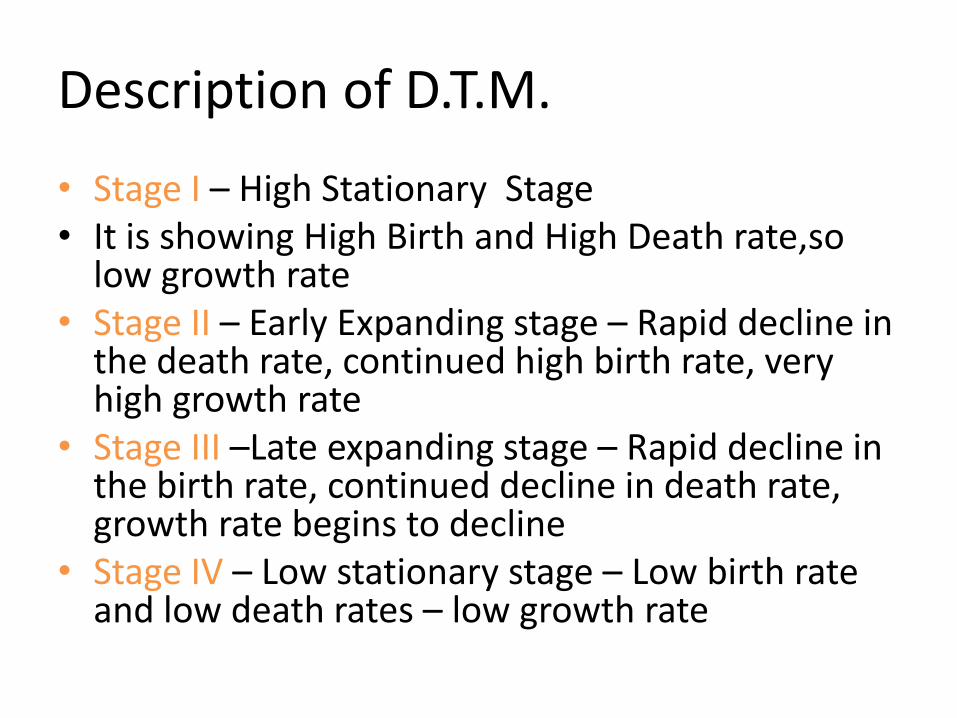
Description of D.T.M.
• Stage I – High Stationary Stage• It is showing High Birth and High Death rate,so
low growth rate• Stage II – Early Expanding stage – Rapid decline in
the death rate, continued high birth rate, very high growth rate
• Stage III –Late expanding stage – Rapid decline in the birth rate, continued decline in death rate, growth rate begins to decline
• Stage IV – Low stationary stage – Low birth rate and low death rates – low growth rate
Population problems: General
• 1. Rapid growth of population• 2.Unemployment• 3.Poverty• 4. Poor std. of living & malnutrition• 5.Agricultural resources • 6.Slow growth of Industrial sector• 7. Orthodoxy x no family planning• 8.Political Problems• 9.Environmental Degradation• 10.Tensions on available resources
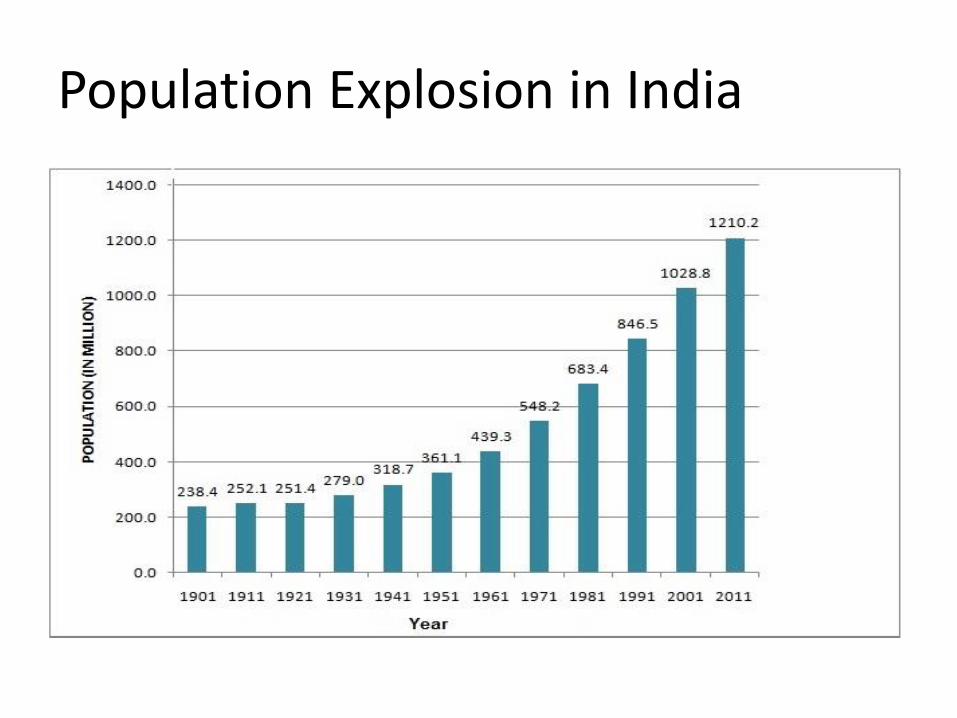
Population Explosion in India
Causes of population Explosion in India
• 1) Early Marriage
• 2)Universal Marriage practice of Girls
• 3)Illiteracy
• 4)Poverty
• 5) Social Norms for male child, Family status
Problems associated with Population Growth in India• 1)Increasing Unemployment
• 2)Poverty & Illiteracy
• 3)Pollution
• 4)Resource Depletion
• 5)Inadequate Healthcare• 6)poor standard of living and malnutrition• 7) Slow growth of Industrial sector• 8) Orthodoxy• 9) Political problems• 10) Environmental degradation• 11)Tensions
Effects of population growth & associated problems
• 1.Degradation of environment: With the overuse of coal, oil and natural gas,it is producing serious effects on our environment. Rise in vehicles have risen the amount of CO2 EMISSIONS leading to global warming. It is melting the ice caps, changing the climate patterns and leading to rise in sea level. The flood condition in Kerala is the best example of degradation of environment due to human interference.
Effects……….
• 2.Conflicts and wars: As water becomes averyscarce resource,tension rises between countries which may result into wars. Poverty increases.
• 3. Rise in Unemployment :
4.High cost of living :The gap between demand and supply increases.
Q.:Explain the pattern of population growth and associated problems in the world.
Population Control Measures in India
• A) Social Measures
• B)Economic Measures
• C) Other Measures
Social Measures
• 1)Minimum Age of Marriage
• 2)Raising the status of Women
• 3)Education Awareness
• 4) Adoption of orphan children
• 5)Change in social outlook
• 6)Social Security leads to less desire for more children
Economic measures
• 1) More employment opportunities
• 2) Development of Agriculture & Industry
• 3) Standard of living
• 4) Urbanization
Other Measures
• 1) Late Marriage• 2) Family Planning: Family by Choice x Chance• Started in 1952 by Govt. of India.• Use of slogans like, Ham do Hamare Do,,Dusare mul tevha, pahile
shalet jaiel tevha,Mulgi shikali- pragati zali.• Symbols like- Nirodh ,RED Triangle, • Use of contraceptives like copper T, condoms , Pills- Mala D
Sterelization operations through Vasectomy and Tubectomyoperations of males in camps, misused by Sanjay Gandhi in Emergency in 1972-73
• Publicity through mass media, print media, hoardings, mouth to mouth publicity,
• Health Care Improvement• Incentives: Monetary, other leaves
National Population Policy of India
• Formulated in 2000 with 3 Objectives like:
• 1)Long Term Objectives : achieving a stable population by 2045, consistent with the requirement of sustainable economic growth, social development, and environmental protection
National POPULATION POLICY
• Mid Term Objective
• To bring the Total Fertility Rate( TFR) TO replacement levels by 2010(?).
• TFR is the average no. of children each women would have in her life time. It has not been achieved.

National Population Policy
• Immediate Objective:of the policy is to address the unmet needs for contraception, health care infrastructure and to provide integrated service delivery for basic reproductive and child health care.
Population & Emerging Issues
• Impact on Natural or Physical Environment::
• 1) Resource Depletion
• 2)Land Use Changes
• 3)Deforestation
• 4)Loss of Biodiversity
• 5)Degradation of Environment: Pollution of Air, water, Noise, Land,Plastic,Light,Mind
Human Development Index(HDI)
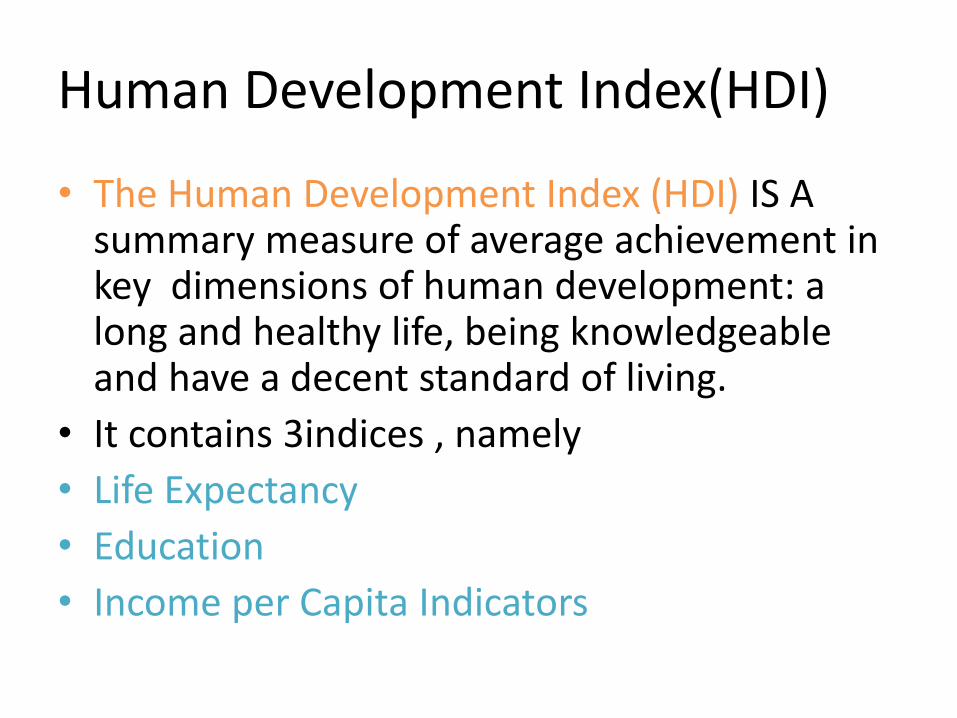
• The Human Development Index (HDI) IS A summary measure of average achievement in key dimensions of human development: a long and healthy life, being knowledgeable and have a decent standard of living.
• It contains 3indices , namely
• Life Expectancy
• Education
• Income per Capita Indicators
History of HDI
• Since 1990, the UNDP i.e. the United Nations Development programme has urged the use of the Human Development Index as a measure of development.
• It was developed by Indian Nobel prizewinner Dr. AmartyaSen, Pakistani Economist Mahbub-ul-Haq , with help from Gustav Ranis of Yale University and Lord Meghnad Desai of London school of Economics, U.K.
• The basic objective of development is to creat an enabling environment in which people can enjoy ling, healthy and creative lives.
• It is a more reliable and accurate measure of development.
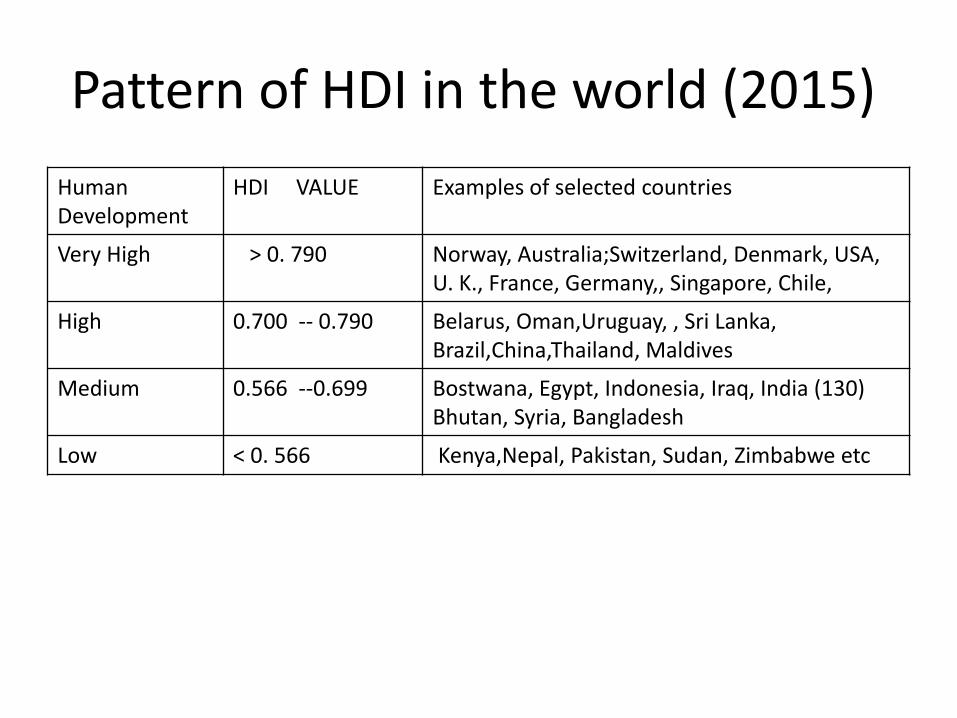
Pattern of HDI in the world (2015)
Human Development
HDI VALUE Examples of selected countries
Very High > 0. 790 Norway, Australia;Switzerland, Denmark, USA, U. K., France, Germany,, Singapore, Chile,
High 0.700 -- 0.790 Belarus, Oman,Uruguay, , Sri Lanka, Brazil,China,Thailand, Maldives
Medium 0.566 --0.699 Bostwana, Egypt, Indonesia, Iraq, India (130)Bhutan, Syria, Bangladesh
Low < 0. 566 Kenya,Nepal, Pakistan, Sudan, Zimbabwe etc
HDI in INDIA
• India has 119th rank out of 169 countries in HDI IN THE WORLD IN 2011. It is laced in the group of countries having medium human development. India’s position is below China(89) and Sri Lanka(91) rank.The main factors responsible for India’s low rank is high degree of ineqality in education and healthcare.Kerala has recorded the highest value in the HDI BECAUSE OF ITS NEARLY HUNDRED PERCENT LITERACY IN 2011.On the other hand Bihar,Chhattisgarh, Jharkhand, Rajashthan, Madhya Pradesh, Odisha, Assam, and Uttar Pradesh have very low literacy.
HDI In India…..
• Similarly, economically developed states like Maharashtra Tamil Nadu, Gujarat and Punjab have higher value of HDI than the states like Assam, Bihar, Madhya Pradesh, Odisha and Uttar Pradesh.
• Give a brief account of Human Development Index in India.
•
Pattern of HDI in India
World Happiness Index
• coined by the 4th King of Bhutan.
• King Jigme Singye Wangchuck in 1972.
• Total 33 indicators in 9 domains.
• The World Happiness Report is a landmark survey of the state of global happiness. The first report was published in 2012, 2nd in 2013 and the third in 2015.
• The first Happiness Report was released on 1st
April 2012.
How to Calculate World Happy Index?
• The Happy World Index (HWI) IS THE LEADING global measure of sustainable well being.
• The index uses global data on life expectancy, experienced well – being and Ecological Footprint to calculate this.
GNH, Gross National Happiness
• It is the Holistic Approach.
• First published in 2012.
• It reported 157 countries.
• India ranked 118.