Embed Size (px)
Citation preview
Working Papers No. 122/09
Evolution of Living Standards and Human Capital in China in 18-20th Century:
Evidences from Real Wage and Anthropometrics .
Joerg Baten, Debin Ma, Stephen Morgan
and Qing Wang
© Joerg Baten, Tuebingen Debin Ma, LSE Stephen Morgan, Nottingham Qing Wang, Munich
June 2009
Department of Economic History London School of Economics Houghton Street London, WC2A 2AE Tel: +44 (0) 20 7955 7860 Fax: +44 (0) 20 7955 7730
Evolution of Living Standards and Human Capital in China in 18-20th Century: Evidences from Real Wage and Anthropometrics*
Joerg Baten. Debin Ma; Stephen Morgan, & Qing Wang
Abstract: This article mobilizes and integrates both existing and new time series data on real wages, physical heights and age-heaping to examine the long-term trend of living standards and human capital for China during the eighteenth to twentieth centuries. Our findings confirm the existence of a substantial gap in living standards between China and North-western Europe in the eighteenth and nineteenth centuries. They also reveal a sustained decline in living standards and human capital at least in South China from the mid-nineteenth century followed by a recovery in the early twentieth century. However, comparative examination of age-heaping data shows that the level of Chinese human capital was relatively high by world standard during this period. We make a preliminary exploration of the historical implication of our findings.
One prominent feature that underpins the phenomenal catch-up of
East Asia from very low levels of per capita incomes after World War II is
the rapid accumulation of physical and human capital. Godo and Hayami
(2002) compiled data on average years of schooling to show that the
Japanese catch-up in average years of schooling preceded that of per
capita income relative to the US in the pre-War period. Unfortunately,
works with such a long-term perspective are relatively scarce given the
* Acknowledgement: We want to thank Dorothee Crayen, Hans Ulrich Vogel, and Osamu Saito for help on data sources and the comments from participants of the Chorus workshop in Nice, France in 2006 and the Conference on “Economic Change around the India Ocean” in July 2008, LSE economic history department seminar and Economic History Society meeting in Warwick, UK in 2009. Joerg Baten thanks for mobility support from ESF GlobalEuroNet, the EU HIPOD project, research assistance from Valeria Prayon and others. Debin Ma acknowledges support of the NSF funded “Global Price and Income Project” headed by Peter Lindert. Stephen Morgan acknowledges several funding grants from the Australian Research Council Small Grants and the University of Melbourne Research Grants schemes, and thanks Fiona Herron and Indah Morgan for research assistance. We are responsible for all the errors.
1
paucity of systematic and comparable data, especially for China.1
Similarly, despite the voluminous literature on China’s long and
tumultuous nineteenth century, which saw social and economic
dislocation from the onslaught of Western imperialism and the
devastating domestic rebellions, quantitative indications of a systematic
kind are sorely lacking for long-term trend in welfare and living standards.
Our paper represents the first attempt to construct a more
comprehensive profile of the evolution of Chinese living standards and
human capital in the nineteenth and twentieth centuries based on the
integration of large-sample based real-wage and anthropometric
evidences. Our data series confirm a general decline in living standards
and human capital after the mid-nineteenth century followed by a
recovery only at the turn of the century. Our real wage data also reveal
Chinese living standards were probably closer to the relatively backward
parts of Europe but lower than North-western Europe in the eighteenth
and nineteenth centuries. So contrary to recent revisionism (Pomeranz
2000, Lee et al. 2002), our studies confirm the traditional view that the
divergence in living standards and per capita incomes between Europe
and China already existed before the industrial revolution and only
widened from the nineteenth century and afterward. However, in contrast
to the findings based on real wages and heights, our age heaping index –
a measure of Chinese numerical abilities – reveals a relatively high level
Chinese human capital, which was closer to that of North-western Europe
for eighteenth and nineteenth centuries than countries with a comparable
low level of living standards.
1 Godo (2006) extended the average years of schooling data to colonial Taiwan and Korea. For physical capital accumulation in East Asia, see the controversial summary article by Paul Krugman (1994). For a summary of the East Asian path of labour-intensive industrialisation based on quality human capital formed in the traditional sector, see Sugihara (2007), “The Second Noel Butlin Lecture.”
2
We explore the historical implication of this intriguing combination
of relatively low living standards but high human capital in China at the
time. The concluding section makes some preliminary discussion on the
unique institutional features in traditional China, such as the Civil-Service
Examination, a unified character-based language and a precocious
government bureaucracy, as factors that contributed to relatively higher
level of literacy and numeracy without necessarily generating sustained
economic growth to support a higher living standard in the early modern
era. We posit that this large reservoir of human capital in early modern
China and East Asia formed important strategic factors to underpin the
region’s rapid economic catch-up in the modern era once the institutional
and ideological changes were accomplished.
The rest of the paper is divided into three sections to discuss the
findings derived from real wage, heights and age-heaping, followed by a
concluding section.
1. Real Wages In the debate on the comparative standard of living of Asians and
Europeans on the eve of the Industrial Revolution, a recent wave of
revisionist scholarship has claimed Asian living standards were on a par
with those of Europe in the eighteenth century. However, the evidence
brought to this debate is fragile, using indirect comparison of scattered
output, consumption or demographic data. This contrasts with our
knowledge of real incomes in Europe where scholars since the mid-
nineteenth century have been compiling databases of wages and prices
for European cities from the late Middle Ages into the nineteenth century
when official statistics begin. 2
2 See Allen et al. 2007 for a review of the data issues and Ma 2004 for a general review of the revisionist scholarship.
3
The ideal measure for comparison would be per capita GDP, which
has the advantage of being the most acceptable measure of the overall
economy and productive capacity, despite the long-held caveats that it
was not able to capture non-market income often crucially important for
developing economies, and distributional dimensions. Unfortunately,
there are no meaningful GDP series for China before the twentieth
century.3 The influential estimates by Maddison are largely guess-work
based on backward projection from twentieth century estimates. While
highly questionable, they might still be useful as a guide for rough
comparisons across benchmarks, but they give little indication of
fluctuations between the benchmarks.
Recent studies by Allen, Bassino, Ma, Moll-Murata and van Zanden
(2007) represent the most ambitious attempt to use real wages to fill this
gap for China in the eighteenth and nineteenth centuries. The wage
series in these studies are constructed from data obtained from Chinese
imperial ministry records, merchant account books and local gazetteers,
which have been deflated using an appropriate cost of living indices
reconstructed from consumption baskets. The Allen et al. paper
concentrates on the wage histories of Canton (south China), Beijing
(north China), and Suzhou and Shanghai in the lower Yangzi (east
China), because they are comparable to the large cities in Europe and
Japan for which we have similar information.
While the Allen et al. study is the most comprehensive so far in
terms of data coverage and methodology, their comparison concentrates
only on the real wage of urban unskilled workers in major cities of Europe
and China. This raises questions of the representativeness and
comparability of their findings.4 Despite these qualifications, which were
3 See Fukao, Ma and Yuan 2007 for a review of GDP data in East Asian. 4 One obvious question is the representativeness of the largest and fastest growing cities in Europe. Allen (2001) has shown that in smaller English cities such as Oxford,
4
extensively discussed in the Allen et al. paper, we have reason to believe
their finding represent a better approximation of the relative levels of real
income at the two ends of Eurasia for the eighteenth and nineteenth
centuries than any available alternative estimates. Clearly, future
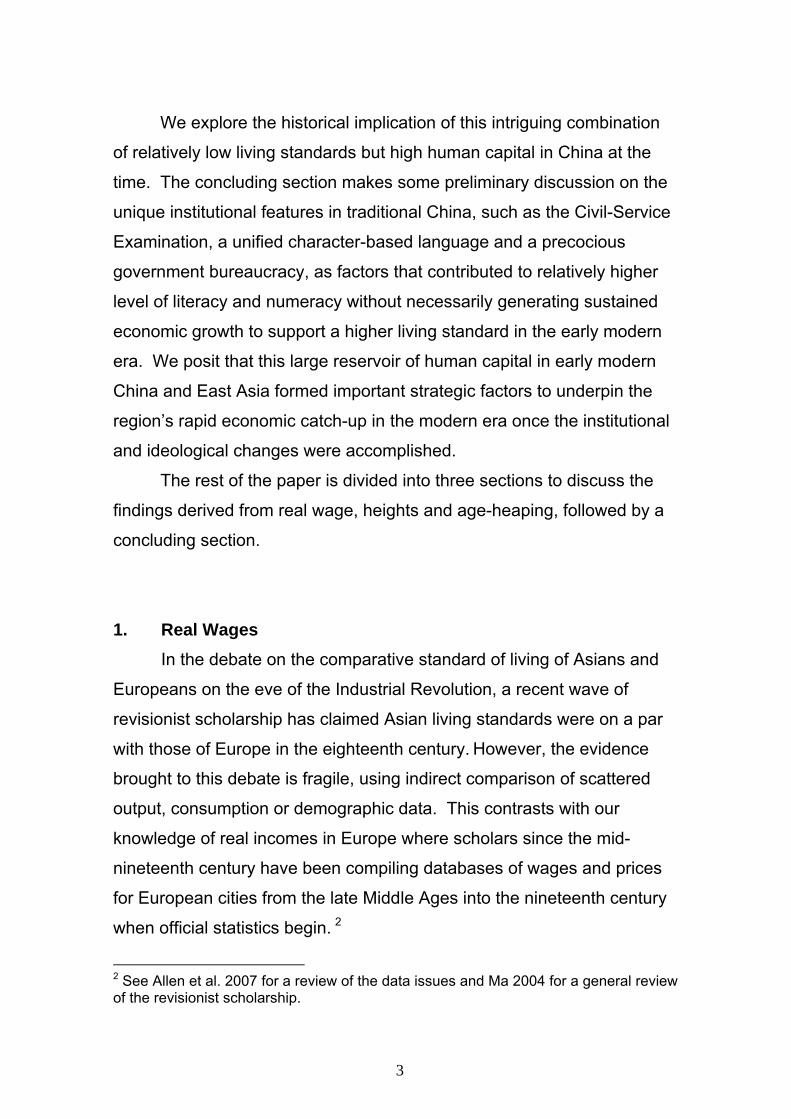
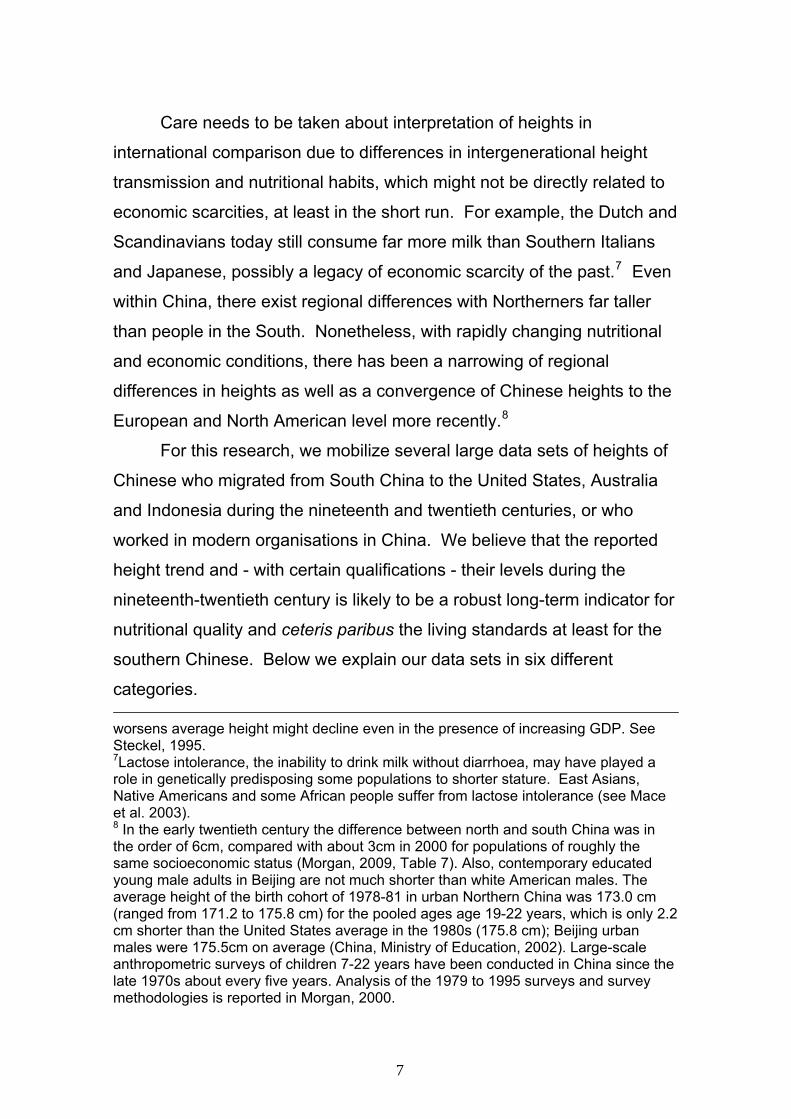
research is needed to produce more definitive findings in this area. Figure
1 reproduces one of their real wage comparisons, which paint a less
optimistic picture of Chinese or Asian performance than the revisionists
suggest.
Insert Figure 1 here
Figure 1 confirms the traditional view that the divergence in living
standards between major urban centres of China and those of the
Netherlands and England was already present in the eighteenth century.
The standard of living of workers in London and Amsterdam was much
higher than that of workers in Beijing or Suzhou in the eighteenth century.
But a major surprise is that unskilled labourers in major cities of China –
poor as they maybe – had roughly the same standard of living as their
counterparts in central and southern Europe, the Ottoman Empire, India,
and Japan for the larger part of the eighteenth century.5
Secondly, from the mid-nineteenth century, real wages in the
industrial core of Western Europe such as Leipzig began to overtake
those of China. In contrast, Milan remained at a similarly low level as
China during this period. By the twentieth century, enough progress had
occurred in even the backward parts of Europe (as shown in Milan) and
Japan that their standards of living were beginning to creep above those
real wages were much lower than those in London, but they were still higher than in China (also see Bassino and Ma 2005). 5 See Allen et al. 2007, figure 6 for other Asian cities. As their paper finds no major differences in levels of real wages among the three cities of Beijing, Canton and Suzhou/Shanghai, the real wage series for Canton is omitted in figure 1.
5
in China, while London increased the lead over Beijing. This is what we
term as the second divergence in the modern era.
Thirdly, and most relevant for our perspective, is the trend in the
real wage series for Beijing (Figure 1). This series is composed of three
series linked together: the first one for the eighteenth century based on
the average of large number of scattered wage information; the second
series based on Sidney Gamble (1943), which runs from 1807 to 1903,
and the third series is for 1900-1925 from Meng and Gamble (1926).
Among these series, the Gamble (1943) series most importantly spans
the entire nineteenth century. As seen in Figure 1, it points to a clear and
sharp drop in real wages during the mid-nineteenth century, a period
known for the severe economic dislocation caused by Taiping Rebellion
that devastated large swathes of southern and eastern China.
2. Heights Historical data on heights have long been an important
complementary measure of living standard (Fogel, 1994; Komlos, 1994;
Steckel, 1995, 2009; Komlos and Baten, 1998; Komlos and Cuff, 1998).
While heights do not measure the purchasing power aspect of living
standard, they are better at capturing the ‘biological’ component of
welfare such as health, life expectancy and the quality of nutrition.
Compared with GDP, height is particularly sensitive to the economic
inequalities and the welfare development of the lower income strata,
which corresponds more closely to the groups of unskilled workers in the
real wage study.6
6 Height is closely correlated with income; the poorer strata of a population on average are shorter than those in the better off strata. In a low income economy, an increase in income will raise average height, other things being equal. Average height will also increase if income distribution improves such that the lower income strata are better able to acquire the inputs necessary for human growth. Conversely, where inequality
6
Care needs to be taken about interpretation of heights in
international comparison due to differences in intergenerational height
transmission and nutritional habits, which might not be directly related to
economic scarcities, at least in the short run. For example, the Dutch and
Scandinavians today still consume far more milk than Southern Italians
and Japanese, possibly a legacy of economic scarcity of the past.7 Even
within China, there exist regional differences with Northerners far taller
than people in the South. Nonetheless, with rapidly changing nutritional
and economic conditions, there has been a narrowing of regional
differences in heights as well as a convergence of Chinese heights to the
European and North American level more recently.8
For this research, we mobilize several large data sets of heights of
Chinese who migrated from South China to the United States, Australia
and Indonesia during the nineteenth and twentieth centuries, or who
worked in modern organisations in China. We believe that the reported
height trend and - with certain qualifications - their levels during the
nineteenth-twentieth century is likely to be a robust long-term indicator for
nutritional quality and ceteris paribus the living standards at least for the
southern Chinese. Below we explain our data sets in six different
categories. worsens average height might decline even in the presence of increasing GDP. See Steckel, 1995. 7Lactose intolerance, the inability to drink milk without diarrhoea, may have played a role in genetically predisposing some populations to shorter stature. East Asians, Native Americans and some African people suffer from lactose intolerance (see Mace et al. 2003). 8 In the early twentieth century the difference between north and south China was in the order of 6cm, compared with about 3cm in 2000 for populations of roughly the same socioeconomic status (Morgan, 2009, Table 7). Also, contemporary educated young male adults in Beijing are not much shorter than white American males. The average height of the birth cohort of 1978-81 in urban Northern China was 173.0 cm (ranged from 171.2 to 175.8 cm) for the pooled ages age 19-22 years, which is only 2.2 cm shorter than the United States average in the 1980s (175.8 cm); Beijing urban males were 175.5cm on average (China, Ministry of Education, 2002). Large-scale anthropometric surveys of children 7-22 years have been conducted in China since the late 1970s about every five years. Analysis of the 1979 to 1995 surveys and survey methodologies is reported in Morgan, 2000.
7
1. Immigrants to Indonesia. Baten and Hira (2008) made use of a
large data set of Chinese migrants to Indonesia originally
measured by the anthropologist Bernhard Hagen in the 1880s.
Most of the observations were made in 1885 and 1886, with some
perhaps in 1887.9 The occupations of the Chinese were described
as “mainly agricultural.” Fortunately, Hagen reported the ages so
that the approximate birth years can be calculated. Overall, Hagen
measured no less than 15,722 Chinese males who had migrated to
Indonesia. Our data set made use of !The Formula Not In Table
subjects, aged from 23 to 50 years. We discarded all those above
50 and below 23 years of age to exclude the effects of residual
growth in our data set. We also collected a much smaller data set
of migrants to Suriname (159 cases) for the birth-cohort of 1830-34
to 1845-49. As explained later, they reveal similar height features
to migrants to Indonesia.
2. Prisoners in the United States. Carson (2006) collected a sample
of 1,472 Chinese male immigrant workers who were incarcerated
in the United States mostly for petty crimes.
3. Prisoners in Australia. Morgan (2009) has compiled a data set of
1,492 Chinese imprisoned in Australia between the 1850s and
1920s, who were from South China and who were mostly born
between the 1810s and 1880s. Many arrived during the “Gold
Rush” period of the 1850s. When the alluvial gold petered out,
those who remained in Australia mostly turned to rural occupations
and were generally in a lower socioeconomic group to Chinese
migrants who arrived from the 1880s.
9 Murray (1994) found a citation to the study in another anthropological study of the 1920s, and we were able to locate the original text (in German) at the University Library Hamburg.
8
4. Migrants to Australia. In the later decades of the nineteenth
century another wave of Chinese migrants, also mainly from South
China, arrived in Australia. Somewhat different from the prisoners’
sample, they included many small merchants, market gardeners
and tradesmen who went to destinations such as Melbourne and
Sydney (Morgan, 2006a). Those who settled in northern Australia,
such as Queensland or the Northern Territory, were engaged in
mining and agriculture and they were more typical of the earlier
gold-rush period migrants; they were also shorter than those
residing in Melbourne or Sydney. The current dataset numbers
3,692 subjects.10
5. Migrants to the US. From the National Archives and Records
Administration (NARA) archive of the Pacific Region, we obtained
a small data set of heights (N=360) from the ship lists of Chinese
migrants to the US or returning to China. Moreover, this archive
also holds the National Archives microfilm publications of
passenger manifests for ships arriving at San Francisco, 1893-
1957. The manifests list the height and age of each passenger
from 1907 to 1948, and the same is true for most of the
immigration files.
6. Employees of Government Organisations in China. The last data
set discussed comes from government enterprises and agencies,
who measured their employees in the 1930s and 1940s as part of
a medical examination system. Most of them were born between
the 1890s and the 1920s, with some teenagers from the early
1930s (Morgan, 2004). The largest group was railway workers, but 10 The data are from the National Archives of Australia (NAA) series B13/0, B78/1, J2482, and E752/0, which comprise ‘Certificate Exempting from Dictation Test’ (CEDT) and a ‘Statutory Declaration’ for Chinese resident in Australia after 1901 who wish to leave Australia and return. Detailed description of these series can be obtained from the NAA online search facility at www.naa.gov.au and the use of the Australian immigration records for anthropometric research is discussed in Morgan, 2006b.
9
there were also employees of government, financial or other
institutions.
The region of birth is relatively homogenous: the south, and the
province Guangdong in particular.11 Only in the case of the government
employees (sample 6) was the regional spread larger, but we took care to
extract a series – unskilled railway workers from South China. We can
therefore assume that the estimates approximate trends in Southern
China.
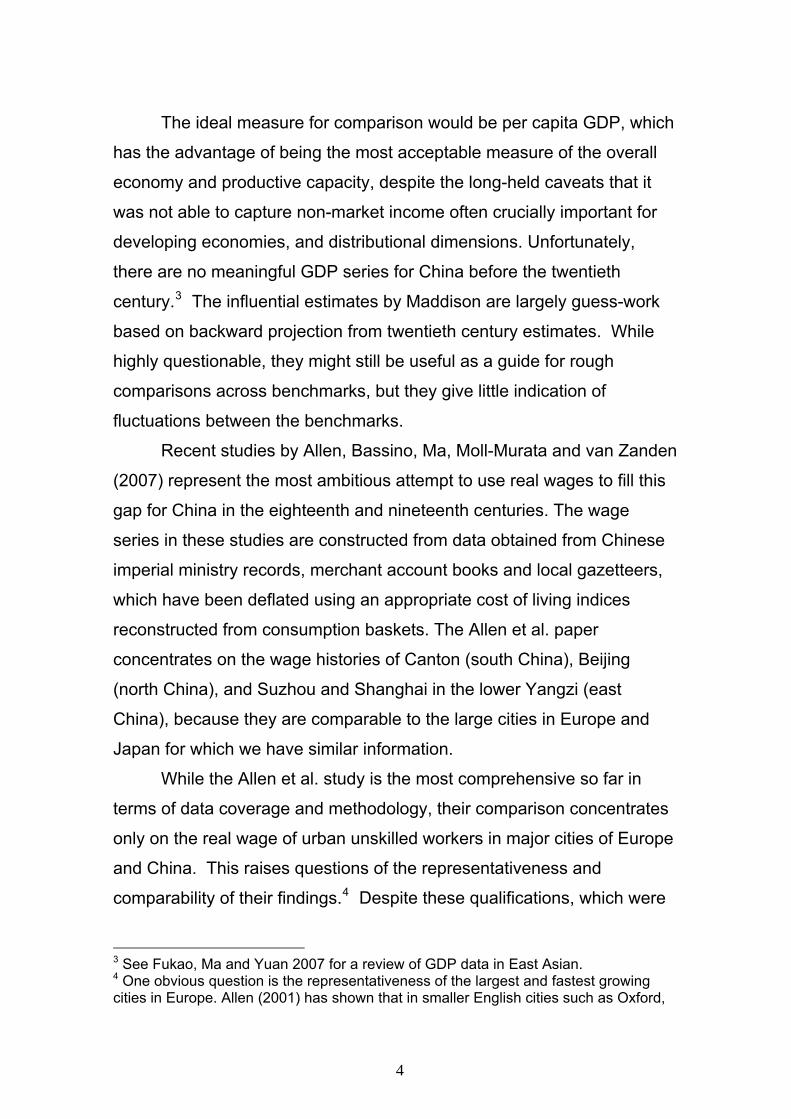
Insert Figure 2
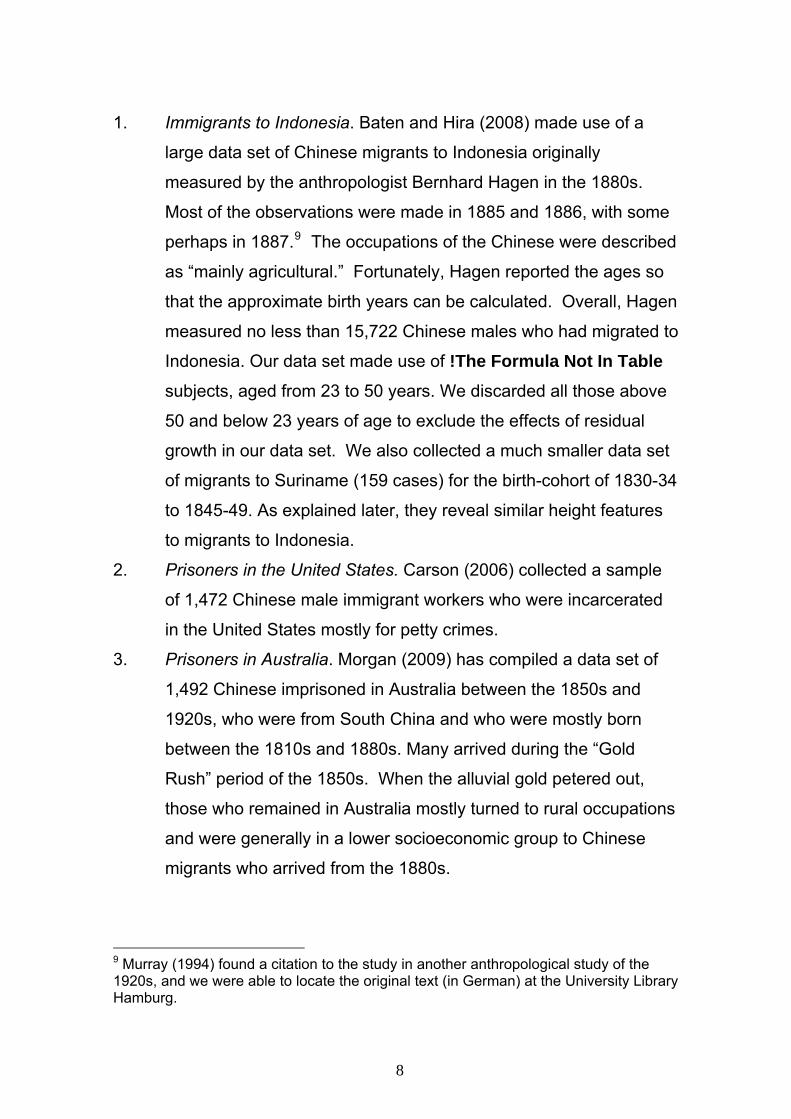
Figure 2 gives a plot of the trend level of different time series of
Chinese heights as described in the sample. Two features stand out.
Firstly, the shortest Chinese were those who went to Indonesia as
contract worker as well as those that went to Suriname.12 The heights of
prisoners in both Australia and the United States were the second
shortest. Clearly, among the tallest are the migrants to the US and
Australia. Interestingly, migrants to the Australian Northern territory were
shorter than those that resided in Melbourne and Queensland. Finally,
the railroad employee data set for South China had a slightly higher value
in the 1890s, but only by about half a centimetre.
We believe the observed differences in our samples seem a
reasonable reflection of the selectivity biases among the migrants who
comprise the samples used here. It is likely that those who went to more 11 All measured Chinese immigrants were reported to have come from the South (usually Canton) or simply “China.” Our statistical t-test reveals that the differences in mean heights for migrants identified as Canton or another place in South China and “China” groups as indistinguishable at the 1 per cent level. For the predominance of Guangdong and Fujian origin of overseas Chinese migrants in the nineteenth century, see Ge, Hou and Zhang 1999, pp. 191-201. 12 The Surinam sample not shown in the figure confirms a similar height levels with a clear downward trend from the 1840s, see Baten and Hira 2008.
10
attractive locations had to incur higher costs of migration and thus might
have been slightly positively selected. This might have been the case for
Chinese migrants to the United States and Australia, many of whom
funded their passage through debts securitised against property or other
family assets (summarised in Morgan, 2009). Finally, the relatively high
value of the unskilled railroad workers in South China can be explained
by the fact that these government employees were often regarded as a
kind of elite workers with literacy level higher than the average working
population (Morgan, 2004).
Secondly, despite this heterogeneity, we can discern clearly a
broad common trend among these different series. While the height trend
seems to have been stable up until the 1830-40s, all series started to
decline from the mid-nineteenth century, which coincided with the
devastating Taiping rebellion. Moreover, an unexpected finding is that
most of the series, following what seems like a stagnation – at best a mild
recovery – in heights during the 1860s and 1870s, reverts back into a
fairly substantial and sustained decline all the way into the 1880s and
even 1890s. This decline seems to have bottomed out towards the turn of
the last century with a rebound and recovery in the first two decades of
the twentieth century. The co-movement of these series is remarkably
consistent.
We believe that systematic selection biases in any one direction are
less likely as our data sets consist of large numbers of South Chinese
migrants who went to different locations in both developed and
developing regions with varying entry dates and measured by different
authorise.13 We also make a cross-check against the only independent
height series for non-overseas migrant available during the nineteenth
century: Chinese residents (largely of Cantonese and Fujianese origin) in
13 See figure 8 in Morgan 2006a for the year of arrival for some of Chinese immigrants in Australia.
11
Taiwan still under Qing rule (Kelly Olds 2003). Measured by Japanese
colonial authority in the early twentieth century, the height trend for male
and female reveal nearly identical patterns of decline from mid-nineteenth
century, followed a stagnation during the 1860s and 1870s and a
renewed and sustained decline in the 1880s and 1890s.14
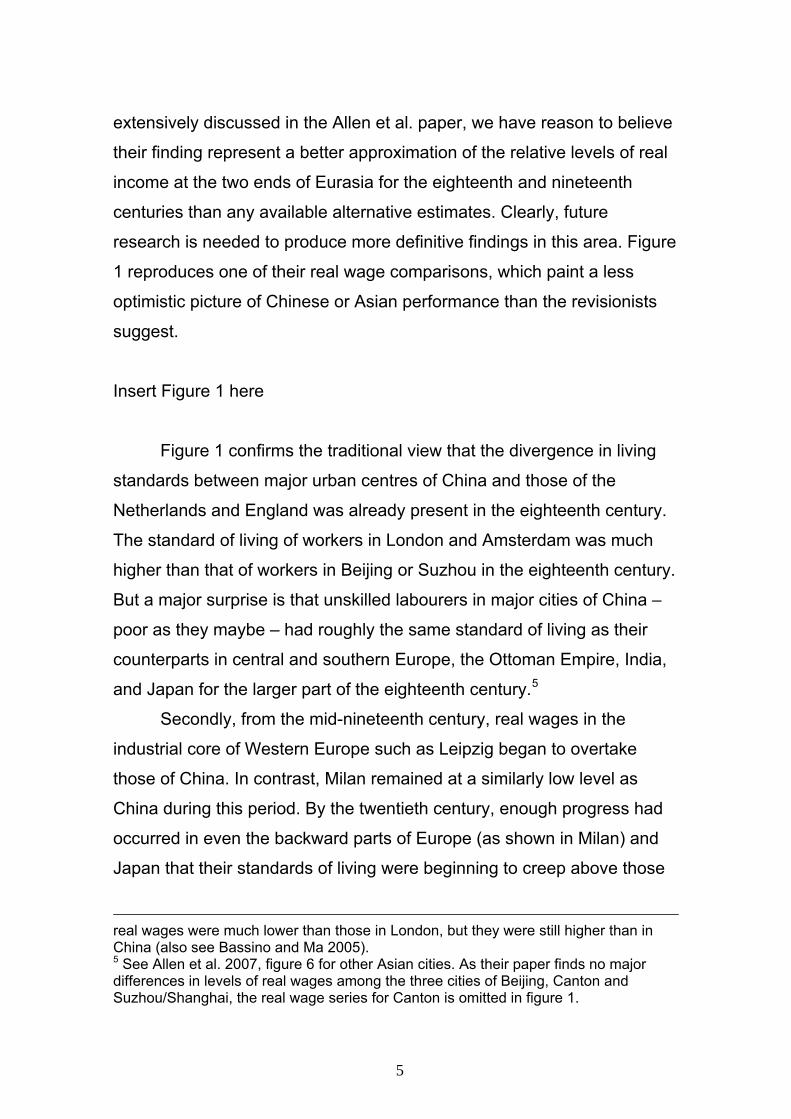
In Figure 3, we summarize these disparate sample series into a
single continuous but notional series that we believe as representative of
the height trend of the lower and working class Southern Chinese male in
1810-1920, but with sufficient human capital and wealth to move to
Australia. The series splices together the Australia prisoner series for
1810 to 1840 with the migrant series estimated for migrants in the
Northern Territory, whose occupation backgrounds is similar to the
prisoners, and the gap 1840-50 is filled by simple linear interpolation.15
We also plot this trend line against other height series for international
comparison. These series were adult males of broadly comparable social
class to our Southern Chinese series and regionally representative for
their country population as a whole (see Baten 2006).
Figure 3 clearly indicates that the northern Europeans
(Netherlands) were taller and became even taller after the mid-century.
The southern Europeans (Italy) were shorter than the Chinese with little
upward movement in stature until the 1860s, after which their heights
began to rise above the Southern Chinese. Figure 3 thus confirms the
so-called second divergence where both Dutch and Italian heights
starting an upward trend from the mid-nineteenth century following rapid
industrialization, while Chinese height stagnated or declined thereafter.16
14 See Kelly 2003, figures 2 and 3, which are partly reproduced later in figure 3 in this article. 15 The original series were estimated in decal units. Linear interpolation between the decal mid-points have been used to create a five-year series. 16 We can place our Southern Chinese height data in a larger sample of the heights in all European countries. An appendix to Baten (2006) presents the height estimates for all European countries with 500,000 and more inhabitants for the birth cohorts 1850,
12
Insert Figure 3 here
Perhaps more interesting is that the Southern Chinese seemed to
perform poorly in the East Asian context. As shown in the data, although
the Japanese started as unusually short, they managed to grow at a rate
of about 1.0 cm a decade from the late nineteenth century. More
strikingly, heights of Chinese in Taiwan (largely of South China origin) are
almost non-distinguishable both in trend and level during the nineteenth
century but grew rapidly from the early decades of Japanese colonialism
from the beginning of the twentieth century (Olds, 2003; Morgan and Liu,
2007). Overall, we see a case of China lagging behind the better
performers during the nineteenth-twentieth centuries.17
3. Age-Heaping
Recently, new research based on the use of age-heaping
measurement has made it possible to quantify numeracy in comparative
and long-term perspectives. This line of research was pioneered by
Mokyr (1983) in the modern economic history context, and by Duncan-
Jones (1990) for the study of ancient economies (after some earlier
1890, and 1920 (available from http://www.wiwi.unituebingen.de/cms/fileadmin/Uploads/Schulung/Schulung5/Paper/eurohgt.pdf accessed May 7th, 2009). In 1850, the Southern Chinese height of around 164 cm, is shorter than the average height of 168-169 cm in those European countries with tall inhabitants (Scandinavia, Ireland, some parts of later Yugoslavia) but surpasses the 160-162 cm average attained in those countries with short populations (Portugal, Spain, Italy). Overall, seven out of 36 countries or about one fifth of European countries had lower heights than those of Southern China. By 1890, however, all European countries except Portugal had shorter heights than Southern China, and by 1920, Southern China stood at the bottom of the European height distribution. 17 The unusually short level of Japanese heights in the nineteenth and twentieth centuries has been much noted and may be associated with a lack of protein in a largely vegetarian diet during the Tokugawa era when Japan was extremely isolated. Here our comparative analysis focuses on its trend only which is unequivocally from the 1880s.
13
demographic studies, see Bachi 1951). But only recently, Crayen and
Baten (2008) have compiled large international data sets that allow global
comparisons. The age-heaping strategy is based on the tendency of
poorly educated people in the past to round their age. For example, when
asked their age they answer more often “40”, when their actual age may
in fact be 39 or 41 years. Conversely, better educated people are more
likely to report their exact age. The age heaping index (also
called a Whipple index) is a measure of the concentration or degree of
age heaping between 23 and 62 years inclusive and is represented as
follows:
100* 5 aor 0 ages all ofnumber
ain ending ages ofnumber *5WI =
Therefore, an index equal to 100 indicates the absence of age-heaping
and magnitude of the index being above 100 indicates the degree of age-
heaping.
A wide range of research has confirmed a strong relationship
between illiteracy and age heaping especially for Less Developed
Countries (LDCs) after 1950. For example, a correlation coefficient of
0.63 has been found for a sample of about 270,000 individuals, organized
by 416 regions, ranging from Latin America to Oceania. The data from the
PISA (Programme for International Student Assessment) results for
numerical skills yielded an even higher correlation coefficient (A’Hearn,
Baten, Crayen 2009, Appendix). This correlation has also been confirmed
for the nineteenth century data (A’Hearn, Baten, Crayen 2009; Crayen
and Baten, 2008). Age-heaping index reflects numerical skills even more
than literacy skills, which could be more important for technical,
commercial and craftsmen activities than literacy.
The appeal of age heaping methods is the ready availability of age-
information for countries such as China where systematic sources of
14
historical numeracy or literacy information are largely absent. Before we
present our findings, it is important to clarify some specific issues related
to the use of age-heaping measures in the context of traditional China.
We perform a test to examine the linkage between literacy and numeracy
using an exceptional sample of Chinese migrants in the US, which
provide not only age information but also literacy (which includes both
Chinese as well as English reading and writing skills) and occupational
categories. This is a data set of 2,435 Chinese males in the United
States, 220 of which were US born. The data, extracted from the
Individual Public Use Microdata Set (IPUMS) data set of 1850-1910, are a
representative sample based on the US censuses. We exclude the
females (their number was too small for reliable analysis) before
calculating age heaping for those of the birth decades of the 1830s –
1880s.
For our purpose, we use the standard occupational classification
used by the US Census to create nine categories for the 2,435 Chinese
immigrants between 23 and 72. The occupations ranged from income
level of 600 dollars per year in 1950 prices (group 1) to between 1,500
and 2,000 (group 5), and to more than 2,500 (group 9). The distribution of
incomes was not linear, and some occupation accounted for a large share
of the Chinese population, so we took care that sufficient numbers of
observations fell in each group.
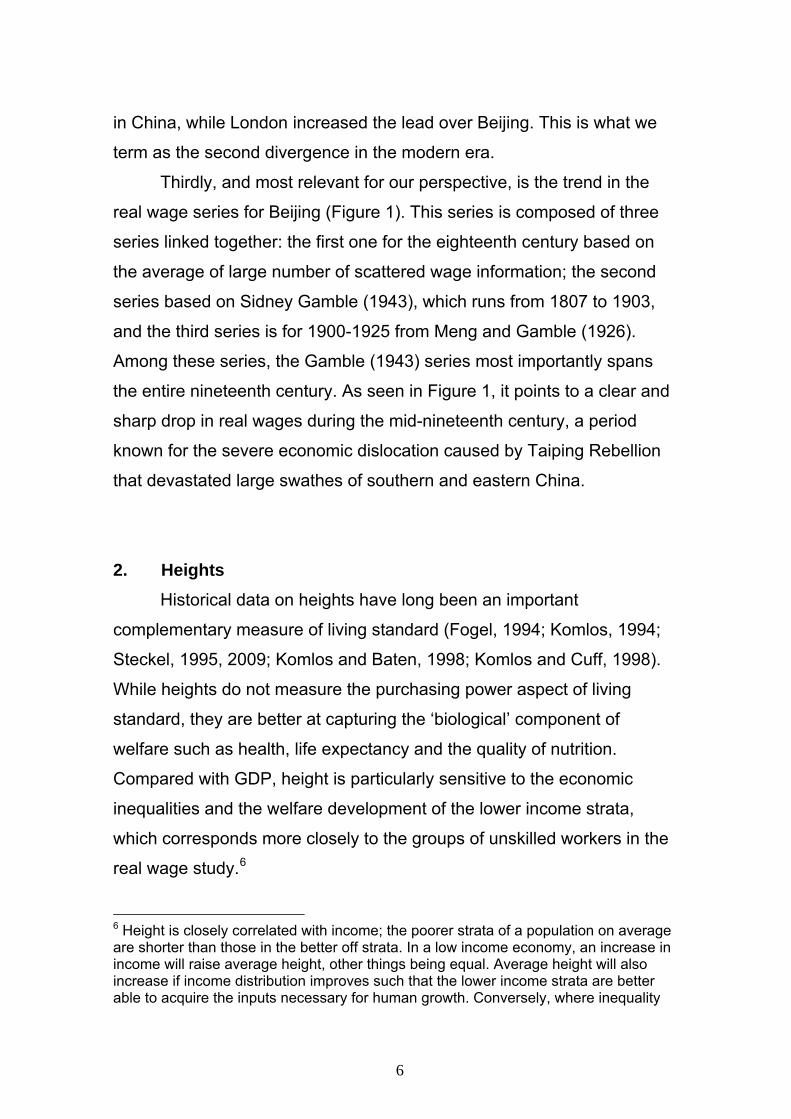
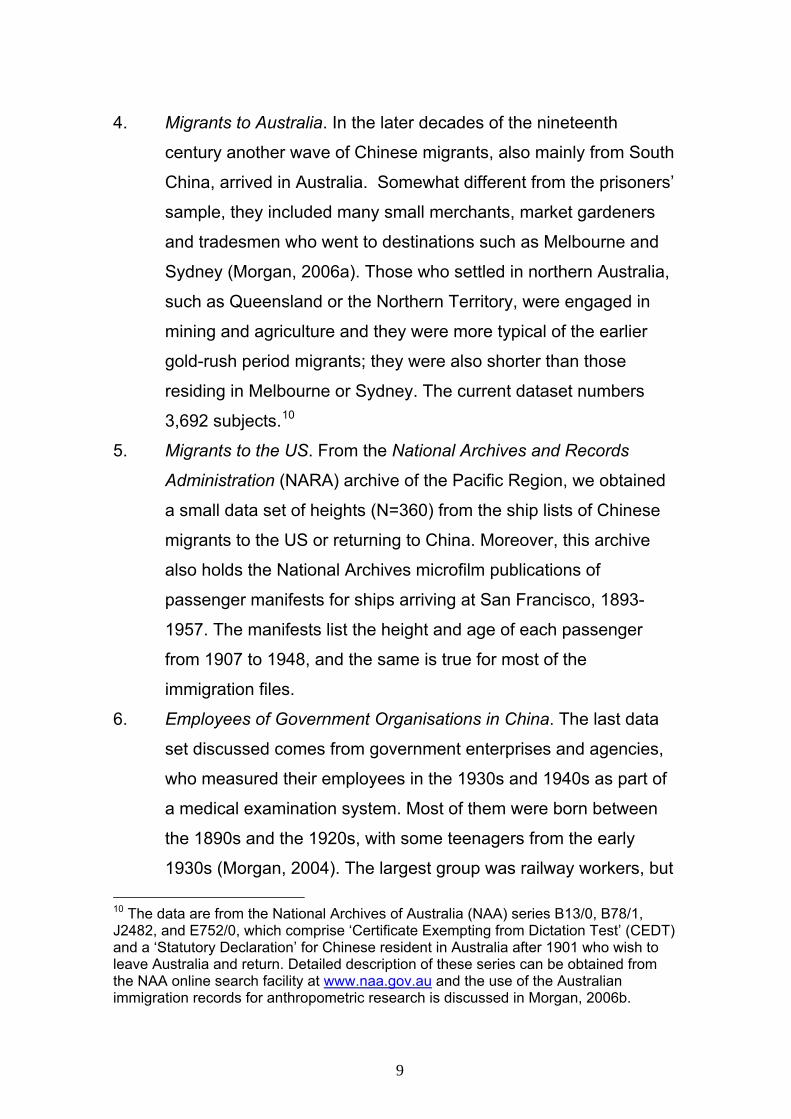
Figure 4 reveals a high negative relationship (with a correlation
coefficient of -0.8) between literacy rates and Whipple Index for these
nine occupation categories.18 More interestingly, this correlation seems
18 Without using the classification of occupational categories, we can also confirm this negative relationship with a logit regression which regresses a dummy variable of people who reported their ages in the multiples of 0s and 5s on a dummy variable of literacy. Our result shows that people who reported ages in 0s and 5s are 3% less likely to be literate than those who did not, which is statistical significant at 10% level. The small marginal effects (3%) are expected given that this is a fairly literate sample and that not all people who reported their ages in round numbers are illiterate and.
15
actually tighter than the correspondence between income categories and
literacy rates. While the higher income groups 7 to 9 has the highest
literacy rate, and the poorest group 1 has the lowest rate, occupation
categories 4 (mainly launderers) and 8 (mainly miners) or group 2
(domestic servants) in fact have similar levels of literacy rates. Thus, we
are reasonably assured that age-heaping index is good predicator for
literacy rates and human capital in China.19
Insert Figure 4
Below we describe six different data sets for our age-heaping
series:
1. The Qing archives of the Imperial Board of Punishment contain a
record of criminal cases of Chinese farmers and peasants involved
in various property crimes, rental conflicts, usury or domestic
conflicts during the late seventeenth and eighteenth centuries.
The court files as published covered a large number of Chinese
regions. Overall, we have 602 reported ages between 23 and 72,
which allows some point estimates for the late seventeenth and
early eighteenth century.20
2. The data file for immigrants to Indonesia is the same as those for
the height series.
19 We also checked whether the Chinese use of animal cycles for their birth years may lead to age-heaping of a different sort rather than on multiples of 5s or 0s. We checked the age-heaping around the dragon year of birth – the most popular and auspicious animal sign for a birth year – for Chinese migrants to the US and found they were far less marked than heaping on multiples of 5s. 20 The censorial section of the board of punishment (Xingke tiben) is an important archival source for a number of reasons, not only the age statements. The memorial documents contain information on land prices, land rents, interest rates (‘usury’), among other personal and household data, covering all Chinese administrative regions. A small part of these memorials, especially from the Qianlong period (1735-95) have been published (Historical Archive No. 1 1981). Allen et al. 2007 also made use of wage information from these sources. Ages we used in those sources only include self-reported ones by “criminals” still living at the time.
16
3. We collected a smaller data set of 193 Beijing Chinese soldiers
born in mid-nineteenth century. Although small in sample size, this
data set is particularly valuable as other nineteenth century data
consisted mostly of overseas migrants. The sources are from the
Qing archive and consisted of soldier lists from the Chinese army
(partially Manchu), which were taken by Chinese officers between
1902 and 1911.21
4. Two data series for Chinese immigrants to Australia are used to
estimate age heaping. The first is the same as the height series
discussed above for migrants to Melbourne, Brisbane and Darwin.
The second series is a recently compiled dataset of 8209 southern
Chinese immigrants who lived in Sydney or elsewhere in the state
of New South Wales in Australia located in ST84/1 series at the
NAA, Sydney Office. This series has only been used to estimate
age heaping and is independent of the first series used to report
heights.22
5. The data set of 2,435 Chinese males in the United States as
described earlier.
6. We use the first Chinese nationwide census undertaken in 1953 to
calculate whipple index for those born in the 1900s and 1910s, in
order to complement the eighteenth and nineteenth century data
with an endpoint in the early twentieth century.
21 The No.1 Historical Archive, Beijing, Shuntian Fu archive, microfilm reel no. 254. We thank Hans-Ulrich Vogel for helping with the access to this valuable source. 22 The Sydney ST84/1 series only contains the CEDT (also known as a Form 21) and does not include the Statutory Declaration (Form 22), which shows data related to occupations, residences, and other information useful for analysing height trend.
17
Figure 5 plots the Whipple indices of the different data series.23 The
late seventeenth and early eighteenth century data from the Board of
Punishment files reveal a rather modest level of age-heaping of about
110. It is important to note that most European countries reached such a
low level not before the late eighteenth century, whereas the early
eighteenth century levels of France and Germany were much higher (in
the range of 160-220).24 We do not have data for the period between the
early eighteenth century and the 1820s. But for series starting from the
1820s, the picture that emerged in figure 5 is that for almost all series of
age-heaping indices as organized by birth-decades rose and peaked
around the 1840s, with that of the US migrants rising to as high as 170-
190.25 A similar spike in age-heaping is also confirmed for the Beijing
soldiers in the period 1840-60, with a value at 150. But from the 1860s
(birth cohorts) onward, figure 5 reveals a huge improvement in age-
heaping almost across all the data series.26 By the early twentieth
23 For calculating age-heaping, we aggregate all age statements into the age groups such as 23-32, 33-42, and 53-62, and denote those born mostly in the 1850s as “1850” in the graph (even if this sometimes refers to those born actually 1847-56). This methodology is common in the age heaping literature to ensure that age heaping is estimated more conservatively than the obvious alternative to estimate age brackets 20-29, 30-39, 50-59 and so on. The problem with the alternative method is a strong age-heaping on, for example, age 50, in societies with low life expectancies leaving fewer survivors past age 53. Similarly, there will be more survivors at age 55 rather than age 59. Thus, taking age brackets 23-32 etc places the most strongly preferred age 30 and 25 to the middle of the distribution, hence minimizing this bias. 24 We also located a very small data set of about 50 seamen who found shelter in Japan during a storm. Their Whipple Index turned out to be as high as 213. The sample size is too small to be meaningfully included here. But it is plausible that levels of literacy and numeracy were very low among the class of seamen or pirates who were usually social outcasts barred, for example, from taking part in the Civil-Service Examination system, see Wakemen Jr. 1966, chapter 1. Data on Chinese seamen are from Ryūkyū ōkoku hyōjōsho monjo henshū iinkai, 1988. 25 For the US migrant sample, age is relatively constant at 30-36 (except for the middle cohort of those born in the 1860s, with an average age of 41), so we believe that our result is not biased by possible differences in the age composition of the various samples. 26 Although not sufficient in numbers, we also calculated the level of United States born Chinese for the 1870s and 1880s. Interestingly, their age heaping is not lower than those Chinese born, but rather higher, with values of 167 of those born in the 1870s, and 136 in the 1880s.
18
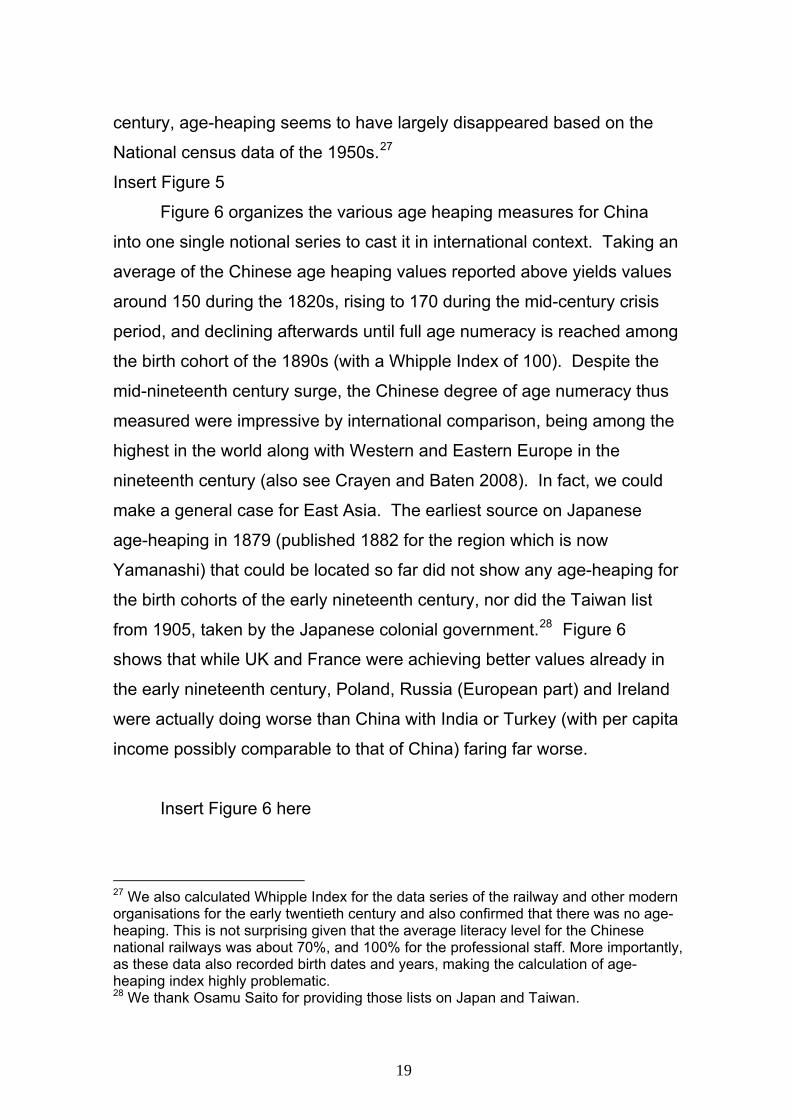
century, age-heaping seems to have largely disappeared based on the
National census data of the 1950s.27
Insert Figure 5
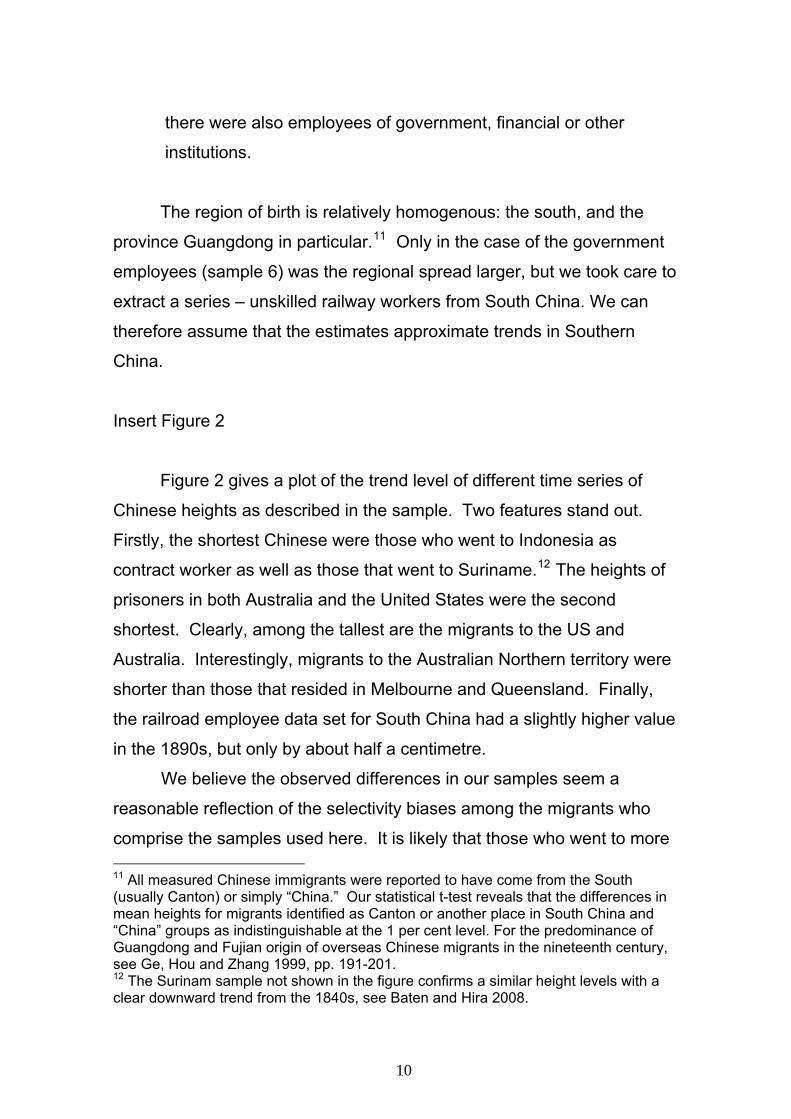
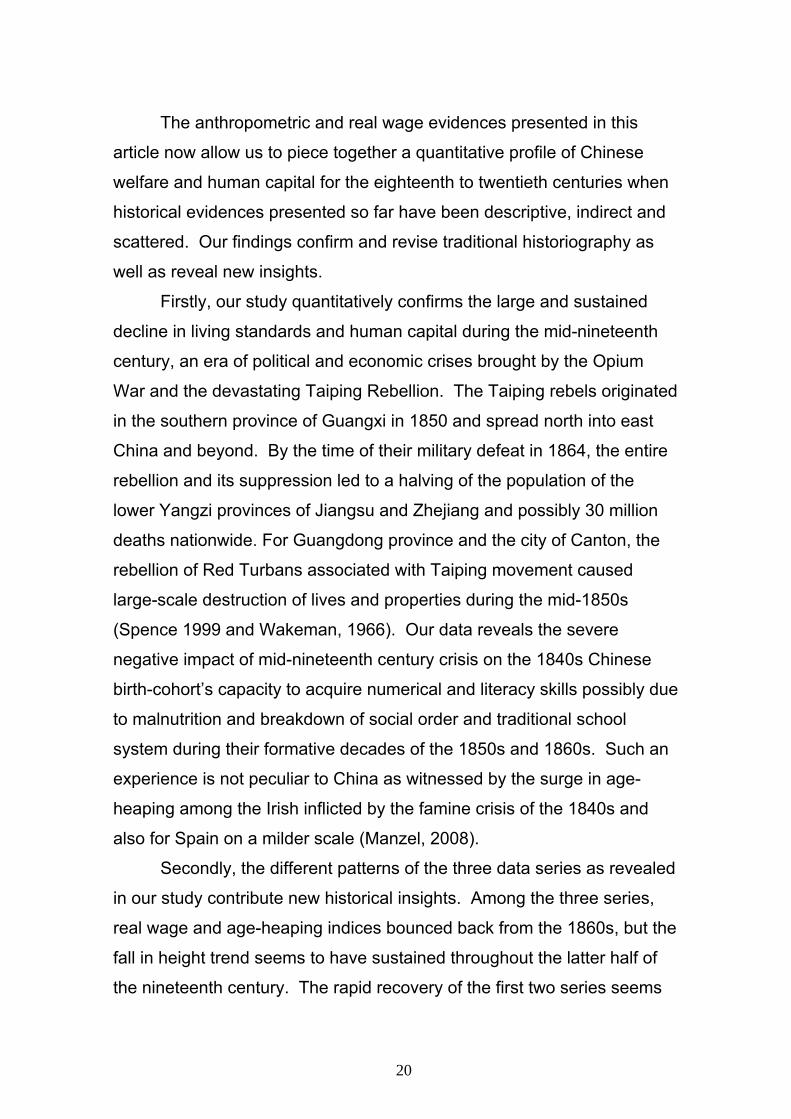
Figure 6 organizes the various age heaping measures for China
into one single notional series to cast it in international context. Taking an
average of the Chinese age heaping values reported above yields values
around 150 during the 1820s, rising to 170 during the mid-century crisis
period, and declining afterwards until full age numeracy is reached among
the birth cohort of the 1890s (with a Whipple Index of 100). Despite the
mid-nineteenth century surge, the Chinese degree of age numeracy thus
measured were impressive by international comparison, being among the
highest in the world along with Western and Eastern Europe in the
nineteenth century (also see Crayen and Baten 2008). In fact, we could
make a general case for East Asia. The earliest source on Japanese
age-heaping in 1879 (published 1882 for the region which is now
Yamanashi) that could be located so far did not show any age-heaping for
the birth cohorts of the early nineteenth century, nor did the Taiwan list
from 1905, taken by the Japanese colonial government.28 Figure 6
shows that while UK and France were achieving better values already
the early nineteenth century, Poland, Russia (European part) and Irela
were actually doing worse than China with India or Turkey (with per capita
income possibly comparable to that of China) faring far worse.
in
nd
Insert Figure 6 here
27 We also calculated Whipple Index for the data series of the railway and other modern organisations for the early twentieth century and also confirmed that there was no age-heaping. This is not surprising given that the average literacy level for the Chinese national railways was about 70%, and 100% for the professional staff. More importantly, as these data also recorded birth dates and years, making the calculation of age-heaping index highly problematic. 28 We thank Osamu Saito for providing those lists on Japan and Taiwan.
19
The anthropometric and real wage evidences presented in this
article now allow us to piece together a quantitative profile of Chinese
welfare and human capital for the eighteenth to twentieth centuries when
historical evidences presented so far have been descriptive, indirect and
scattered. Our findings confirm and revise traditional historiography as
well as reveal new insights.
Firstly, our study quantitatively confirms the large and sustained
decline in living standards and human capital during the mid-nineteenth
century, an era of political and economic crises brought by the Opium
War and the devastating Taiping Rebellion. The Taiping rebels originated
in the southern province of Guangxi in 1850 and spread north into east
China and beyond. By the time of their military defeat in 1864, the entire
rebellion and its suppression led to a halving of the population of the
lower Yangzi provinces of Jiangsu and Zhejiang and possibly 30 million
deaths nationwide. For Guangdong province and the city of Canton, the
rebellion of Red Turbans associated with Taiping movement caused
large-scale destruction of lives and properties during the mid-1850s
(Spence 1999 and Wakeman, 1966). Our data reveals the severe
negative impact of mid-nineteenth century crisis on the 1840s Chinese
birth-cohort’s capacity to acquire numerical and literacy skills possibly due
to malnutrition and breakdown of social order and traditional school
system during their formative decades of the 1850s and 1860s. Such an
experience is not peculiar to China as witnessed by the surge in age-
heaping among the Irish inflicted by the famine crisis of the 1840s and
also for Spain on a milder scale (Manzel, 2008).
Secondly, the different patterns of the three data series as revealed
in our study contribute new historical insights. Among the three series,
real wage and age-heaping indices bounced back from the 1860s, but the
fall in height trend seems to have sustained throughout the latter half of
the nineteenth century. The rapid recovery of the first two series seems
20
to confirm the traditional historiography that emphasized the relative
success of the so-called 1862-1874 Tong-Zhi restoration in returning the
post-Taiping China to peace and normalcy (Wright, 1962). A hallmark of
the Restoration was the rejuvenation of traditional governmental
bureaucracy as severely compromised by the massive sale of official
titles in the war era for revenue purpose and reinstatement of the
millennium-old national Civil Service Examination system as suspended
during the War era (Wright, 1962, chapter 5). It is likely that these
policies have restructured incentives for human capital accumulation and
contributed to the drastic improvement in age-heaping indices.
The somewhat surprising finding of a sustained decline in heights
into the 1880s and 1890s seems to stand in contrast to the rapid recovery
of age-heaping (and the real wage series) in the post-Taiping Rebellion
era. While it is plausible this decline may be more region-specific to
South China (including Taiwan) with Canton losing her eminent trading
port status to Shanghai or other treaty ports in the post-Opium War era,
we believe that our empirical finding merits serious future academic
research, which may well lead to a more pessimistic profile of living
standards during the latter half of the nineteenth century. 29 In fact,
despite the high-profile attempts to modernize her military and other
limited industrial sectors, the general outlook and policy of Qing under the
so-called late nineteenth century self-strengthening movement remained
conservative, especially in contrast to contemporaneous Meiji Japan. Not
only did they resist any fundamental institutional reform, but also
obstructed the construction of modern infrastructures such as railroads.
Modern public infrastructures constructed mostly after the twentieth
century, as emphasized recently by Ge, Hou and Zhang (1999), would
29 For regional differences in height trend in the first three decades of the twentieth century, see Morgan 2004).
21
have allowed effective relief efforts to avert the kind of massive human
and material losses incurred by disaster and famine in the latter half of
the nineteenth century.30 In this context, the recovery in heights from the
beginning of the twentieth century – an era marked by the imminent
dynastic collapse and national disintegration – does not come as total
surprise. Recent scholarship has emphatically shown that the first three
decades of the twentieth century – despite the political and civil strife –
were marked by the onset of a region-based spurt of industrialization and
modernization (Rawski 1989, Ma 2008).
4. Conclusion: Towards an Integrated Narrative of Living Standards and Human Capital By placing our new time series data in an international context, our
article reveals a rather intriguing combination of relatively low living
standards with high human capital in traditional China. While our finding
of a relatively low standard of living counters the argument of recent
revisionism, the case for a relatively high level of human capital seems to
echo other historical studies. For example, Ronald P. Dore’s landmark
study in 1965 offered a remarkably optimistic reassessment of Japanese 30 Ge, Hou and Zhang, 1999, noted the importance of modern health facilities and public infrastructure in the early twentieth century for disaster and famine relief. For wars and disasters occurring during the period of 1870-1890, see Cao 2001, chapters 13-15, on the prolonged Muslim rebellions in South- and North-western parts of China and severe drought leading to famine in five provinces of Northern China in the late 1870s which claimed tens of millions of lives. Finally, cross-national factors could be at work as well: waves of rinderpest (cattle plagues) seemed to have swept across parts of Asia and Africa where we observed similar decline in heights in the 1880s and 1890s period (Spinage, 2003). Rinderpest was enzootic to hooved animals in China’s central plains and the Mongolian steppes. Its presence was first observed in outbreaks in Hong Kong and Shanghai in the 1860-70s, and transmitted to Japan through imported cattle with epizootic effect, though there were earlier suspected outbreaks (Spinage, 2003; MacPherson, 1987; Kishi, 1976). A foreign medical missionary described rinderpest as having a more debilitating affect on Chinese agriculture than floods and drought by depriving them of ox and buffalo for ploughing fields and pumping water, which could reduce grain yield (Bliss, 1922, cited in Spinage, 2003).
22
education in the Tokugawa period (1603-1868). The school enrolment
data in 1868 led him to conclude something like 43% literacy rate for male
and 19% for girls, a remarkably high level by early modern standards
(Hayami and Kito, 2004). Other studies have also pointed to the existence
of a dynamic book publishing industry and book rental market as well as
near ubiquitous presence of book-keeping and accounting practise
among business and domestic households, and the widespread use of
farm manuals (Hayami and Kito, 2004; Smith, 1988).
Evelyn Rawski’s 1979 study in many ways echoed the Japanese
assessment for the case of China. Based on admittedly fragmentary and
circumstantial evidence, Rawski put the basic literacy level of Chinese
males at 30 to 45% and females at 2 to 10 percent for China as a whole
(Rawski, 1979, p.22-23). According to her, both opportunities for
education and schooling had expanded during the Ming (1368-1644) and
Qing (1648-1911) period. More importantly, education went way beyond
the elites in preparation for the prestigious civil service examinations and
spilled over to a wide spectrum of the society to fulfil demand for
commerce, local administration or even agricultural production (Rawski,
1979, chapter 1, Li Bozhong, 2003). In comparison with Japan, Rawski
argued that “if a stratified, status-fixed society such as Japan’s
experienced this great demand for basic skills in reading, writing, and
arithmetic among townsmen and farmers (in the Tokugawa period), a
relatively open society such as China’s, where education was the key to
upward social mobility, should have stimulated a similar if not greater
effective demand for literacy” (p. 5). In other studies, both Rawski (1985)
and Li (2003) detailed the development of a thriving private and
commercial publishing industry to satisfy the demand of a large reading
public forged by the homogeneity of the Chinese written character. Book
publishing was highly differentiated, from scholarly encyclopaedias,
histories and philosophical treatises to morality plays, romance novels,
23
Buddhist sutra and primers for all sorts of trades. In addition, cities and
towns “had an abundance of posted regulations, shops signs,
advertisements, and other material to read for profit and amusement”
(Naquin and Rawski, 1987, p.p 58-9) and publishing was further aided by
the relatively low cost of paper and Chinese style of woodblock printing
(Rawski, 1985).
Besides literacy, scholars have also presented direct historical
evidence of numeracy. Li (2003), in particular, noted the widespread
diffusion of popular arithmetic textbooks, the spread of abacus, and the
adoption of various special numerals for book-keeping and accounting
during the late Ming and Qing. A series of new research have now begun
to utilize long-ignored surviving account books, which meticulously
recorded transactions and various summary accounts with sophisticated
traditional accounting techniques (Gao 1982 and 1988, Gardella, 1992,
for China; Jun and Lewis, 2006, for Korea). The important role of a lunar
calendar in daily lives and in fact, the whole numerology and number-
mysticism, for whatever its dubious claim to prediction, predisposed
Chinese thinking to a numerical framework for scientific inquiry (Ronan
and Needham, 1978).
In fact, the combination of high human capital and low income level
is not merely a historical phenomenon. Drawing on the results of
standardized international tests, Hanushek and Woessman (2008) show
that the average test scores of Chinese students today ranked among the
top end of those from OECD countries whose per capita income are
several fold higher than in China. Further research should explore the
possible historical root of this relatively high level of human capital
accumulation, in particular its linkage with long-lasting institutions in
traditional China, such as a relatively open Civil-Service Examination, a
unified written character and a precocious government bureaucracy. The
rise of an independent small-holding peasantry under this institutional
24
framework turned each household into a self-contained producing and
marketing unit in direct interaction with both the market and state (for
taxation).
It is important to note that these institutional features in traditional
China had been largely designed for social control and discipline for an
agrarian empire. But its unintended legacy - a relatively large reservoir of
human capital in early modern China and East Asia - may have facilitated
their rapid economic catch-up of in the modern era once required
institutional and ideological changes were accomplished. In fact, the lags
and differential pace of economic catch-up within East Asia over the past
two centuries may well be an outcome of the differential timing of the
institutional and ideological change. This intricate relationship between
human capital and institutions for China and East Asia is a confirmation of
recent theoretical empirical insights as expounded in Glaeser et al.
(2004). It serves as a fresh reminder that by focusing exclusively on the
comparison of national income per capita, we may be missing the most
crucial and essential factor that accounts for both the early modern great
divergence and the recent convergence between the two ends of Eurasia.
25
References:
A’Hearn, B., 2003. Anthropometric evidence on living standards in
northern Italy, 1730-1860. Journal of Economic History 63, 351-81.
A’Hearn, B., Baten, J., Crayen, D., 2009. “Quantifying Quantitative
Literacy: Age Heaping and the History of Human Capital” Journal of
Economic History (forthcoming).
Allen, R. C., 2001. “The Great Divergence in European Wages and Prices
from the Middle Ages to the First World War.” Explorations in
Economic History, 38, 411-447.
Allen, R. C., Bassino, J-P., Ma, D., Moll-Murata, C., van Zanden, J.L.,
2007. “Wages, Prices and Living Standards in China, Japan and
Europe”, Global Prices and Income Project,
http://gpih.ucdavis.edu/Papers.htm.
Allen, R. C., Bassino, J-P., Ma, D., Moll-Murata, C., van Zanden, J.L.,
2008. “Wages, Prices, and Living Standards in China, 1738-1925:
in Comparison with Europe, Japan and India” Unpublished paper:
http://personal.lse.ac.uk/mad1/
Bachi, R., 1951. “The tendency to round off age returns: measurement
and correction”. Bulletin of the International Statistical Institute 33,
195-221.
Bassino, J-P., Ma, D., 2005. “Wages and Living Standards of Japanese
Unskilled Laborers in 1720-1913: an International Comparison”,
Research in Economic History. 23, Chapter 7.
Bassino, J-P., 2006. “Inequality in Japan (1892-1941). Physical Stature,
Income and Health”, Economics and Human Biology 4 (1), 62-88.
Baten, J., 2006. Global Height Trends in Industrial and Developing
Countries, 1810-1984: An Overview. Working Paper, Tuebingen.
Baten, J., Hira, S., 2008. “Anthropometric Trends in Southern China,
1830-1864”, Australian Economic History Review 48 (3), 209-226.
26
Bliss, E. 1922. Rinderpest and its prevention. China Medical Journal, 36,
153-170 (cited in Spinage, 2003).
Cao, S. 2000. Zhongguo Renkou Shi (Population History of China) Vol. 5,
Qing shiqi (Qing Period). Fudan University Press, Shanghai.
China, Ministry of Education, et.al. 2002. 2000-nian Zhongguo xuesheng
tizhi yu jiankang diaoyan baogao (Report on the physical fitness
and health surveillance of Chinese school students, 2000),
Gaodeng jiaoyu chubanshe, Beijing.
Crayen, D., Baten, J., 2009. “Numeracy, Inequality, Age Heaping, and
Economic Growth: New Estimation Strategies for Western Europe
and the U.S. (17th - 19th centuries)” Economic History Review
(forthcoming).
Crayen, D., Baten, J. 2008. “Global Trends in Numeracy 1820-1949 and
its Implications for Long-Run Growth”, Working Paper Tuebingen.
Dore, R. P., 1965. Education in Tokugawa Japan. Routledge & Kegan
Paul, London.
Duncan-Jones, R., 1990. Structure and Scale in the Roman Economy.
Cambridge University Press, Cambridge.
Fogel, R.W., 1994. Economic Growth, Population theory, and Physiology:
The Bearing of Long-term Processes on the Making of Economic
Policy. American Economic Review 84 (3), 369-394.
Fukao, K., Ma, D., Yuan, T., 2007. “Real GDP in pre-War East Asia: a
1934-36 Benchmark Purchasing Power Parity Comparison with the
U.S.” Review of Income and Wealth 53 (3), pps xx-yy?.
Gamble, S. D., 1943. “Daily Wages of Unskilled Chinese Laborers, 1807-
1902.” The Far Eastern Quarterly 3 (1), 41-73.
Gardella, R., 1992. “Squaring Accounts: Commercial Bookkeeping
Methods and Capitalist Rationalism in Late Qing and Republican
China.” The Journal of Asian Studies 51 (2), 317-39.
27
Ge, J. X., Hou, Y. F., Zhang, G. F., 1999. Renkou yu Zhongguo de
Xiandaihua (Population and Modernization of China). Xuelin Press,
Shanghai.
Glaeser, E. R., La Porta, F. Lopez-de-Silanes, Shleifer, A., 2004. “Do
Institutions Cause Growth”, Journal of Economic Growth 9 (3), 271-
303.
Godo, Y., Hayami, Y., 2002. “Catching Up in Education in the Economic
Catch-up of Japan with the United States, 1890–1990,” Economic
Development and Cultural Change, 50(4), 961–78.
Godo, Y., 2006. “The Role of Education in the Economic Catch-up:
Comparative Growth Experience from Japan, Korea, Taiwan, and
the United States. Unpublished paper.
Guo, D., 1982. Zhongguo kuaiji shigao (A Draft History of Chinese
Accounting) Vol. 1,Wuhan: Chinese Finance and Economic Press
1982.
Guo, D., 1988, Zhongguo kuaiji shigao (A Draft History of Chinese
Accounting) Vol.2: Beijing: Chinese Finance and Economic Press.
1988.
Hanushek, E., Woessmann, L., 2008. “The Role of Cognitive Skill in
Economic Development” Journal of Economic Literature 46 (3),
607-668.
Hayami, A., Kito, H., 2004. “Demography and Living Standards”. In:
Hayami, a., Saito, o., Toby, R. P. (Eds.), Emergence of economic
society in Japan, 1600-1859 – The economic history of Japan:
1600-1990, vol. 1, Oxford University Press, Oxford. pp. 211-246.
Historical Archive No. 1 and History Institute of the Chinese Academy of
Social Sciences (eds.), 1982. Qingdai dizu boxue xingtai (The
Forms of Exploitation of Land Rent during the Qing). 2. vols.
Zhonghua shuju, Beijing.
28
Jun, S.H., Lewis, J. B., 2006. “Accounting Techniques in Korea: 18th-
century Archival Samples from a Non-Profit Association in the
Sinitic World.” Accounting Historians Journals 33 (1), 53-87.
Kishi, H. 1976. A historical study of the outbreaks of rinderpest during the
Yedo era in Japan. Yamaguchi Journal of Veterinary Medicine, 3,
33-40.
Komlos, J. (Ed.), 1994. Stature, Living Standards and Economic
Development: Essays in Anthropometric History. University of
Chicago Press, Chicago
Komlos, J., Baten, J. (Eds.), 1998. Studies on the Biological Standard of
Living in Comparative Perspective. Franz Steiner Verlag, Stuttgart.
Komlos, J., Cuff, T. (Eds.), 1998. Classics in Anthropometric History – A
Selected Anthology. Scripta Mercaturae Verlag, St. Katharinen.
Krugman, P., 1994. “The Myth of Asia’s Miracle”. Foreign Affairs 73(6),
Nov/Dec, 62-79.
Lee, J., and Wang, F., 1999. One Quarter of Humanity: Malthusian
Mythology and Chinese Realities, 1700-2000. Harvard University
Press, Cambridge.
Li, B., 1998. Agricultural development in Jiangnan, 1620-1850. St.
Martin’s Press, New York.
Li, B., 2003. “Bagu zhi wai: Ming Qing Jingnan de jiaoyu ji qi dui jingji de
yingxiang” (Beyond the Eight-Legged Essay: Education and its
impact on Jiangnan Economy in Ming and Qing). Qing shi yanjiu
(Research in Qing History), 4, pp xx-yyy?
Ma, D., 2004. “Growth, Institutions and Knowledge: A Review and
Reflection on the Historiography of 18th-20th Century China”,
Australian Economic History Review 44 (3), 259-77.
Ma, D., 2008. “Economic Growth in the Lower Yangzi Region of China in
1911-1937: A Quantitative and Historical Perspective”. The Journal
of Economic History, 68 (2), 385-392.
29
Mace, R. et al., 2003. “Testing Evolutionary Hypotheses about Human
Biological Adaption Using Cross-Cultural Comparison.”
Comparative Biochemistry and Physiology, Part A 136:85-94.
MacPherson, K. L. 1987. A wilderness of marshes: The origins of public
health in Shanghai, 1843-1893. Oxford University Press, Hong
Kong.
Manzel, K., 2008, “Subsistence Crises, Education and Economic
Development: the Impact of Subsistence Crises on Human Capital
Formation”. Working Paper Univ. Tuebingen.
Meng, T. P., Gamble, S. D., 1926. “Wages, Prices, and the Standard of
Living in Peking, 1900-1924.” The Chinese Social and Political
Science Review, 20, 1-113.
Mokyr, J. 1983, Why Ireland starved: A quantitative and analytical history
of the Irish economy, 1800-1850. Allen & Unwin, London.
Morgan, S. L. 2000. “Richer and Taller – Stature and the Standard of
Living in China, 1979-1995”, The China Journal, 44, 1-39.
Morgan, S. L., 2004. “Economic Growth and the Biological Standard of
Living in China, 1880–1930.” Economics and Human Biology 2 (2),
197–218.
Morgan, S. L., 2006a, “The Biological Standard of Living in South China
during the 19th century: Estimates Using Data from Australian
Immigration and Prison Records.” Asia-Pacific Economic and
Business History Conference, Queensland University of
Technology, Brisbane, 16-18 February. Available from:
http://www.uow.edu.au/commerce/econ/ehsanz/pdfs/Morgan1.pdf
Morgan, S. L., 2006b. “Australian Immigration Archives as Sources for
Business and Economic History”, Australian Economic History
Review, 46 (3), 268-82.
30
Morgan, S. L., 2009. “Stature and Economic Growth in China during the
Nineteenth Centrury.” Explorations in Economic History 46 (1), 53-
69.
Morgan, S.L., Liu, S.Y., 2007. Was Japanese colonialism good for the
welfare of the Taiwanese? Stature and the standard of living. China
Quarterly 192, 990-1017.
Murray, J.E. 1994. Stature and Body-Mass Index among Mid-Nineteenth
Century South Chinese Immigrants. Annals of Human Biology, 21
(6), 617-20.
Naquin, S., Rawski, E.S., 1987. Chinese society in the eighteenth
century. Yale University Press, New Haven.
Olds, K., 2003. The Biological Standard of Living in Taiwan under
Japanese Occupation. Economic and Human Biology 1 (2), 187-
206.
Pomeranz, K., 2000. The Great Divergence. Princeton University Press,
Princeton.
Rawski, E.S., 1979. Education and Popular Literacy. The University of
Michigan Press, Ann Arbor.
Rawski, E.S., 1985 “Economy and Social Foundation of Late Imperial
Culture.” In: Johnson, D., Nathan, A. J., Rawski, E. S. (Eds.),
Popular culture in late imperial China. University of California Press,
Berkeley, pp. xx-yy?.
Rawski, T. G., 1989. Economic Growth in PreWar China. University of
California Press, Berkeley.
Ronan, C.A., Needham, J., 1978. The Shorter Science and Civilisation in
China: An Abridgement of Joseph Needham’s Original Text. Vol 1.
Cambridge University Press, Cambridge.
Ryūkyū ōkoku hyōjōsho monjo henshū iinkai (Ed.), 1988. Ryūkyū ōkoku
hyōjōsho monjo Minami nishi insatsu, Naha.
31
Shay, T., 1994. “The level of Living in Japan, 1885-1938: New Evidence”.
In: Komlos, J. (Ed.) Stature, Living Standards, and Economic
Development: Essays in Anthropometric History. The University of
Chicago Press, Chicago.
Smith, T. C., 1988. Native sources of Japanese industrialization, 1750-
1920. University of California Press, Berkeley.
Spence, J. D. (1999) The Search for Modern China 2nd ed. W.W.
Norton, New York.
Spinage, C.A. 2003. Cattle Plague: A History. Kluwer Academic, New
York/Dordrecht.
Steckel, R. H., 1995. Stature and the Standard of Living. Journal of
Economic Literature XXXIII, 1903-1940.
Steckel, R. H., 2009. “Height and human development: Recent
developments and new directions.” Explorations in Economic
History 46 (1), 1-23.
Steckel, R. H., Floud, R., 1997. “Conclusions.” In: Steckel, R., Floud, R.
(Eds.), Health and Welfare during Industrialization. University of
Chicago Press, Chicago, pp. 423-449.
Sugihara, K. 2007. “The Second Noel Butlin Lecture: Labour-intensive
Industrialisation in Global History”, Australian Economic History
Review 47(2), 121-54
van der Eng, P., 1995. “An Inventory of Secular Changes in Human
Growth in Indonesia”. In: Komlos, J. (Ed.), The Biological Standard
of Living on Three Continents: Further Explorations in
Anthropometric History. Westview Press, Boulder, pp. 175-188.
Wakeman, F. E., 1997 (1966). Strangers at the Gate: Social disorder in
South China, 1839-1861. University of California Press, Berkeley.
Wright, M. C., (1962) The Last Stand of Chinese Conservatism: the
T’ung-Chih Restoration 1862-1874. Stanford University Press, Stanford.
32
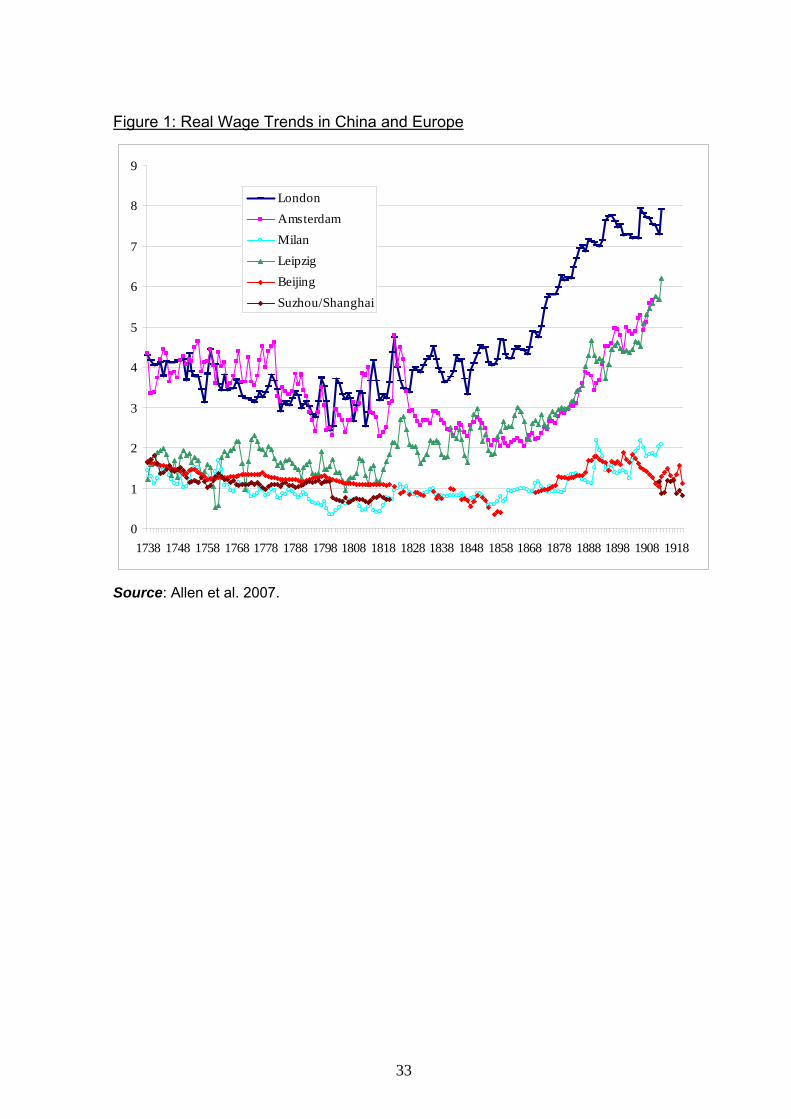
Figure 1: Real Wage Trends in China and Europe
0
1
2
3
4
5
6
7
8
9
1738 1748 1758 1768 1778 1788 1798 1808 1818 1828 1838 1848 1858 1868 1878 1888 1898 1908 1918
LondonAmsterdamMilanLeipzigBeijingSuzhou/Shanghai
Source: Allen et al. 2007.
33
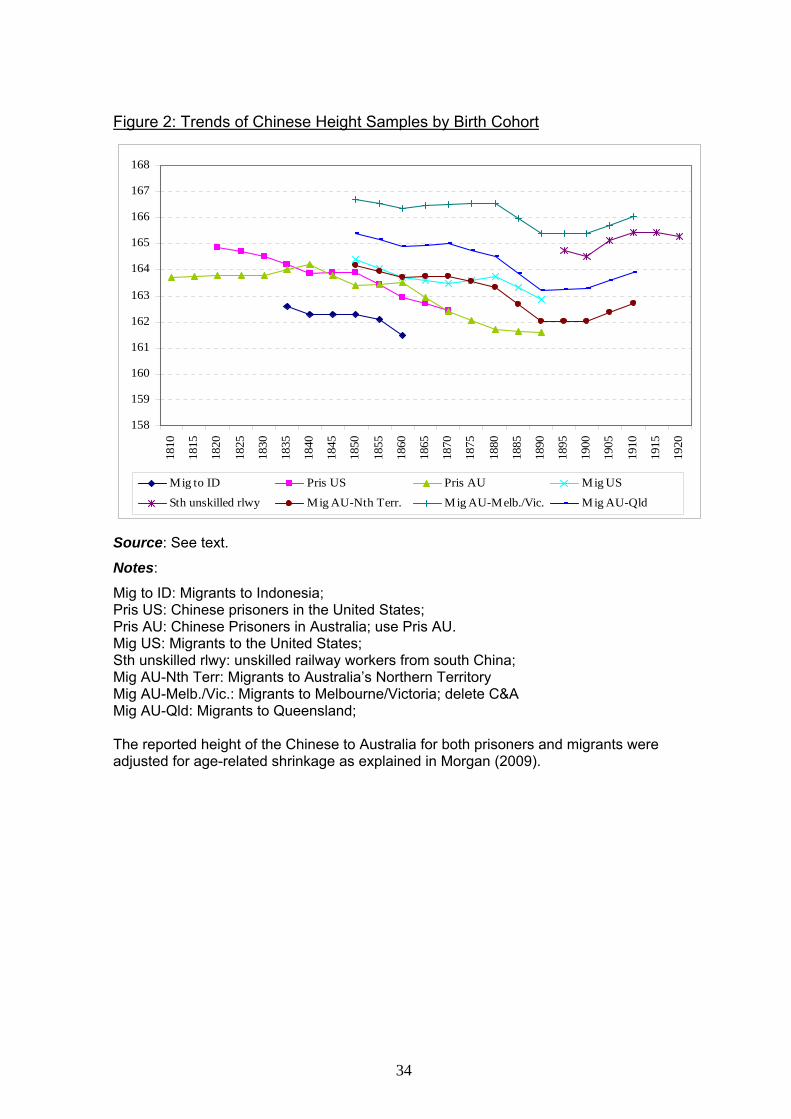
Figure 2: Trends of Chinese Height Samples by Birth Cohort
158
159
160
161
162
163
164
165
166
167
16818
10
1815
1820
1825
1830
1835
1840
1845
1850
1855
1860
1865
1870
1875
1880
1885
1890
1895
1900
1905
1910
1915
1920
Mig to ID Pris US Pris AU Mig US
Sth unskilled rlwy Mig AU-Nth Terr. Mig AU-Melb./Vic. Mig AU-Qld
Source: See text.
Notes:
Mig to ID: Migrants to Indonesia; Pris US: Chinese prisoners in the United States; Pris AU: Chinese Prisoners in Australia; use Pris AU. Mig US: Migrants to the United States; Sth unskilled rlwy: unskilled railway workers from south China; Mig AU-Nth Terr: Migrants to Australia’s Northern Territory Mig AU-Melb./Vic.: Migrants to Melbourne/Victoria; delete C&A Mig AU-Qld: Migrants to Queensland; The reported height of the Chinese to Australia for both prisoners and migrants were adjusted for age-related shrinkage as explained in Morgan (2009).
34
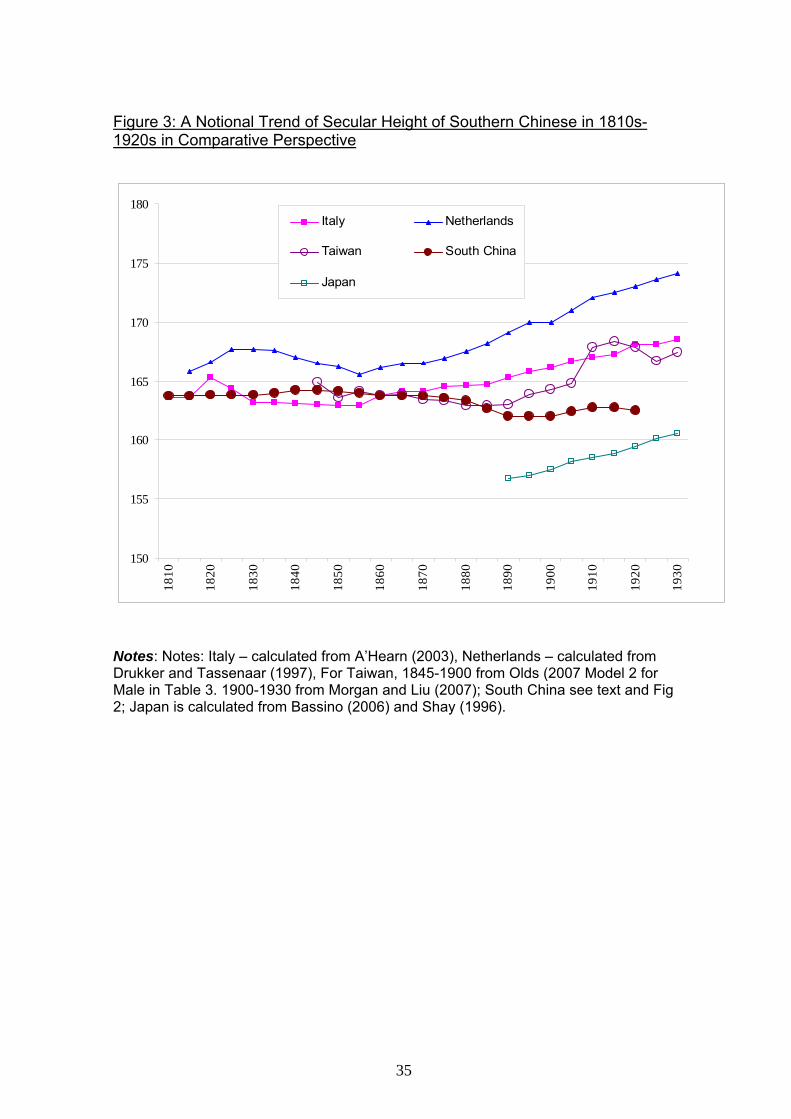
Figure 3: A Notional Trend of Secular Height of Southern Chinese in 1810s-1920s in Comparative Perspective
150
155
160
165
170
175
180
1810
1820
1830
1840
1850
1860
1870
1880
1890
1900
1910
1920
1930
Italy Netherlands
Taiwan South China
Japan
Notes: Notes: Italy – calculated from A’Hearn (2003), Netherlands – calculated from Drukker and Tassenaar (1997), For Taiwan, 1845-1900 from Olds (2007 Model 2 for Male in Table 3. 1900-1930 from Morgan and Liu (2007); South China see text and Fig 2; Japan is calculated from Bassino (2006) and Shay (1996).
35
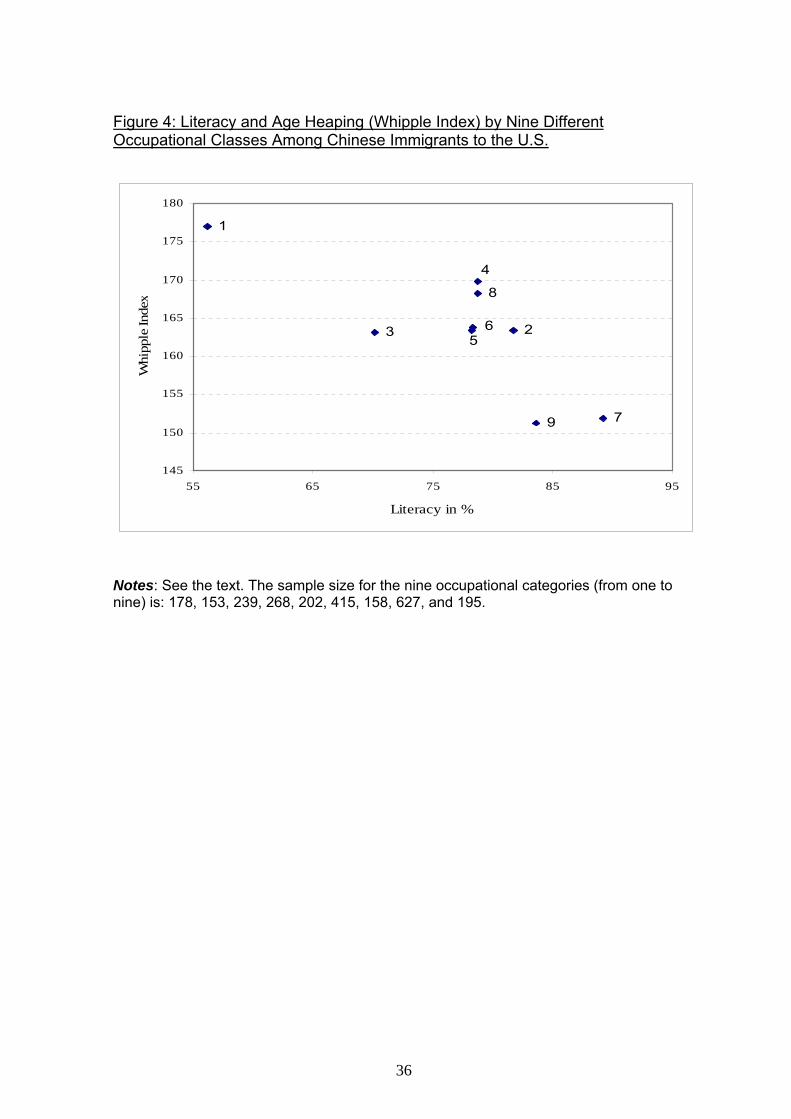
Figure 4: Literacy and Age Heaping (Whipple Index) by Nine Different Occupational Classes Among Chinese Immigrants to the U.S.
25
6
1
3
4
8
9 7
145
150
155
160
165
170
175
180
55 65 75 85 95
Literacy in %
Whi
pple
Inde
x
Notes: See the text. The sample size for the nine occupational categories (from one to nine) is: 178, 153, 239, 268, 202, 415, 158, 627, and 195.
36
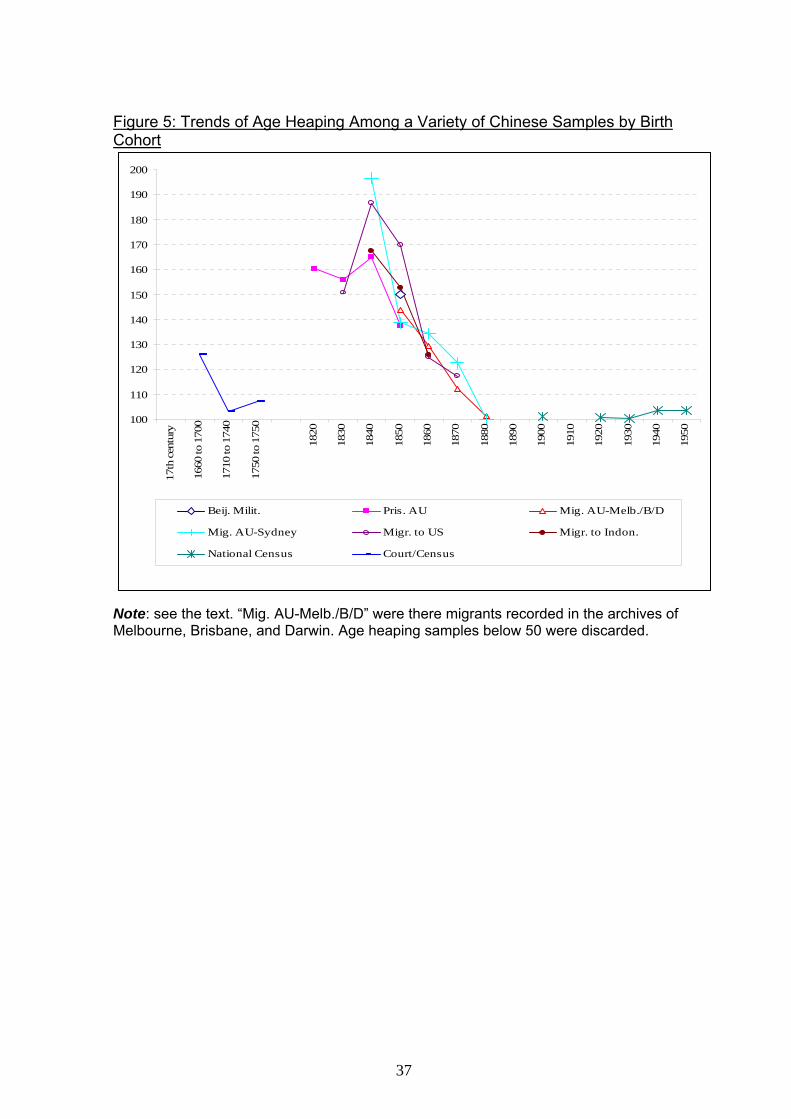
Figure 5: Trends of Age Heaping Among a Variety of Chinese Samples by Birth Cohort
100
110
120
130
140
150
160
170
180
190
20017
th c
entu
ry
1660
to 1
700
1710
to 1
740
1750
to 1
750
1820
1830
1840
1850
1860
1870
1880
1890
1900
1910
1920
1930
1940
1950
Beij. Milit. Pris. AU Mig. AU-Melb./B/D
Mig. AU-Sydney Migr. to US Migr. to Indon.
National Census Court/Census
Note: see the text. “Mig. AU-Melb./B/D” were there migrants recorded in the archives of Melbourne, Brisbane, and Darwin. Age heaping samples below 50 were discarded.
37
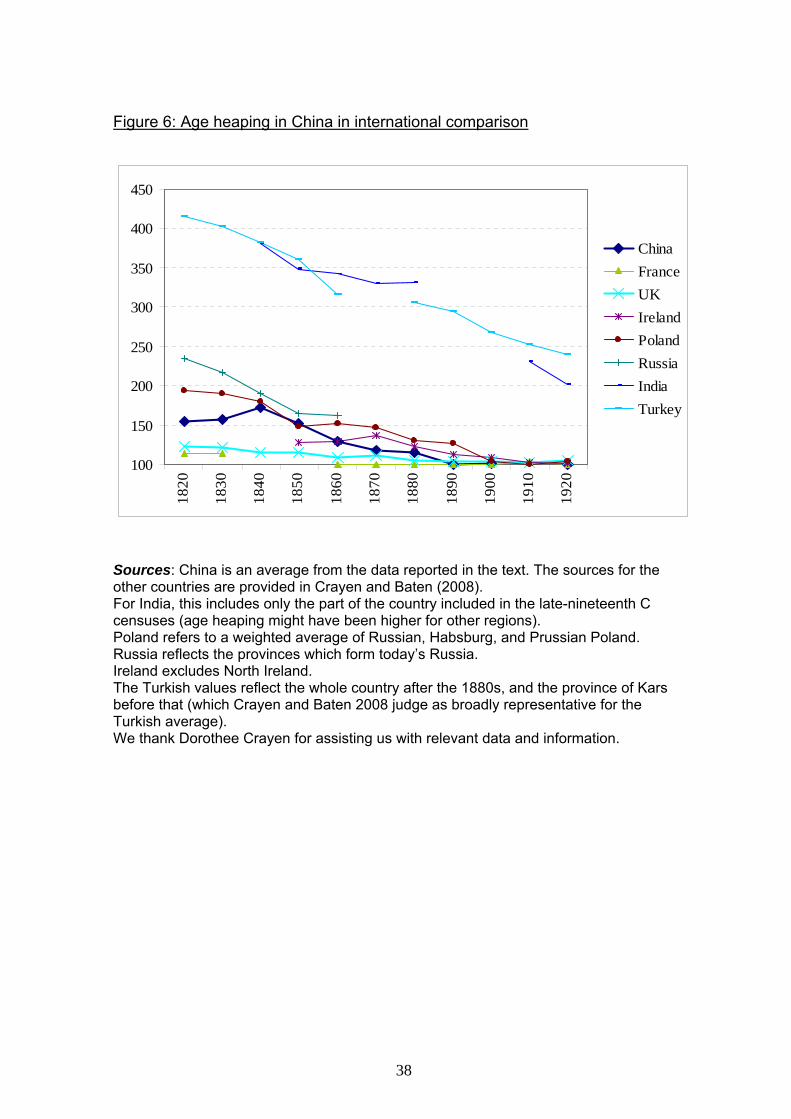
Figure 6: Age heaping in China in international comparison
100
150
200
250
300
350
400
45018
20
1830
1840
1850
1860
1870
1880
1890
1900
1910
1920
ChinaFranceUKIrelandPolandRussiaIndiaTurkey
Sources: China is an average from the data reported in the text. The sources for the other countries are provided in Crayen and Baten (2008). For India, this includes only the part of the country included in the late-nineteenth C censuses (age heaping might have been higher for other regions). Poland refers to a weighted average of Russian, Habsburg, and Prussian Poland. Russia reflects the provinces which form today’s Russia. Ireland excludes North Ireland. The Turkish values reflect the whole country after the 1880s, and the province of Kars before that (which Crayen and Baten 2008 judge as broadly representative for the Turkish average). We thank Dorothee Crayen for assisting us with relevant data and information.
38
LONDON SCHOOL OF ECONOMICS ECONOMIC HISTORY DEPARTMENT WORKING PAPERS (from 2006 onwards) For a full list of titles visit our webpage at http://www.lse.ac.uk/ 2006 WP93 Harbingers of Dissolution? Grain Prices, Borders and
Nationalism in the Hapsburg Economy before the First World War
Max-Stephan Schulze and Nikolaus Wolf WP94 Rodney Hilton, Marxism and the Transition from Feudalism to
Capitalism S. R. Epstein Forthcoming in C. Dyer, P. Cross, C. Wickham (eds.)
Rodney Hilton’s Middle Ages, 400-1600 Cambridge UP 2007 WP95 Mercantilist Institutions for the Pursuit of Power with Profit. The
Management of Britain’s National Debt, 1756-1815 Patrick Karl O’Brien WP96 Gresham on Horseback: The Monetary Roots of Spanish
American Political Fragmentation in the Nineteenth Century Maria Alejandra Irigoin 2007 WP97 An Historical Analysis of the Expansion of Compulsory
Schooling in Europe after the Second World War Martina Viarengo WP98 Universal Banking Failure? An Analysis of the Contrasting
Responses of the Amsterdamsche Bank and the Rotterdamsche Bankvereeniging to the Dutch Financial Crisis of the 1920s
Christopher Louis Colvin WP99 The Triumph and Denouement of the British Fiscal State:
Taxation for the Wars against Revolutionary and Napoleonic France, 1793-1815.
Patrick Karl O’Brien
WP100 Origins of Catch-up Failure: Comparative Productivity Growth in the Hapsburg Empire, 1870-1910
Max-Stephan Schulze WP101 Was Dick Whittington Taller Than Those He Left Behind?
Anthropometric Measures, Migration and the Quality of life in Early Nineteenth Century London
Jane Humphries and Tim Leunig WP102 The Evolution of Entertainment Consumption and the
Emergence of Cinema, 1890-1940 Gerben Bakker WP103 Is Social Capital Persistent? Comparative Measurement in the
Nineteenth and Twentieth Centuries Marta Felis Rota WP104 Structural Change and the Growth Contribution of Services:
How Motion Pictures Industrialized US Spectator Entertainment Gerben Bakker WP105 The Jesuits as Knowledge Brokers Between Europe and China
(1582-1773): Shaping European Views of the Middle Kingdom Ashley E. Millar WP106 Regional Income Dispersion and Market Potential in the Late
Nineteenth Century Habsburg Empire Max-Stephan Schulze 2008 WP107 ‘The Big Problem of the Petty Coins’, and how it could be
solved in the late Middle Ages Oliver Volckart WP108 The Anglo-German Industrial Productivity Puzzle, 1895-1935: A
Restatement and a Possible Resolution Albrecht Ritschl WP109 The History, Nature and Economic Significance of an
Exceptional Fiscal State for the Growth of the British Economy, 1453-1815
Patrick O’Brien
WP110 The Economic History of Sovereignty: Communal Responsibility, the Extended Family, and the Firm
Lars Boerner and Albrecht Ritschl WP111 A Stakeholder Empire: The Political Economy of Spanish
Imperial Rule in America Regina Grafe and Alejandra Irigoin WP112 The U.S. Business Cycle, 1867-1995: Dynamic Factor Analysis
vs. Reconstructed National Accounts Albrecht Ritschl, Samad Sarferaz and Martin Uebele WP113 Understanding West German Economic Growth in the 1950s Barry Eichengreen and Albrecht Ritschl 2009 WP114 War and Wealth: Economic Opportunity Before and After the
Civil War, 1850-1870 Taylor Jaworski WP115 Business Cycles and Economic Policy, 1914-1945: A Survey Albrecht Ritschl and Tobias Straumann WP116 The Impact of School Provision on Pupil Attendance: Evidence
From the Early 20th Century Mary MacKinnon and Chris Minns WP117 Why Easter Island Collapsed: An Answer for an Enduring
Question Barzin Pakandam WP118 Rules and Reality: Quantifying the Practice of Apprenticeship in
Early Modern Europe Chris Minns and Patrick Wallis WP119 Time and Productivity Growth in Services: How Motion Pictures
Industrialized Entertainment Gerben Bakker WP120 The Pattern of Trade in Seventeenth-Century Mughal India:
Towards An Economic Explanation Jagjeet Lally

WP121 Bairoch Revisited. Tariff Structure and Growth in the Late 19th Century
Antonio Tena-Junguito WP122 Evolution of Living Standards and Human Capital in China in
18-20th Centuries: Evidences from Real Wage and Anthropometrics
Joerg Baten, Debin Ma, Stephen Morgan and Qing Wang