Embed Size (px)
Citation preview
1
Evolution of organic aerosol mass spectra upon heating:
implications for OA phase and partitioning behavior
C. D. Cappa1, K. R. Wilson2
[1] {Department of Civil and Environmental Engineering, University of California, Davis, CA
95616}
[2] {Chemical Sciences Division, Lawrence Berkeley National Laboratory, Berkeley, CA
94720}
Correspondence to: C. D. Cappa ([email protected])
Abstract
Vacuum Ultraviolet (VUV) photoionization mass spectrometry has been used to measure the
evolution of chemical composition for two distinct organic aerosol types as they are passed
through a thermodenuder at different temperatures. The two organic aerosol types considered are
primary lubricating oil (LO) aerosol and secondary aerosol from the α-pinene + O3 reaction
(αP). The evolution of the VUV mass spectra for the two aerosol types with temperature are
observed to differ dramatically. For LO particles, the spectra exhibit distinct changes with
temperature in which the lower m/z peaks, corresponding to compounds with higher vapor
pressures, disappear more rapidly than the high m/z peaks. In contrast, the αP aerosol spectrum
is essentially unchanged by temperature even though the particles experience significant mass
loss due to evaporation. The variations in the LO spectra are found to be quantitatively in
2
agreement with expectations from absorptive partitioning theory whereas the αP spectra suggest
that the evaporation of αP derived aerosol appears to not be governed by partitioning theory. We
postulate that this difference arises from the αP particles existing as in a glassy state instead of
having the expected liquid-like behavior. To reconcile these observations with decades of aerosol
growth measurements, which indicate that OA formation is described by equilibrium
partitioning, we present a conceptual model wherein the secondary OA is formed and then
rapidly converted from an absorbing form to a non-absorbing form. The results suggest that
although OA growth may be describable by equilibrium partitioning theory, the properties of
organic aerosol once formed may differ significantly from the properties determined in the
equilibrium framework.
1 Introduction Atmospheric aerosol particles play an important role in the Earth’s climate system through their
ability to absorb and scatter solar radiation and influence the properties of clouds (IPCC, 2007)
and have significant negative effects on human health (e.g. Pope et al., 2009). Aerosols are
comprised of a wide variety of materials, with organic components commonly making up over
50% of the sub-micron aerosol mass (Zhang et al., 2007). Despite the ubiquity of organic aerosol
(OA), much remains unknown with respect to formation, chemical evolution and removal
mechanisms. Atmospheric models of OA formation generally follow from absorptive
partitioning theory (Pankow, 1994), using either a two-product (Odum et al., 1996) or volatility
basis-set (Donahue et al., 2006;Robinson et al., 2007) framework. Unfortunately, the use of these
approaches in models has typically led to either an under-estimate of ambient OA mass loadings
3
(e.g. Volkamer et al., 2006;Heald et al., 2005) or model OA with physical properties, such as
volatility, that are inconsistent with observations (Dzepina et al., 2009). Quantitative estimates of
OA volatility for ambient aerosol suggest the presence of components with volatilities that are
significantly lower than has been deduced from in-chamber OA growth experiments or could
likely be formed from typical gas-phase chemical reactions (Cappa and Jimenez, 2010). These
types of observations suggest that there is a gap between our understanding of OA obtained from
aerosol growth experiments and measurements of volatility once the aerosol is formed.
Here, we investigate the volatility and evaporation behavior of two distinct aerosol types:
lubricating oil (LO) aerosol, a proxy for primary OA, and secondary OA formed from the
reaction of α-pinene with O3 (αP SOA). Based on previous laboratory experiments, it is thought
that molecular components of LO and αP aerosol have similar volatility distributions (Grieshop
et al., 2009;Lane et al., 2008;Pathak et al., 2007b;Presto and Donahue, 2006). However, we find
evidence that, during evaporation, these two aerosol types exhibit dramatically different
evaporation rates and changes to the particle composition, as deduced from vacuum ultraviolet
(VUV) aerosol mass spectrometry measurements. The LO aerosol exhibits behavior that is
consistent with partitioning theory, whereas the behavior of the αP aerosol is quite different and
cannot be explained via traditional partitioning theory. Our results are consistent with the SOA
particles existing in a glassy state, in line with other recent results for biogenic SOA (Virtanen et
al., 2010). To understand these results in the context of aerosol growth experiments, we postulate
a conceptual model for SOA formation based on a modified form of absorptive partitioning
theory.
4
2 Methods
2.1 Vacuum Ultraviolet – Aerosol Mass Spectrometer (VUV-AMS) Mass spectra of organic aerosol were measured using the VUV-AMS located at the Chemical
Dynamics Beamline at the Advanced Light Source (Smith et al., 2009;Mysak et al., 2005;Shu et
al., 2006). In this VUV-AMS, particles are focused in an aerodynamic lens and introduced into
an ionization chamber held at ~10-5 Torr, where the particles are vaporized on a heated plate. The
plate is held at a constant temperature, fixed between 100 and 250 °C. As the particles impact the
heated plate they vaporize to produce gas-phase species that are ionized by 10.5 eV photons. The
resulting ions are extracted into a time-of-flight mass spectrometer (m/Δm ~ 2000). Background
spectra are collected before and after each aerosol mass spectrum by closing the aerosol inlet.
Compared to a conventional electron impact-based AMS, fragmentation of the parent
compounds is significantly reduced due both to the use of VUV photons for ionization and the
use of a lower heater temperature (see Fig. S-1 in Supplementary Material).
2.2 Organic Aerosol Generation
2.2.1 Lubricating Oil Aerosol Lubricating oil (LO) aerosol was generated via homogeneous nucleation by passing clean, dry
N2 over 10W-30 motor oil heated to ~80°C. As the air cools, particles nucleate with a log-normal
distribution, typically with a median volume-weighted diameter, dp,V, between 220 nm - 250 nm
and a geometric standard deviation, σp, of 1.35-1.4. The aerosol concentration was controlled by
passing the particle-laden air stream through a filter-based “diluter”. The aerosol was then passed
through a glass flowtube with a 37 second mixing time before finally passing to the
thermodenuder (described below). The initial particle mass loading was typically around 650
µg/m3.
5
2.2.2 Secondary Organic Aerosol Secondary organic aerosol was produced from homogeneous nucleation of the products from the
reaction of α-pinene and O3 (referred to as αP aerosol). α-pinene vapor was introduced by
continuously injecting a small amount of α-pinene liquid into a 1 lpm flow of dry N2 and then
sub-sampling 0.1 lpm of this flow into the reaction flowtube. O3 was generated by passing 1 lpm
of pure O2 over an Hg pen-ray lamp and then sub-sampling 0.05 lpm of this O3 flow into the
reaction flowtube. The α-pinene and O3 were diluted into nitrogen such that the total flow was 1
lpm with N2:O2 = 9:1 and were allowed to react in a cylindrical glass flowtube (L = 1.7 m; D =
6.35 cm), with a total reaction time of ca. 320 seconds. No OH scavenger was used. Given the
short residence time (compared to environmental chamber experiments), it was necessary to use
relatively high concentrations of reactants: ~13 ppm α-pinene and 1 ppm O3. The O3
concentration was measured using an O3 monitor (2B technologies), whereas the α-pinene
concentration was estimated from the syringe pump and gas flow rates. By using excess α-
pinene, it was ensured that all of the O3 reacted in the flowtube. Typical initial mass loadings for
αP aerosol were ca. 500 µg/m3 with dp,V = 92 nm, Np ~ 1.8 x 10⁶ particles/cm3 and σp = 1.38.
2.2.3 Mixed Aerosol In one experiment, αP aerosol was coated onto LO seed particles. This was done by producing
LO particles via homogeneous nucleation (with dp,N = 157 nm, σp = 1.38) as above and then
using these LO particles as seed particles for condensation of the α-pinene + O3 reaction
products (dp,N = 188 nm, σp = 1.42). The particle number concentration did not increase
significantly (by less than 5%), indicating that the majority of the αP aerosol was internally
mixed with the LO aerosol. Nucleated αP aerosol was easily identified as a unique mode with
dp,N = 32 nm and contributed less than 0.2% to the total particle mass, and thus will not influence
6
the VUV-AMS measurements. The mass ratio between LO and αP aerosol in the mixed particles
was ca. 2:3, estimated assuming a density for αP aerosol of 1.3 g/cm3 and for LO aerosol of 0.88
g/cm3. The total mass loadings were ca. 500 µg/m3.
2.3 Thermodenuder The thermodenuder (TD) was of the same design as the TD described by Huffman et al.
(Huffman et al., 2008). The TD consisted of a variable-temperature heated section (L = 0.5 m, D
= 2.2 cm) followed by an activated carbon denuder/cooling section (L = 0.41 m, D = 1.9 cm).
The ambient temperature flowrate through the TD was 0.6 lpm, giving an effective plug flow
residence time of ~15 seconds. Measurements were made with the temperature of the heated
section ranging from ambient temperature up to 170°C. Particle composition and size
measurements were made both after passing the particles through a bypass line (at ambient
temperature) or through the TD. Bypass measurements were made at every TD temperature in
order to account for any changes to the original size distributions (although such changes were
negligible during a given experiment).
2.4 Size Distributions Particle size distributions were measured using a scanning mobility particle sizer (SMPS; TSI,
Inc.) operating with an aerosol flow of 0.3 lpm and a sheath flow of 3 lpm. The lower and upper
size limits in this configuration were 14.3 nm and 673 nm, respectively.
3 Results and Discussion Size distributions and VUV mass spectra were measured for LO, αP and mixed LO/αP aerosol
as a function of the TD temperature (TTD). The initial distributions for all aerosol types were log-
7
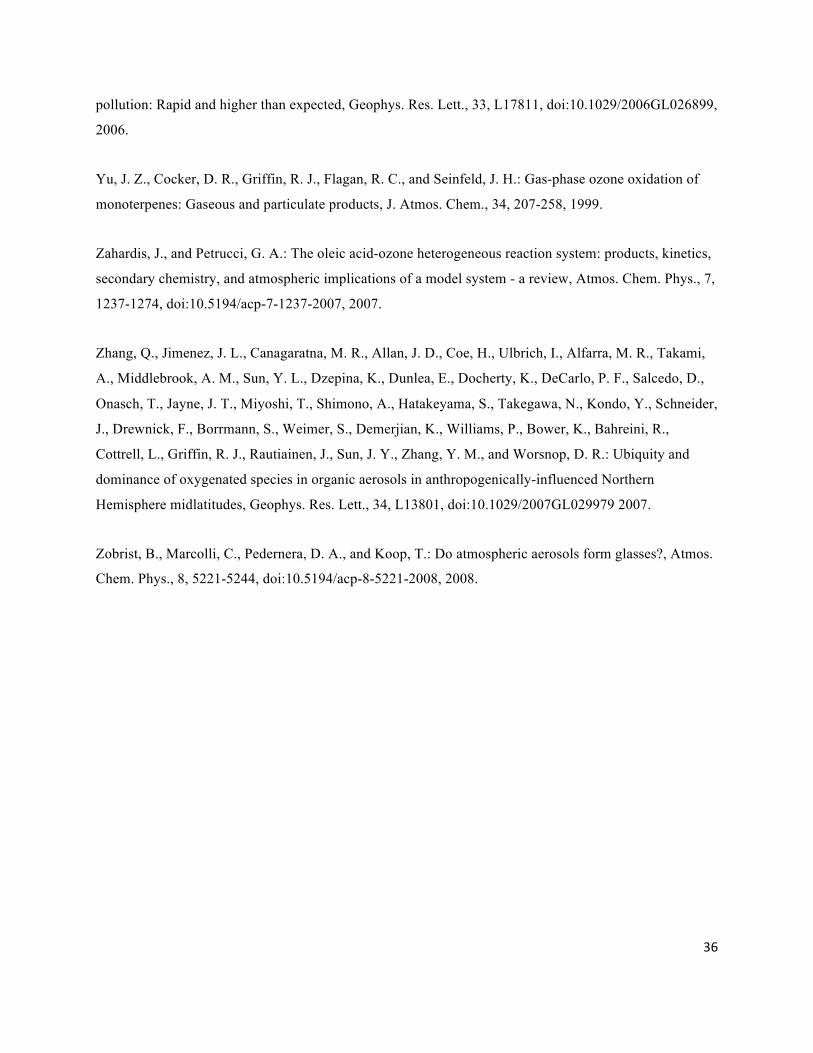
normal. As TTD increased, the particle mass loading (Cp) and dp decreased for each aerosol type.
Using as a reference state the volume-weighted particle diameter, dp,V, as measured from the
bypass line, the volume fraction remaining (VFR) was determined as a function of TTD (Fig. 1)
based on the changes in the particle size. For particles of constant density this is equivalent to a
mass thermogram. The decrease in VFR from 1 at a given TTD followed the order LO > LO/αP >
αP aerosol (Fig. 1). Since each of these experiments was conducted at a similar mass loading
(Saleh et al., 2010), it is possible to conclude that the LO aerosol is somewhat more volatile than
αP aerosol, as has previously been deduced from other TD measurements (Huffman et al.,
2009b;An et al., 2007). For both LO and mixed LO/αP aerosol at ambient temperature the
measured VFR was found to be significantly less than 1 (VFR = 0.78 and 0.9, respectively). The
mixed LO/αP mass thermogram can be represented well as a linear combination of the LO and
αP mass thermograms.
3.1 VUV Mass Spectra as a function of TTD The VUV mass spectra for both LO and αP aerosol contain many more “high” mass peaks
compared to the mass spectra obtained using a conventional electron impact AMS (Fig. S1). This
suggests that the VUV spectra can provide more direct information as to the behavior of parent
ions than does an EI spectrum. For example, for LO many of the observed peaks are in the range
m/z = 250-450. This corresponds to compounds with around 18-32 carbon atoms, typical of
lubricating oil, thus indicating minimal fragmentation upon vaporization and ionization. For αP
aerosol there is significant spectral intensity at m/z > 136 (the MW of α-pinene), although
fragmentation appears to be somewhat greater in the αP system compared to LO.
8
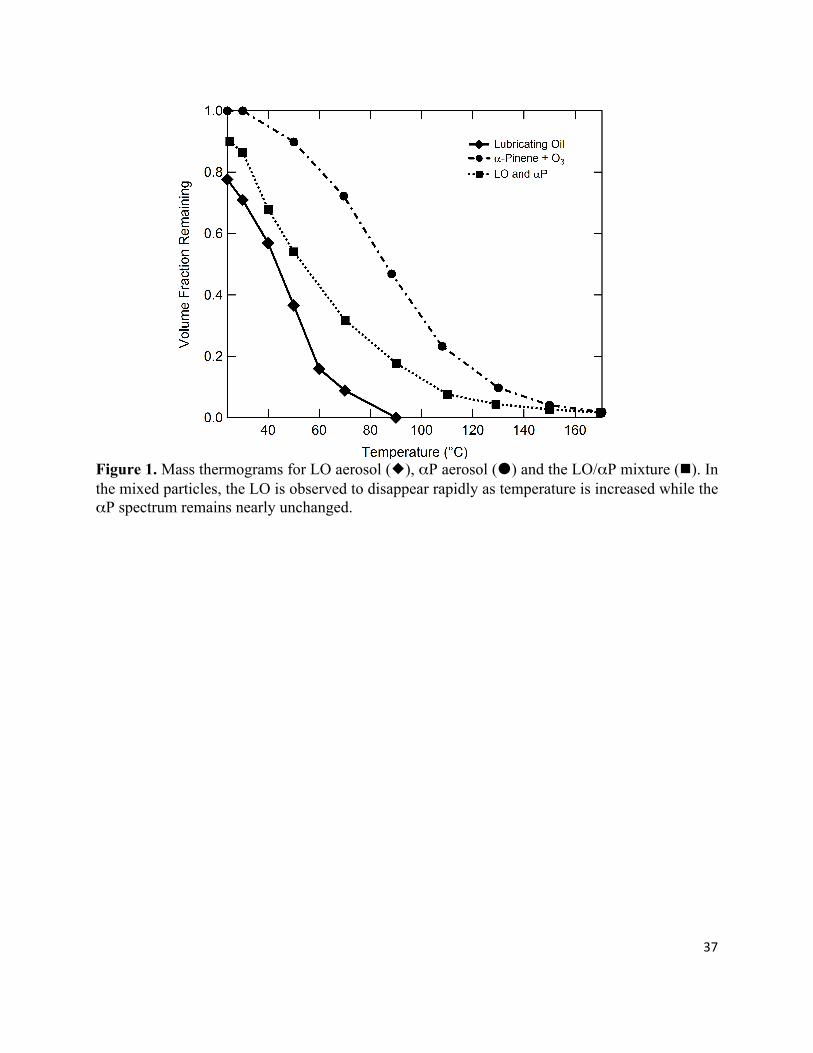
The evolution of the VUV aerosol mass spectra for LO, LO/αP and αP aerosol with TTD is
shown in Figure 2. To facilitate visual comparison between spectra measured at different TTD
(and therefore at different mass loadings), the spectra have been area normalized to a particular
m/z or range of m/z. For the LO aerosol, clear m/z dependent changes in the VUV mass
spectrum were observed with TTD (Fig. 2). Specifically, the relative intensities of lower m/z
(higher volatility) peaks decrease faster with TTD than higher m/z (lower volatility) peaks, and
above the normalization range (where the intensity is constant with TTD) the intensity actually
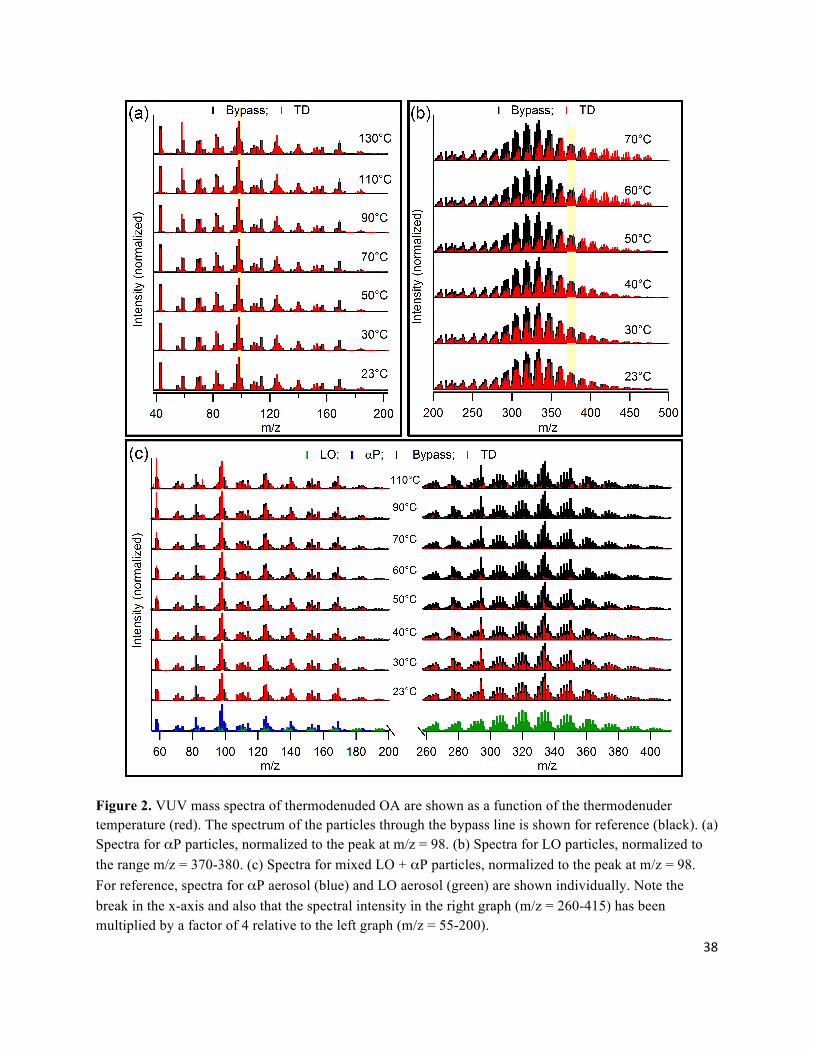
increases with TTD. This is shown more explicitly in Figure 3a, where the spectral intensity of
every peak from 250-477 amu, now normalized to the absolute value from the bypass spectrum,
is shown as a function of TTD. (This is analogous to a mass thermogram determined from the
SMPS measurements and will be termed a “peak thermogram.”) Furthermore, the peaks have
been binned into groups with Δm/z = 14 to highlight the m/z dependence (Fig. 3b). The low m/z
peaks exhibit the largest decrease in intensity at ambient temperature followed by the fastest
decay with TTD. By comparison, the highest m/z peaks exhibit minimal loss in intensity after
passing through the TD at ambient temperature with a more gradual loss in peak intensity as a
function of increasing TTD. The “bunching up” of the lower m/z peak thermograms likely results
from contributions of fragments from higher m/z compounds. For the hydrocarbon compounds
comprising LO aerosol, molecular weight (i.e. m/z) is a reasonable proxy for vapor pressure and
thus the preferential loss of the low m/z peaks corresponds to loss of the higher volatility
components.
The variation in the VUV mass spectrum with TTD for αP aerosol is dramatically different than
that observed for LO aerosol. The αP aerosol spectrum is nearly independent of TTD, both for
9
peaks above and below m/z 136 (Fig. 2). This is especially apparent when one considers the peak
thermogram for αP aerosol, where nearly every peak exhibits the same dependence on TTD (Fig.
4a). This suggests that, although the total particle mass decreases with increasing TTD, the
chemical composition remains nearly independent of temperature. For the αP aerosol we would
not necessarily expect any specific MW dependence because the nature of the oxygen-containing
functional groups will play an important role in determining the volatility of a given compound.
However, just as LO aerosol is comprised of compounds with a wide distribution of vapor
pressures (Grieshop et al., 2009), aerosol yield experiments suggest that αP aerosol is similarly
composed of compounds with a distribution of vapor pressures (e.g. Griffin et al., 1999;Ng et al.,
2006;Presto and Donahue, 2006). Thus, it is very surprising that the VUV mass spectrum for αP
aerosol is nearly insensitive to TTD, since we would expect at least some of the peaks to
correspond to compounds with different vapor pressures and thus to evaporate at different rates.
It is possible that the peaks observed in the VUV mass spectrum are biased towards compounds
with specific functional groups, which would complicate the interpretation. However, the
observed overall peak thermogram agrees well with the observed SMPS-derived mass
thermogram, which suggests that our results are not biased in any particular direction (e.g. more
vs. less volatile components, Fig. 4a). These observations indicate that, although αP aerosol is
comprised of many different individual compounds (e.g. Docherty et al., 2005;Yu et al., 1999),
the overall volatility is governed by some other effective physical parameter and not solely the
properties of each individual compound. In other words, it is as if the αP particles were
comprised of a single “meta-compound.” The exception to the above is the relative behavior of
the peak at m/z 58, which increases with TTD. It is not clear why this peak behaves differently
than the majority of the spectrum.
10
The ambient temperature VUV mass spectrum of the mixed LO/αP particles is reasonably well
represented as a sum of the pure LO and αP particle spectra. The peaks in the mass spectrum
corresponding to LO and αP are well separated such that it is possible to follow their evolution
in the mixed system separately. This allows the evolution of the overall mass spectrum of mixed
LO/αP particles with TTD to be analyzed as a linear combination of the two individual aerosol
spectra. The intensity of the LO peaks decrease relative to the αP peaks with increasing TTD such
that once TTD > 70°C the spectrum resembles that of pure αP particles. Also, like the pure LO
aerosol, there is a clear m/z dependence to the spectral variation with TTD in the LO region of the
spectrum. Thus, even though the LO and αP are internally mixed (as evidenced by the lack of
increase in particle number concentration), it appears that within a particle the LO and αP
components do not mix at a molecular level to a significant extent. Recall that the αP aerosol
was coated onto LO seed particles, and thus one might expect that the αP material should form a
shell around the LO particles as was previously observed for αP aerosol on dioctyl phthalate
particles (Vaden et al., 2010). However, if αP aerosol formed a shell around the LO particles
then it is reasonable to expect that the evaporation of the LO core should have been significantly
impeded by the αP coating, yet this was not observed. Instead, our results appear consistent with
the mixed LO/αP aerosol having a morphology wherein the LO and αP components exist as
separate phases in a “side-by-side” arrangement, thus allowing the LO components to evaporate
essentially unimpeded by the αP components. This observation is consistent with the mass
thermogram for the mixed LO/αP being a linear combination of the individual LO and αP mass
thermograms.
11
3.2 Mass and peak thermograms: quantitative analysis Mass thermograms for the LO and αP multi-component aerosol particles have been calculated
using a kinetic model of aerosol evaporation in the thermodenuder (Cappa, 2010). Implicit to the
model is the assumption that the particles are liquid-like, and therefore well-mixed and
describable through absorptive partitioning theory (i.e. governed by Raoult’s Law). The required
inputs to the model are a volatility basis-set of ambient temperature saturation concentrations
(C*) with the total mass fraction (gas + particle phase) of each component in the basis-set
specified (αi), the total OA mass (COA), the enthalpy of vaporization (ΔHvap), molecular weight
(MW), gas-phase diffusivity (Dg) and evaporation coefficient (γe). Here, a logarithmically spaced
C* basis-set has been used. The initial particle phase fraction for each compound is determined
from:
. (1)
where ξp,i is the partitioning coefficient and αi is the stoichiometric yield for compound i, and
Ctot is the total (gas + particle phase) concentration of all compounds (Odum et al., 1996). For
LO aerosol we have used the C* basis-set for diesel aerosol (thought to be primarily composed of
lubricating oil) from Grieshop et al. (2009), where C* = {0.01, 0.1, 1, 10, 100, 1000, 104} µg/m3
and αi = {0.01, 0.01, 0.04, 0.21, 0.18, 0.45, 0.1}. ΔHvap values were estimated using the
relationship given in Epstein et al. (2009) and MW values were specified using an estimated
C*/MW relationship, where log C* = -0.0337MW + 11.56 (Lide, 2005). We assume that Dg = 3 x
10-6 m2/s and use dp = 240 nm and COA = 730 µg/m3 (the observed values) along with the actual
physical dimensions of the TD (Huffman et al., 2008;Cappa, 2010). Given the uncertainties in
12
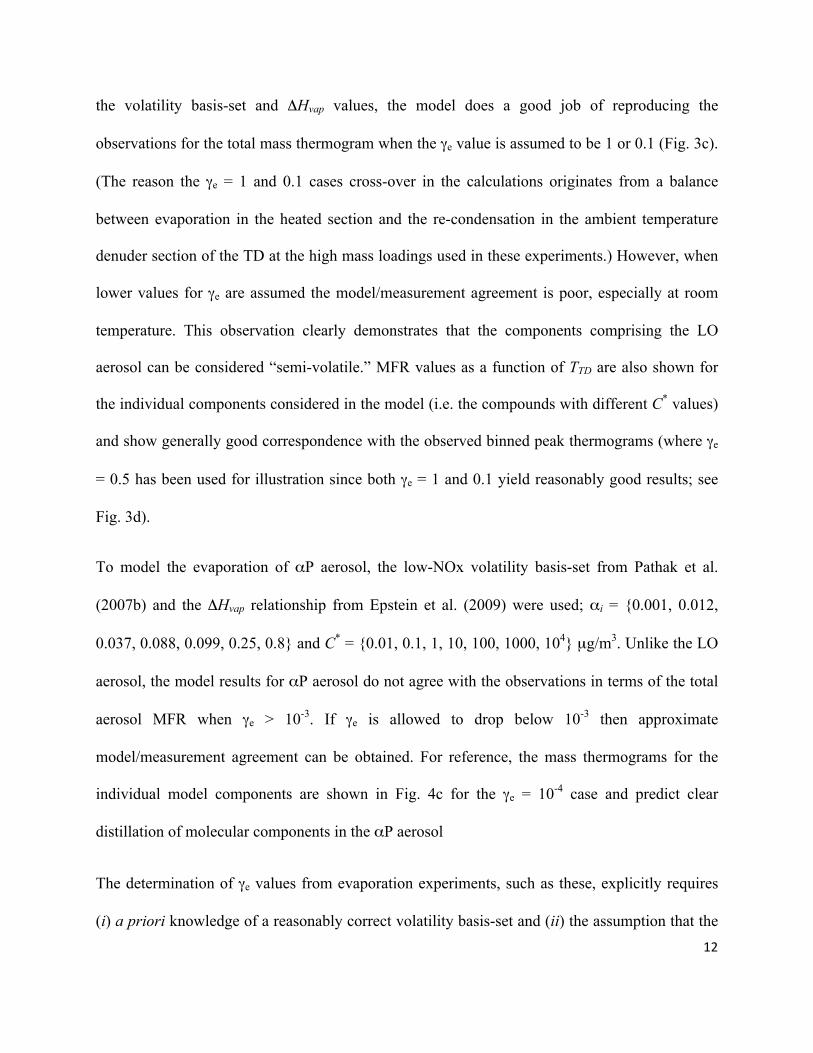
the volatility basis-set and ΔHvap values, the model does a good job of reproducing the
observations for the total mass thermogram when the γe value is assumed to be 1 or 0.1 (Fig. 3c).
(The reason the γe = 1 and 0.1 cases cross-over in the calculations originates from a balance
between evaporation in the heated section and the re-condensation in the ambient temperature
denuder section of the TD at the high mass loadings used in these experiments.) However, when
lower values for γe are assumed the model/measurement agreement is poor, especially at room
temperature. This observation clearly demonstrates that the components comprising the LO
aerosol can be considered “semi-volatile.” MFR values as a function of TTD are also shown for
the individual components considered in the model (i.e. the compounds with different C* values)
and show generally good correspondence with the observed binned peak thermograms (where γe
= 0.5 has been used for illustration since both γe = 1 and 0.1 yield reasonably good results; see
Fig. 3d).
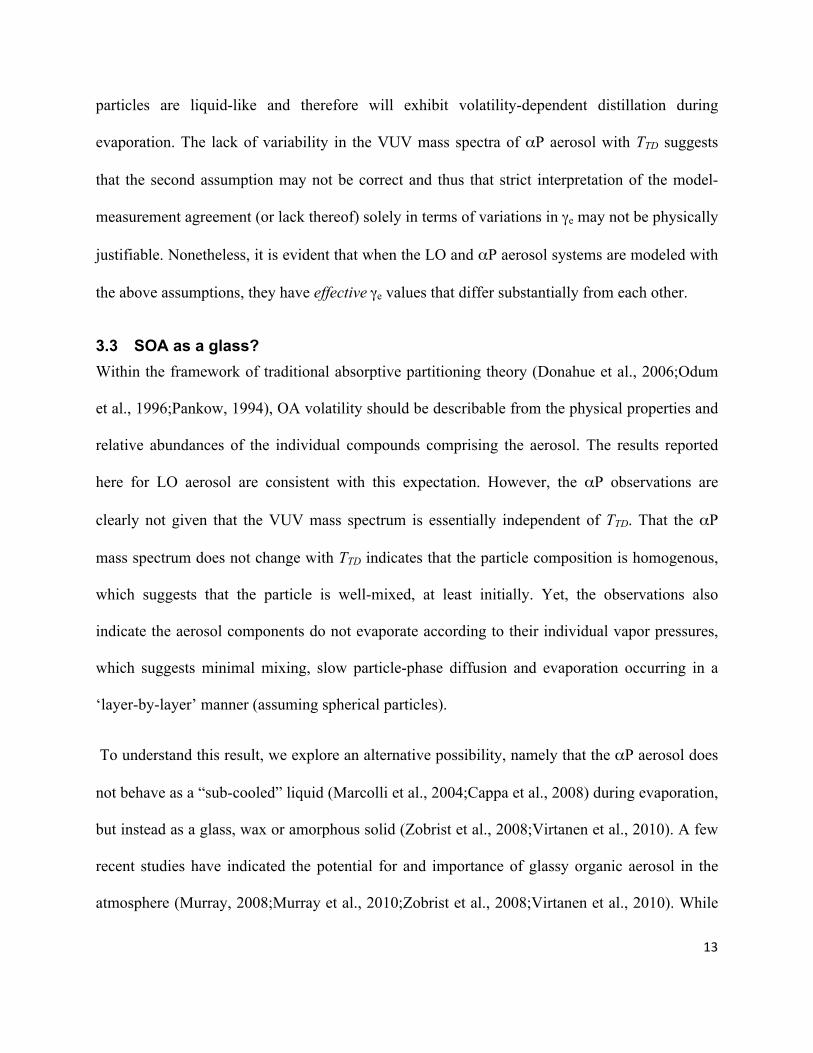
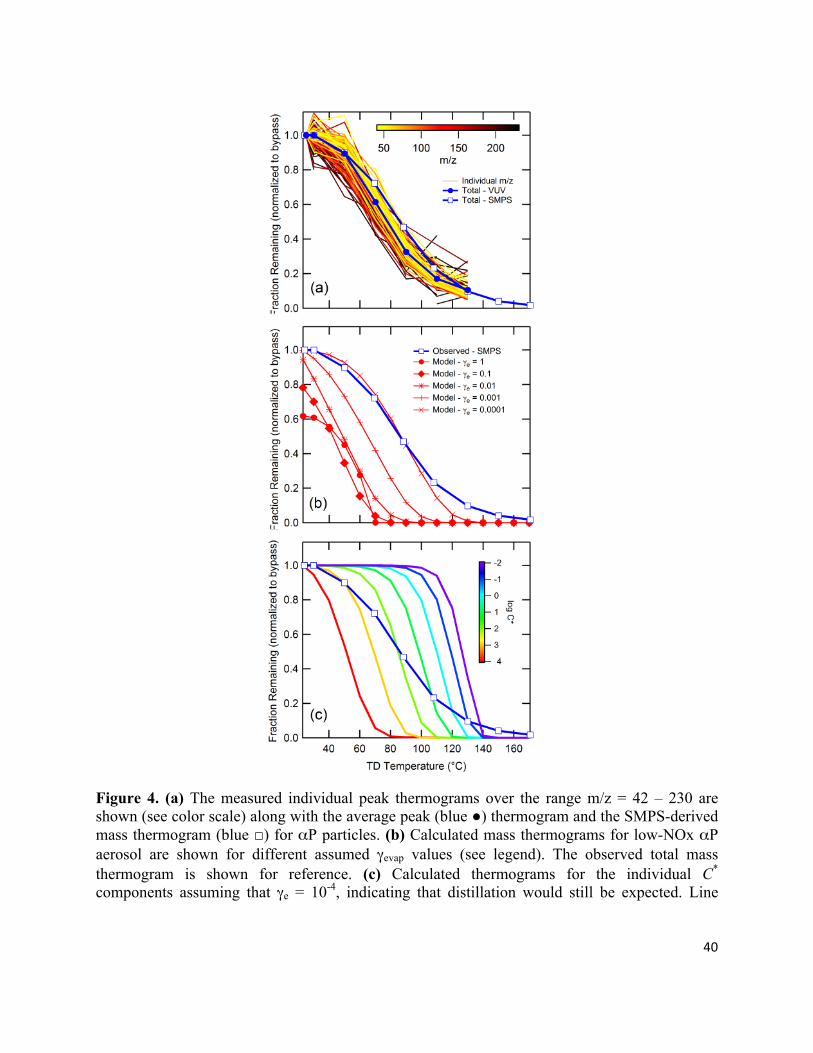
To model the evaporation of αP aerosol, the low-NOx volatility basis-set from Pathak et al.
(2007b) and the ΔHvap relationship from Epstein et al. (2009) were used; αi = {0.001, 0.012,
0.037, 0.088, 0.099, 0.25, 0.8} and C* = {0.01, 0.1, 1, 10, 100, 1000, 104} µg/m3. Unlike the LO
aerosol, the model results for αP aerosol do not agree with the observations in terms of the total
aerosol MFR when γe > 10-3. If γe is allowed to drop below 10-3 then approximate
model/measurement agreement can be obtained. For reference, the mass thermograms for the
individual model components are shown in Fig. 4c for the γe = 10-4 case and predict clear
distillation of molecular components in the αP aerosol
The determination of γe values from evaporation experiments, such as these, explicitly requires
(i) a priori knowledge of a reasonably correct volatility basis-set and (ii) the assumption that the
13
particles are liquid-like and therefore will exhibit volatility-dependent distillation during
evaporation. The lack of variability in the VUV mass spectra of αP aerosol with TTD suggests
that the second assumption may not be correct and thus that strict interpretation of the model-
measurement agreement (or lack thereof) solely in terms of variations in γe may not be physically
justifiable. Nonetheless, it is evident that when the LO and αP aerosol systems are modeled with
the above assumptions, they have effectiveγe values that differ substantially from each other.
3.3 SOA as a glass? Within the framework of traditional absorptive partitioning theory (Donahue et al., 2006;Odum
et al., 1996;Pankow, 1994), OA volatility should be describable from the physical properties and
relative abundances of the individual compounds comprising the aerosol. The results reported
here for LO aerosol are consistent with this expectation. However, the αP observations are
clearly not given that the VUV mass spectrum is essentially independent of TTD. That the αP
mass spectrum does not change with TTD indicates that the particle composition is homogenous,
which suggests that the particle is well-mixed, at least initially. Yet, the observations also
indicate the aerosol components do not evaporate according to their individual vapor pressures,
which suggests minimal mixing, slow particle-phase diffusion and evaporation occurring in a
‘layer-by-layer’ manner (assuming spherical particles).
To understand this result, we explore an alternative possibility, namely that the αP aerosol does
not behave as a “sub-cooled” liquid (Marcolli et al., 2004;Cappa et al., 2008) during evaporation,
but instead as a glass, wax or amorphous solid (Zobrist et al., 2008;Virtanen et al., 2010). A few
recent studies have indicated the potential for and importance of glassy organic aerosol in the
atmosphere (Murray, 2008;Murray et al., 2010;Zobrist et al., 2008;Virtanen et al., 2010). While
14
most of these studies have been on aqueous organic glassy aerosol, as opposed to the non-
aqueous system considered here, the Virtanen et al. results are for biogenic SOA at low (~30%)
RH. The key characteristic of a glass compared to a liquid is that diffusion in a glass is much
slower. If particle-phase diffusion and mixing are sufficiently slow (compared to the timescale of
the experiment) then the constituent compounds would not necessarily evaporate according to
their Raoult’s Law-adjusted vapor pressures, but rather evaporation would proceed in a layer-by-
layer manner, without mixing to re-homogenize the particle and replenish the surface layer. In
this case, the evaporation rate of the higher volatility components is limited by the rate at which
surface sites become available, which in turn depends on the evaporation rate of the lower
volatility components. This would appear as if the higher volatility compounds have an apparent
γe much less than 1. Evaporation of the higher volatility compounds could leave the remaining
lower volatility compounds at the surface to exist in a relatively high energy state (as neighbor
molecules evaporate and are not replaced), thus causing the lower volatility material to evaporate
somewhat faster than it might otherwise. The net result would be that the overall particle
evaporation dynamics would likely appear somewhere between the highest and lowest volatility
compounds, as has been observed for binary and ternary mixtures of solid dicarboxylic acids (C.
D. Cappa, Unpublished Data). However, this description does not appear to apply to the αP
aerosol here, because for γe values close to 1 even the least volatile components (C* = 10-2
µg/m3) are calculated to evaporate completely at temperatures lower than were observed.
For the residence time in the thermodenuder (15 seconds), if the particle-phase diffusivity were
of the order 10-16 m2/s then mixing would have been slow compared to the transit time through
the thermodenuder. (Diffusion timescales were estimated as td ~ rp2/Dp, where Dp is the particle-
15
phase diffusion coefficient and rp is the particle radius.) Given that diffusion coefficients are
temperature dependent, we conservatively estimate the OA diffusivity at ambient temperature
would have needed to be O(10-18 m2/s) to prevent mixing at all TTD. For comparison, these values
are similar to that observed for amorphous water around 150-160 K (Smith and Kay, 1999). Note
also that our results suggest the persistence of glassy behavior to high temperatures (130°C), and
thus a high glass transition temperature for the αP SOA.
The LO aerosol is composed of numerous long chain hydrocarbons, which have only a few
oxygenated functional groups (if any) per molecule. On the other hand, the αP aerosol is likely
comprised of molecules having many functional groups (e.g. alcohols, ketones, aldehydes,
carboxylic acids, etc.) per molecule and oligomeric species may also be formed (e.g. Gao et al.,
2010). As such, the interactions between molecules in the LO aerosol will be dominated by van
der Waals forces while in the αP aerosol the intermolecular interactions will be significantly
more complex, likely with an important role for hydrogen bonding or further condensed phase
reactions. We hypothesize that in the αP particles made here, these interactions are sufficiently
strong that the net effect is to effectively retard mixing within the particle, thus giving rise to the
observed behavior. However, this hypothesis must be reconciled with the observation that the
particles were apparently compositionally homogenous, because if they were heterogeneous (e.g.
with a composition that gradually changes from the core to the outermost shell) and glassy then
the removal of outer layers would likely lead to an observable change in the particle composition
(cf. Fig. 5e). Together, these findings suggest that a transformation occurred as the particles
transited from the reaction flowtube to the thermodenuder, wherein the particles evolved from a
more liquid-like state to a more arrested (glassy) state leading to a dramatic slow-down in
16
particle-phase diffusion. Based on the experimental configuration, this time scale is estimated as
a few minutes. This may be related to the timescale associated with the formation of dimers,
trimers, etc. through condensed phase or heterogeneous reactions, although there is no direct
support for this from our experiments.
3.4 Sequential partitioning model The formation and evolution of organic aerosol has, for the past two decades, been primarily
understood through absorptive partitioning theory, generally with the assumption that
partitioning occurs to the entire organic phase (or at least the entire secondary component).
However, our observations for the αP aerosol suggest that traditional absorptive partitioning may
not provide a robust description of the aerosol behavior because the particle-phase diffusion may
change over time. In a first attempt to reconcile this traditional theory with our observations we
postulate what we will term here a sequential equilibrium partitioning model (S-EPM). We
emphasize that this is a conceptual model meant to demonstrate that traditional absorptive
partitioning theory is not the only theory capable of describing aerosol growth experiments and
that the S-EPM is not a definitive physical representation of the processes occurring in the
experiments described here. The primary feature of the S-EPM that distinguishes it from
traditional partitioning theory is that it is assumed that the aerosol is rapidly converted from an
absorbing to a non-absorbing phase that does not participate in subsequent equilibrium
partitioning. Aerosol growth in the S-EPM is modeled in a step-wise manner wherein the amount
of material available for partitioning at every step in the simulation depends only on the available
gas-phase material at that step since it is assumed that the OA formed in any previous step has
been converted into non-absorptive material (i.e. glass) and is thus unavailable for partitioning.
This can be thought of as allowing for the sequential formation of absorptive OA “shells” on top
17
of a non-absorptive OA “core,” and where the shells are continuously being converted into non-
absorbing (e.g. glassy) OA. (The concept of ‘core’ and ‘shell’ allows for easy visualization of the
process; however, we are not implying that the actual growth process must occur in this
particular manner.) The S-EPM is therefore relevant to the above argument that absorbing (i.e.
low viscosity) material is being converted to non-absorbing, glassy (i.e. high viscosity) material
on some timescale. Because the S-EPM assumes that this process is occurring nearly
instantaneously, the conversion process will directly influence the gas-particle partitioning
behavior relative to traditional equilibrium models.
Consider a typical laboratory experiment in which a gas-phase organic compound is reacted with
some oxidant (e.g. O3, OH, NO3). In the initial stages of the experiment, some small amount of
hydrocarbon reacts (ΔHC) to produce a certain quantity of lower volatility products. The relative
amount of any given reaction product depends upon the gas-phase yield of that compound. This
newly produced gas-phase material can then partition to a new particle phase, leaving behind
some amount of the gas-phase material that depends on the vapor pressure for that compound. In
the S-EPM, it is assumed that the material that condensed to the particle phase in this step is
“lost” from the system and does not influence partitioning in the next step, i.e. is converted to
non-absorbing (non-partitioning) material (cf. Fig. 5a). In the next step, further hydrocarbon is
reacted, producing more gas-phase material. The total material available for partitioning in this
step is then the sum of the newly formed gas-phase material from reaction and the material from
the previous step that did not condense (i.e. the residual gas-phase material). For compounds that
partition strongly to the particle phase, the new total is effectively equal to only the material
produced from gas-phase reactions while for compounds that weakly partition to the particle
18
phase the total is equal to the sum of the newly produced and residual gas-phase material.
Overall, this can be expressed as:
, (2)
, (3)
, (4)
where is the gas-phase concentration produced from reaction of the parent hydrocarbon, αi
is the gas-phase yield, is the residual gas-phase concentration, Ctot,i is the total concentration
of material available for partitioning, Cp,i is the particle-phase concentration, i indicates different
components and n indicates the step. Note that the total material available for partitioning at a
given step, Ctot,i,n, is just the gas-phase material because we have assumed that the particle phase
material from previous steps has become non-absorbing and is therefore no longer counted in the
total. At each step the newly formed particle phase material is then:
(5)
(6)
where is the saturation concentration of compound i and COA,n only includes the absorptive
material. The total OA produced throughout the experiment is then:
. (7)
19
The sequential absorption model has been tested to determine to what extent it is consistent with
laboratory aerosol growth experiments, which universally show that the aerosol yield increases
non-linearly with increasing COA,tot (where the aerosol yield is defined as COA,tot/ΔHCtot and
ΔHCtot is the total reacted hydrocarbon, i.e. the sum of the ΔHCn values). Here, the S-EPM has
been developed following from the aerosol basis-set framework, wherein the compounds are
represented in logarithmically spaced bins with respect to their saturation concentrations
(Donahue et al., 2006). The only adjustable parameters are the αi yield values for each
component in the basis-set since the products are assumed to be non-reactive. As a specific test-
case, we use the aerosol yield measurements for αP aerosol determined from a number of
different studies as presented by Pathak et al. (2007a): Hoffman et al. (1998), Griffin et al. (1999),
Cocker et al. (2001), Presto et al. (2006), and Pathak et al. (2007b). A 6-product volatility basis-set,
ranging from C* = 10-2 to 103 µg/m3, has been used and αi values determined by minimizing the
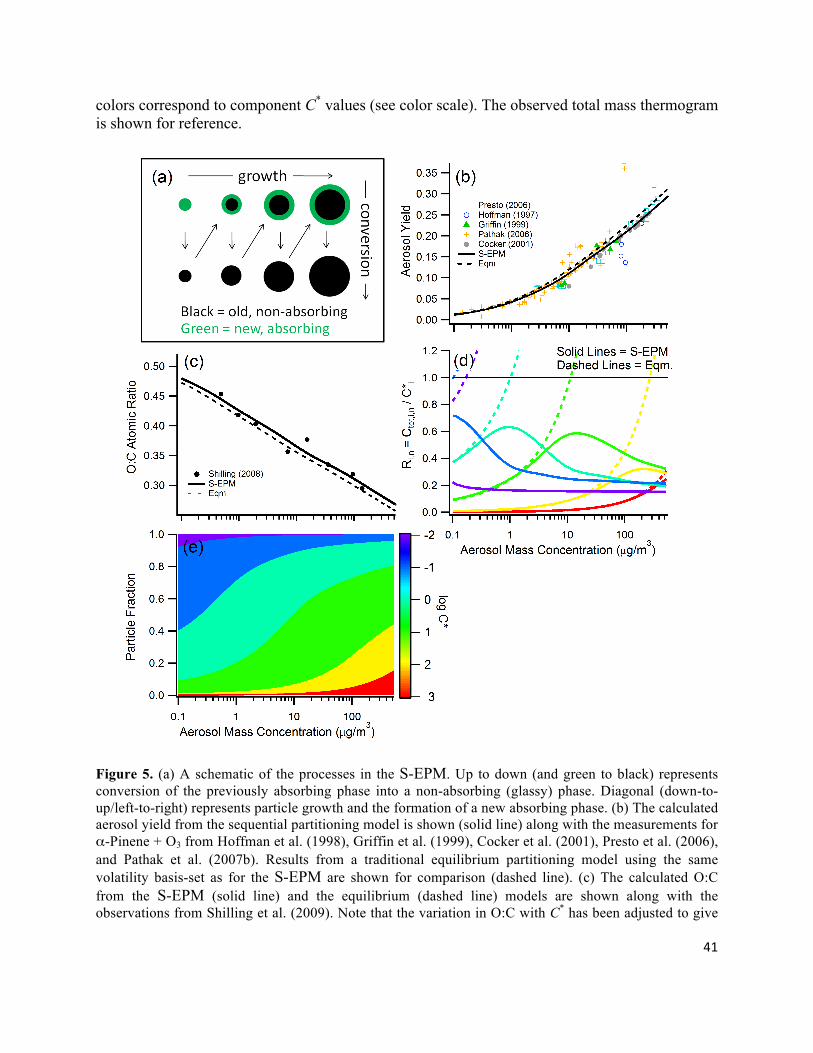
residual between the calculated and measured aerosol yield. The S-EPM is capable of explaining
the aerosol yield observations (Fig. 5b), with a best-fit αi basis-set = {0.001, 0.012, 0.045, 0.11,
0.10, 0.18}. Note that the calculated aerosol yield curves are nearly insensitive to the ΔHCn step
size used, although the calculated amount of added aerosol mass at each step (COA,n) is sensitive
to the ΔHCn used, with smaller COA,n corresponding to smaller ΔHCn values.
The evolution of the fractional contributions of the individual components to the total aerosol
mass as a function of COA,tot provides some insights into how the particle composition will
change. As expected, at low COA,tot the composition is dominated by the lower volatility material
and, as COA,tot increases, the contributions of the higher volatility material increase (Fig. 5e).
Comparison with the calculated total (gas + particle) concentration of each compound relative to
20
the saturation concentration of that compound (Ri,n = Ctot,i,n/C*i) indicates that this ratio is a
primary factor driving the evolution of the particle composition (Fig. 5d). Recalling that the
definition of Ctot,i,n excludes the OA that has been converted to non-absorbing material, the
variation of Ri,n for the S-EPM is seen to be quite different than for the traditional model, in
which Ri,n continuously increases as more material is produced from gas-phase oxidation of the
parent compound (Fig. 5d). The specific shape of the Ri,n vs. COA trajectories for the S-EPM
results from a balance between production of new gas-phase material and the loss of condensed-
phase material via conversion to the non-absorbing phase. The fraction that will partition to the
condensed-phase at any step is governed both by the individual C*i values and the available Ctot,i
(the combination of which determines the amount of newly formed OA; cf. Eqns. 1 and 6). As
Ctot,i,n increases for a given component, more of that component will go to the condensed phase
in a given step, and thus a greater fraction will be ‘lost’ via conversion to a non-absorbing phase.
When the fraction of an individual component that partitions to the condensed-phase in a given
step is less than 50%, Ctot,i, will build up with each step. However, once that fraction exceeds
50%, material is lost to the conversion process faster than it is formed from gas-phase reactions,
and accordingly Ri,n begins to decrease.
This variation in the overall particle composition with COA,tot can be used to examine how, for
example, the particle O:C ratio might change as a function of COA,tot during growth experiments,
as was measured by Shilling et al. (2009). Here, we assume that any condensed-phase reactions
that occur preserve the overall O:C, which is equivalent to saying that there is no mass-loss from
the particle due to any such reactions. However, even if the compounds were to lose their
chemical identity during the conversion process, an assumption of no mass loss means that the
overall O:C can be determined by keeping track of the variation in the individual components;
21
. (8)
If it is assumed that O:C for the binned components varies linearly with log C*, with higher O:C
corresponding to lower C* components, then it is possible to match the observations from
Shilling et al. (2009) (Figure 5c). The specific relationship determined here was O:C = -0.025 +
0.11(4-log C*), which yields values reasonably similar to those derived by Shilling et al. (2009)
using a 4-product equilibrium partitioning model. Thus, the S-EPM is capable of explaining OA
growth experiments in terms of both the observed mass yields and O:C values.
The results from the S-EPM can be compared to a traditional equilibrium absorption model, in
which the entire OA mass influences the partitioning at every step. For the same αi basis-set as
determined for the S-EPM the aerosol yield curve for the traditional model gives very similar
results, with only a slightly higher aerosol yield for a given COA,tot (Fig. 5b). Thus, in the context
of aerosol growth experiments these two models do not differ significantly in terms of the
derived αi basis-sets. The difference is primarily that, in the S-EPM, incorporation of the higher
volatility components is delayed until their abundance is larger (i.e. more of the parent
hydrocarbon has reacted) because there is only a small amount of condensed-phase material
available into which it can partition at any given step and the actual concentration is too far
below the saturation concentration (Fig. 5d). This suggests that the production rate of the
individual components from gas-phase reactions is an important controlling factor. However,
even though the S-EPM and the traditional model yield essentially the same results (e.g.
volatility basis-sets), the key feature is that there will be a real difference in the physical outcome
for the OA, as the S-EPM model allows for formation of OA in which much of the OA mass is
22
non-absorbing and, perhaps, glassy. Subsequent evaporation of the OA formed from the
traditional model and the S-EPM, induced either by dilution or heating, may therefore proceed
along different paths than would be predicted using the αi/volatility basis-sets determined from
the growth experiments. In other words, although it is possible to describe OA growth through
equilibrium partitioning theory the thus derived properties may not ultimately provide an
accurate description of the effective thermodynamic properties of the formed OA.
One potential difficulty associated with applying the S-EPM to the interpretation of the αP
results in this study is that the S-EPM, unlike the equilibrium model, could lead to a situation
where the thus formed particles are composed of sequential layers that have differing
composition, with a greater fractional amount of higher volatility material in the outer layers than
in the inner layers. This is a result of the “shell-by-shell” formation in the S-EPM, whereas in the
equilibrium model it is assumed that the particles are well-mixed at all times. (Although we note
that there is nothing inherent to the S-EPM that requires shell-by-shell formation, only that the
absorbing material is converted to a non-absorbing phase.) However, the observations suggest
that the αP particles are homogeneous, yet highly viscous such that the particle composition does
not change during evaporation. As such, we reiterate that the S-EPM is not meant to provide an
exact representation of the physical processes that actually occur in our experiments, but only to
demonstrate that aerosol growth measurements can be modeled within a conceptual framework
that allows for transformation of the particles from a liquid-like to glassy phase on some
timescale.
23
3.5 Comparison with literature observations
3.5.1 Laboratory experiments Our observations of αP aerosol evaporation indicate that the individual compounds comprising
the aerosol are not distilled from the particles according to their volatility as they are heated.
However, not all laboratory-generated OA appears to behave in this manner. For example, the
work by Ziemann and co-workers indicates that many gas-phase reactions lead to secondary OA
in which distillation occurs while other reactions are more consistent with the observations
presented here (Docherty et al., 2005;Gong et al., 2005;Lim and Ziemann, 2005, 2009). For
example, their experiments using αP aerosol (formed with cyclohexane, an OH radical
scavenger, present) show the OA to have very low volatility components, similar to the
observations presented here, but, in contrast, they also observed evidence for distillation in their
mass thermograms (Docherty et al., 2005).
Kostenidou et al. (2009) measured mass spectra of αP aerosol behind a TD using an EI-AMS.
Depending on the explicit conditions (high vs. low NOx, low vs. high RH), they found some
variation in the observed mass spectrum with TTD, which suggests chemical changes upon
heating, inconsistent with our observations. However, the αP aerosol in their experiments was
overall significantly more volatile than in our experiments, as evidenced by the VFR falling to
0.1 by 60-70°C in their experiments compared to around 120°C in ours (for approximately the
same TD residence time, but with an initial COA ~ 5-10 times smaller in their experiments),
which indicates that the αP particles in these experiments may not be directly comparable. Our
VFR vs. TTD observations for αP aerosol are, however, consistent with results from smog-
chamber experiments by Huffman et al. (2009b) (with the same residence time and similar COA
as here). Besides the different COA, a difference between the Kostenidou et al. results and ours
24
and the Huffman et al. results is that Kostenidou et al. used an OH scavenger. In addition to
modifying the chemistry that occurs in the gas-phase, the presence of OH radicals could lead to
heterogeneous reactions that could modify the particle composition directly (e.g. Smith et al.,
2009). However, large differences between mass thermograms measured for αP + O3 aerosol
formed with/without an OH scavenger present have not been observed (Jonsson et al., 2007),
which suggests that the presence/absence of an OH scavenger may not be the main reason for the
observed differences in the VFR curves. Finally, another difference is that in the Kostenidou et
al. (2009) experiments the αP aerosol was formed over many hours in a smog chamber whereas
our αP aerosol was formed in a few minutes in a flow tube (the Huffman et al. (2009b) αP
aerosol was also formed over many hours). Certainly, there remains an unexplained
inconsistency as these different experiments all probed αP aerosol evaporation over similar
timescales in a TD.
Shilling et al. (2009) investigated how the O:C atomic ratio of αP particles varied with mass
loading for aerosol growth experiments, finding that O:C at very low mass loadings was larger
than at high loadings. Although their experiments showed that the composition of αP particles
does vary with mass loading, Shilling et al. determined how composition varied with increasing
mass loading (i.e. as the particles grew) and not how composition changed once already formed
particles evaporated; thus, our experiments may not be directly comparable. Nonetheless, our
VUV-AMS measurements provide compelling evidence that under some cases OA volatility
does not follow from traditional partitioning theory. Our overall conclusion, that the αP SOA
exists as an amorphous solid while the LO aerosol is liquid-like, is consistent with the
25
observations of Virtanen et al. (2010) who concluded based on measurements of particle bounce
that biogenic SOA (similar to the αP SOA here) was glassy.
3.5.2 Field observations Comparison of our laboratory results with field observations is somewhat challenging because of
the complications introduced by the ambient OA potentially existing as an external mixture of
different OA aerosol types. With an external mixture, it is possible that T-dependent changes to
the observed total OA spectrum could be driven by differences in volatility between externally
mixed OA types and not by chemical changes within a specific (internally mixed) aerosol type.
With this caveat in mind, we find that our laboratory observations for αP aerosol are generally
consistent with recent ambient observations of T-dependent OA mass spectra during the FAME-
2008 campaign (Hildebrandt et al., 2010), wherein statistically insignificant differences in the
average OA mass spectrum were observed between ambient temperature and TTD = 110°C or
145°C. The total OA mass during FAME-2008 was dominated by highly oxygenated organic
aerosol (OOA; O:C ~ 0.77) with no measurable contribution from “hydrocarbon-like” OA
(HOA). In contrast, during the SOAR and MILAGRO campaigns, variations in the campaign
average O:C ratio for OA with TTD were observed (Huffman et al., 2009a), which could be
interpreted as indicating distillation of compounds with lower O:C (and presumably higher
volatility) from the OA particles occurred. However, we find that the variation in O:C with TTD
during these two campaigns can be reasonably well explained if one assumes that the various
identified OA types (e.g. HOA, OOA, etc.) have a T-independent (but unique) O:C but where the
fractional contribution of each component varies with temperature (Appendix A). As such, the
variation in O:C with TTD during MILAGRO and SOAR may be driven by changes in the
26
relative amount of each aerosol type and not necessarily by changes in the chemical makeup of
each aerosol type.
The volatility of the ambient OA observed during MILAGRO as deduced from tandem TD-AMS
experiments has recently been quantified under the assumption that the OA was describable
through absorptive partitioning theory (i.e. was liquid-like in nature) (Cappa and Jimenez, 2010).
It was demonstrated that a significant fraction of the OA could be considered “non-volatile,” and
that the ambient OA was significantly less volatile than typical laboratory-generated SOA.
However, if the ambient OA did not actually behave as a liquid-like mixture of compounds, but
instead as a glassy substance akin to the αP particles considered here and in Virtanen et al.
(2010), then the interpretation in terms of partitioning theory is not physically justifiable even
though the data may be well represented. This does not necessarily mean that ambient OA
volatility cannot be parameterized as a 1, 2 … n component system within the framework of
partitioning theory, only that the derived properties may not have a readily interpretable physical
or chemical meaning.
3.5.3 The evaporation coefficient Above, we used a kinetic model of aerosol evaporation in a TD (Cappa, 2010) to deduce that the
evaporation coefficient for LO aerosol is on the order of 0.5 (0.1 < γe < 1). However, it has
previously been suggested based on room-temperature isothermal dilution experiments that the
evaporation coefficient, γe, for LO aerosol is 0.001-0.01 (Grieshop et al., 2009). Our results are
inconsistent with such a low value for γe for LO aerosol. Additionally, we observed that the LO
particles evaporated significantly in the activated carbon denuder section of the TD. Using the
volatility distribution given by Grieshop et al. (2009) for diesel aerosol, we calculate that if γe <
27
0.01 then the VFR for LO aerosol at ambient temperature should have remained above 0.98,
which is also inconsistent with our observations..
In a separate study using the same isothermal dilution methodology, Grishop et al. (2007) also
determined that 0.001 < γe < 0.01 for αP aerosol. In this case, we similarly find that the effective
γe for αP aerosol is significantly less than 1, with γe = 10-4 based on the TD measurements. The
reason for the very different level of agreement between the LO and αP aerosol in our TD
experiments compared to the isothermal dilution experiments (Grieshop et al., 2007;Grieshop et
al., 2009) is not clear, although could be related to the timescales associated with evaporation vs.
loss of gas-phase species to the chamber walls (Loza et al., 2010;Matsunaga and Ziemann,
2010). We note that if our results for the LO aerosol are correct, this calls into question the
robustness of the methodology used by Grieshop et al. to estimate γe values in general (Grieshop
et al., 2007;Grieshop et al., 2009).
4 Implications The formation and evolution of OA in the atmosphere has traditionally been described through
equilibrium partitioning theory. However, our results suggest that the thermodynamic properties
of OA as deduced from aerosol yield experiments may not be directly applicable to the thus
formed OA. In particular, it appears that the volatility of SOA may be significantly lower than
would be expected from the aerosol yield experiments. This suggests that SOA in the atmosphere
may then exhibit a significantly lower sensitivity, or at least a significantly slower response, to
dilution and changes in temperature than expected. In the limit of considering the SOA to be
completely non-volatile at typical ambient temperatures, this would therefore allow for a much
28
greater amount of SOA to be preserved downwind of strong sources because the SOA would not
evaporate upon dilution. However, at the same time our results suggest that POA (here, in the
form of LO aerosol) would be quite sensitive to dilution and thus POA mass concentrations
would decrease from evaporation upon dilution (in addition to the influence of dilution itself).
Volkamer et al. (2006) found that the magnitude of the discrepancy between model and
measured SOA increases with photochemical age. To the extent that photochemical age is
correlated with dilution, having a non-volatile (or very low volatility) SOA would push model
estimates up, thus helping to reduce the model/measurement discrepancy. Consider, for example,
the 2-product volatility of αP aerosol as determined by Griffin et al. (1999), where C1* = 5.84
µg/m3 and C2* = 250 µg/m3 and α1 = 0.038 and α2 = 0.326. If one assumes that enough α-pinene
reacts to produce 10 µg/m3 of OA, dilution by a factor of 2 would cause the OA concentration to
decrease to 0.5 µg/m3, where evaporation has caused a further loss of 90% of the OA mass (4.5
µg/m3 out of the 5 µg/m3 remaining after dilution). However, if the volatility of the αP were
much lower, then the actual loss of OA mass from dilution would decrease by a significant
amount. Finally, the slower diffusion in a glassy particle compared to a liquid-like particle could
strongly affect the processes and timescales associated with heterogeneous chemical reactions on
SOA particles (Zahardis and Petrucci, 2007).
Appendix A: Ambient O:C atomic ratios
The O:C values as a function of TTD during SOAR and MILAGRO have been estimated using
the data presented in Huffman et al. (Huffman et al., 2009a). For simplicity, the analysis has
29
been limited to considering the total OA to only be comprised of three distinct OA types, or
factors: a hydrocarbon-like OA (HOA), a low-volatility oxygenated OA (LV-OOA) and a high-
volatility oxygenated OA (HV-OOA). Other component factors (e.g. biomass burning OA or
“local” OA) were assumed to have the same properties as HOA. The relative amounts of the
HOA, LV-OOA and HV-OOA components at each TTD were determined from Figure S8 in
Huffman et al. (2009a). The average O:C was then calculated by multiplying each of the relative
OA contributions by the O:C for that factor and summing:
(A1)
where fi is the fractional amount of each factor at each TTD and O:Ci is the O:C for each factor.
We assume that O:Ci for each factor is temperature independent. The difference between the
observed O:C and the calculated O:C was minimized at all temperatures to determine an
effective O:Ci for the LV-OOA and HV-OOA components, and HOA was assumed to be 0.1 (Ng
et al., 2010). This results in derived O:C values for the LV-OOA component of 0.56
(MILAGRO) and 0.69 (SOAR) and for the HV-OOA component of 0.45 (MILAGRO) and 0.21
(SOAR). The values deduced here for SOAR are similar to those reported by Ng et al. (Ng et al.,
2010); 0.84 (LV-OOA) and 0.26 (HV-OOA). No comparable values are available for
MILAGRO, although the average OOA O:C was ~0.53 (Ng et al., 2010), consistent with our
finding.
Acknowledgements
30
The authors thank Jared Smith for his help in executing the experiments, Paul Ziemann, Jesse
Kroll and Tim Onasch for use of the thermodenuder and the staff at the Chemical Dynamics
Beamline for experimental assistance. The Advanced Light Source is supported by the Director,
Office of Science, Office of Basic Energy Sciences, of the U.S. Department of Energy under
Contract No. DE-AC02-05CH11231.
References
An, W. J., Pathak, R. K., Lee, B. H., and Pandis, S. N.: Aerosol volatility measurement using an improved
thermodenuder: Application to secondary organic aerosol, J. Aerosol. Sci., 38, 305-314, 2007.
Cappa, C. D., Lovejoy, E. R., and Ravishankara, A. R.: Evidence for liquid-like and nonideal behavior of
a mixture of organic aerosol components, Proceed. Natl. Acad. Sci. U. S. A., 105, 18687-18691, doi:
10.1073/pnas.0802144105, 2008.
Cappa, C. D.: A model of aerosol evaporation kinetics in a thermodenuder, Atmos. Meas. Technol., 3,
579-592, doi:10.5194/amt-3-579-2010, 2010.
Cappa, C. D., and Jimenez, J. L.: Quantitative estimates of the volatility of ambient organic aerosol,
Atmos. Chem. Phys., 10, 5409-5424, doi:10.5194/acp-10-5409-2010, 2010.
Cocker, D. R., Clegg, S. L., Flagan, R. C., and Seinfeld, J. H.: The effect of water on gas-particle
partitioning of secondary organic aerosol. Part I: alpha-pinene/ozone system, Atmos. Environ., 35, 6049-
6072, 2001.
Docherty, K. S., Wu, W., Lim, Y. B., and Ziemann, P. J.: Contributions of organic peroxides to secondary
aerosol formed from reactions of monoterpenes with O3, Environ. Sci. Technol., 39, 4049-4059, doi:
10.1021/es050228s, 2005.
31
Donahue, N. M., Robinson, A. L., Stanier, C. O., and Pandis, S. N.: Coupled partitioning, dilution, and
chemical aging of semivolatile organics, Environ. Sci. Technol., 40, 2635-2643, doi: 10.1021/es052297c,
2006.
Dzepina, K., Volkamer, R. M., Madronich, S., Tulet, P., Ulbrich, I. M., Zhang, Q., Cappa, C. D.,
Ziemann, P. J., and Jimenez, J. L.: Evaluation of recently-proposed secondary organic aerosol models for
a case study in Mexico City, Atmos. Chem. Phys., 9, 5681-5709, doi:10.5194/acp-9-5681-2009, 2009.
Epstein, S. A., Riipinen, I., and Donahue, N. M.: A Semiempirical Correlation between Enthalpy of
Vaporization and Saturation Concentration for Organic Aerosol, Environ. Sci. Technol., 44, 743-748, doi:
10.1021/es902497z, 2009.
Gao, Y., Hall, W. A., and Johnston, M. V.: Molecular Composition of Monoterpene Secondary Organic
Aerosol at Low Mass Loading, Environ. Sci. Technol., ASAP article, doi: 10.1021/es101861k, 2010.
Gong, H. M., Matsunaga, A., and Ziemann, P. J.: Products and mechanism of secondary organic aerosol
formation from reactions of linear alkenes with NO3 radicals, J. Phys. Chem. A, 109, 4312-4324, 2005.
Grieshop, A. P., Donahue, N. M., and Robinson, A. L.: Is the gas-particle partitioning in alpha-pinene
secondary organic aerosol reversible?, Geophys. Res. Lett., 34, L14810, doi:10.1029/2007GL029987,
2007.
Grieshop, A. P., Miracolo, M. A., Donahue, N. M., and Robinson, A. L.: Constraining the Volatility
Distribution and Gas-Particle Partitioning of Combustion Aerosols Using Isothermal Dilution and
Thermodenuder Measurements, Environ. Sci. Technol., 43, 4750-4756, doi: 10.1021/es8032378, 2009.
Griffin, R. J., Cocker, D. R., Flagan, R. C., and Seinfeld, J. H.: Organic aerosol formation from the
oxidation of biogenic hydrocarbons, J. Geophys. Res.-Atmos, 104, 3555-3567,
doi:10.1029/1998JD100049, 1999.
Heald, C. L., Jacob, D. J., Park, R. J., Russell, L. M., Huebert, B. J., Seinfeld, J. H., Liao, H., and Weber,
R. J.: A large organic aerosol source in the free troposphere missing from current models, Geophys. Res.
Lett., 32, L18809, doi:18810.11029/12005GL023831, 2005.
32
Hildebrandt, L., Engelhart, G. J., Mohr, C., Kostenidou, E., Lanz, V. A., Bougiatioti, A., DeCarlo, P. F.,
Prevot, A. S. H., Baltensperger, U., Mihalopoulos, N., Donahue, N. M., and Pandis, S. N.: Aged organic
aerosol in the Eastern Mediterranean: the Finokalia Aerosol Measurement Experiment – 2008, Atmos.
Chem. Phys., 10, 4167-4186, doi:10.5194/acpd-10-1847-2010, 2010.
Hoffmann, T., Bandur, R., Marggraf, U., and Linscheid, M.: Molecular composition of organic aerosols
formed in the α-pinene/O3 reaction: Implications for new particle formation processes, J. Geophys. Res.-
Atmos, 103, 25569-25578, doi:10.1029/98JD01816, 1998.
Huffman, J. A., Ziemann, P. J., Jayne, J. T., Worsnop, D. R., and Jimenez, J. L.: Development and
characterization of a fast-stepping/scanning thermodenuder for chemically-resolved aerosol volatility
measurements, Aerosol Sci. Technol., 42, 395-407, 2008.
Huffman, J. A., Docherty, K. S., Aiken, A. C., Cubison, M. J., Ulbrich, I. M., DeCarlo, P. F., Sueper, D.,
Jayne, J. T., Worsnop, D., Ziemann, P. J., and Jimenez, J. L.: Chemically-Resolved volatility
measurments from two megacity field studies, Atmos. Chem. Phys., 9, 7161-7182, doi:10.5194/acp-9-
7161-2009, 2009a.
Huffman, J. A., Docherty, K. S., Mohr, C., Cubison, M. J., Ulbrich, I. M., Ziemann, P. J., Onasch, T. B.,
and Jimenez, J. L.: Chemically-Resolved Volatility Measurements of Organic Aerosol from Different
Sources, Environ. Sci. Technol., 43, 5351-5357, 2009b.
IPCC: Climate Change: The Physical Science Basis - Contribution of Working Group I to the Fourth
Assessment Report of the Intergovernmental Panel on Climate Change, edited by: Solomon, S., Qin, D.,
and Manning, M., Cambridge University Press, Cambridge, 996 pp., 2007.
Jonsson, A. M., Hallquist, M., and Saathoff, H.: Volatility of secondary organic aerosols from the ozone
initiated oxidation of alpha-pinene and limonene, J. Aerosol. Sci., 38, 843-852, 2007.
Kostenidou, E., Lee, B. H., Engelhart, G. J., Pierce, J. R., and Pandis, S. N.: Mass Spectra Deconvolution
of Low, Medium, and High Volatility Biogenic Secondary Organic Aerosol, Environ. Sci. Technol., 43,
4884-4889, doi: 10.1021/es803676g, 2009.
33
Lane, T. E., Donahue, N. M., and Pandis, S. N.: Simulating secondary organic aerosol formation using the
volatility basis-set approach in a chemical transport model, Atmos. Environ., 42, 7439-7451, doi:
10.1016/j.atmosenv.2008.06.026, 2008.
Lim, Y. B., and Ziemann, P. J.: Products and mechanism of secondary organic aerosol formation from
reactions of n-alkanes with OH radicals in the presence of NOx, Environ. Sci. Technol., 39, 9229-9236,
doi: 10.1021/es051447g, 2005.
Lim, Y. B., and Ziemann, P. J.: Chemistry of Secondary Organic Aerosol Formation from OH Radical-
Initiated Reactions of Linear, Branched, and Cyclic Alkanes in the Presence of NOx, Aerosol Sci.
Technol., 43, 604-619, 2009.
Loza, C. L., Chan, A. W. H., Galloway, M. M., Keutsch, F. N., Flagan, R. C., and Seinfeld, J. H.:
Characterization of Vapor Wall Loss in Laboratory Chambers, Environ. Sci. Technol., 44, 5074-5078,
doi: 10.1021/es100727v, 2010.
Marcolli, C., Luo, B. P., and Peter, T.: Mixing of the organic aerosol fractions: Liquids as the
thermodynamically stable phases, J. Phys. Chem. A, 108, 2216-2224, 2004.
Matsunaga, A., and Ziemann, P. J.: Gas-Wall Partitioning of Organic Compounds in a Teflon Film
Chamber and Potential Effects on Reaction Product and Aerosol Yield Measurements, Aerosol Sci.
Technol., 44, 881-892, doi: 10.1080/02786826.2010.501044, 2010.
Murray, B. J.: Inhibition of ice crystallisation in highly viscous aqueous organic acid droplets, Atmos.
Chem. Phys., 8, 5423-5433, doi:10.5194/acp-8-5423-2008, 2008.
Murray, B. J., Wilson, T. W., Dobbie, S., Cui, Z., Al-Jumur, S. M. R. K., Mohler, O., Schnaiter, M.,
Wagner, R., Benz, S., Niemand, M., Saathoff, H., Ebert, V., Wagner, S., and Karcher, B.: Heterogeneous
nucleation of ice particles on glassy aerosols under cirrus conditions, Nature Geosci, 3, 233-237, 2010.
Mysak, E. R., Wilson, K. R., Jimenez-Cruz, M., Ahmed, M., and Baer, T.: Synchrotron radiation based
aerosol time-of-flight mass spectrometry for organic constituents, Anal. Chem., 77, 5953-5960, 2005.
34
Ng, N. L., Kroll, J. H., Keywood, M. D., Bahreini, R., Varutbangkul, V., Flagan, R. C., Seinfeld, J. H.,
Lee, A., and Goldstein, A. H.: Contribution of first- versus second-generation products to secondary
organic aerosols formed in the oxidation of biogenic hydrocarbons, Environ. Sci. Technol., 40, 2283-
2297, doi: 10.1021/es052269u, 2006.
Ng, N. L., Canagaratna, M. R., Zhang, Q., Jimenez, J. L., Tian, J., Ulbrich, I. M., Kroll, J. H., Docherty,
K. S., Chhabra, P. S., Bahreini, R., Murphy, S. M., Seinfeld, J. H., Hildebrandt, L., Donahue, N. M.,
DeCarlo, P. F., Lanz, V. A., Prevot, A. S. H., Dinar, E., Rudich, Y., and Worsnop, D. R.: Organic aerosol
components observed in Northern Hemispheric datasets from Aerosol Mass Spectrometry, Atmos. Chem.
Phys., 10, 4625-4641, doi:10.5194/acp-10-4625-2010, 2010.
Odum, J. R., Hoffmann, T., Bowman, F., Collins, D., Flagan, R. C., and Seinfeld, J. H.: Gas/particle
partitioning and secondary organic aerosol yields, Environ. Sci. Technol., 30, 2580-2585, 1996.
Pankow, J. F.: An Absorption-Model of the Gas Aerosol Partitioning Involved in the Formation of
Secondary Organic Aerosol, Atmos. Environ., 28, 189-193, 1994.
Pathak, R. K., Presto, A. A., Lane, T. E., Stanier, C. O., Donahue, N. M., and Pandis, S. N.: Ozonolysis of
α-pinene: parameterization of secondary organic aerosol mass fraction, Atmos. Chem. Phys., 7, 3811-
3821, doi:10.5194/acp-7-3811-2007, 2007a.
Pathak, R. K., Stanier, C. O., Donahue, N. M., and Pandis, S. N.: Ozonolysis of alpha-pinene at
atmospherically relevant concentrations: Temperature dependence of aerosol mass fractions (yields), J.
Geophys. Res.-Atmos, 112, D03201, doi:10.1029/2006JD007436, 2007b.
Pope, C. A., Ezzati, M., and Dockery, D. W.: Fine-Particulate Air Pollution and Life Expectancy in the
United States, New England Journal of Medicine, 360, 376-386, doi:10.1056/NEJMsa0805646, 2009.
Presto, A. A., and Donahue, N. M.: Investigation of alpha-pinene plus ozone secondary organic aerosol
formation at low total aerosol mass, Environ. Sci. Technol., 40, 3536-3543, doi: 10.1021/es052203z,
2006.
35
Robinson, A. L., Donahue, N. M., Shrivastava, M. K., Weitkamp, E. A., Sage, A. M., Grieshop, A. P.,
Lane, T. E., Pierce, J. R., and Pandis, S. N.: Rethinking organic aerosols: Semivolatile emissions and
photochemical aging, Science, 315, 1259-1262, 2007.
Saleh, R., Shihadeh, A., and Khlystov, A.: On transport phenomena and equilibration time scales in
thermodenuders, Atmos. Meas. Tech. Discuss., 3, 2931-2960, doi:10.5194/amtd-3-2931-2010, 2010.
Shilling, J. E., Chen, Q., King, S. M., Rosenoern, T., Kroll, J. H., Worsnop, D. R., DeCarlo, P. F., Aiken,
A. C., Sueper, D., Jimenez, J. L., and Martin, S. T.: Loading-dependent elemental composition of alpha-
pinene SOA particles, Atmos. Chem. Phys., 9, 771-782, doi:10.5194/acp-9-771-2009, 2009.
Shu, J. N., Wilson, K. R., Ahmed, M., and Leone, S. R.: Coupling a versatile aerosol apparatus to a
synchrotron: Vacuum ultraviolet light scattering, photoelectron imaging, and fragment free mass
spectrometry, Rev. Sci. Instrum., 77, 043106-, 2006.
Smith, J. D., Kroll, J. H., Cappa, C. D., Che, D. L., Liu, C. L., Ahmed, M., Leone, S. R., Worsnop, D. R.,
and Wilson, K. R.: The heterogeneous reaction of hydroxyl radicals with sub-micron squalane particles: a
model system for understanding the oxidative aging of ambient aerosols, Atmos. Chem. Phys., 9, 3209-
3222, doi:10.5194/acp-9-3209-2009, 2009.
Smith, R. S., and Kay, B. D.: The existence of supercooled liquid water at 150 K, Nature, 398, 788-791,
1999.
Vaden, T. D., Song, C., Zaveri, R. A., Imre, D., and Zelenyuk, A.: Morphology of mixed primary and
secondary organic particles and the adsorption of spectator organic gases during aerosol formation,
Proceed. Natl. Acad. Sci. U. S. A., 107, 6658-6663, doi: 10.1073/pnas.0911206107, 2010.
Virtanen, A., Joutsensaari, J., Koop, T., Kannosto, J., Yli-Pirila, P., Leskinen, J., Makela, J. M.,
Holopainen, J. K., Poschl, U., Kulmala, M., Worsnop, D. R., and Laaksonen, A.: An amorphous solid
state of biogenic secondary organic aerosol particles, Nature, 467, 824-827, 2010.
Volkamer, R., Jimenez, J. L., San Martini, F., Dzepina, K., Zhang, Q., Salcedo, D., Molina, L. T.,
Worsnop, D. R., and Molina, M. J.: Secondary organic aerosol formation from anthropogenic air
36
pollution: Rapid and higher than expected, Geophys. Res. Lett., 33, L17811, doi:10.1029/2006GL026899,
2006.
Yu, J. Z., Cocker, D. R., Griffin, R. J., Flagan, R. C., and Seinfeld, J. H.: Gas-phase ozone oxidation of
monoterpenes: Gaseous and particulate products, J. Atmos. Chem., 34, 207-258, 1999.
Zahardis, J., and Petrucci, G. A.: The oleic acid-ozone heterogeneous reaction system: products, kinetics,
secondary chemistry, and atmospheric implications of a model system - a review, Atmos. Chem. Phys., 7,
1237-1274, doi:10.5194/acp-7-1237-2007, 2007.
Zhang, Q., Jimenez, J. L., Canagaratna, M. R., Allan, J. D., Coe, H., Ulbrich, I., Alfarra, M. R., Takami,
A., Middlebrook, A. M., Sun, Y. L., Dzepina, K., Dunlea, E., Docherty, K., DeCarlo, P. F., Salcedo, D.,
Onasch, T., Jayne, J. T., Miyoshi, T., Shimono, A., Hatakeyama, S., Takegawa, N., Kondo, Y., Schneider,
J., Drewnick, F., Borrmann, S., Weimer, S., Demerjian, K., Williams, P., Bower, K., Bahreini, R.,
Cottrell, L., Griffin, R. J., Rautiainen, J., Sun, J. Y., Zhang, Y. M., and Worsnop, D. R.: Ubiquity and
dominance of oxygenated species in organic aerosols in anthropogenically-influenced Northern
Hemisphere midlatitudes, Geophys. Res. Lett., 34, L13801, doi:10.1029/2007GL029979 2007.
Zobrist, B., Marcolli, C., Pedernera, D. A., and Koop, T.: Do atmospheric aerosols form glasses?, Atmos.
Chem. Phys., 8, 5221-5244, doi:10.5194/acp-8-5221-2008, 2008.
37
Figure 1. Mass thermograms for LO aerosol (), αP aerosol () and the LO/αP mixture (). In the mixed particles, the LO is observed to disappear rapidly as temperature is increased while the αP spectrum remains nearly unchanged.
38
Figure 2. VUV mass spectra of thermodenuded OA are shown as a function of the thermodenuder temperature (red). The spectrum of the particles through the bypass line is shown for reference (black). (a) Spectra for αP particles, normalized to the peak at m/z = 98. (b) Spectra for LO particles, normalized to the range m/z = 370-380. (c) Spectra for mixed LO + αP particles, normalized to the peak at m/z = 98. For reference, spectra for αP aerosol (blue) and LO aerosol (green) are shown individually. Note the break in the x-axis and also that the spectral intensity in the right graph (m/z = 260-415) has been multiplied by a factor of 4 relative to the left graph (m/z = 55-200).
39
Figure 3. (a) Total mass thermograms (blue) from SMPS (open squares) and VUV intensity (filled circles) measurements and peak thermograms for every m/z from m/z = 260 to 477 amu (thin lines) for LO particles. Line colors indicate the m/z (see color scale). (b) Same as (a), but where the results from the individual peaks have been binned into narrower mass ranges to illustrate the m/z dependence. (c) Calculated total mass thermograms for model LO aerosol for different values of γe (green). The measured value is shown for reference (blue). (d) Calculated mass thermograms for each model LO component (i.e. different C*) are shown, assuming γe = 0.5. Line colors correspond to the C* values and range from 10-2 to 104 µg/m3. Note that the C* = 103 and 104 µg/m3 components are above the color scale and shown as faded to indicate this. The gray region in panels b, c and d indicates the range over which individual m/z peak thermograms in (a) were observed.
40
Figure 4. (a) The measured individual peak thermograms over the range m/z = 42 – 230 are shown (see color scale) along with the average peak (blue ●) thermogram and the SMPS-derived mass thermogram (blue □) for αP particles. (b) Calculated mass thermograms for low-NOx αP aerosol are shown for different assumed γevap values (see legend). The observed total mass thermogram is shown for reference. (c) Calculated thermograms for the individual C* components assuming that γe = 10-4, indicating that distillation would still be expected. Line
41
colors correspond to component C* values (see color scale). The observed total mass thermogram is shown for reference.
Figure 5. (a) A schematic of the processes in the S-EPM. Up to down (and green to black) represents conversion of the previously absorbing phase into a non-absorbing (glassy) phase. Diagonal (down-to-up/left-to-right) represents particle growth and the formation of a new absorbing phase. (b) The calculated aerosol yield from the sequential partitioning model is shown (solid line) along with the measurements for α-Pinene + O3 from Hoffman et al. (1998), Griffin et al. (1999), Cocker et al. (2001), Presto et al. (2006), and Pathak et al. (2007b). Results from a traditional equilibrium partitioning model using the same volatility basis-set as for the S-EPM are shown for comparison (dashed line). (c) The calculated O:C from the S-EPM (solid line) and the equilibrium (dashed line) models are shown along with the observations from Shilling et al. (2009). Note that the variation in O:C with C* has been adjusted to give
42
good model/measurement agreement. (d) The calculated variation in Ri,n, i.e. the total mass concentration of each compound relative to its saturation concentration, as a function of COA for both the S-EPM (solid lines) and the traditional model (dashed lines). Only material available for partitioning is included in Ctot,i,n. Line colors indicate components with different C*, and are given in the color bar. (e) The relative particle fraction of each compound as a function of COA. Colors correspond to C*.


![Relating aerosol mass spectra to composition and nanostructure of soot particleslup.lub.lu.se/.../54154413/Malmborg_et_al._2019_Carbon.pdf · carbon nanostructure [13,14], hydrogen](https://img.pdfslide.net/doc/110x75/6110bc7c7b716b3cf61b4566/relating-aerosol-mass-spectra-to-composition-and-nanostructure-of-soot-carbon-nanostructure.jpg)