Embed Size (px)
Citation preview
Evolution of Plant Stress Responsiveness:Evolution of Plant Stress Responsiveness:Genome-wide and Gene Family Level AnalysisGenome-wide and Gene Family Level Analysis
Shin-Han ShiuDepartment of Plant Biology
KBS, 1/18, 2008
OutlineOutline
Major interests and why
Gene families and stress responsiveness: The interplay between gene family expansion, duplication
mechanism, and the elusive selection pressure
The Receptor Kinase family as an example One of the biggest plant gene families and their involvement
in plant biotic interactions
If there is enough time, the short story on plant pseudogenes When can you can a gene pseudogene?
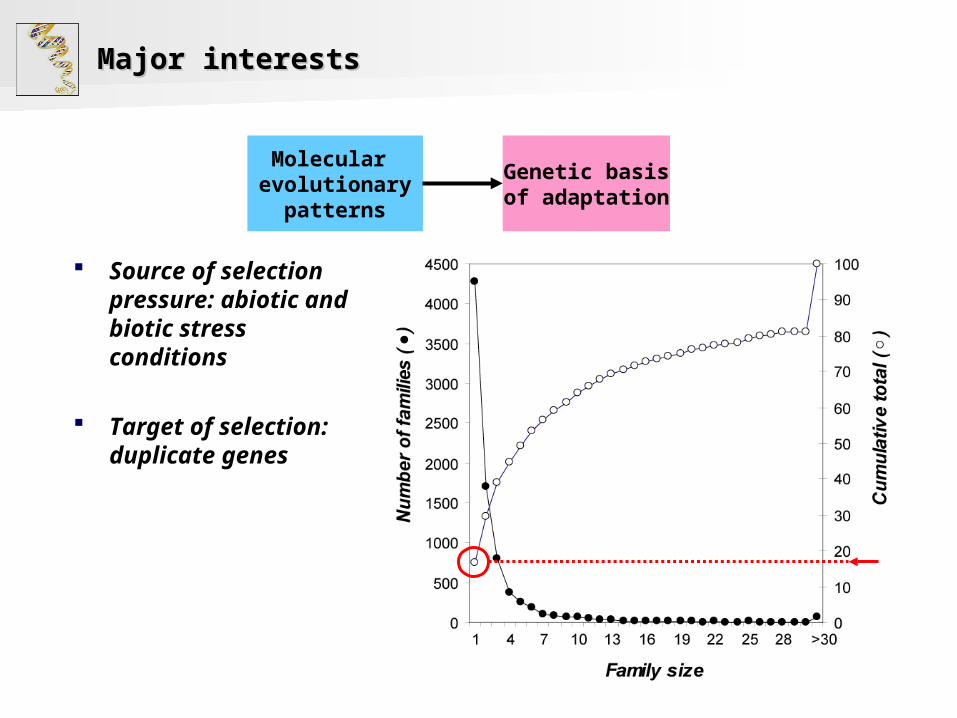
Major interestsMajor interests
Molecular evolutionary
patterns
Genetic basisof adaptation
Source of selection pressure: abiotic and biotic stress conditions
Target of selection: duplicate genes
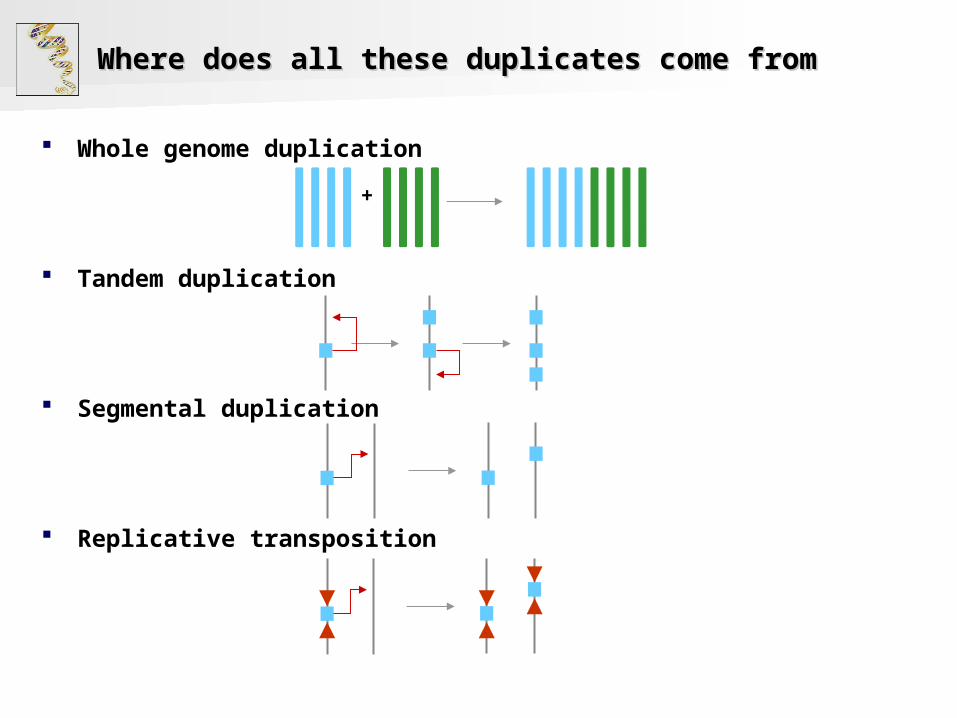
Where does all these duplicates come fromWhere does all these duplicates come from
+
Whole genome duplication
Tandem duplication
Segmental duplication
Replicative transposition
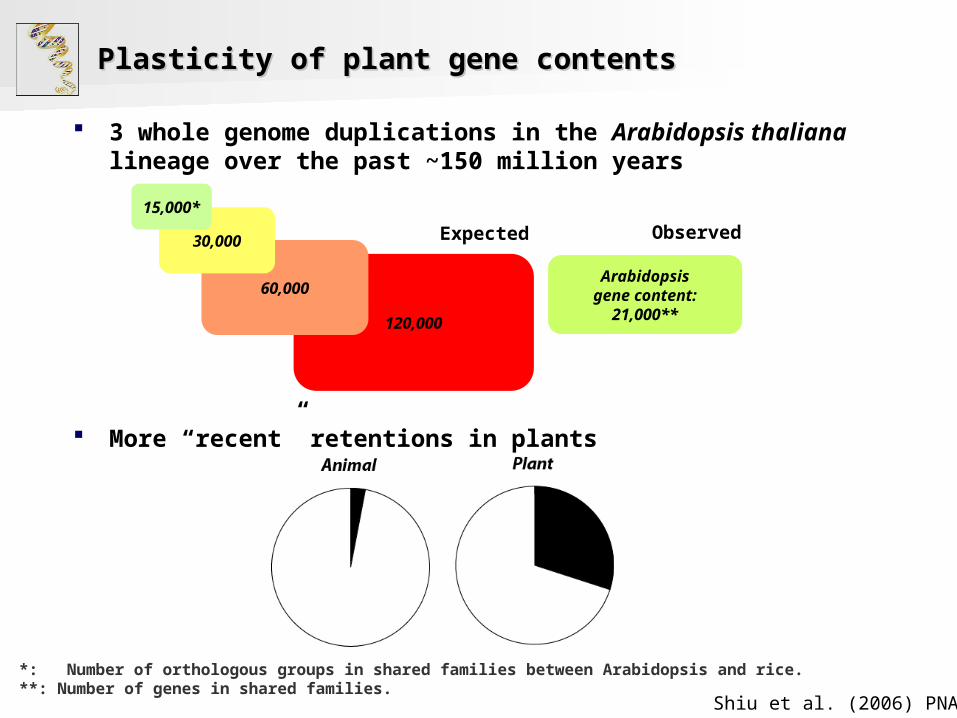
Plasticity of plant gene contentsPlasticity of plant gene contents
3 whole genome duplications in the Arabidopsis thaliana lineage over the past ~150 million years
More “recent” retentions in plants
*: Number of orthologous groups in shared families between Arabidopsis and rice.**: Number of genes in shared families.
120,000
Arabidopsisgene content:
21,000**
60,000
30,000
15,000*
Expected Observed
Shiu et al. (2006) PNAS
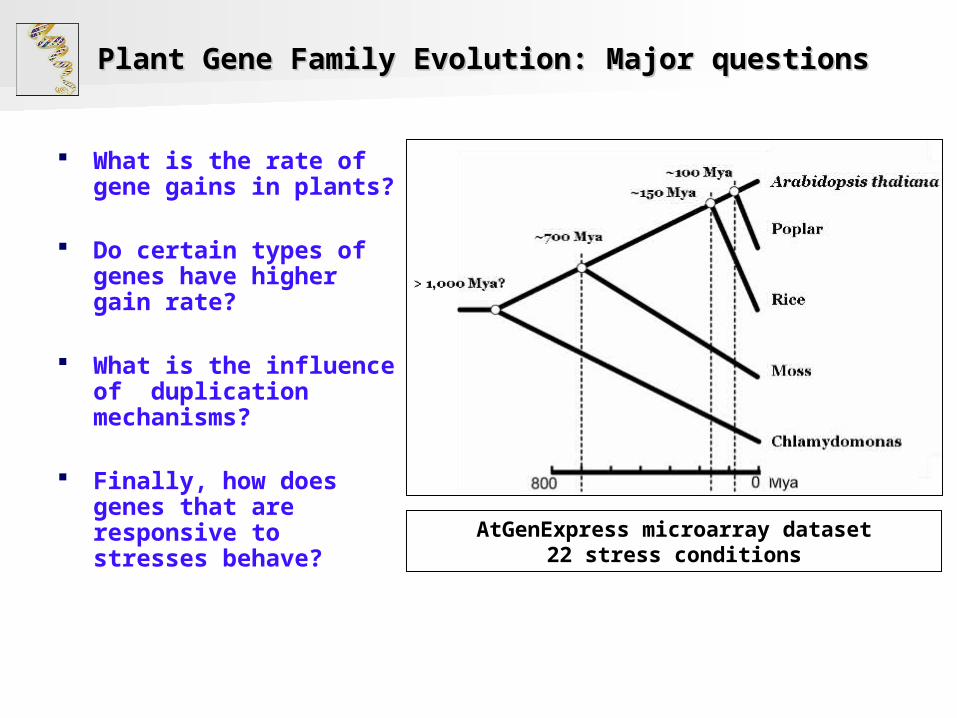
Plant Gene Family Evolution: Major questionsPlant Gene Family Evolution: Major questions
What is the rate of gene gains in plants?
Do certain types of genes have higher gain rate?
What is the influence of duplication mechanisms?
Finally, how does genes that are responsive to stresses behave?
AtGenExpress microarray dataset22 stress conditions
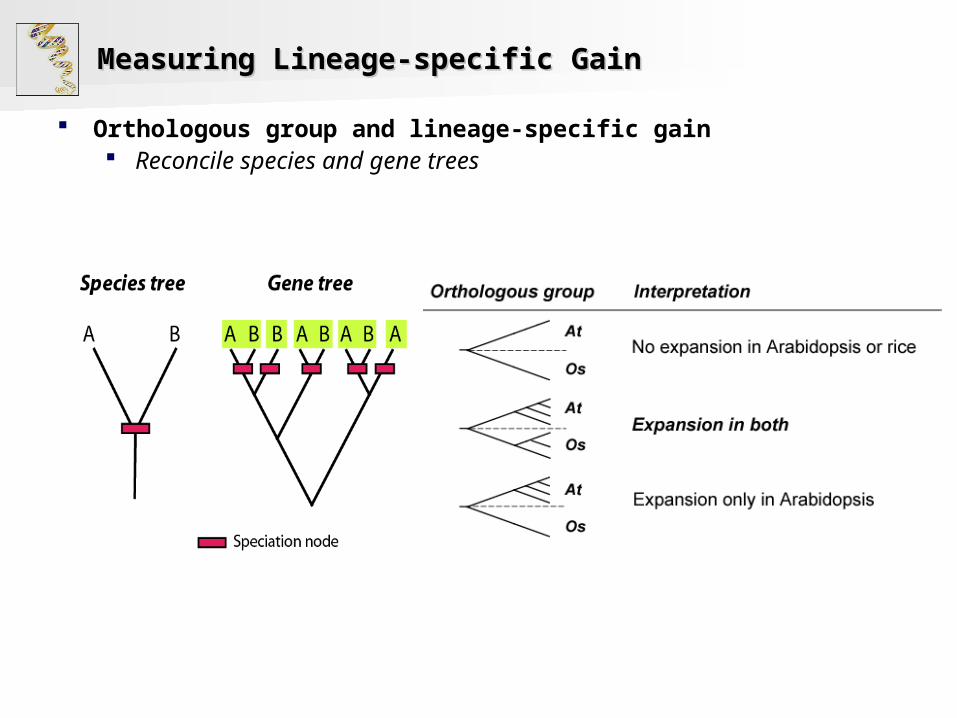
Measuring Lineage-specific GainMeasuring Lineage-specific Gain
Orthologous group and lineage-specific gain Reconcile species and gene trees
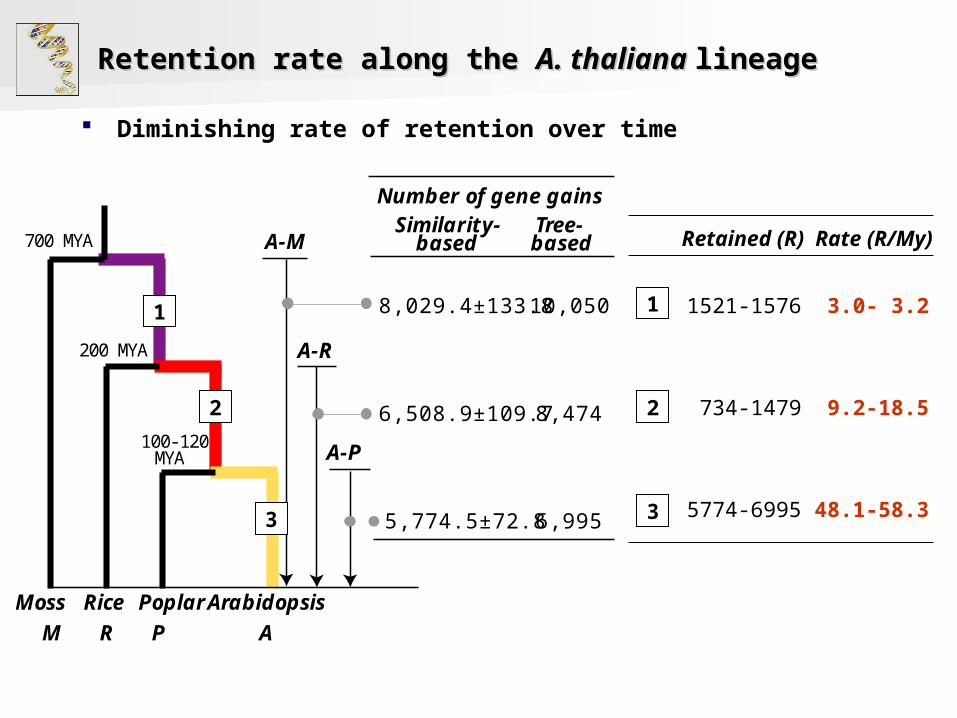
Retention rate along the Retention rate along the A. thaliana A. thaliana lineage lineage
Diminishing rate of retention over time
M R P A
5,774.5±72.8
Moss Rice PoplarArabidopsis
6,508.9±109.7
8,029.4±133.8
6,995
8,474
10,050
Tree-based
Similarity-basedA-M
A-R
A-P
Number of gene gains
700 MYA
200 MYA
100-120MYA
11.3 - 14.4
47.5 - 70.0
32.0 - 42.4
Gain rate(gain/MY)
1
2
3
1
2
3
1521-1576 3.0- 3.2
734-1479 9.2-18.5
5774-6995 48.1-58.3
Retained (R) Rate (R/My)
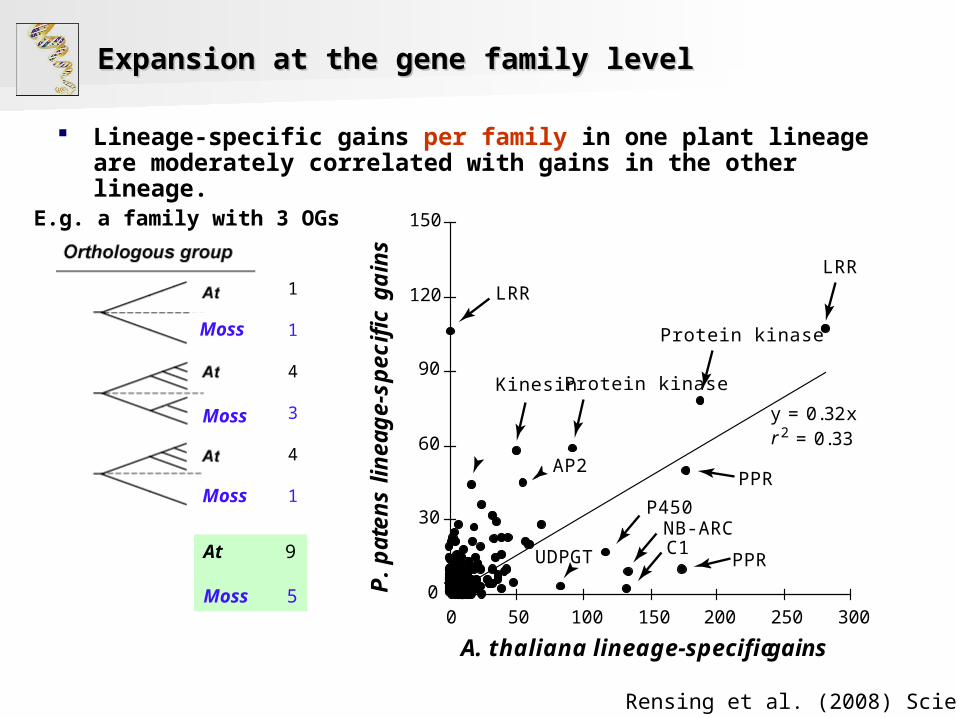
Expansion at the gene family level Expansion at the gene family level
Lineage-specific gains per family in one plant lineage are moderately correlated with gains in the other lineage.
y = 0.32xr 2 = 0.33
0
30
60
90
120
150
0 50 100 150 200 250 300
A. thaliana lineage-specific gains
cificeps-e
gaenil
sneta
p.P
ga
ins
LRR
Protein kinase
PPR
NB-ARCC1
PPR
P450
Protein kinase
UDPGT
LRR
Kinesin
AP2
Moss
Moss
Moss
1
1
4
3
4
1
At 9
Moss 5
Rensing et al. (2008) Science
E.g. a family with 3 OGs
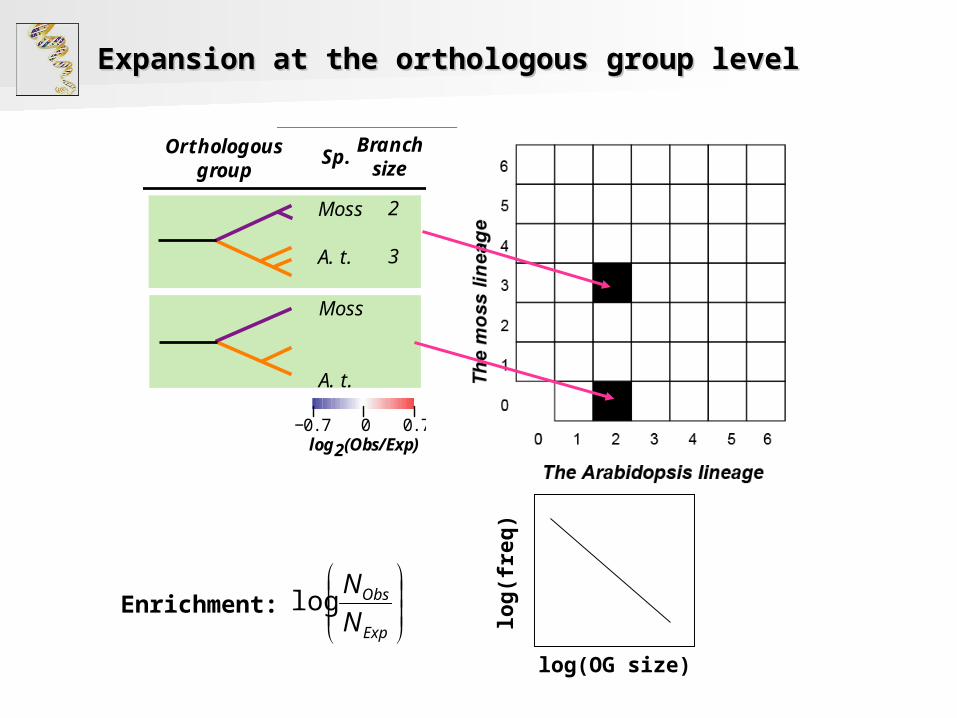
Expansion at the orthologous group level Expansion at the orthologous group level
Enrichment:
Exp
Obs
N
Nlog
−0.7 0.7log2(Obs/Exp)
0
Sp.Branch
size
Moss
A. t.
2
3
Orthologousgroup
Moss
A. t.
log(OG size)
log
(fre
q)
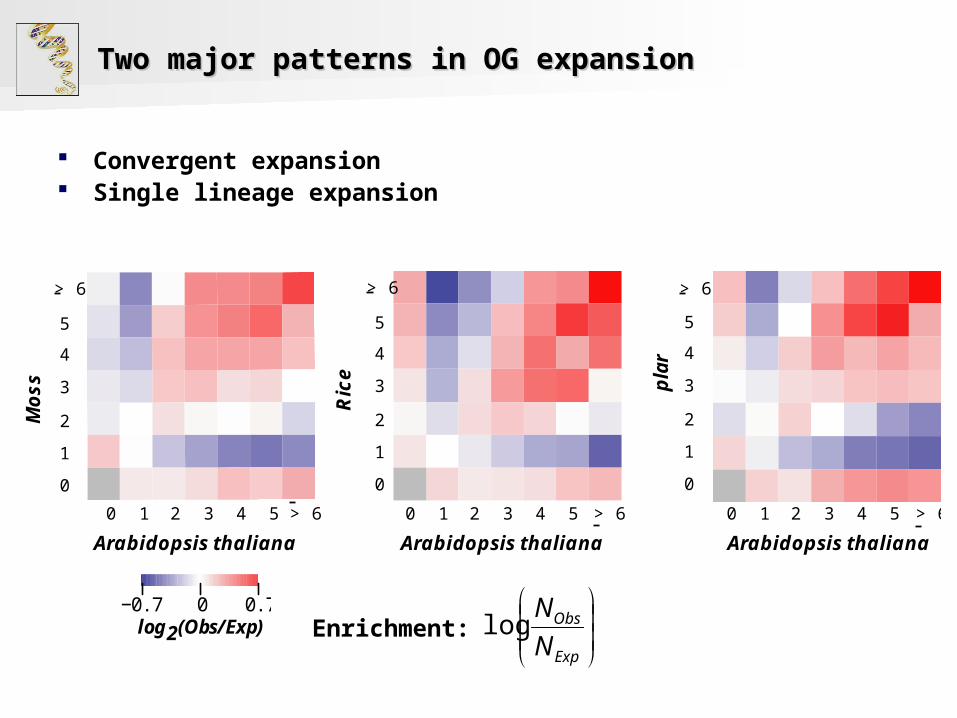
Two major patterns in OG expansion Two major patterns in OG expansion
Convergent expansion Single lineage expansion
5
4
2
3
1
0
0 1 2 3 4 5 > 6
> 6
0 1 2 3 4 5
5
4
2
3
1
0
> 6
> 6
5
4
2
3
1
0
0 1 2 3 4 5
> 6
> 6
Arabidopsis thaliana Arabidopsis thalianaArabidopsis thaliana
sso
M
eciR
ral
p
−0.7 0.7log2(Obs/Exp)
0Enrichment:
Exp
Obs
N
Nlog
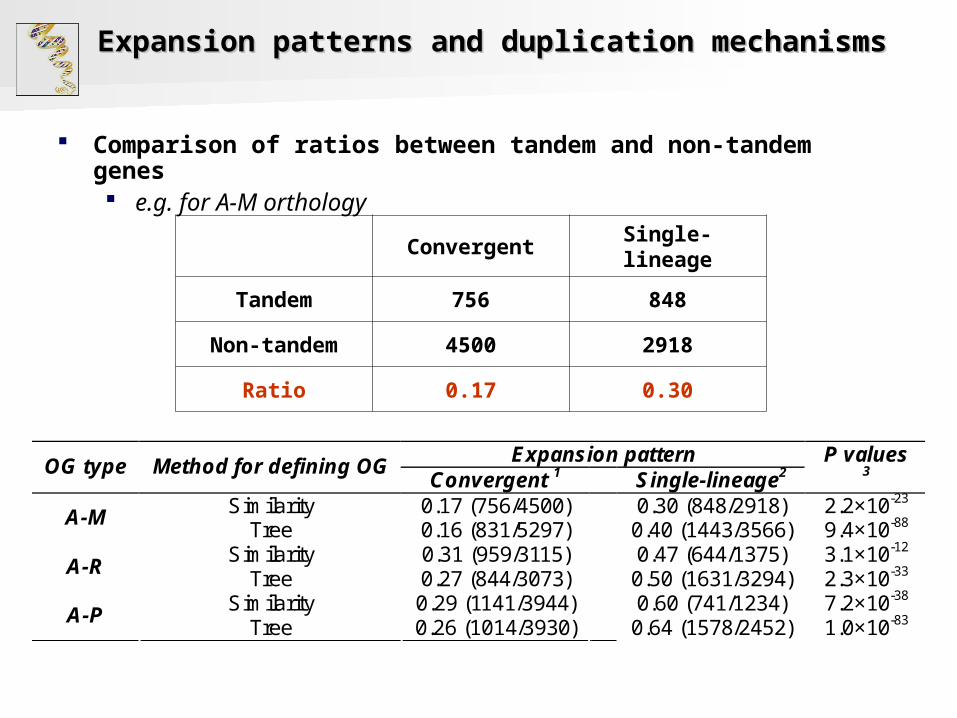
Expansion patterns and duplication mechanisms Expansion patterns and duplication mechanisms
Comparison of ratios between tandem and non-tandem genes e.g. for A-M orthology
Expansion patternOG type Method for defining OG
Convergent 1 Single-lineage2P values
3
Similarity 0.17 (756/4500) 0.30 (848/2918) 2.2×10⁻²³
A-MTree 0.16 (831/5297) 0.40 (1443/3566) 9.4×10-88
Similarity 0.31 (959/3115) 0.47 (644/1375) 3.1×10⁻¹²
A-RTree 0.27 (844/3073) 0.50 (1631/3294) 2.3×10⁻³³
Similarity 0.29 (1141/3944) 0.60 (741/1234) 7.2×10-38
A-PTree 0.26 (1014/3930) 0.64 (1578/2452) 1.0×10-83
Convergent Single-lineage
Tandem 756 848
Non-tandem 4500 2918
Ratio 0.17 0.30
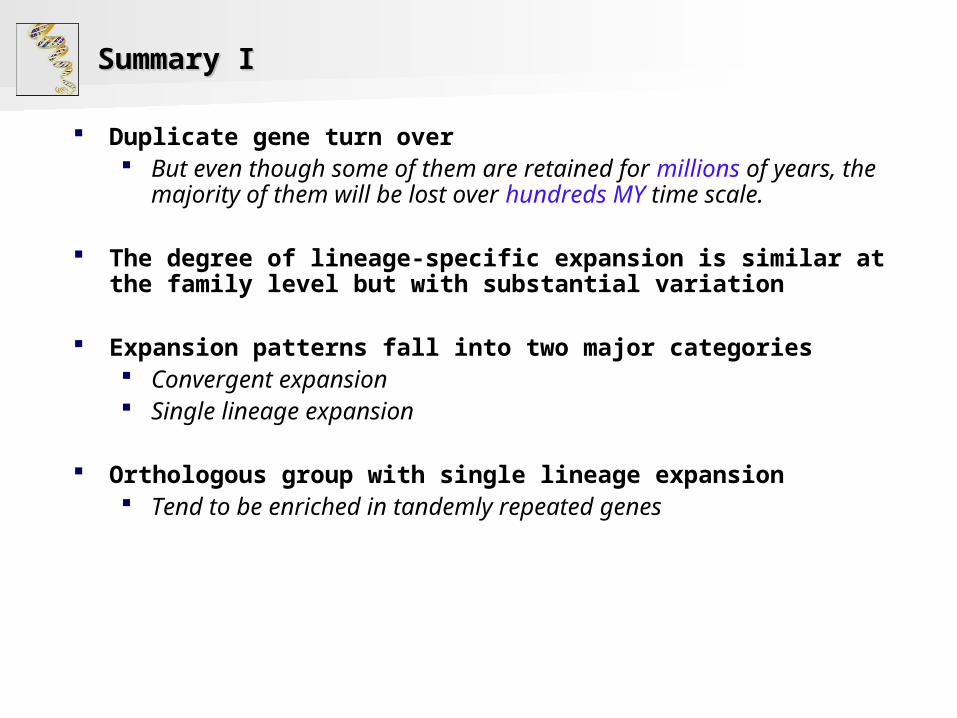
Summary I Summary I
Duplicate gene turn over But even though some of them are retained for millions of
years, the majority of them will be lost over hundreds MY time scale.
The degree of lineage-specific expansion is similar at the family level but with substantial variation
Expansion patterns fall into two major categories Convergent expansion Single lineage expansion
Orthologous group with single lineage expansion Tend to be enriched in tandemly repeated genes
What's so special about tandem genesWhat's so special about tandem genes
Duplication rate (event per unit time):
Whole genome duplication: 1 event / ~50 million years
Tandem duplication: multiple events / generation
Rate of recombination
Recombination rate: Pathogen attack > control Lucht et al., 2002. Nature.
Recombination rate: Tandem > non-tandem Zhang & Gaut, 2003. Genome Res.
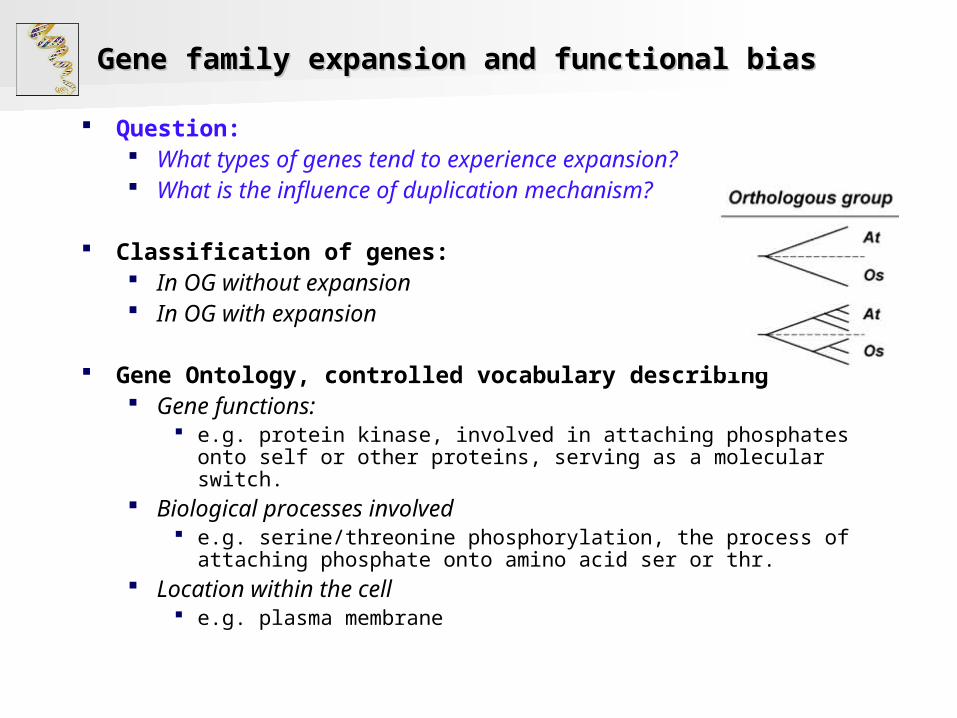
Gene family expansion and functional bias Gene family expansion and functional bias
Question: What types of genes tend to experience expansion? What is the influence of duplication mechanism?
Classification of genes: In OG without expansion In OG with expansion
Gene Ontology, controlled vocabulary describing Gene functions:
e.g. protein kinase, involved in attaching phosphates onto self or other proteins, serving as a molecular switch.
Biological processes involved e.g. serine/threonine phosphorylation, the process of attaching
phosphate onto amino acid ser or thr. Location within the cell
e.g. plasma membrane

Functional bias of gene retention Functional bias of gene retention
None
Moss Rice Poplar Arabidopsis
Plasma membraneLipase activityCopper ion-bindingResposes to ABAHypersensitive responseCell wall organization
Translation
Ribosome, Apoplast,Membrane,Cell wall, Cytosol,UDP-glycosyl transferase,Receptor activity,Ca2+ homeostasis,Enzyme inhibitor,Electon transport,Phosphorylation,Stress response
A-M
A-R
A-P
Stress response categories over-represented in the vascular plant lineage
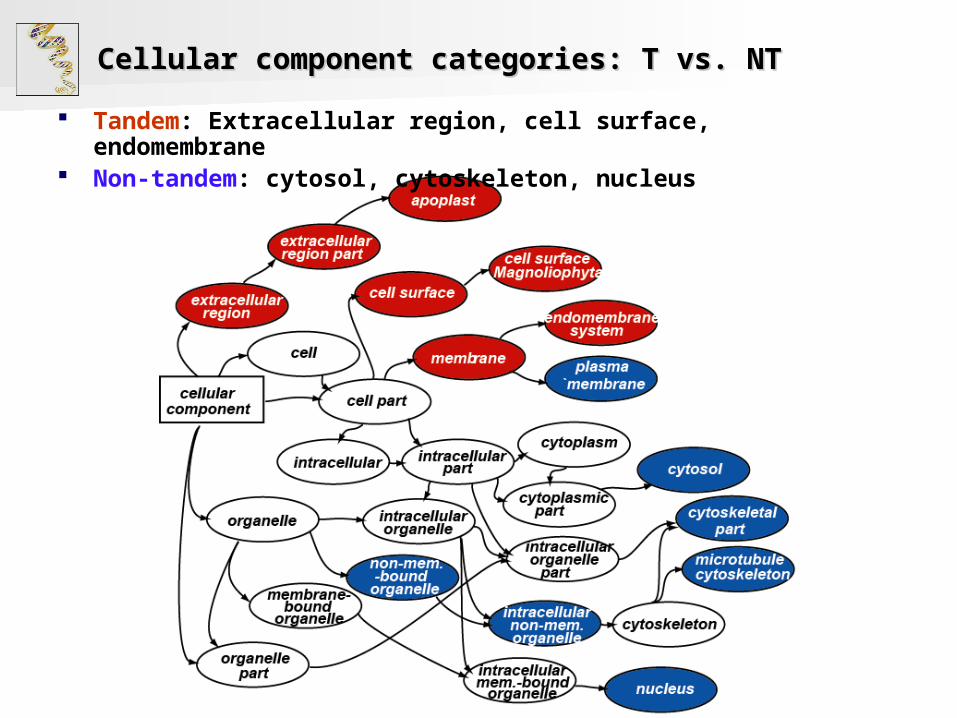
Cellular component categories: T vs. NT Cellular component categories: T vs. NT
Tandem: Extracellular region, cell surface, endomembrane Non-tandem: cytosol, cytoskeleton, nucleus
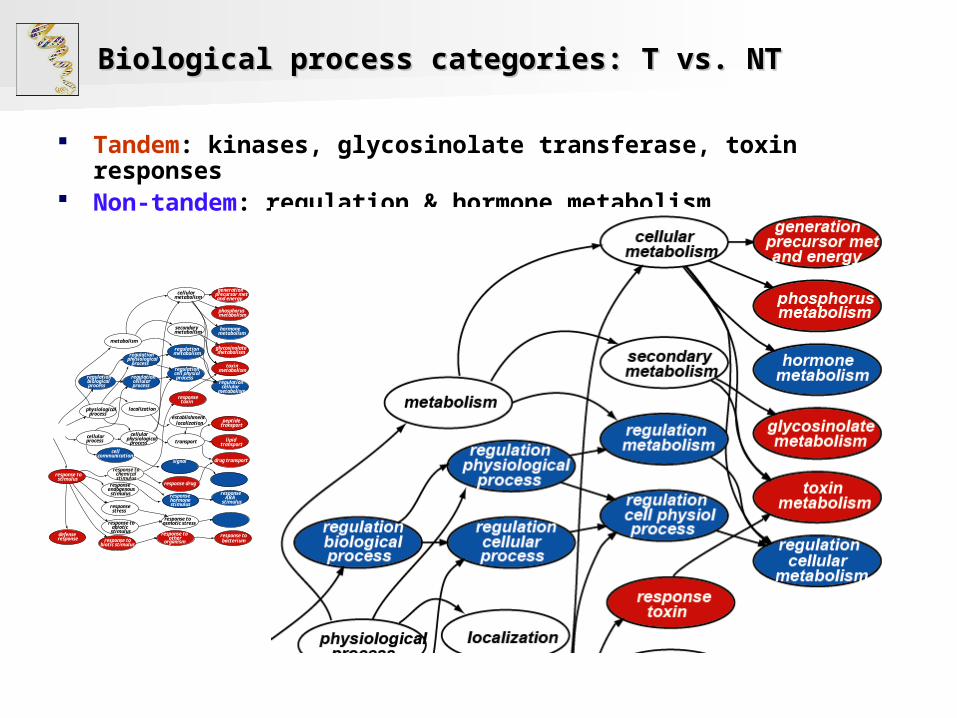
Biological process categories: T vs. NT Biological process categories: T vs. NT
Tandem: kinases, glycosinolate transferase, toxin responses
Non-tandem: regulation & hormone metabolism
response tostimulus
cellularprocess
physiologicalprocess
defenseresponse
response tochemicalstimulus
response tobiotic stimulus
responseendogenousstimulus
response toabioticstimulus
responsestress
cellularphysiological
process
cellularmetabolism
transport
generationprecursor metand energy
toxinmetabolism
phosphorusmetabolism
metabolism
localization
secondarymetabolism
glycosinolatemetabolism
responsetoxin
response drug
response toother
organismresponse tobacterium
peptidetransport
drug transport
lipidtransport
establishmentlocalization
response toosmotic stress
regulationbiologicalprocess
regulationcellularprocess
cellcommunication
regulationcell physiolprocess
regulationcellular
metabolism
hormonemetabolism
regulationphysiological
process
regulationmetabolism
responsehormonestimulus
responseABA
stimulus
signal
Biological process categories: T vs. NT (contd.)Biological process categories: T vs. NT (contd.)
response tostimulus
cellularprocess
physiologicalprocess
defenseresponse
response tochemicalstimulus
response tobiotic stimulus
responseendogenousstimulus
response toabioticstimulus
responsestress
cellularphysiological
process
cellularmetabolism
transport
generationprecursor metand energy
toxinmetabolism
phosphorusmetabolism
metabolism
localization
secondarymetabolism
glycosinolatemetabolism
responsetoxin
response drug
response toother
organismresponse tobacterium
peptidetransport
drug transport
lipidtransport
establishmentlocalization
response toosmotic stress
regulationbiologicalprocess
regulationcellularprocess
cellcommunication
regulationcell physiolprocess
regulationcellular
metabolism
hormonemetabolism
regulationphysiological
process
regulationmetabolism
responsehormonestimulus
responseABA
stimulus
signal
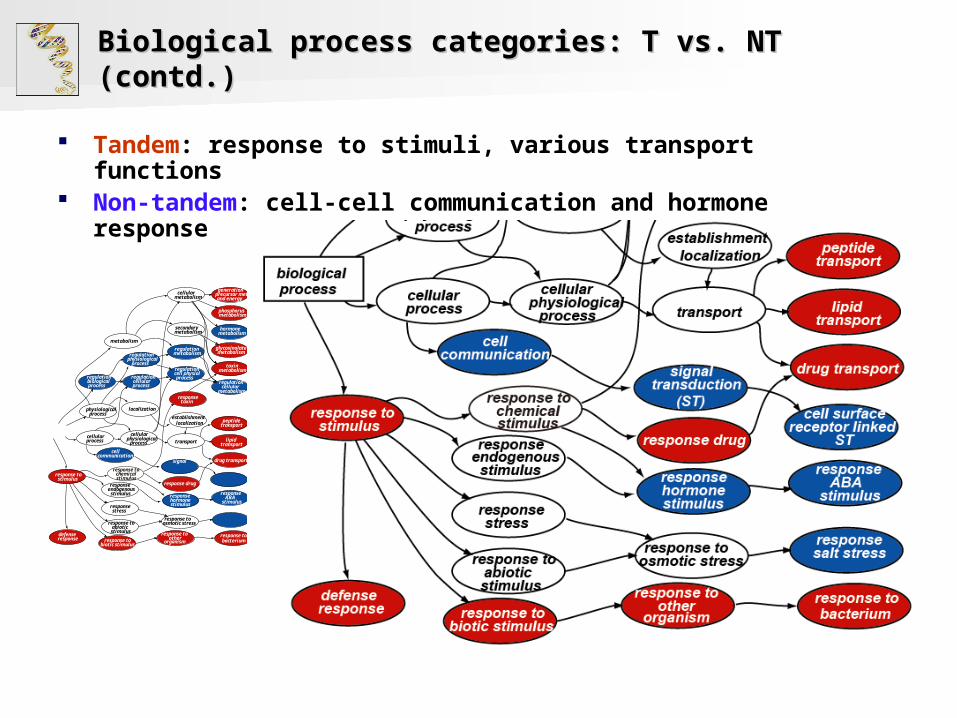
Tandem: response to stimuli, various transport functions Non-tandem: cell-cell communication and hormone
response

Stress responsivenessStress responsiveness
Expression data set: Arabidopsis thaliana Under 22 abiotic and biotic stress conditions
Definition: stress responsiveness For a given gene
ET: Expression level under stress condition Ec: Expression level under mock treatment control
If ET >> Ec: Significant UP regulation
If ET << Ec: Significant DOWN regulation
Question: do stress responsive genes tend to be those that are gained throughout plant evolution?
Expansion of responsive genes and conditionsExpansion of responsive genes and conditions
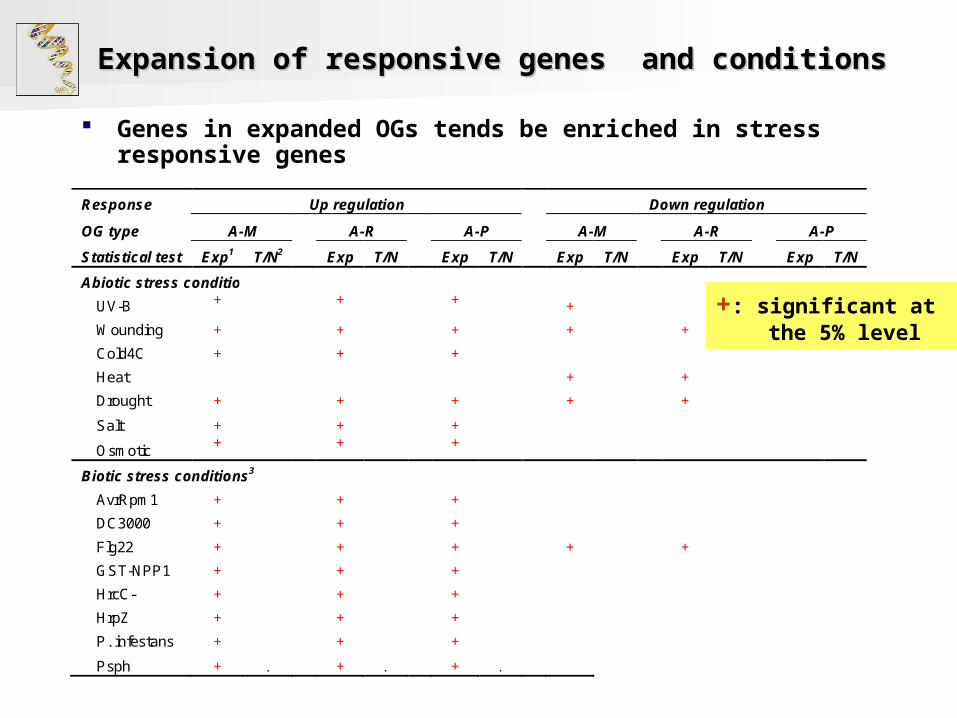
Response Up regulation Down regulation
OG type A-M A-R A-P A-M A-R A-P
Statistical test Exp1 T/N2 Exp T/N Exp T/N Exp T/N Exp T/N Exp T/N
Abiotic stress conditions3
UV-B + T + T + T + N
Wounding + T + + + +
Cold4C + N + N + N
Heat + N + N
Drought + + T + + +
Salt + + +
Osmotic + + +
Biotic stress conditions3
AvrRpm1 + + +
DC3000 + + +
Flg22 + T + T + + +
GST-NPP1 + T + T + T
HrcC- + T + T + T
HrpZ + + +
P. infestans + T + T + T
Psph + T + T + T
Genes in expanded OGs tends be enriched in stress responsive genes
+: significant at the 5% level
Stress responsiveness and duplication Stress responsiveness and duplication mechanismsmechanisms
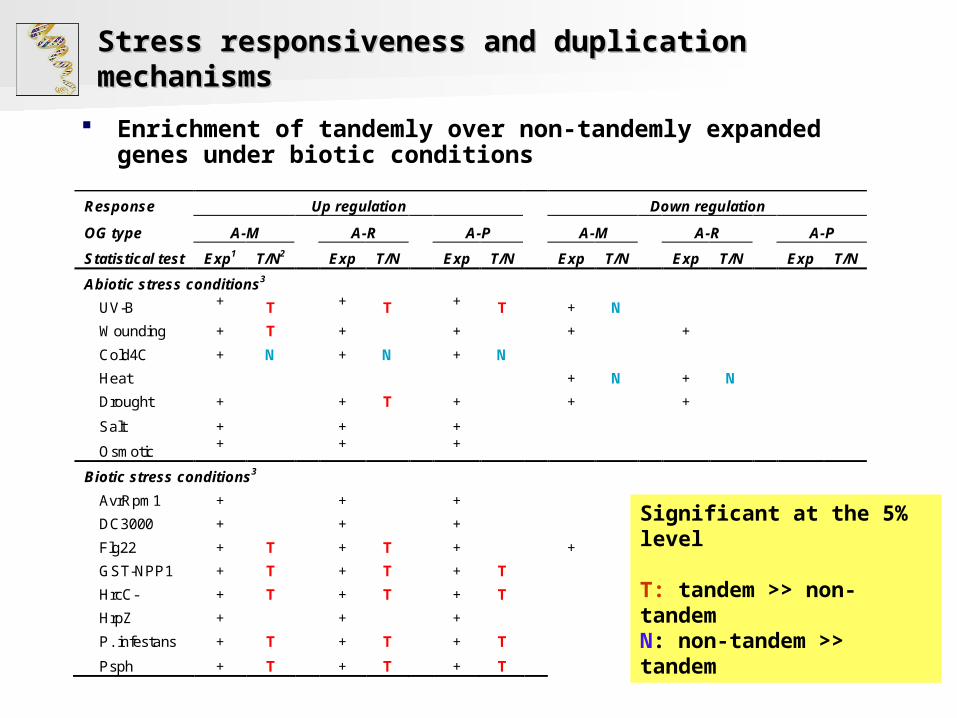
Response Up regulation Down regulation
OG type A-M A-R A-P A-M A-R A-P
Statistical test Exp1 T/N2 Exp T/N Exp T/N Exp T/N Exp T/N Exp T/N
Abiotic stress conditions3
UV-B + T + T + T + N
Wounding + T + + + +
Cold4C + N + N + N
Heat + N + N
Drought + + T + + +
Salt + + +
Osmotic + + +
Biotic stress conditions3
AvrRpm1 + + +
DC3000 + + +
Flg22 + T + T + + +
GST-NPP1 + T + T + T
HrcC- + T + T + T
HrpZ + + +
P. infestans + T + T + T
Psph + T + T + T
Enrichment of tandemly over non-tandemly expanded genes under biotic conditions
Significant at the 5% level
T: tandem >> non-tandemN: non-tandem >> tandem
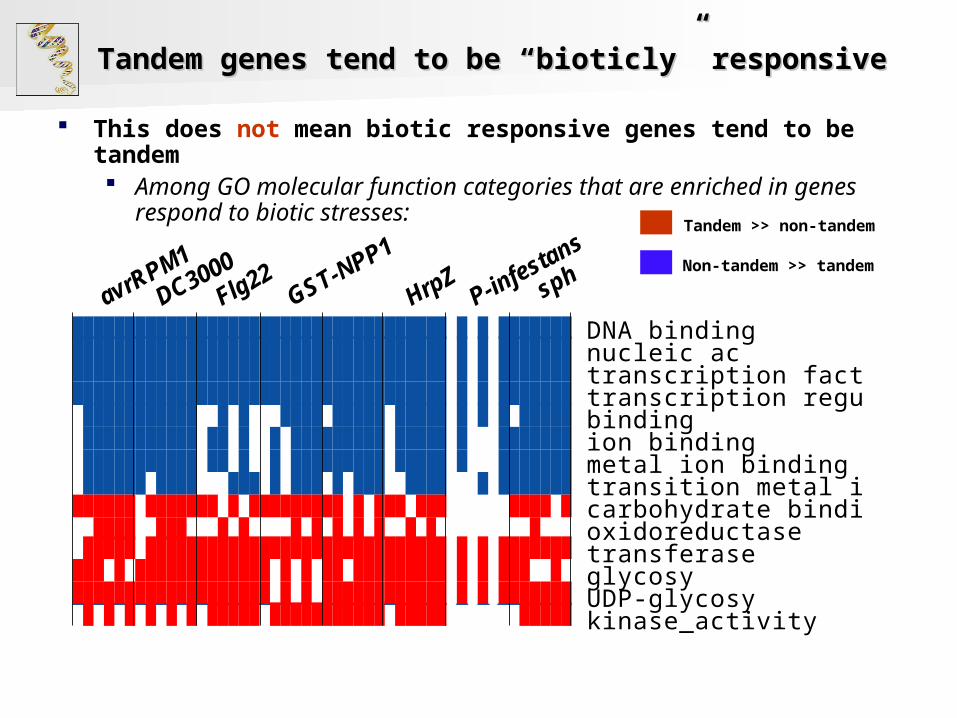
Tandem genes tend to be “bioticly” responsive Tandem genes tend to be “bioticly” responsive
This does not mean biotic responsive genes tend to be tandem Among GO molecular function categories that are enriched in
genes respond to biotic stresses: Tandem >> non-tandem
Non-tandem >> tandem
DNA binding
transferaseglycosy
1MPRrva
UDP-glycosy
nucleic actranscription factortranscription regulator
kinase_activity
bindingion bindingmetal ion bindingtransition metal ion bindingcarbohydrate bindingoxidoreductase
0003CD
1PPN-TSG22glF
ZprH
snatsefni-Phps
Summary II Summary II
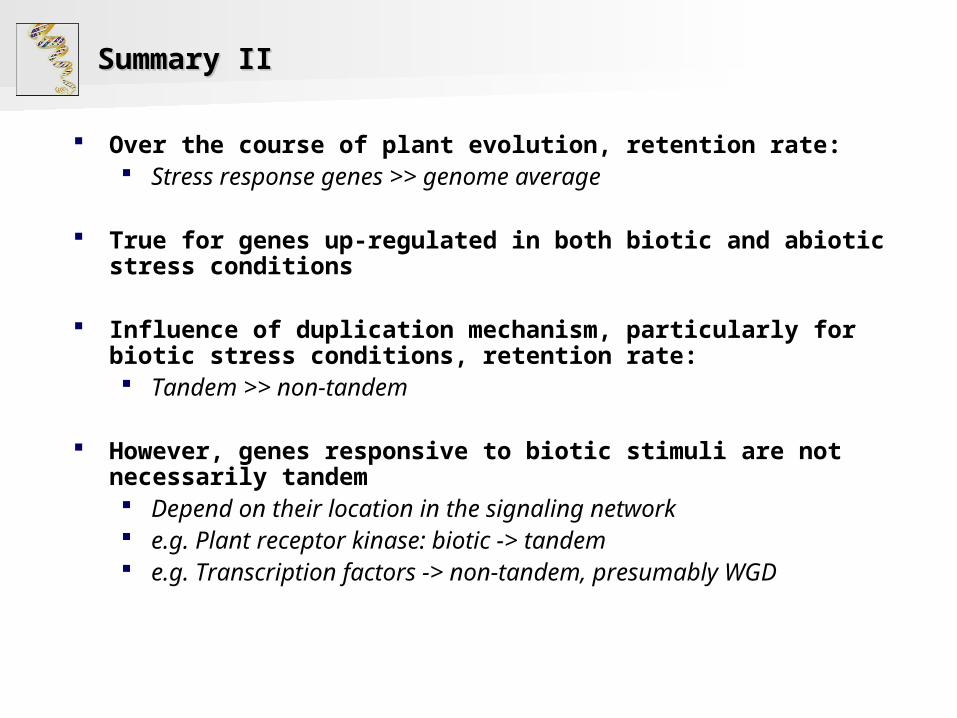
Over the course of plant evolution, retention rate: Stress response genes >> genome average
True for genes up-regulated in both biotic and abiotic stress conditions
Influence of duplication mechanism, particularly for biotic stress conditions, retention rate: Tandem >> non-tandem
However, genes responsive to biotic stimuli are not necessarily tandem Depend on their location in the signaling network e.g. Plant receptor kinase: biotic -> tandem e.g. Transcription factors -> non-tandem, presumably WGD
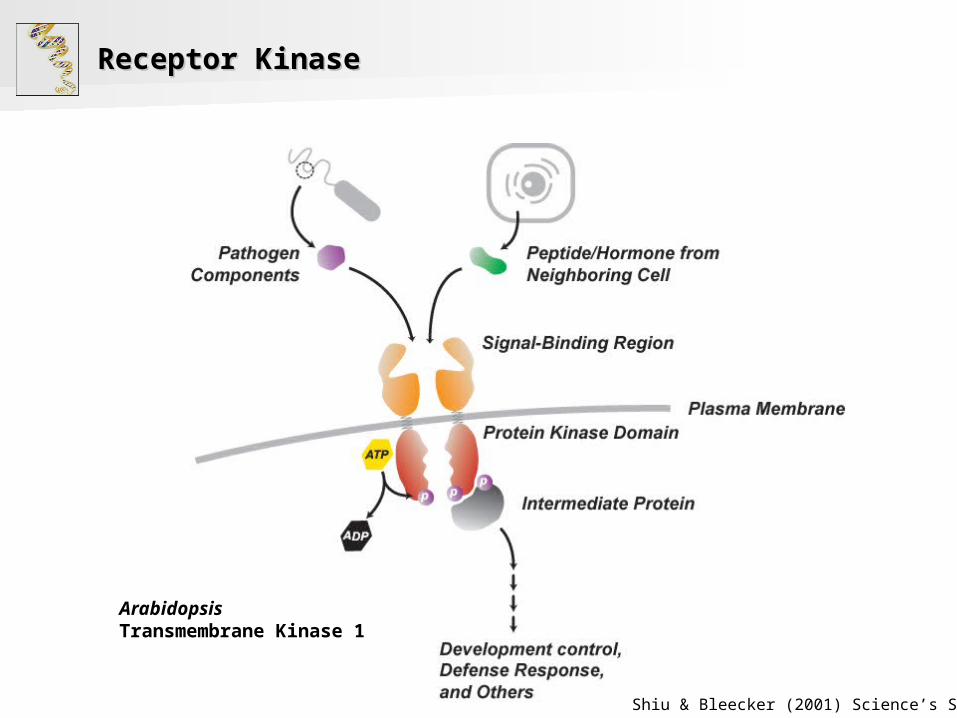
Receptor KinaseReceptor Kinase
Shiu & Bleecker (2001) Science’s STKE
ArabidopsisTransmembrane Kinase 1
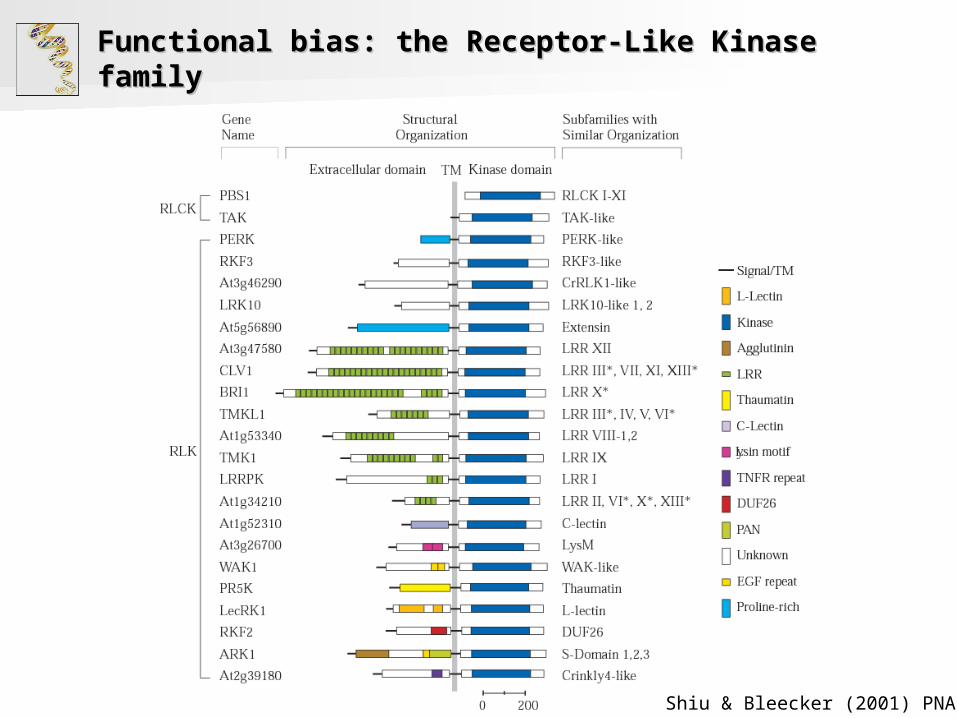
Functional bias: the Receptor-Like Kinase familyFunctional bias: the Receptor-Like Kinase family
Shiu & Bleecker (2001) PNAS

The Kinase superfamilyThe Kinase superfamily
Family size differences imply differential expansion Kinase: >1000 in A. thaliana, >1600 in Oryza sativa RLK/Pelle: ~600 in At, ~1200 in Os
Animal homolog: Drsophila: Pelle Mammalian: IRAKs
Shiu et al. (2004) Plant Cell

Receptor kinase configurationReceptor kinase configuration
Chlamydomonasreinhardtii
Ostreococcustauri
Physcomitrellapatens (M)
Oryza sativa (O)
Arabidopsisthaliana (A)
Populustrichocarpa (P)
356
73
256 356
73
256
388148
462
376
159
911
453
187
1003
388148
462
388148
462
376
159
911
376
159
911
453
187
1003
453
187
1003
424
2
93
424
2
424
2
9393
RLKRLCKOther Kinases
RLKRLCKOther Kinases
ECD Kinase
Kinase

InnovationInnovation
LysM
GDPD
CHASE
LRR
LRR
LRR
Thaumatin
ThaumatinThaumatin
GH18
GH18
DUF26
DUF26DUF26

Functional bias: motivated by RLK studiesFunctional bias: motivated by RLK studies
Shiu et al., 2004 Plant Cell
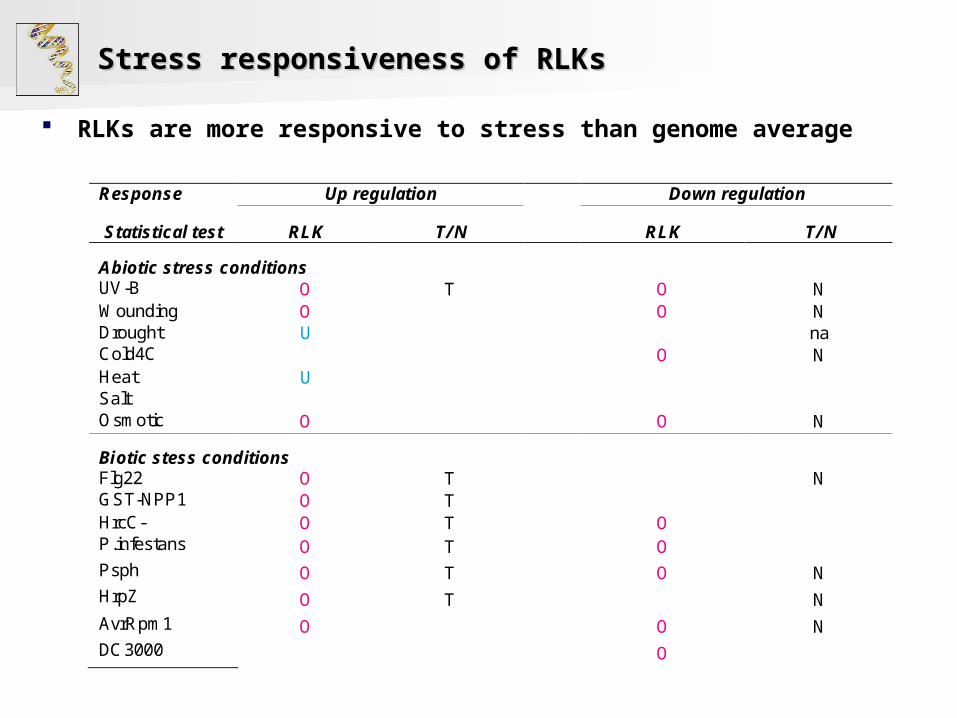
Stress responsiveness of RLKs Stress responsiveness of RLKs
RLKs are more responsive to stress than genome average
Response Up regulation Down regulation
Statistical test RLK T/N RLK T/N
Abiotic stress conditionsUV-B O T O NWounding O O NDrought U naCold4C O NHeat USaltOsmotic O O N
Biotic stess conditionsFlg22 O T NGST-NPP1 O THrcC- O T OP.infestans O T OPsph O T O NHrpZ O T NAvrRpm1 O O NDC3000 O
Stress responsiveness of RLKs Stress responsiveness of RLKs
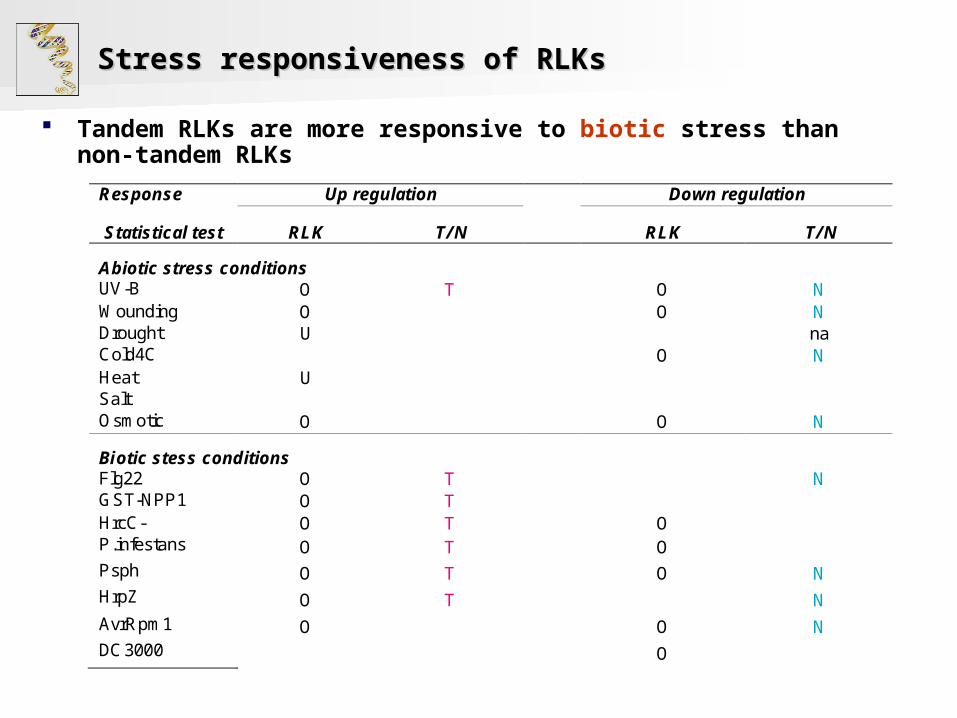
Tandem RLKs are more responsive to biotic stress than non-tandem RLKs
Response Up regulation Down regulation
Statistical test RLK T/N RLK T/N
Abiotic stress conditionsUV-B O T O NWounding O O NDrought U naCold4C O NHeat USaltOsmotic O O N
Biotic stess conditionsFlg22 O T NGST-NPP1 O THrcC- O T OP.infestans O T OPsph O T O NHrpZ O T NAvrRpm1 O O NDC3000 O
Stress responsiveness and tandem RLKsStress responsiveness and tandem RLKs
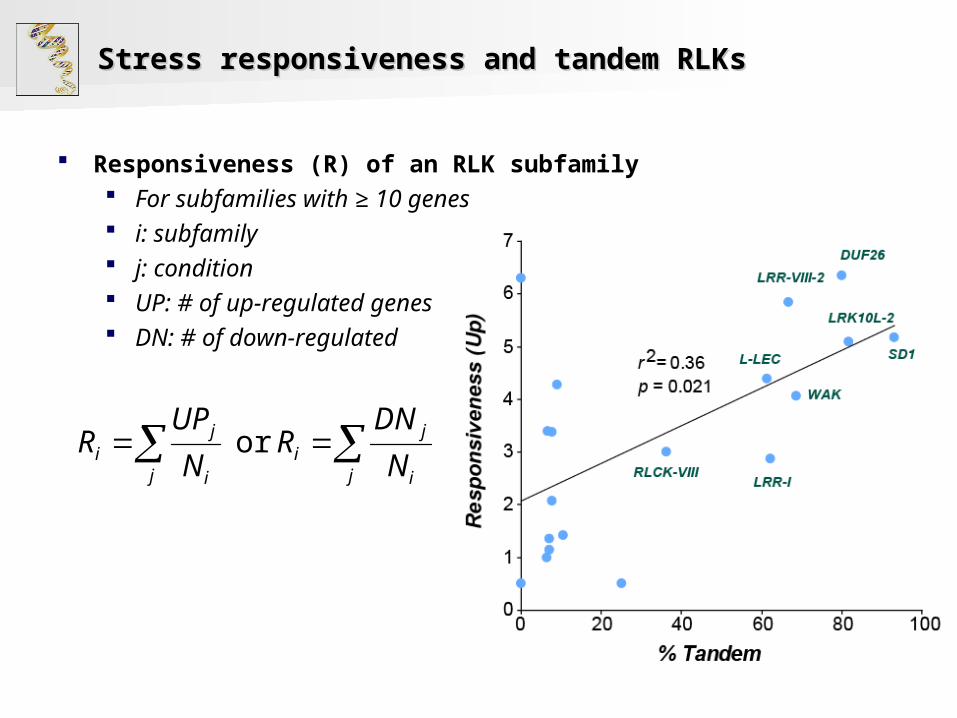
Responsiveness (R) of an RLK subfamily For subfamilies with ≥ 10 genes i: subfamily j: condition UP: # of up-regulated genes DN: # of down-regulated
j i
ji
j i
ji N
DNR
N
UPR or
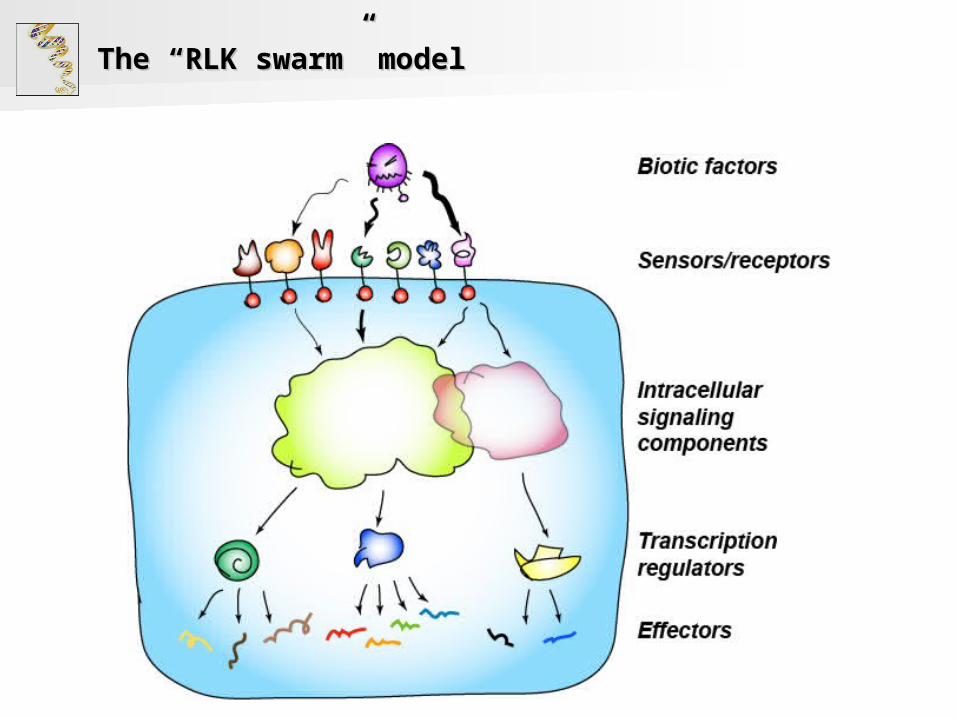
The “RLK swarm” modelThe “RLK swarm” model
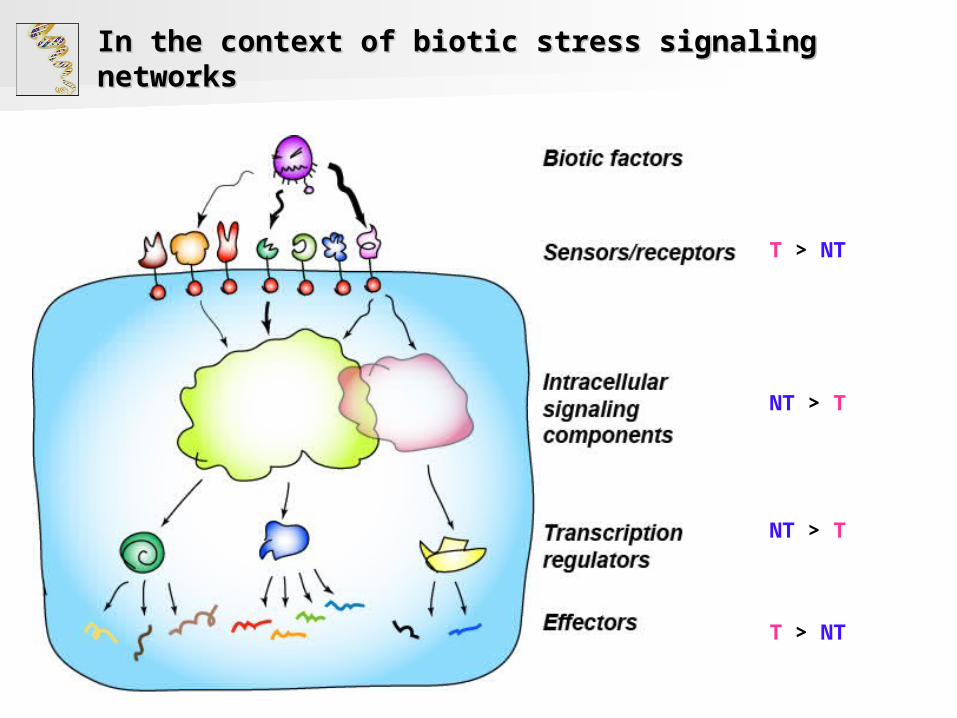
In the context of biotic stress signaling In the context of biotic stress signaling networksnetworks
T > NT
NT > T
NT > T
T > NT
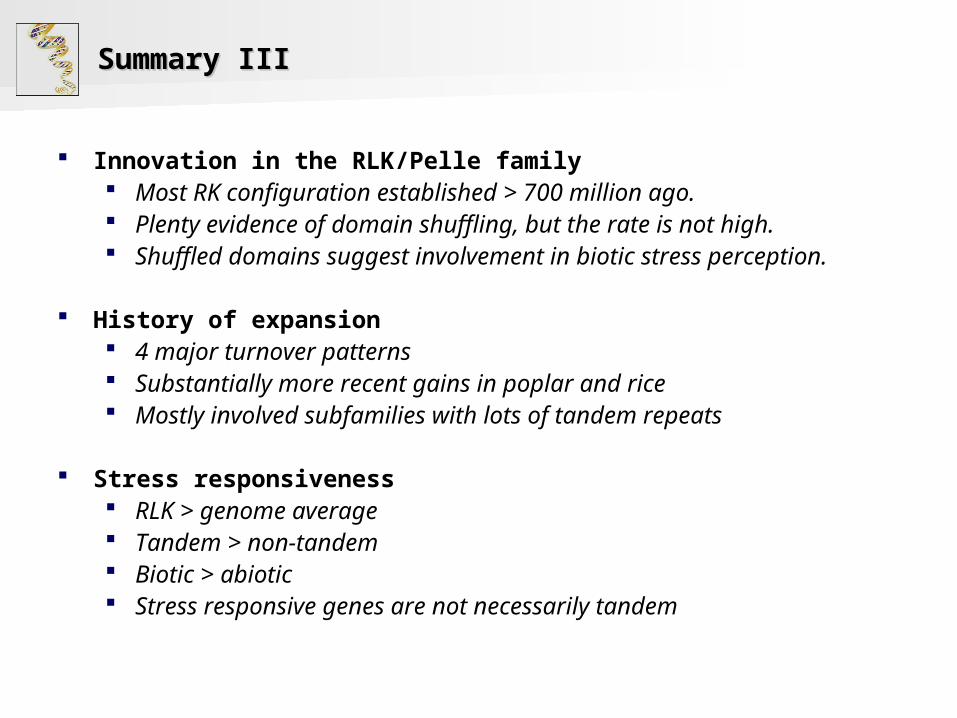
Summary IIISummary III
Innovation in the RLK/Pelle family Most RK configuration established > 700 million ago. Plenty evidence of domain shuffling, but the rate is not high. Shuffled domains suggest involvement in biotic stress
perception.
History of expansion 4 major turnover patterns Substantially more recent gains in poplar and rice Mostly involved subfamilies with lots of tandem repeats
Stress responsiveness RLK > genome average Tandem > non-tandem Biotic > abiotic Stress responsive genes are not necessarily tandem
Plant pseudogenesPlant pseudogenes
Pseudogenes are: Genomic DNA sequences similar to normal genes but non-
functional
For protein coding genes, non-functional to many means: They have frameshift mutation or premature stop codons They are not transcribed into mRNA They exhibit signatures of neutral selection
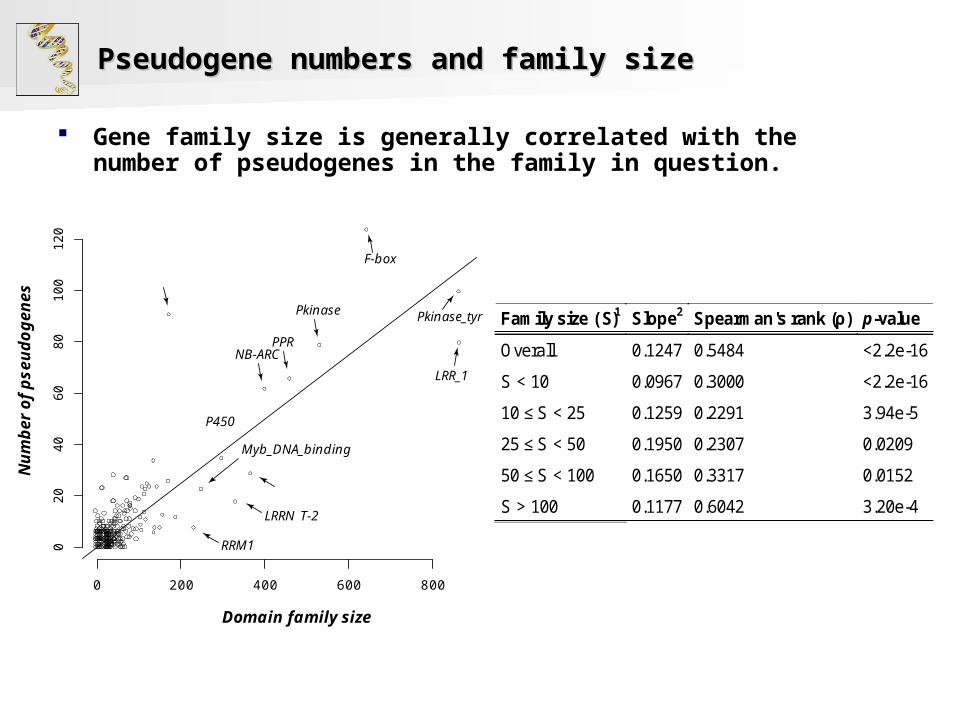
Pseudogene numbers and family size Pseudogene numbers and family size
Gene family size is generally correlated with the number of pseudogenes in the family in question.
0 200 400 600 800
00
20
40
60
80
01
02
1
Domain family size
sene
go
dues
pf
ore
bm
uN
F-box
LRR_1
Pkinase_tyrPkinase
LRRNT-2
RRM1
Myb_DNA_binding
P450
PPRNB-ARC
Family size (S)1 Slope2 Spearman's rank (ρ) p-value
Overall 0.1247 0.5484 <2.2e-16
S < 10 0.0967 0.3000 <2.2e-16
10 ≤ S < 25 0.1259 0.2291 3.94e-5
25 ≤ S < 50 0.1950 0.2307 0.0209
50 ≤ S < 100 0.1650 0.3317 0.0152
S > 100 0.1177 0.6042 3.20e-4

Selection pressure on pseudogenes Selection pressure on pseudogenes
Pseudogenes still show signatures of purifying selection
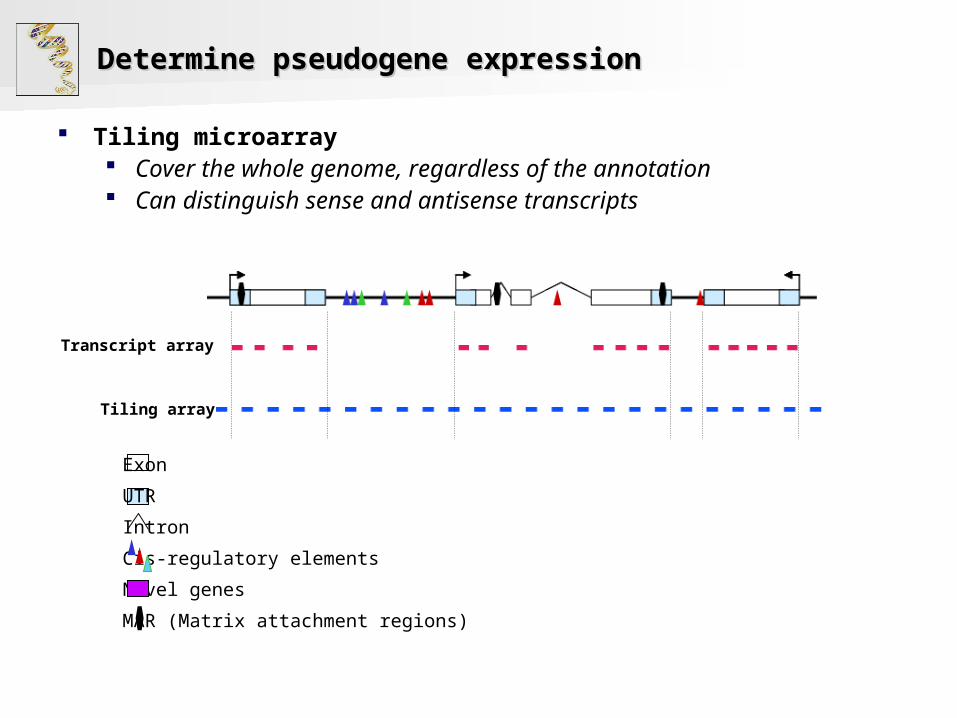
Determine pseudogene expression Determine pseudogene expression
Tiling microarray Cover the whole genome, regardless of the annotation Can distinguish sense and antisense transcripts
Exon
UTR
Intron
Cis-regulatory elements
Novel genes
MAR (Matrix attachment regions)
Transcript array
Tiling array
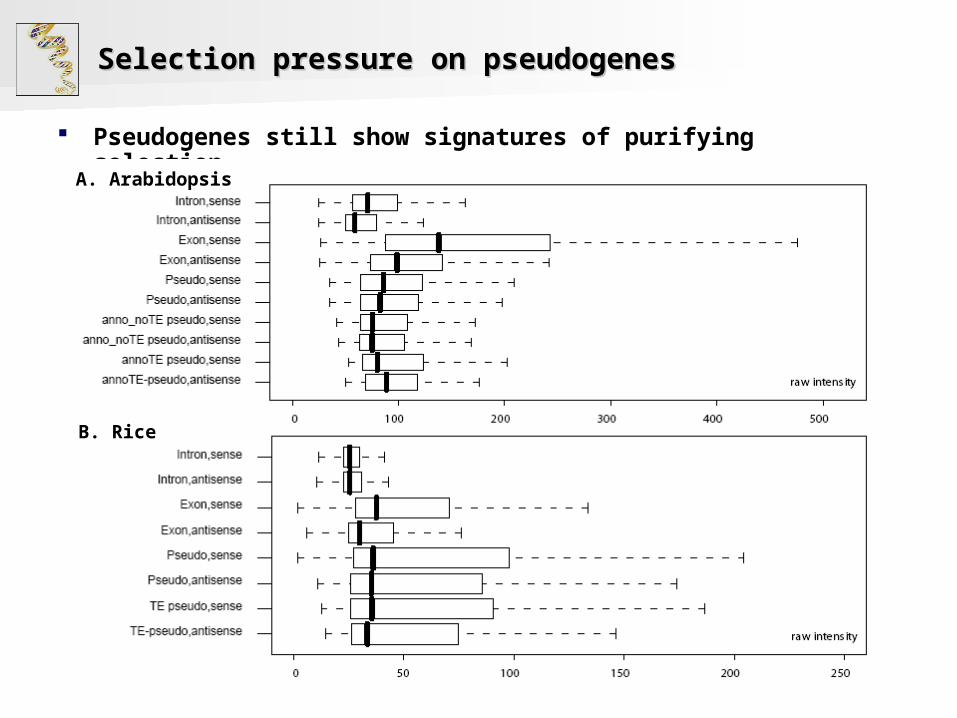
Selection pressure on pseudogenes Selection pressure on pseudogenes
Pseudogenes still show signatures of purifying selection
A. Arabidopsis
B. Rice
Summary IVSummary IV
Relationships between gene family sizes and the numbers of pseudogenes Positively correlated Larger gene families tend to loss more frequently than
smaller families
Pseudogene still shows signature of purifying selection Mostly may due to the fact that pseudogenization event
occurred relatively recently
Pseudogenes are still expressed Significantly higher than intron antisense expression In rice, pseudogene expression is even as high as that
among presumably functional genes
AcknowledgementAcknowledgement
Lab members Melissa Lehti-Shiu Gaurav Moghe Cheng Zou
Past member Kosuke Hanada, RIKEN
Collaborators Jeff Conner Gregg Howe, PRL Rong Jin, CSE Doug Schemske Mike Thomashow, PRL
Funding:

Takk!Takk!
http://blog.riflegear.com/