Embed Size (px)
Citation preview

International Journal of Research in Geography (IJRG)
Volume 3, Issue 4, 2017, PP 84-99
ISSN 2454-8685 (Online)
http://dx.doi.org/10.20431/2454-8685.0304011
www.arcjournals.org
International Journal of Research in Geography (IJRG) Page | 84
Evolution of Smart City Concept and its Economic Performance:
A Study of Cities in Telangana State of India
Dr. Ashok Kumar Lonavath1, Dr. Karunakar Virugu
2,*, V. Sathish Kumar
3, D. Krishna
Naik4
1Associate Professor, Department of Geography, Osmania University, Hyderabad, Telangana State,
India 500007 2Assistant professor, Department of Geography, Osmania University, Hyderabad, Telangana State,
India 500007 3Project fellow UPE-CART-ES , Department of Geography, Osmania University, Hyderabad,
Telangana State, India 500007 4Research Scholor, Department of Geography, Osmania Unviersity, Hyderabad, Telangana State,
India
Abstract: Everyone is aware that modern cities are performing more and more of services necessary to the
functioning of society. There is awareness that the vital services are not performed in the same proportions by
all cities. Almost every geographer would identify Detroit as a manufacturing city, Glasgow as a port city,
Manchester as Industrial city and Beijing as a Trading center there by indicating that one city does more than
its share of manufacturing another provides trade and few facilitates the market for the finished goods.
Perhaps this classification is done more by faith or intuition than on the basis of exact knowledge. At what point
does an economic activity become more important enough in the city to be of special significance? Can criteria
be devised that will determine which city should be labeled manufacturing or trade cities and centers for
market?
Telangana is the 29th state of Indian union with 3,50,03,674 population and 38.12% urban growth. Around
30% of the urban population is residing in the capital city of Hyderabad. The total number of cities during 2011
census was 160. The economic activity is the main cause for the city growth. Standard deviation procedure
applied for city classification. These cities with strong economic potential have great scope for rapid
development by using innovative technology and there by rising as creative centers have made them to emerge
and transform as smart cities. It is the purpose that this paper presents a methodology that will form a basis for
such classification.
Keywords: Modern Cities, Economic Activity, Smart Cities, Innovative Technology.
1. INTRODUCTION
A smart city is an urban development vision to integrate multiple information and communication
technology (ICT) solutions in a secure fashion to manage a city’s assets – the city’s assets include, but
not limited to, local departments information systems, schools, libraries, transportation
systems, hospitals, power plants, water supply networks, waste management, law enforcement, and
other community services. The goal of building a smart city is to improve quality of life by using
technology to improve the efficiency of services and meet residents’ needs. ICT allows city officials
to interact directly with the community and the city infrastructure and to monitor what is happening in
the city, how the city is evolving, and how to enable a better quality of life. Through the use of
sensors integrated with real-time monitoring systems, data is collected from citizens and devices -
then processed and analyzed. The information and knowledge gathered are keys to tackling
inefficiency.
ICT is used to enhance quality, performance and interactivity of urban services to reduce
costs and resource consumption and to improve contact between citizens and government. Smart city
applications are developed with the goal of improving the management of urban flows and allowing
for real time responses to challenges. A smart city may therefore be more prepared to respond to
Evolution of Smart City Concept and its Economic Performance: A Study of Cities in Telangana State of
India
International Journal of Research in Geography (IJRG) Page | 85
challenges than one with a simple 'transactional' relationship with its citizens. Other terms that have
been used for similar concepts include cyberville, digital city, electronic communities,
flexicity, information city, intelligent city, knowledge-based city, MESH city, telecity,
teletopia, Ubiquitous city, wired city.
Smart city concept came into existence in India in recent decades. There are various reasons for the
city growth. India is basically agriculture country. Agriculture and agricultural products has initially
given scope for the emergence of market in the towns. This resulted migration from rural to urban. As
the industries have been establishment as an apart of developmental policies; it accelerated the growth
of the town. The modern economic policies has brought various developmental sectors such as service
sectors (education, health, basic infrastructure etc) and small and medium scale manufacturing and
package industries and technology oriented software industries and given scope for international trade
in Indian towns. All such towns holding various economic activities; modern and traditional at various
degrees of concentration are responsible for the city growth. The rate of concentration of these
economic activities depends upon nature of the city and its geographical conditions. Such city attracts
large population and provides the better livelihood. Bigger cities attracted more population and
undergone rapid growth and as a result there was great pressure on basic services with more
effectiveness. The necessity of smart city and levels of economic activities in the cities of Telangana
are examined.
The cities highly concentrated with one economic activity may also have the similar concentration of
another type of economic activity too. Such towns may undergo more development. Some towns do
not rank high in any of the economic activities are lumped together in a single diversified group. In
order to understand urban role in national and in regional economy the study of functional
classification of towns is of vital importance. The term ‘function’ refers to the economic activity
which is performed by a town. When the proportion of workers in one activity is greater than the
others it indicates the dominant function of a town. The ‘New Towns’ are the places which are
emerged and developed in Telangana after the independence have a great disparity in their
development and the functional base of the towns.
Predominance of one activity over the other is the result of industrialization, specialization and
division of labour. Even in pre- industrial cities, a considerable number of functions were common but
they were based on simple handicraft economy and were served by a relatively unelaborated system
of communications. As a result, although their inhabitants were employed in a wide range of
occupations, the structure of employment in those cities was much simpler than that of the modern
world, both in terms of size of labour force and division of labour.
Generally the towns are distinguished or defined by a critical size limit. It is not only size which
matters, but the occupational pattern also adds a number of distinctive features to towns. In many
countries they are defined on the basis of total percentage of workers employed in dominant activities
rather than on the basis of population size or density.
If some activity is concentrated above certain limit than such activity dominates the town economic
life and becomes its major function. Functional classifications of the towns in Telangana is been
studied in detail.
The structure of any town is associated with the past and the present population, with its concomitant
social and economic status, distinctive occupations and functions. Even the total population has its
implications on the structure of the city, it gives information about the size of the labour force and the
nature of the services, which a city is likely to offer.
2. REVIEW OF LITERATURE
Arhtur Salz (1944) defines it as a specific activity with a market value which an individual continually
pursues for the purpose of obtaining a steady flow on income. This activity also determines the social
position of the individual.
Evolution of Smart City Concept and its Economic Performance: A Study of Cities in Telangana State of
India
International Journal of Research in Geography (IJRG) Page | 86
According to Everett Hughes (1965) an occupation in essence, is not some particular set of activities;
it is the part of an individual in any outgoing set of activities. Richard, H. Hall has defined occupation
in the book Occupational and Social Structure as the variety of activities and their outcomes that must
be taken into account in the analysis of occupations. An occupation is the social role performed by
adult members of society that directly or indirectly yields social and financial consequences and that
constitutes a major focus in the life of the adult.
Chauncy Haris (1943) worked out the most significant and influential of all functional classification
of cities. The criteria to classify each class of city was chosen on the basis of analysis of cities of well
recognized type of economic activity, an empirical solution has been evolved by assigning higher
percentage of some functions than others.
Qazi Ahmad (1965) used 62 variables to classify 102 Indian cities on the basis of their functions. He
found through his factor analysis that one dimension were required to account for over 70 percent of
the correlations among variables. Ashok Mitra (1971, 1973) used seven categories of workers as
variables grouped into three major functional type viz. Manufacturing, Trade and Transport and
Services.
According to Subhash Kothawale (2011) in order to understand urban role in National as well as in
Regional economy the study of functional classification of towns is of vital importance. The term
‘function’ refers to the economic activity which is performed by a town and when the proportion of
workers in one activity is greater than the others that represent the dominant function of a town.
3. STUDY AREA
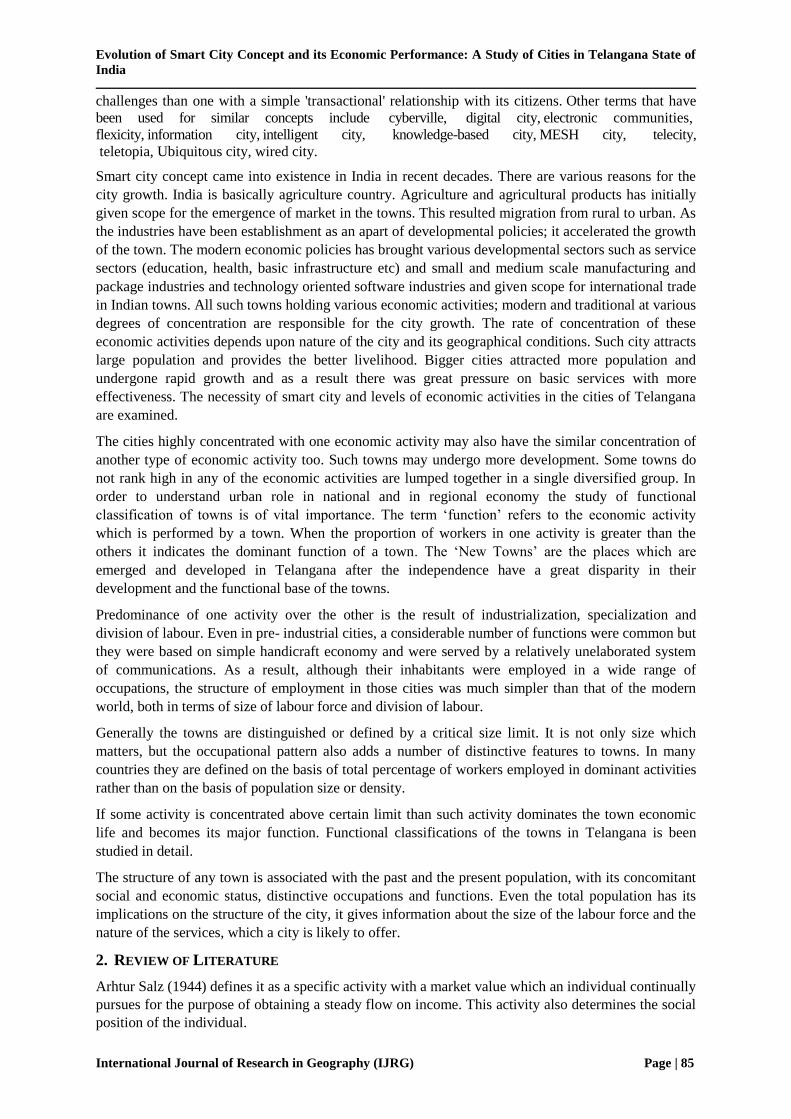
Telangana is the newly formed 29th state of India on 2nd June, 2014. As per 2011 census, there are
total 160 cities which are categorized from class I to class VI. There are three class I cities i.e
Hyderabad, Warangal and Karimnagar are identified as ‘Smart cities’ by the government of India. The
other cities in the state with similar characteristic of the smart cities are Adilabad, Nizamabad,
Nalgonda, Khammam and Mahabubnagar. All these cities are the districts head quarters (Macro
administrative unit) of Telangana.
Table1. Area and Population of Towns in Telangana (1961-2011)
Sl.No City Name Total Population
1961 1971 1981 1991 2001 2011
1 Hyderabad * 1,58,162 2,10,781 29,64,638 36,12,427 39,43,323
2 Warangal * 156,106 2,07,520 3,35,150 4,47,657 5,30,636 3,64,611
3 Karimnagar * 31,554 48,918 86,125 148,583 205,653 2,83,657
4 Adilabad 20,970 30,368 53,482 84,255 109,529 1,17,167
5 Nizamabad 79,093 1,15,640 1,83,061 241,034 288,722 3,11,152
6 Nalgonda 24,383 33,126 62,458 84,910 1,10,286 1,54,326
7 Khammam 35,888 56,919 98,757 1,27,992 1,59,544 1,84,210
8 Mahabubnagar 35,588 51,756 87,503 1,16,833 1,30,986 1,90,400
Source: Published book from Census of India, 2011.
Table2. Growth rate of Population in Telangana towns (1951-2011)
Sl.No City Name 1961-71 1971-81 1981-91 1991-2001 2001-2011
1 Hyderabad*
25 92.89 17.93 8.39
2 Warangal* 24.78 38.1 25.13 15.64 -45.53
3 Karimnagar* 35.5 43.2 42.04 27.75 27.5
4 Adilabad 30.95 43.2 36.52 23.08 6.52
5 Nizamabad 31.6 36.8 24.05 16.52 7.21
6 Nalgonda 26.39 47 26.44 23.01 28.54
7 Khammam 36.95 42.4 22.84 19.78 13.39
8 Mahabubnagar 31.24 40.9 25.1 10.8 31.2
Source: Published book from Census of India, 2011
Evolution of Smart City Concept and its Economic Performance: A Study of Cities in Telangana State of
India
International Journal of Research in Geography (IJRG) Page | 87
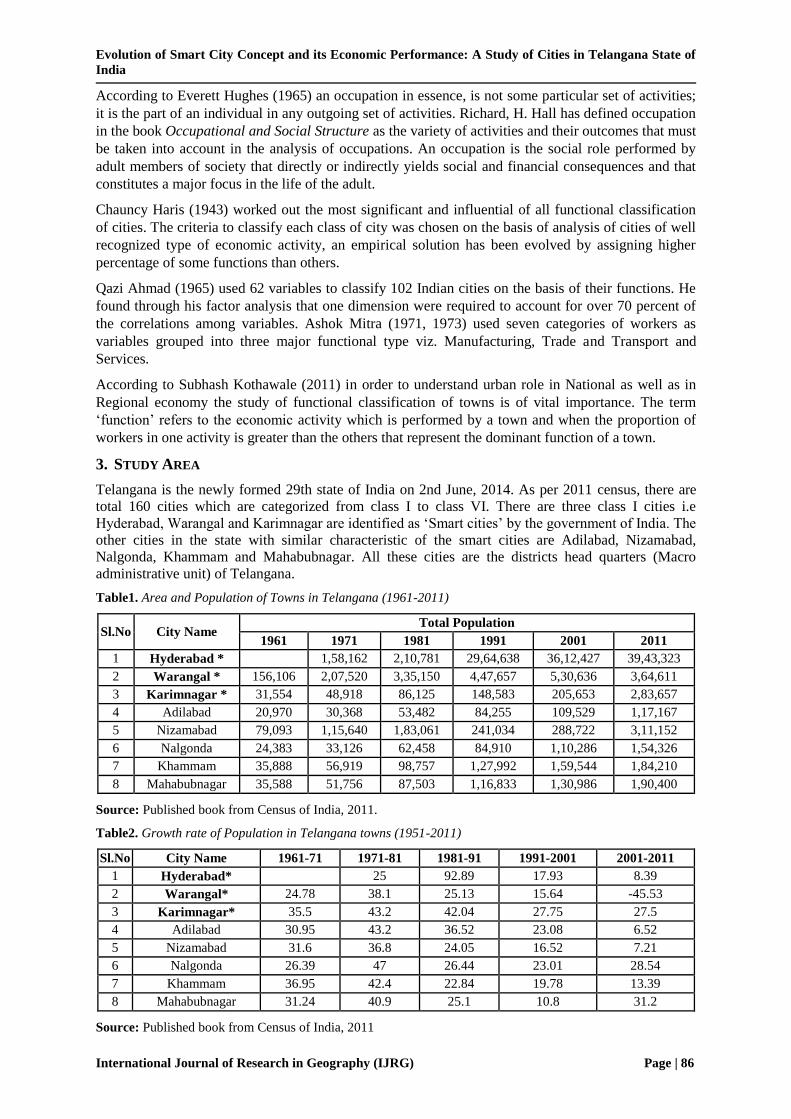
Table 3: Population density of Towns in Telangana (1961-2011)
Sl. No City Name 1961 1971 1981 1991 2001 2011
1 Hyderabad * 20919.8 22836
2 Warangal * 2511.36 3774.46 6095.85 8142.18 7803.47 5361.93
3 Karimnagar * 2971.19 4606.21 8109.7 6237.74 8633.63 11908.4
4 Adilabad 1044.84 1513.1 2664.77 3592.96 6646.18 7109.65
5 Nizamabad 2145.77 3137.28 4966.39 6539.18 9466.3 10201.7
6 Nalgonda 1906.41 2594.05 4890.99 6004.95 9306.84 13023.3
7 Khammam 4134.56 6557.49 5329.57 6907.29 8610.04 9941.18
8 Mahabubnagar 4580.18 5222.6 8829.77 8527.96 9561.02 13897.8
Source: Published book from Census of India, 2011.
Table 4: Area of Telangana Towns - 1971 to 2016 and Variation (in Square Kilometers)
City / Town 1971 2016 Variation
Hyderabad 172 650 478
Warangal 14.84 57.6 42.76
Karimnagar 7.31 26.94 19.63
Khammam 5.88 22.19 16.31
Nizamabad 8.05 23.65 15.6
Nalgonda 2.81 15.07 12.26
Mahbubnagar 4.16 15.17 11.01
Adilabad 5.69 14.03 8.34
Source: Prepared by author
4. OBJECTIVES
To study the historical background of the smart cities identified by the Government of India in
Telangana state.
To study the concentration levels of economic activities in the smart cities
To examine and analyze the factors responsible for the variation in concentration levels of the
economic activities.
To study the physical and geographical factors in correlation the economic factors.
To examine the status of services in smart cities in Telangana
5. METHODOLOGY
‘Smart City’ concept in Telangana state and in Indian sub-continent examines Institutional
infrastructure, Physical infrastructure and social infrastructure. The essentiality for improving
competitiveness, sustainability and quality of life are considered as the basic pillars of smart use. It is
also important to identify the basic economic source of the city which give rise to the economic
development and implementation of smart city strategies.
The study focuses on the smart governance where the plan and perspectives of the city growth and
city development is examined. It identifies the levels of development in the smart cities, i.e.
‘Retrofitting development’, ‘Redevelopment’, ‘Green field development’ and ‘PAN-city
development’ in respective smart cities in Telangana.
The detailed data is generated for the above perspectives of smart cities. The population and economic
activities data for those townsis obtained from Census of India. The study focuses on secondary data
sources for the detailed study of economic structure of the smart cities.
6. PROCEDURE
Procedure involves the work force of individual activity is proportionately calculated with the total
workers and the average of the proportions of the individual activity is calculated. Standard deviation
method is applied to indicate the degree of variation from the average and hence the towns are
grouped into appropriate categories.
The method is applied to the total number of towns from 1961 to 2011. The towns providing more
than one type of service in outstanding proportions are organized systematically.
Evolution of Smart City Concept and its Economic Performance: A Study of Cities in Telangana State of
India
International Journal of Research in Geography (IJRG) Page | 88
Occupation has been defined distinctly by a number of economists. Further it must have multiple
consequences for the individual and society.
Standard Deviation (SD) is the statistical methods to find out Mean values. Geographical Information
System (GIS) is used for mapping and analysis. The classification is done based on values and divided
into 3 categories. i) Mean to (Mean+ 1SD) is considered as one standard deviation (ii) (Mean+ 1SD)
to (Mean+2SD) is considered as two standard deviation (iii) (Mean+2SD) to (Mean +3SD) is
considered as three standard deviation.
7. INDIAN SMART CITY CONCEPT
The Indian government has announced 100 smart cities across the country and allocated 1000 crores
to towards ‘smart city’ mission. The mission intends to promote adoption of smart solutions for
efficient usage of available assets, resources and infrastructure. The ‘smart city’ means ‘A city
equipped with basic infrastructure and to give decent quality of life, a clean and sustainable
environment through application of some smart solutions’. The basic infrastructure like, assured water
and electricity supply, sanitation and solid waste management, efficient urban mobility and public
transport, robust IT connectivity, e-governance and citizen participation, safety and security of
citizens.
The smart solution with public information, grievance redressal, electronic service delivery, citizens’
engagement, waste to energy & fuel, waste to compost, 100% treatment of waste water, smart meters
and management, monitoring water quality, renewable source of energy, efficient energy and green
building, smart parking, intelligent traffic management system.
The Indian government also introduced ‘Smart cities council of India’ It is part of the US-based Smart
Cities Council, which is a consortium of smart city practitioners and experts, with a 100-plus member
and advisor organizations operating in over 140 countries.
The Indian Federal government is the union of states and the government has selected every state with
at least one city. Likewise, Hyderabad being a metropolitan city got opportunity in the first phase of
selection and Warangal and Karimnagar city got the opportunity in second phase of selection.
The importance of economic development in those cities is not overwhelmed. It is worthwhile to
study the economic occupation of the smart cities and other cities of Telangana for its overall
understanding. The economic occupations in most of the cities exhibits vestiges of the old handicraft
industries and labour force engaged in modern manufacturing industry.
A further layer is provided by the workers who render services to the customers living outside the
urban areas and in addition, a proportion of those in the service occupations are concerned with
catering to the population of the city itself. An attempt has been made to study the ‘smart cities’ in
Telangana and its economic importance and as well as economic occupation of towns; its employment
pattern and major activities in which the majority of the urban forces is engaged. Further the
economic base of Telangana towns has been examined.
Total 9 cities in Telangana have been examined from 1961 to 2011 in terms of area, population
growth rate, density and economic occupation with well established statistical principles. The unique
economic characteristics of town is identified based on well known statistical principle of Empirical
rule (68-95-99.7) is applied and found a high degree of variation from the average of a town if it is
categorized in +3 standard deviation (SD) and if any town with extraordinary performance in a
particular service are categorized as >3 SD. The towns which fall below +2 SD in any service are
considered as near to average cases. The study of town’s is found to have a diverse level of
occupations for different services. It is mentioned that the total number of activities in 1961 was
identified as 9 by the population census of India. The total number of activities in 1971 was 9;the total
number of activities in 1981 was 4; The total number of economic actives 1991 was 9; The total
number of economic activities in 2001 and 2011 was identified as 4 only.
7.1. Hyderabad City
Hyderabad city is well known to world as ‘Hitech city’. It ranked 1st in “Best of the World - 20 places
you should see in 2015” by National Geographic, San Francisco and “Best city for MICE (Meetings,
Incentives, Conferencing and exhibition) in Asia” in 2012. It is has world’s 3rd most affordable office
Evolution of Smart City Concept and its Economic Performance: A Study of Cities in Telangana State of
India
International Journal of Research in Geography (IJRG) Page | 89
location and one of the 41 “Must Visit” cities in the world by The New York Times. Hyderabad was
rated 2nd among India’s ‘Hottest IT destinations’ by Rediff Business and 2nd most attractive
destination for “Doing Business in India” by The World Bank. It clearly indicated that, the Hyderabad
city is in the way to serve smart world to people of city. With the advent of development of
technology and smart solutions,
Hyderabad city was the capital of Andhra Pradesh state till June 2nd2014 and presently it is the
capital of the Telangana state after the bifurcation of Andhra Pradesh state. The city was built by the
Nizam kings 425 years ago; later it also served as the British residency for some time between
1700AD to 1947AD. It was built on the bank of the Musi rives (extinct) which passes through the
center of the city. There was number of lakes which used tofacilitate water for agriculture, drinking
and domestic purpose.
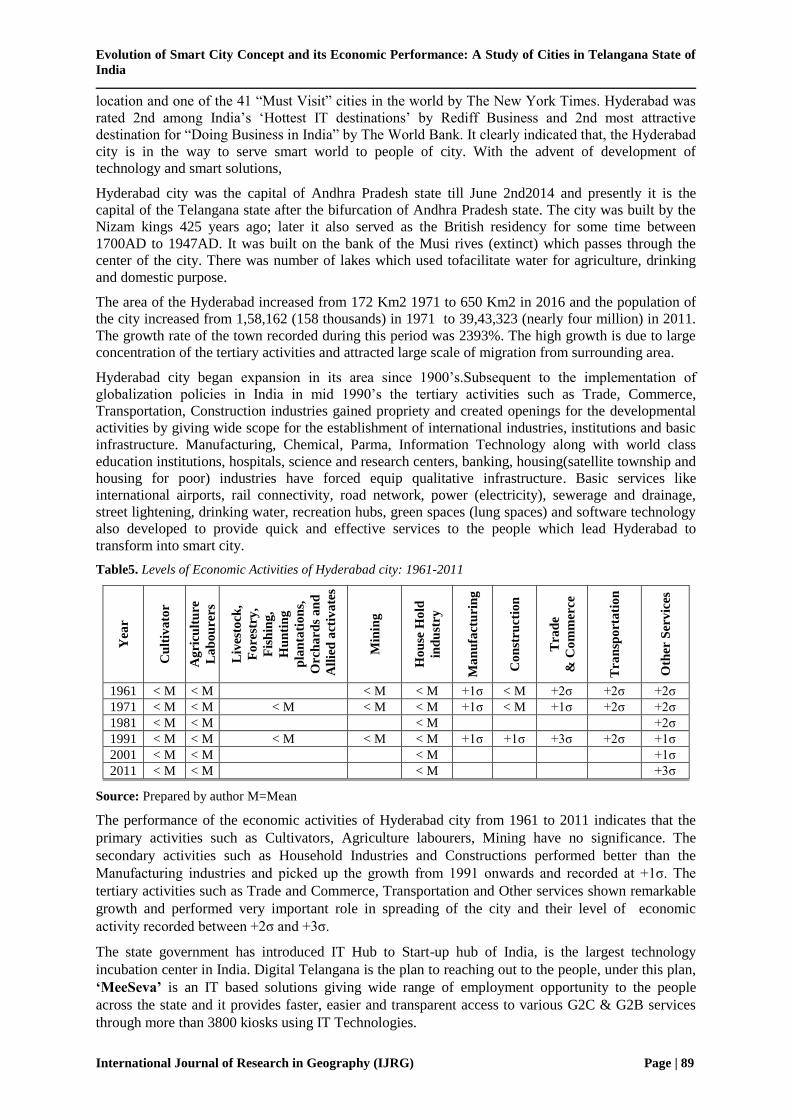
The area of the Hyderabad increased from 172 Km2 1971 to 650 Km2 in 2016 and the population of
the city increased from 1,58,162 (158 thousands) in 1971 to 39,43,323 (nearly four million) in 2011.
The growth rate of the town recorded during this period was 2393%. The high growth is due to large
concentration of the tertiary activities and attracted large scale of migration from surrounding area.
Hyderabad city began expansion in its area since 1900’s.Subsequent to the implementation of
globalization policies in India in mid 1990’s the tertiary activities such as Trade, Commerce,
Transportation, Construction industries gained propriety and created openings for the developmental
activities by giving wide scope for the establishment of international industries, institutions and basic
infrastructure. Manufacturing, Chemical, Parma, Information Technology along with world class
education institutions, hospitals, science and research centers, banking, housing(satellite township and
housing for poor) industries have forced equip qualitative infrastructure. Basic services like
international airports, rail connectivity, road network, power (electricity), sewerage and drainage,
street lightening, drinking water, recreation hubs, green spaces (lung spaces) and software technology
also developed to provide quick and effective services to the people which lead Hyderabad to
transform into smart city.
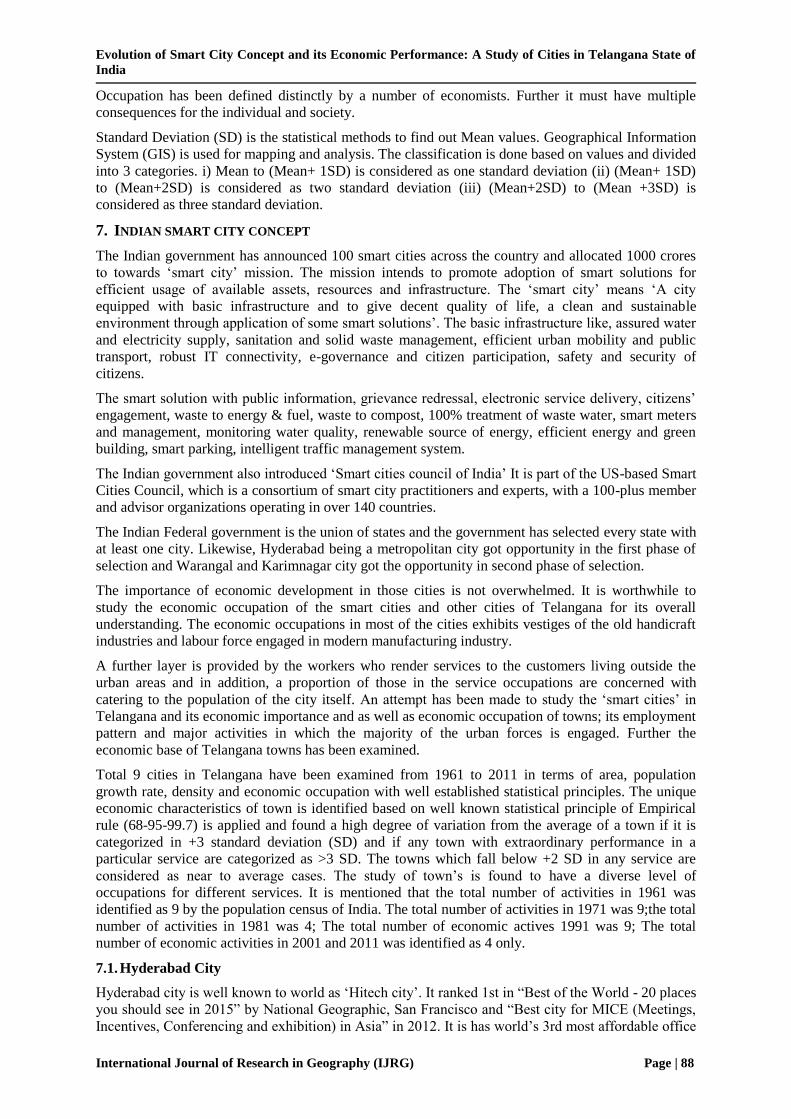
Table5. Levels of Economic Activities of Hyderabad city: 1961-2011
Yea
r
Cu
ltiv
ato
r
Ag
ricu
ltu
re
La
bo
ure
rs
Liv
esto
ck,
Fo
rest
ry,
Fis
hin
g,
Hu
nti
ng
pla
nta
tio
ns,
Orc
ha
rds
an
d
All
ied
act
iva
tes
Min
ing
Ho
use
Ho
ld
ind
ust
ry
Ma
nu
fact
uri
ng
Co
nst
ruct
ion
Tra
de
& C
om
mer
ce
Tra
nsp
ort
ati
on
Oth
er S
erv
ices
1961 < M < M < M < M +1σ < M +2σ +2σ +2σ
1971 < M < M < M < M < M +1σ < M +1σ +2σ +2σ
1981 < M < M < M +2σ
1991 < M < M < M < M < M +1σ +1σ +3σ +2σ +1σ
2001 < M < M < M +1σ
2011 < M < M < M +3σ
Source: Prepared by author M=Mean
The performance of the economic activities of Hyderabad city from 1961 to 2011 indicates that the
primary activities such as Cultivators, Agriculture labourers, Mining have no significance. The
secondary activities such as Household Industries and Constructions performed better than the
Manufacturing industries and picked up the growth from 1991 onwards and recorded at +1σ. The
tertiary activities such as Trade and Commerce, Transportation and Other services shown remarkable
growth and performed very important role in spreading of the city and their level of economic
activity recorded between +2σ and +3σ.
The state government has introduced IT Hub to Start-up hub of India, is the largest technology
incubation center in India. Digital Telangana is the plan to reaching out to the people, under this plan,
‘MeeSeva’ is an IT based solutions giving wide range of employment opportunity to the people
across the state and it provides faster, easier and transparent access to various G2C & G2B services
through more than 3800 kiosks using IT Technologies.
Evolution of Smart City Concept and its Economic Performance: A Study of Cities in Telangana State of
India
International Journal of Research in Geography (IJRG) Page | 90
‘E-Panchayat’ is to provide computerized services at the lowest level of the government through e-
Panchayat initiative in 2,400 Gram Panchayats (GPs). To set up “one stop shop” to facilitate payments
relating to MGNREGS, pensions, watershed and other government programs. E-Panchayat brings in
transparency and accountability. Free Wi-Fi is provided for Hyderabad people by the State
Government in order make the entire city a fully Wi-Fi enabled city by the end of 2015.
1971 (172 Sq. Km) 2016 (650 Sq. Km) Variation (478 Sq. Km)
Figure. Hyderabad City Expansion: 1971-2016
7.2. Warangal City
Warangal city is the second largest populated city in Telangana. Historically, Warangal was the
capital of great Kakatiya dynasty during 13th Century. Government of India recognized Warangal as
‘Heritage city’ considering its historic importance in the context of Kakatiya dynasty. Warangal Fort
and Thousand Pillar Temple are some of the ASI protected world heritage assets that attract 23
million people annually (Dept. of Tourism, Govt. of Telangana, 2015).
Warangal town is well connected with road and railway network, it has been serving as educational
hub for entire southeastern part of the state. The key national and state level institutions are located in
the city. NIT(National Institute of Technology), Kakatiya University, Kakatiya Medical college,
Kakatiya Institute of Technology and science (KITS) etc., nearly 25,000 students are studding in this
institutions.
Warangal is acting as hub of local trade and commercial activity for the region. Warangal is one of the
key producers of long-staple cotton among Telangana districts. Enumamula market is the Asia’s
biggest cotton market located in the city. Nearly, 100,000 people commute daily to Warangal city.
However, the city does not have a planned CBD, which promotes business tourism in the form of
hotels, conventions centers, interpretation centers and entertainment centers.
The city had good water resources, endowed with a number of lakes, meetings needs of drinking
water and irrigation. However, they are not utilized to its potential. Efficient and strategic utilization
of such assets will be helpful for retaining tourists to stay one more day extra, will help improving city
economy.
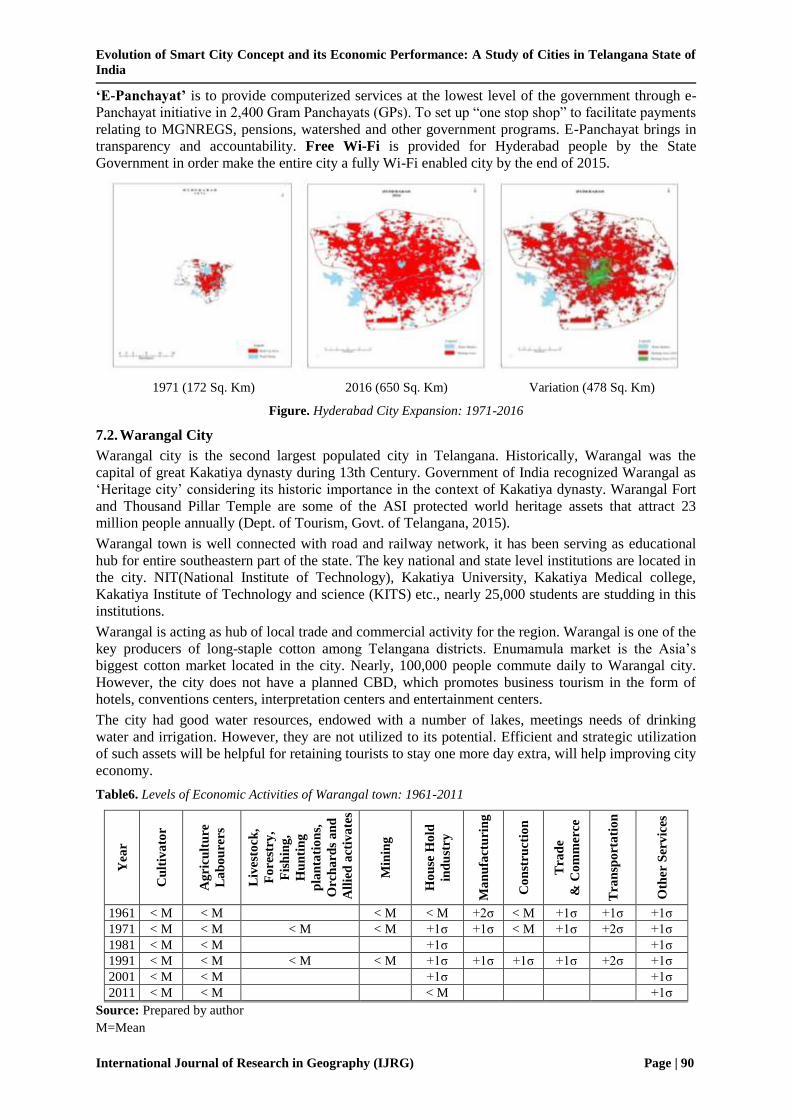
Table6. Levels of Economic Activities of Warangal town: 1961-2011
Yea
r
Cu
ltiv
ato
r
Ag
ricu
ltu
re
La
bo
ure
rs
Liv
esto
ck,
Fo
rest
ry,
Fis
hin
g,
Hu
nti
ng
pla
nta
tio
ns,
Orc
ha
rds
an
d
All
ied
act
iva
tes
Min
ing
Ho
use
Ho
ld
ind
ust
ry
Ma
nu
fact
uri
ng
Co
nst
ruct
ion
Tra
de
& C
om
mer
ce
Tra
nsp
ort
ati
on
Oth
er S
erv
ices
1961 < M < M
< M < M +2σ < M +1σ +1σ +1σ
1971 < M < M < M < M +1σ +1σ < M +1σ +2σ +1σ
1981 < M < M
+1σ
+1σ
1991 < M < M < M < M +1σ +1σ +1σ +1σ +2σ +1σ
2001 < M < M
+1σ
+1σ
2011 < M < M
< M
+1σ
Source: Prepared by author
M=Mean
Evolution of Smart City Concept and its Economic Performance: A Study of Cities in Telangana State of
India
International Journal of Research in Geography (IJRG) Page | 91
The performance of the economic activities of the Warangal city from 1961 to 1981 indicates that the
primary activity such as cultivators, agricultural labourers, live stock, fishingand mining has no
significance. The secondary activities such as household industries, manufacturing has significant
contribution for the growth of the city since 1961. Construction activity gained its importance only in
1991 and its performance was recorded at +1σ. The tertiary activity such as Trade and Commerce,
Transportation and Other services are constantly contributing for the city growth and the level of
economic activity was recorded between +1σ to +2σ. Transportation performed a major role for the
city spread.
Presence of railway zone, National highway abundant water resources endowed with the number of
lakes are the important feature attracting the manufacturing industries besides the rich heritageis
responsible for development of tourism industry.Finally the city turned into education hub and
recreation centre. All these are the reasons forced the city to equip with basic urban services. Hence it
needs to improve the smart technology to reach to the public easily and quickly. The government of
India in 2016 recognised Warangal as smart city.
The administrative efficiency improved due to the use of information and communication and
technology (ICT). Biometric has been used to aid in tracking attendance of employees in GWMC and
staff salaries are distributed based on biometric attendance. Online system for monitoring their
attendance has resulted in better service delivery. For grievance redressal, the city administration
implemented dedicated grievance redressal system through “M-Governance Mobile App” since
2015 and toll free numbers are received through complaints from citizens, provided ‘Online grievance
redressal system implemented since 2012. The city established Mee-Seva centers for all transactions.
The city has taken steps for safety and security of its citizens; it is under total 4709 CCTV vigilance
and 41 block cameras installed in the city. 17 junctions monitored through CCTVs. All cameras and
CCTV are linked control room.
E-Office-GWMC has been made as office of “e-Office – a digital workplace solution” in 2015,
whereby it is becoming paper-less office. Birth-death certificates, property tax, trade license,
grievance registration and redressal status, pension status, tap application, all tax and rent enquiries,
department details, budget, DCB status, Government programmes and ongoing projects, GWMC
employees attendance and other details are made it online.
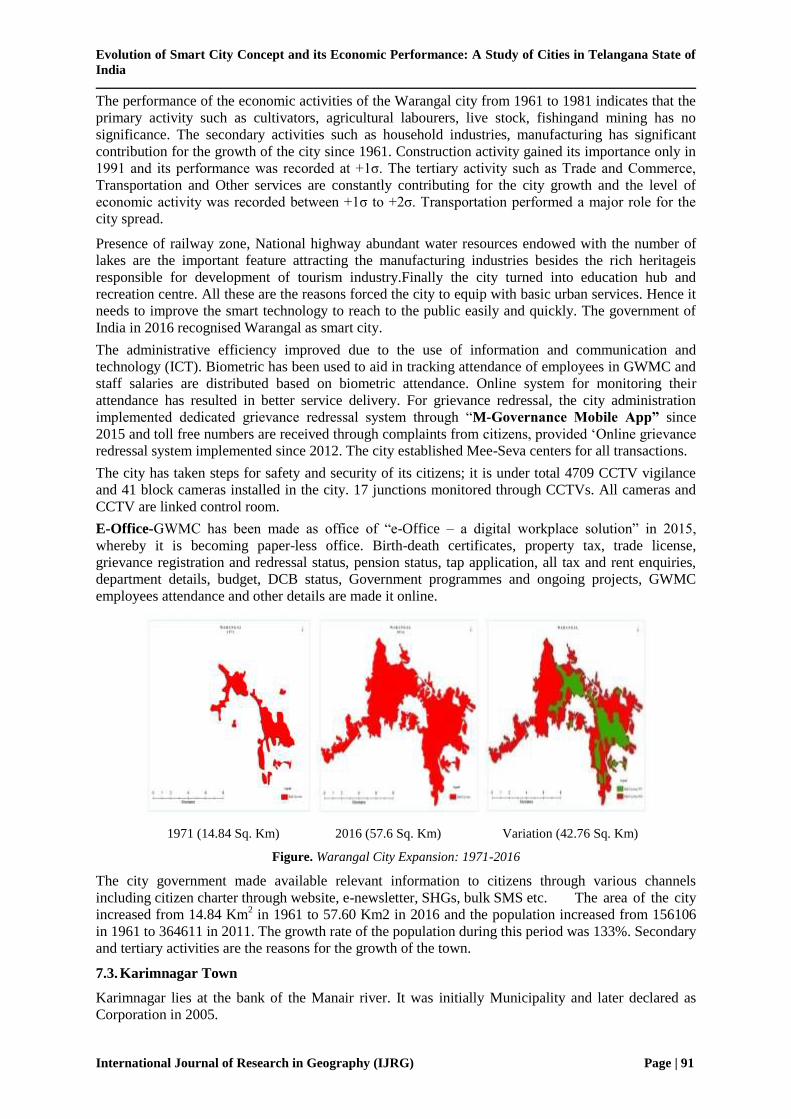
1971 (14.84 Sq. Km) 2016 (57.6 Sq. Km) Variation (42.76 Sq. Km)
Figure. Warangal City Expansion: 1971-2016
The city government made available relevant information to citizens through various channels
including citizen charter through website, e-newsletter, SHGs, bulk SMS etc. The area of the city
increased from 14.84 Km2 in 1961 to 57.60 Km2 in 2016 and the population increased from 156106
in 1961 to 364611 in 2011. The growth rate of the population during this period was 133%. Secondary
and tertiary activities are the reasons for the growth of the town.
7.3. Karimnagar Town
Karimnagar lies at the bank of the Manair river. It was initially Municipality and later declared as
Corporation in 2005.

Evolution of Smart City Concept and its Economic Performance: A Study of Cities in Telangana State of
India
International Journal of Research in Geography (IJRG) Page | 92
The town is predominantly an agricultural center in the state, the vast agricultural area around the
town is watered by the Godavari River. The presence of many large scale industries like NTPC,
Kesoram Cements, Ramagundam-singareni collieries etc. are located in and around Karimnagar. The
locals specialize in silver filigree, a delicate form of metal work added for the growth of the city. The
area of the city has increased from 7.31 Km2 in 1971 to 26.94 Km2 in 2016 and the density of the
city increased from 2,511 in 1961 to 11,909 in 2011. The growth rate of the population during this
period was 798%. Tertiary activities are the main reasons for the growth of the city.
Table7. Levels of Economic Activities of Karimnagar town: 1961-2011
Yea
r
Cu
ltiv
ato
r
Ag
ricu
ltu
re
La
bo
ure
rs
Liv
esto
ck,
Fo
rest
ry,
Fis
hin
g,
Hu
nti
ng
pla
nta
tio
ns,
Orc
ha
rds
an
d
All
ied
act
iva
tes
Min
ing
Ho
use
Ho
ld
ind
ust
ry
Ma
nu
fact
uri
ng
Co
nst
ruct
ion
Tra
de
& C
om
mer
ce
Tra
nsp
ort
ati
on
Oth
er S
erv
ices
1961 < M < M
< M < M < M < M +1σ +1σ +3σ
1971 < M < M < M < M < M < M < M +1σ +2σ +2σ
1981 < M < M
< M
+2σ
1991 < M < M +1σ < M < M < M +1σ +2σ +2σ +2σ
2001 < M < M
< M
+1σ
2011 < M < M
< M
+1σ
Source: Prepared by author
M=Mean
The performance of the economic activity of the Karimnagar city from 1961 to 2011 indicates that the
primary activities such as Cultivators, Agricultural labourers and Mining show no significance.
Livestock, Forestry, Fishing hunting show significant role and their performance level is at +1σ in
1991. The secondary activities such as Household industries, Manufacturing do not have significant
contribution for the city growth. Constriction activity could perform up to +1σ in 1991. The tertiary
activities such as Trade and Commerce, Transportation and Other services performance is high and
the level of economic activity is recorded between +1σ to +2σ.
The smart city activities in Karimnagar city indicates that, AMRUT it includes the basic services to
citizens, urban transport and service level improvement plan (SLIP) especially for green space and
parks. The AMRUT firstly focused on improvement in service levels in the city. The first step is to
assess the existing situation and service levels gaps for Storm Water Drainage. This will also include
existing institutional framework for the sector. The zone wise data shall be used in identifying the
gaps. These zone-wise gaps will be added to arrive at city level service gaps. Coverage of storm water
drainage network in the city has 100% sustainable standards. Secondly, it focuses on urban transport
included non-transport, ferries and water ways. The SLIP is to assess the existing situation and service
levels gaps for organised Green Space and Parks based on standards prescribed in URDPFI guidelines
and national building Codes. This shall also include describing existing institutional framework vis-à-
vis development and maintenance of organised green space/ parks.
1971 (7.31 Sq. Km) 2016 (26.94 Sq. Km) Variation (19.63 Sq. Km)
Figure. Karimnagar City Expansion: 1971-2016
Evolution of Smart City Concept and its Economic Performance: A Study of Cities in Telangana State of
India
International Journal of Research in Geography (IJRG) Page | 93
7.4. Nizamabad Town
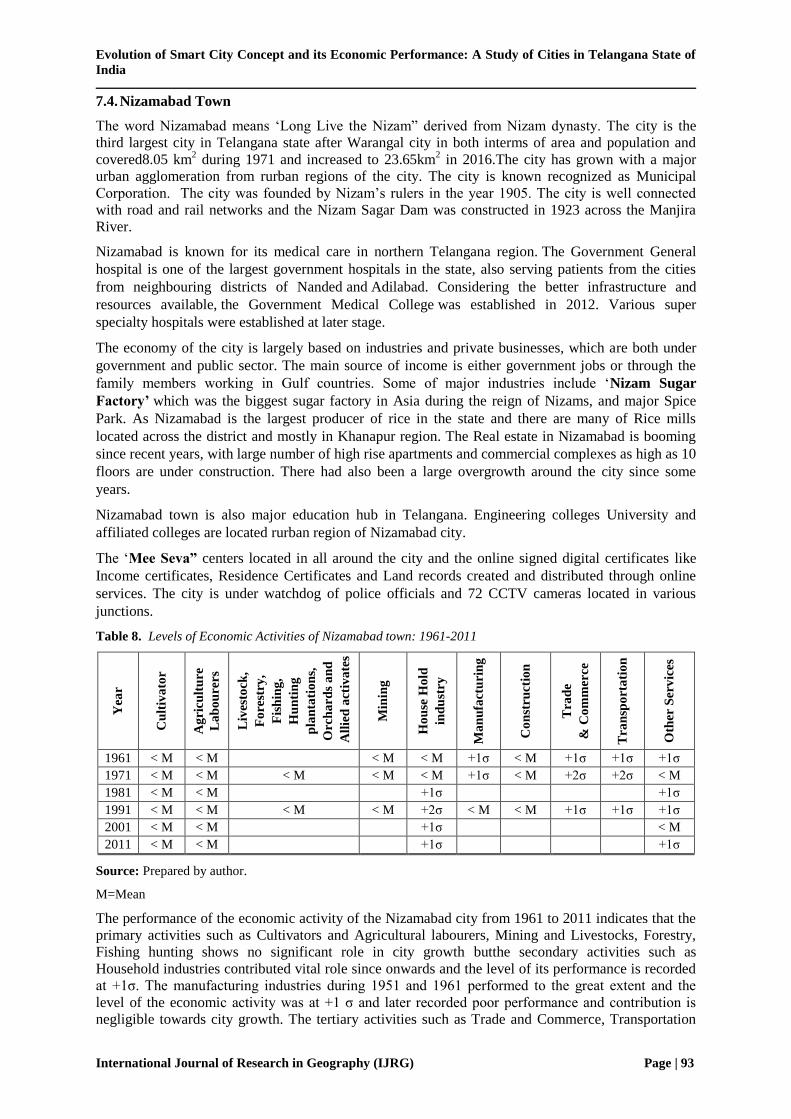
The word Nizamabad means ‘Long Live the Nizam” derived from Nizam dynasty. The city is the
third largest city in Telangana state after Warangal city in both interms of area and population and
covered8.05 km2 during 1971 and increased to 23.65km
2 in 2016.The city has grown with a major
urban agglomeration from rurban regions of the city. The city is known recognized as Municipal
Corporation. The city was founded by Nizam’s rulers in the year 1905. The city is well connected
with road and rail networks and the Nizam Sagar Dam was constructed in 1923 across the Manjira
River.
Nizamabad is known for its medical care in northern Telangana region. The Government General
hospital is one of the largest government hospitals in the state, also serving patients from the cities
from neighbouring districts of Nanded and Adilabad. Considering the better infrastructure and
resources available, the Government Medical College was established in 2012. Various super
specialty hospitals were established at later stage.
The economy of the city is largely based on industries and private businesses, which are both under
government and public sector. The main source of income is either government jobs or through the
family members working in Gulf countries. Some of major industries include ‘Nizam Sugar
Factory’ which was the biggest sugar factory in Asia during the reign of Nizams, and major Spice
Park. As Nizamabad is the largest producer of rice in the state and there are many of Rice mills
located across the district and mostly in Khanapur region. The Real estate in Nizamabad is booming
since recent years, with large number of high rise apartments and commercial complexes as high as 10
floors are under construction. There had also been a large overgrowth around the city since some
years.
Nizamabad town is also major education hub in Telangana. Engineering colleges University and
affiliated colleges are located rurban region of Nizamabad city.
The ‘Mee Seva” centers located in all around the city and the online signed digital certificates like
Income certificates, Residence Certificates and Land records created and distributed through online
services. The city is under watchdog of police officials and 72 CCTV cameras located in various
junctions.
Table 8. Levels of Economic Activities of Nizamabad town: 1961-2011
Yea
r
Cu
ltiv
ato
r
Ag
ricu
ltu
re
La
bo
ure
rs
Liv
esto
ck,
Fo
rest
ry,
Fis
hin
g,
Hu
nti
ng
pla
nta
tio
ns,
Orc
ha
rds
an
d
All
ied
act
iva
tes
Min
ing
Ho
use
Ho
ld
ind
ust
ry
Ma
nu
fact
uri
ng
Co
nst
ruct
ion
Tra
de
& C
om
mer
ce
Tra
nsp
ort
ati
on
Oth
er S
erv
ices
1961 < M < M
< M < M +1σ < M +1σ +1σ +1σ
1971 < M < M < M < M < M +1σ < M +2σ +2σ < M
1981 < M < M
+1σ
+1σ
1991 < M < M < M < M +2σ < M < M +1σ +1σ +1σ
2001 < M < M
+1σ
< M
2011 < M < M
+1σ
+1σ
Source: Prepared by author.
M=Mean
The performance of the economic activity of the Nizamabad city from 1961 to 2011 indicates that the
primary activities such as Cultivators and Agricultural labourers, Mining and Livestocks, Forestry,
Fishing hunting shows no significant role in city growth butthe secondary activities such as
Household industries contributed vital role since onwards and the level of its performance is recorded
at +1σ. The manufacturing industries during 1951 and 1961 performed to the great extent and the
level of the economic activity was at +1 σ and later recorded poor performance and contribution is
negligible towards city growth. The tertiary activities such as Trade and Commerce, Transportation
Evolution of Smart City Concept and its Economic Performance: A Study of Cities in Telangana State of
India
International Journal of Research in Geography (IJRG) Page | 94
and Other services performed to their best level is high and the level of economic activity is recorded
between +1σ to +2σ.
1971 (8.05Sq. Km) 2016 (23.65Sq. Km) Variation (15.6Sq. Km)
Figure. Nizamabad City Expansion: 1971-2016
7.5. Nalgonda Town:
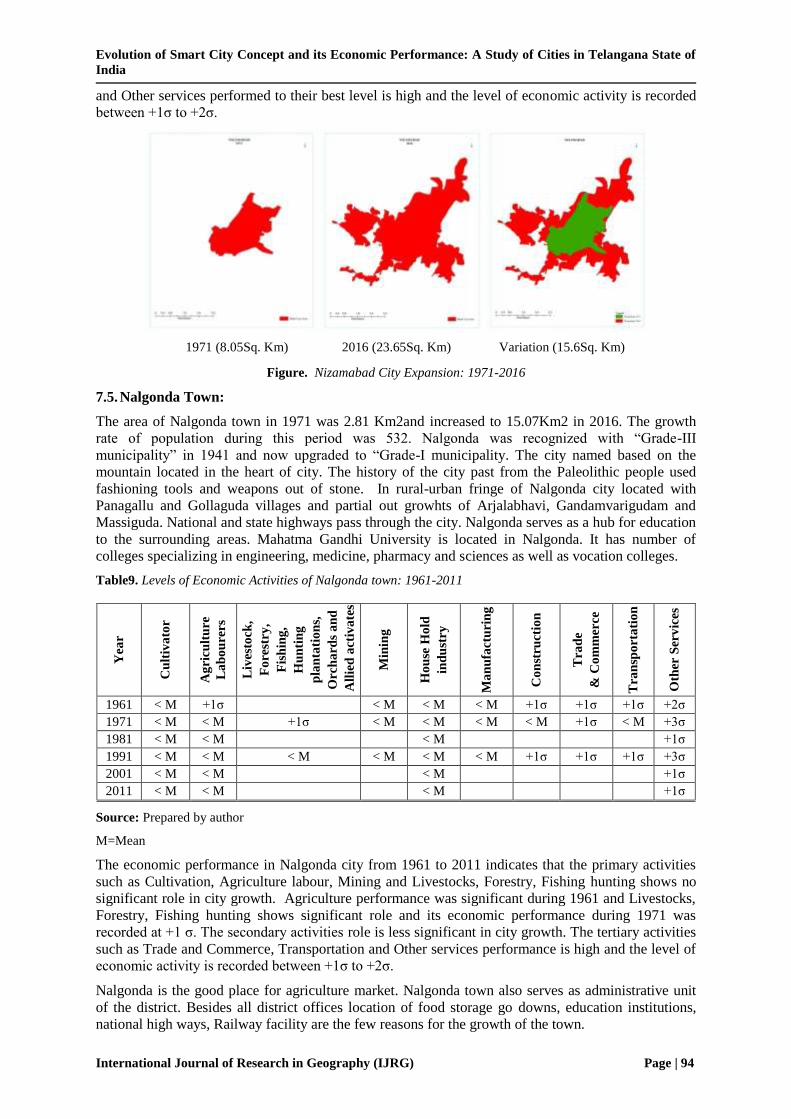
The area of Nalgonda town in 1971 was 2.81 Km2and increased to 15.07Km2 in 2016. The growth
rate of population during this period was 532. Nalgonda was recognized with “Grade-III
municipality” in 1941 and now upgraded to “Grade-I municipality. The city named based on the
mountain located in the heart of city. The history of the city past from the Paleolithic people used
fashioning tools and weapons out of stone. In rural-urban fringe of Nalgonda city located with
Panagallu and Gollaguda villages and partial out growhts of Arjalabhavi, Gandamvarigudam and
Massiguda. National and state highways pass through the city. Nalgonda serves as a hub for education
to the surrounding areas. Mahatma Gandhi University is located in Nalgonda. It has number of
colleges specializing in engineering, medicine, pharmacy and sciences as well as vocation colleges.
Table9. Levels of Economic Activities of Nalgonda town: 1961-2011
Yea
r
Cu
ltiv
ato
r
Ag
ricu
ltu
re
La
bo
ure
rs
Liv
esto
ck,
Fo
rest
ry,
Fis
hin
g,
Hu
nti
ng
pla
nta
tio
ns,
Orc
ha
rds
an
d
All
ied
act
iva
tes
Min
ing
Ho
use
Ho
ld
ind
ust
ry
Ma
nu
fact
uri
ng
Co
nst
ruct
ion
Tra
de
& C
om
mer
ce
Tra
nsp
ort
ati
on
Oth
er S
erv
ices
1961 < M +1σ
< M < M < M +1σ +1σ +1σ +2σ
1971 < M < M +1σ < M < M < M < M +1σ < M +3σ
1981 < M < M
< M
+1σ
1991 < M < M < M < M < M < M +1σ +1σ +1σ +3σ
2001 < M < M
< M
+1σ
2011 < M < M
< M
+1σ
Source: Prepared by author
M=Mean
The economic performance in Nalgonda city from 1961 to 2011 indicates that the primary activities
such as Cultivation, Agriculture labour, Mining and Livestocks, Forestry, Fishing hunting shows no
significant role in city growth. Agriculture performance was significant during 1961 and Livestocks,
Forestry, Fishing hunting shows significant role and its economic performance during 1971 was
recorded at +1 σ. The secondary activities role is less significant in city growth. The tertiary activities
such as Trade and Commerce, Transportation and Other services performance is high and the level of
economic activity is recorded between +1σ to +2σ.
Nalgonda is the good place for agriculture market. Nalgonda town also serves as administrative unit
of the district. Besides all district offices location of food storage go downs, education institutions,
national high ways, Railway facility are the few reasons for the growth of the town.
Evolution of Smart City Concept and its Economic Performance: A Study of Cities in Telangana State of
India
International Journal of Research in Geography (IJRG) Page | 95
The smart technology is been used in Nalgonda town by Municipal administration, police, revenue
department, irrigation, electricity, education institutions to reach to the public in a efficient manner.
1971(2.81Sq. Km) 2016 (15.07Sq. Km) Variatio (12.26Sq. Km)
Figure. Nalgonda City Expansion: 1971-2016
7.6. Khammam Town
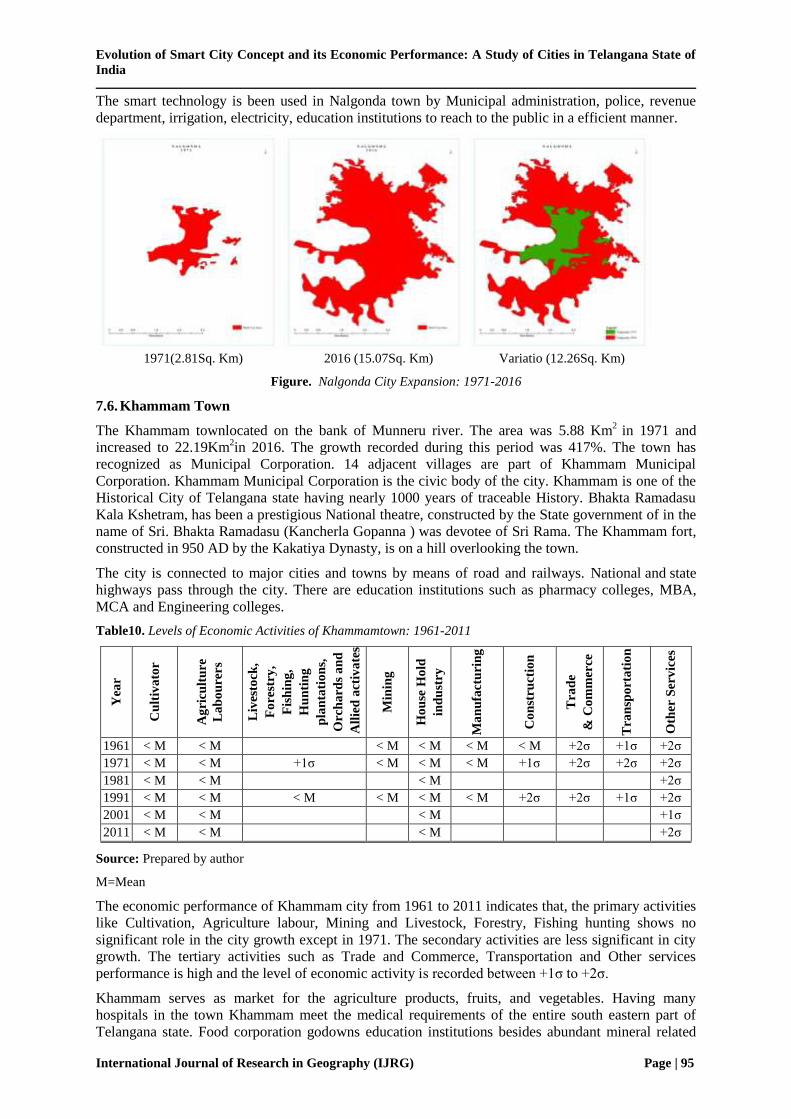
The Khammam townlocated on the bank of Munneru river. The area was 5.88 Km2
in 1971 and
increased to 22.19Km2in 2016. The growth recorded during this period was 417%. The town has
recognized as Municipal Corporation. 14 adjacent villages are part of Khammam Municipal
Corporation. Khammam Municipal Corporation is the civic body of the city. Khammam is one of the
Historical City of Telangana state having nearly 1000 years of traceable History. Bhakta Ramadasu
Kala Kshetram, has been a prestigious National theatre, constructed by the State government of in the
name of Sri. Bhakta Ramadasu (Kancherla Gopanna ) was devotee of Sri Rama. The Khammam fort,
constructed in 950 AD by the Kakatiya Dynasty, is on a hill overlooking the town.
The city is connected to major cities and towns by means of road and railways. National and state
highways pass through the city. There are education institutions such as pharmacy colleges, MBA,
MCA and Engineering colleges.
Table10. Levels of Economic Activities of Khammamtown: 1961-2011
Yea
r
Cu
ltiv
ato
r
Ag
ricu
ltu
re
La
bo
ure
rs
Liv
esto
ck,
Fo
rest
ry,
Fis
hin
g,
Hu
nti
ng
pla
nta
tio
ns,
Orc
ha
rds
an
d
All
ied
act
iva
tes
Min
ing
Ho
use
Ho
ld
ind
ust
ry
Ma
nu
fact
uri
ng
Co
nst
ruct
ion
Tra
de
& C
om
mer
ce
Tra
nsp
ort
ati
on
Oth
er S
erv
ices
1961 < M < M
< M < M < M < M +2σ +1σ +2σ
1971 < M < M +1σ < M < M < M +1σ +2σ +2σ +2σ
1981 < M < M
< M
+2σ
1991 < M < M < M < M < M < M +2σ +2σ +1σ +2σ
2001 < M < M
< M
+1σ
2011 < M < M
< M
+2σ
Source: Prepared by author
M=Mean
The economic performance of Khammam city from 1961 to 2011 indicates that, the primary activities
like Cultivation, Agriculture labour, Mining and Livestock, Forestry, Fishing hunting shows no
significant role in the city growth except in 1971. The secondary activities are less significant in city
growth. The tertiary activities such as Trade and Commerce, Transportation and Other services
performance is high and the level of economic activity is recorded between +1σ to +2σ.
Khammam serves as market for the agriculture products, fruits, and vegetables. Having many
hospitals in the town Khammam meet the medical requirements of the entire south eastern part of
Telangana state. Food corporation godowns education institutions besides abundant mineral related
Evolution of Smart City Concept and its Economic Performance: A Study of Cities in Telangana State of
India
International Journal of Research in Geography (IJRG) Page | 96
factories/ industries are located in the outskirts of the town. All district administration offices are
located in Khammam. Implementation of new economic policies by the government is leading to
acquire smart technology to reach to the public and serve them efficiently. Abundant water resources
is due to the Krishna river flowing from the town
1971 (5.88Sq. Km) 2016 (22.19Sq. Km) Variation (16.31Sq. Km)
Figure. Khammam City Expansion: 1971-2016
7.7. Adilabad Town
Adilabad town named after Adil Shahi dynasty in Bujapur sultanate in 15th century. The city was
ruled by several dynasties like Satvahans, Chalukyas, Mauryas, and Mughals. The diversifiedcultures
existing are due to the presented by Gujarati, Bengali, Marathi, and Malayalee people. The town is
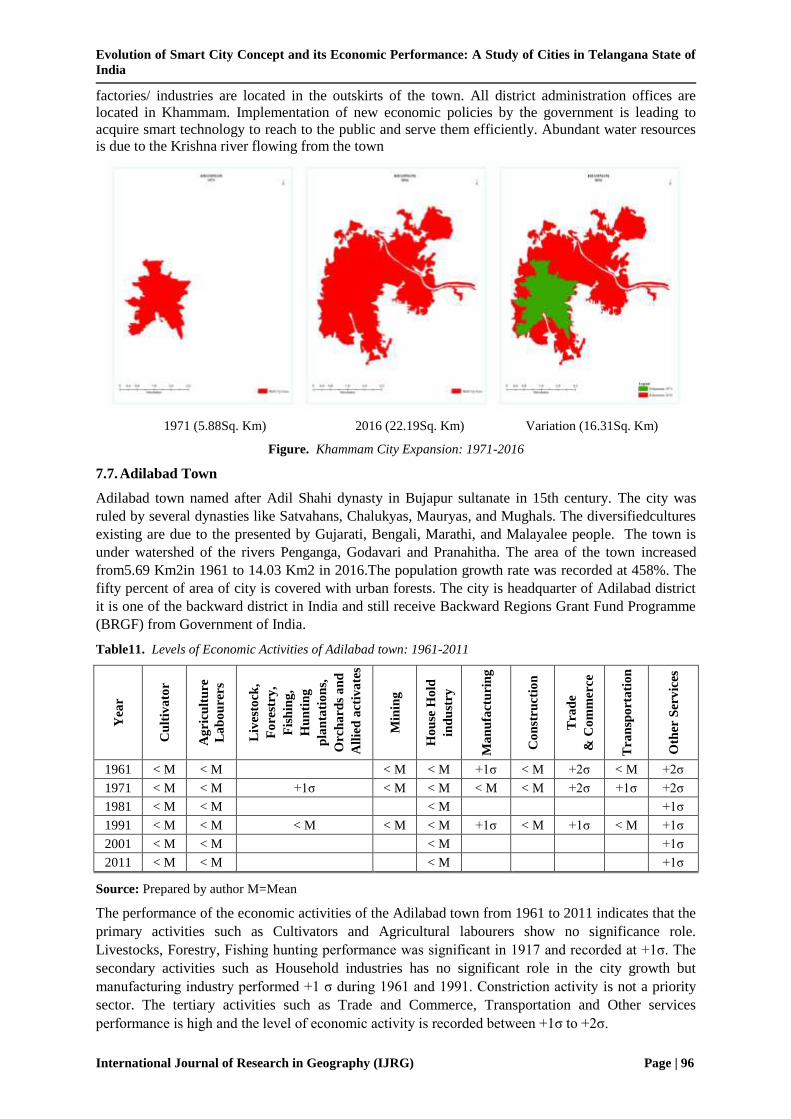
under watershed of the rivers Penganga, Godavari and Pranahitha. The area of the town increased
from5.69 Km2in 1961 to 14.03 Km2 in 2016.The population growth rate was recorded at 458%. The
fifty percent of area of city is covered with urban forests. The city is headquarter of Adilabad district
it is one of the backward district in India and still receive Backward Regions Grant Fund Programme
(BRGF) from Government of India.
Table11. Levels of Economic Activities of Adilabad town: 1961-2011
Yea
r
Cu
ltiv
ato
r
Ag
ricu
ltu
re
La
bo
ure
rs
Liv
esto
ck,
Fo
rest
ry,
Fis
hin
g,
Hu
nti
ng
pla
nta
tio
ns,
Orc
ha
rds
an
d
All
ied
act
iva
tes
Min
ing
Ho
use
Ho
ld
ind
ust
ry
Ma
nu
fact
uri
ng
Co
nst
ruct
ion
Tra
de
& C
om
mer
ce
Tra
nsp
ort
ati
on
Oth
er S
erv
ices
1961 < M < M
< M < M +1σ < M +2σ < M +2σ
1971 < M < M +1σ < M < M < M < M +2σ +1σ +2σ
1981 < M < M
< M
+1σ
1991 < M < M < M < M < M +1σ < M +1σ < M +1σ
2001 < M < M
< M
+1σ
2011 < M < M
< M
+1σ
Source: Prepared by author M=Mean
The performance of the economic activities of the Adilabad town from 1961 to 2011 indicates that the
primary activities such as Cultivators and Agricultural labourers show no significance role.
Livestocks, Forestry, Fishing hunting performance was significant in 1917 and recorded at +1σ. The
secondary activities such as Household industries has no significant role in the city growth but
manufacturing industry performed +1 σ during 1961 and 1991. Constriction activity is not a priority
sector. The tertiary activities such as Trade and Commerce, Transportation and Other services
performance is high and the level of economic activity is recorded between +1σ to +2σ.

Evolution of Smart City Concept and its Economic Performance: A Study of Cities in Telangana State of
India
International Journal of Research in Geography (IJRG) Page | 97
The Adilabad town is located in the northern part of the state. It is close to the bordering state of
Maharashtra. Its location is fetching it to turn into market for trade and commerce activity. Smart
technology is slowly reaching to the public to serve in a betterway.
1971 (5.69Sq. Km) 2016 (14.03Sq. Km)
Variation (8.34Sq. Km)
Figure. Adilabad City Expansion: 1971-2016
7.8. Mahabubnagar Town
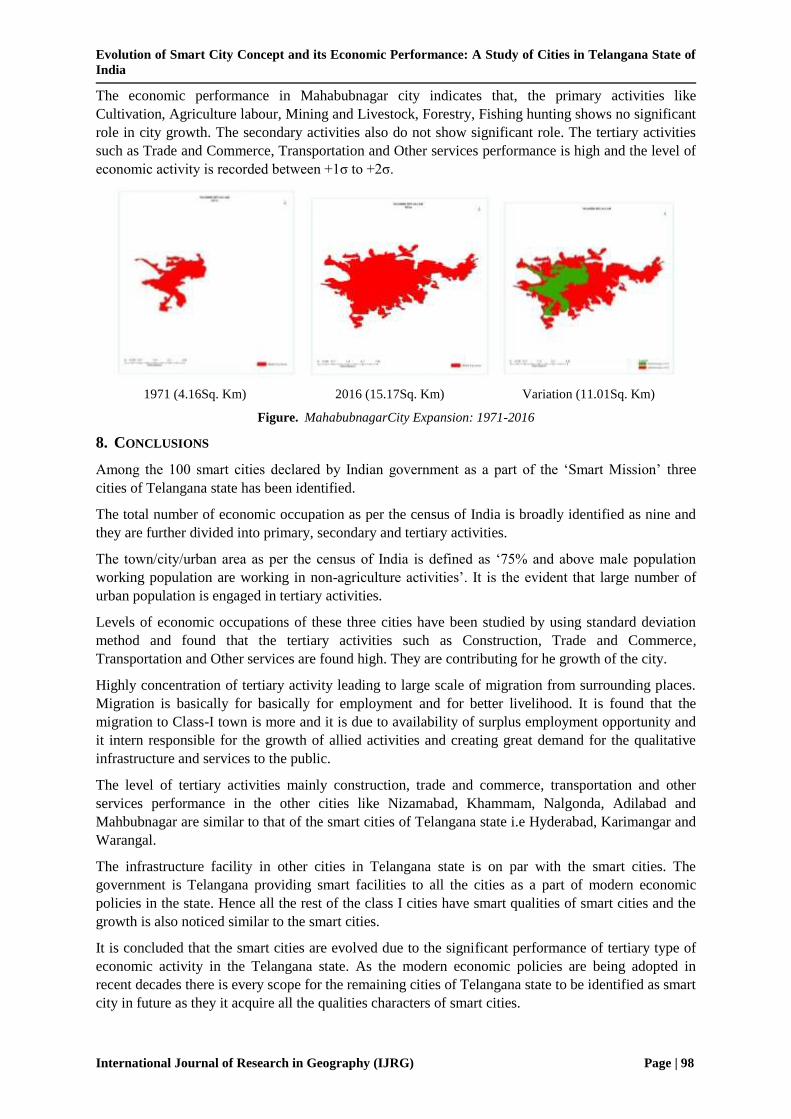
The Mahabubnagar townhas an area of 4.16 Km2 during 1971 and increased to 15.17 Km2 in 2016.
The population growth rate was recorded as 435% during this period. The city named by the rulers of
Nizam kingdom of Hyderabad city. The Mahabubnagar municipality wasconstituted in 1942 as a third
grade municipality. It was upgraded to second grade in 1959 and later to first grade in 1983 and
finally to Special grade municipality in 2004. Mahabubnagar city is connected to major cities and
towns by means of road and railways.
Table12. Levels of Economic Activities of Mahabubnagar town: 1961-2011
Yea
r
Cu
ltiv
ato
r
Ag
ricu
ltu
re
La
bo
ure
rs
Liv
esto
ck,
Fo
rest
ry,
Fis
hin
g,
Hu
nti
ng
pla
nta
tio
ns,
Orc
ha
rds
an
d
All
ied
act
iva
tes
Min
ing
Ho
use
Ho
ld
ind
ust
ry
Ma
nu
fact
uri
ng
Co
nst
ruct
ion
Tra
de
& C
om
mer
ce
Tra
nsp
ort
ati
on
Oth
er S
erv
ices
1961 < M < M
< M < M < M +1σ +1σ +1σ +2σ
1971 < M < M < M < M < M < M < M +1σ +1σ +2σ
1981 < M < M
< M
+1σ
1991 < M < M < M < M < M < M +1σ +1σ +1σ +2σ
2001 < M < M
< M
+1σ
2011 < M < M
< M
+1σ
Source: Prepared by author. M=Mean
Evolution of Smart City Concept and its Economic Performance: A Study of Cities in Telangana State of
India
International Journal of Research in Geography (IJRG) Page | 98
The economic performance in Mahabubnagar city indicates that, the primary activities like
Cultivation, Agriculture labour, Mining and Livestock, Forestry, Fishing hunting shows no significant
role in city growth. The secondary activities also do not show significant role. The tertiary activities
such as Trade and Commerce, Transportation and Other services performance is high and the level of
economic activity is recorded between +1σ to +2σ.
1971 (4.16Sq. Km) 2016 (15.17Sq. Km) Variation (11.01Sq. Km)
Figure. MahabubnagarCity Expansion: 1971-2016
8. CONCLUSIONS
Among the 100 smart cities declared by Indian government as a part of the ‘Smart Mission’ three
cities of Telangana state has been identified.
The total number of economic occupation as per the census of India is broadly identified as nine and
they are further divided into primary, secondary and tertiary activities.
The town/city/urban area as per the census of India is defined as ‘75% and above male population
working population are working in non-agriculture activities’. It is the evident that large number of
urban population is engaged in tertiary activities.
Levels of economic occupations of these three cities have been studied by using standard deviation
method and found that the tertiary activities such as Construction, Trade and Commerce,
Transportation and Other services are found high. They are contributing for he growth of the city.
Highly concentration of tertiary activity leading to large scale of migration from surrounding places.
Migration is basically for basically for employment and for better livelihood. It is found that the
migration to Class-I town is more and it is due to availability of surplus employment opportunity and
it intern responsible for the growth of allied activities and creating great demand for the qualitative
infrastructure and services to the public.
The level of tertiary activities mainly construction, trade and commerce, transportation and other
services performance in the other cities like Nizamabad, Khammam, Nalgonda, Adilabad and
Mahbubnagar are similar to that of the smart cities of Telangana state i.e Hyderabad, Karimangar and
Warangal.
The infrastructure facility in other cities in Telangana state is on par with the smart cities. The
government is Telangana providing smart facilities to all the cities as a part of modern economic
policies in the state. Hence all the rest of the class I cities have smart qualities of smart cities and the
growth is also noticed similar to the smart cities.
It is concluded that the smart cities are evolved due to the significant performance of tertiary type of
economic activity in the Telangana state. As the modern economic policies are being adopted in
recent decades there is every scope for the remaining cities of Telangana state to be identified as smart
city in future as they it acquire all the qualities characters of smart cities.
Evolution of Smart City Concept and its Economic Performance: A Study of Cities in Telangana State of
India
International Journal of Research in Geography (IJRG) Page | 99
REFERENCES
[1] Arthur Salz., “Occuptions: Theory and History”, Encyclopedia of the Social Science (New York: The
Macmillan Company, 1944) XI 424.
[2] Chauncy, D., Harris (1943) ‘A functional classification of cities in the United States’ Geogr.Rev., Vol.33,
pp 86-99.
[3] Chauncy, D., Harris (1956) “ The pressure of Residential Industrial land Use” in William L., Jr.(ed),
Man’s Role in Changing the Face of the Earth, University of Chicago,p 887.
[4] Everett Hughes, “The Study of Occupations”, in Sociology Today ed.R.K. Merton, L. Broom and L.S.
Cottrett (New York; Harpert Row,1965), p. 445.
[5] U.S.Bureau of Census, Census of Population: 9160. Vol. I Part A, Number of Inhabitants, 1961, United
States Summary, table 30.
[6] Telangana IT Dept. Annual report-2015.
[7] Websites: Karimnagar Municipal Corporation and Warangal Municipal Corporation.
Citation: Dr.Ashok Kumar Lonavath, et al, "Evolution of Smart City Concept and its Economic
Performance: A Study of Cities in Telangana State of India ". International Journal of Research in
Geography, vol 3, no. 4, 2017, pp. 84-99. doi:http://dx.doi.org/10.20431/2454-8685.0304011.
Copyright: © 2017 Authors. This is an open-access article distributed under the terms of the Creative
Commons Attribution License, which permits unrestricted use, distribution, and reproduction in any
medium, provided the original author and source are credited.