Embed Size (px)
Citation preview

past, present and future
Evolution of WHO air quality guidelines:
ii
© World Health Organization 2017
All rights reserved. The Regional Office for Europe of the World Health Organization welcomes requests for permission to reproduce or translate its publications, in part or in full.
The designations employed and the presentation of the material in this publication do not imply the expression of any opinion whatsoever on the part of the World Health Organization concerning the legal status of any country, territory, city or area or of its authorities, or concerning the delimitation of its frontiers or boundaries. Dotted lines on maps represent approximate border lines for which there may not yet be full agreement.
The mention of specific companies or of certain manufacturers’ products does not imply that they are endorsed or recommended by the World Health Organization in preference to others of a similar nature that are not mentioned. Errors and omissions excepted, the names of proprietary products are distinguished by initial capital letters.
All reasonable precautions have been taken by the World Health Organization to verify the information contained in this publication. However, the published material is being distributed without warranty of any kind, either express or implied. The responsibility for the interpretation and use of the material lies with the reader. In no event shall the World Health Organization be liable for damages arising from its use. The views expressed by authors, editors, or expert groups do not necessarily represent the decisions or the stated policy of the World Health Organization.
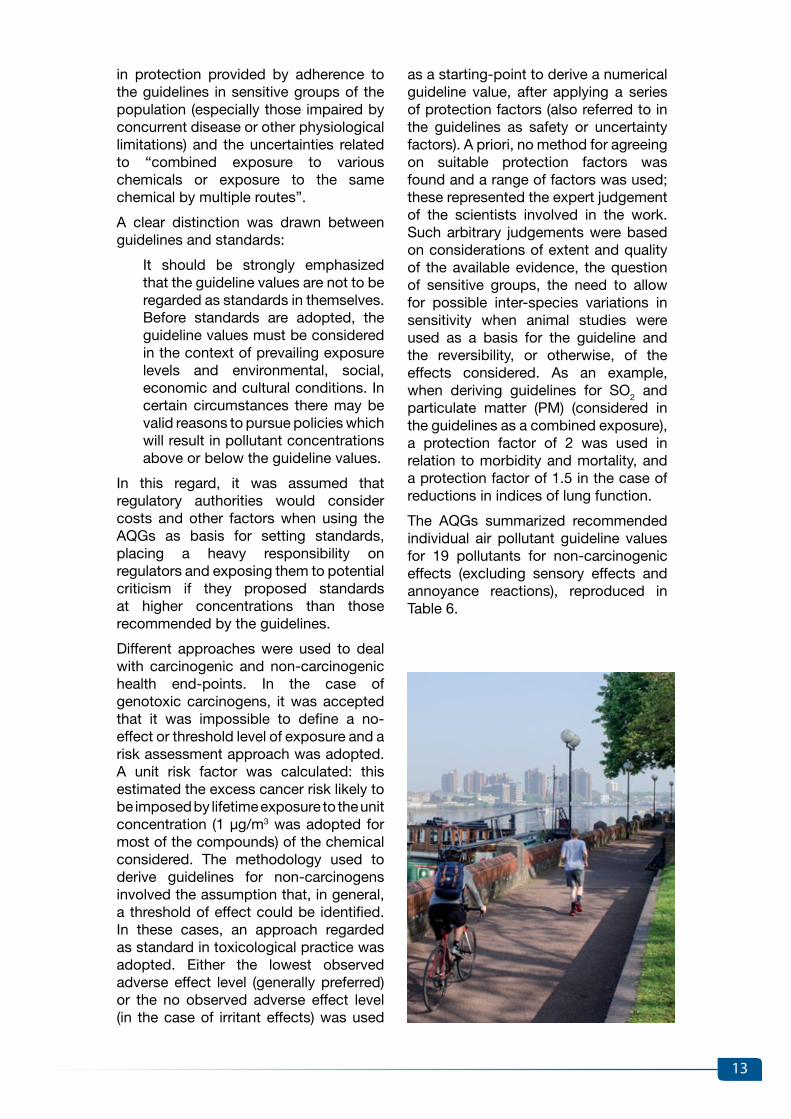
Design: Christophe Lanoux, Paris, FranceLayout: Edb&Rdb di Daniela Berretta, Rome, ItalyPhoto copyrights: cover and p. vi jakepro/Shutterstock:; p. 6 ssuaphotos/Shutterstock; p. 9 Emilio M. Dotto; p. 13 Joe Dunckley/Shutterstock.
Abstract
This document summarizes key WHO publications in the field of air quality and health since the 1950s, which led to the development of the series of WHO air quality guidelines. It outlines the evolution of the scientific evidence on the health effects of air pollution and of its interpretation, supporting policy- and other decision-makers in setting outdoor and indoor air quality management strategies worldwide. Current WHO activities and their future directions in this field are also presented.
KeywordsAIR POLLuTIOn
AIR POLLuTAnTS
EnvIROnMEnTAL ExPOSuRE
WORLD HEALTH ORgAnIzATIOn
EuROPE
Address requests about publications of the WHO Regional Office for Europe to:PublicationsWHO Regional Office for Europeun CityMarmorvej 51DK-2100 Copenhagen Ø, Denmark
Alternatively, complete an online request form for documentation, health information, or for permission to quote or translate, on the Regional Office website (http://www.euro.who.int/pubrequest).
ISBn 9789289052306
Citation adviceEvolution of WHO air quality guidelines: past, present and future. Copenhagen: WHO Regional Office for Europe; 2017.
iii
Contents
Acknowledgments .................................................................................................................... iv
Abbreviations .............................................................................................................................v
1. Introduction ........................................................................................................................1
2. WHO publications on air quality and health before the AQgs (1958–1984) ......................2
2.1 Air pollution (WHO Technical Report Series, no. 157) .................................................2
2.2 Air pollution and other ancillary reports .......................................................................3
2.3 Atmospheric pollutants (WHO Technical Report Series, no. 271) ...............................4
2.4 Air quality criteria and guides for urban air pollutants (WHO Technical Report Series, no. 506) ............................................................................................................5
2.5 Manual on urban air quality management (WHO Regional Publications, European Series, no. 1) ..............................................................................................................10
2.6 Glossary on air pollution and the Environmental health criteria series .......................11
3. WHO AQgs ......................................................................................................................12
3.1 Air quality guidelines for Europe .................................................................................12
3.2 Acute effects on health of smog episodes (WHO Regional Publications, European Series, no. 43) ............................................................................................16
3.3 Air quality guidelines for Europe, second edition .......................................................18
3.4 Air quality guidelines: global update 2005 .................................................................20
3.5 WHO guidelines for indoor air quality .........................................................................23
3.5.1 Dampness and mould .......................................................................................24
3.5.2 Selected pollutants ............................................................................................24
3.5.3 Household fuel combustion ..............................................................................26
4. update of the WHO global AQgs ....................................................................................27
5. Final remarks ....................................................................................................................29
6. References .......................................................................................................................30
iv
Acknowledgments
This publication was developed by Robert Maynard, Michal Krzyzanowski (King’s College, London, united Kingdom), nadia vilahur and Marie-Eve Héroux (WHO European Centre for Environment and Health, Regional Office for Europe, Bonn, germany). Tables and figures were reproduced from original WHO reports by Ellenore Callas (WHO European Centre for Environment and Health, Regional Office for Europe, Bonn, germany). Bert Brunekreef (IRAS universiteit utrecht, the netherlands) provided comments on the latest version of this document.
Contributions of all the experts who participated in the development of key WHO publications in the field of air quality and health are gratefully acknowledged.

v
Abbreviations
AQgs air quality guidelines
BaP Benzo[a]pyrene
CO carbon monoxide
CRF concentration–response function
FEv forced expiratory volume
FvC forced vital capacity
gRADE grading of recommendations assessment, development and evaluation (framework)
HRAPIE Health risks of air pollution in Europe (project)
ISO International Organization for Standardization
nO2 nitrogen dioxide
PM particulate matter
PM10 particulate matter with a diameter of 10 microns or less
PM2.5 particulate matter with a diameter of 2.5 microns or less
REvIHAAP Review of evidence on health aspects of air pollution (project)
SO2 sulfur dioxide
SOx sulfur oxides
uS EPA united States Environmental Protection Agency
uSSR (former) union of Soviet Socialist Republics

vivi

1
Air pollution from both outdoor and indoor sources represents the single largest environmental risk to health globally. WHO estimates that more than 6 million premature deaths were caused by air pollution exposure in 2012 (WHO, 2014a; 2016a). The enormous burden of disease due to air pollution is increasingly being recognized by governments and institutions around the globe as a major public health concern.
In May 2015 the World Health Assembly, the decision-making body of WHO, adopted resolution WHA68.8 on health and the environment: addressing the health impact of air pollution, which urged Member States and WHO to redouble their efforts to protect populations from the health risks posed by air pollution.
The resolution recognized for the first time the role of WHO air quality guidelines (AQgs) in providing guidance and recommendations for clean air that protect human health.
This report outlines WHO’s trajectory on air quality and health, from its initial manuals and reports published as early as 1957 to the series of editions of AQgs that serve as a reference tool in developing ambient and indoor air quality management policies in many countries worldwide. It describes and provides critical commentary on the importance and key features of these documents, and highlights future directions and challenges of WHO’s work in this area of increasing relevance to public health.
Introduction1.

2
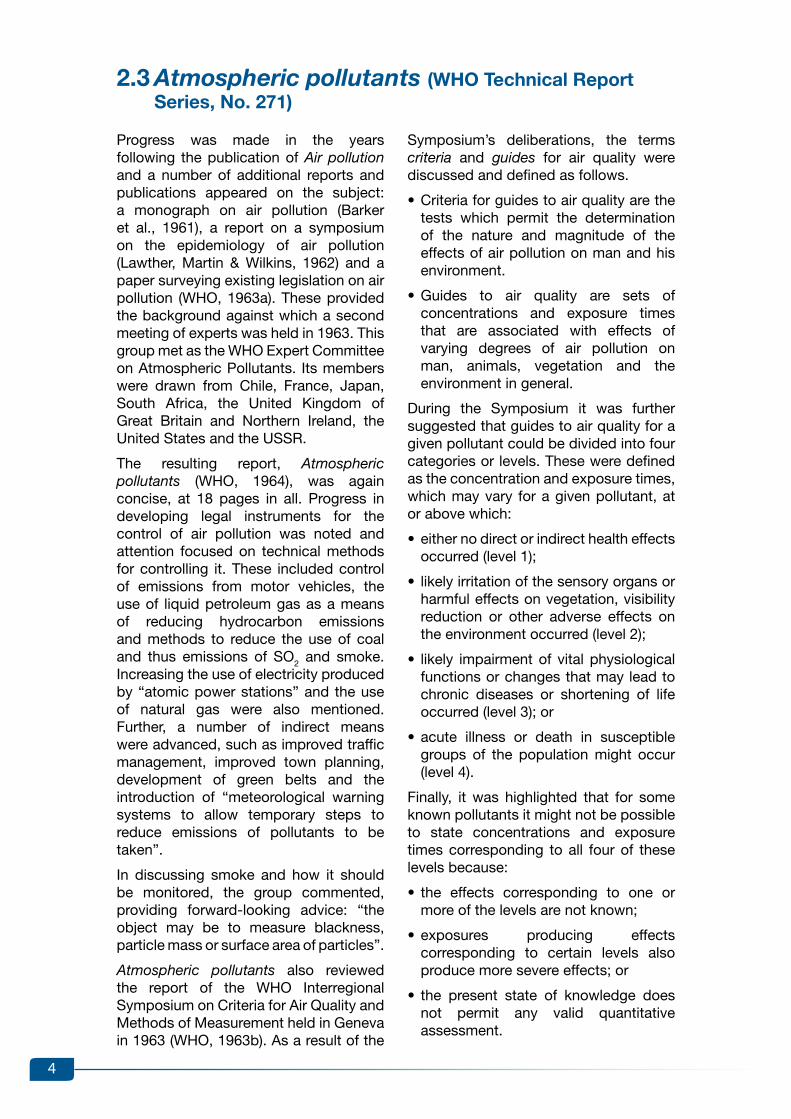
placed on smoke and sulfur dioxide (SO2), photochemical generated smog (ozone, peroxyacids and peroxynitrates), secondary aerosols and hydrogen fluoride. The toxicological effects of individual pollutants were not discussed in any detail, although the photochemical pollutants were noted to cause effects ranging from lachrymation to pulmonary oedema. For SO2, emphasis was placed on its irritant effects, recognized by the Committee as an adverse health effect. It was clearly appreciated that exposure to unusually high concentrations of air pollutants could damage health although, and very curiously, no mention was made of the Donora air pollution episode of 1948 or the London smog of 1952.
Air pollution (WHO, 1958) was published in the WHO Technical Report Series and was the first to deal with air pollution and its effects on health. It was written by a group of experts acting for the Expert Committee on Environmental Sanitation, which met in november 1957, which included members from Belgium, India, Italy, South Africa and the united States of America and representatives from the World Meteorological Organization.
The report was laudably concise: 26 pages providing an introduction to air pollution science, the sources of air pollutants, factors affecting ambient concentrations, methods of measuring concentrations of pollutants and effects on health. Emphasis was
WHO publications on air quality and health before the AQGs (1958–1984)
2.1 Air pollution (WHO Technical Report Series, No. 157)
2.
Box 1. Highlights of Air pollution (WHO, 1958)
• ThiswasthefirstWHOpublicationthatdealtwithairpollutionandhealth.
• Thereportrepresentedtheworkofanexpertgroup,anapproachconsistentlyused by WHO in this field in the years following 1957.
• The authors accepted that air pollutants could damage health, butcategorized effects as (a) serious, when concentrations were unusually high, and (b) relatively minor and probably transient, consisting mainly of irritation of mucous membranes, at lower concentrations.
• Forthefirsttime,thecaseforairqualitystandardswasconsideredbriefly,although it was agreed that not enough data were available to allow standards designed to safeguard health to be set.
• Anargumentagainststandardswasdeveloped,basedonpossibleinhibitoryeffects on industry.
• Thetermscriteria, guidelines and guides were not used; these appeared in subsequent reports.
• Nomentionwasmadeofthepotentialcarcinogeniceffectsofairpollutants.

3
and short accounts were provided of what was then known of the effects on health of individual pollutants, including beryllium, manganese, fluorides, radioactive materials, insecticides, aero-allergens and carcinogens. One chapter, “Air pollution legislation: standards and enforcement”, included a short review of the legislation enacted in the united Kingdom, the united States and the former uSSR, with notes on the position in a selection of other countries. Only for the former union of Soviet Socialist Republics (uSSR) was a set of hygienic standards for urban air quoted from 1956 (reproduced in Table 1), expressed as “maximum permissible concentrations”.
The list of compounds in Table 1 is as interesting for the compounds included – and those excluded – as for the standards themselves. no discussion of the derivation of the standards was provided, however.
Progress towards the WHO AQgs began in WHO Technical Report 157 described above, and continued with WHO Technical Reports 271 and 506 (see sections 2.3 and 2.4). In addition, between 1958 and 1972 WHO produced a number of additional interesting reports on air pollution (Barker et al., 1961; Katz, 1969; Lawther, Martin & Wilkins, 1962; WHO, 1963a; 1963b; 1968; 1970).
Of these ancillary reports, Air pollution (Barker et al., 1961) remains of significant interest. This 442-page report deals with many aspects of air pollution science in 15 substantial chapters and includes attractive colour plates showing the effects of air pollutants on plants. The report provided a historical review of atmospheric pollution and addressed the effects of air pollution on human health. It included reasonably detailed accounts of the Donora incident of 1948 and the London smog of 1952. Los Angeles smog was discussed in some detail,
2.2 Air pollution and other ancillary reports
Table 1. Maximum permissible pollution levels
Pollutant Maximum permissible concentration(mg/m3)
At any one time 24-hour average
Sulfur dioxide 0.5 0.15
Chlorine 0.1 0.03
Hydrogen sulfide 0.03 0.01
Carbon disulfide 0.5 0.15
Carbon dioxidea 6 2
Oxides of nitrogen 0.5 0.15
non-toxic dusts 0.5 0.15
Soot 0.15 0.05
Phosphorus pentoxide 0.15 0.05
Manganese and compounds 0.03 0.01
Fluorine compounds 0.03 0.01
Sulfuric acid 0.3 0.1
Phenol 0.3 0.1
Arsenic (non-organic compounds, with the exception of arsine)
– 0.003
Lead and compounds (with the exception of lead tetraethyl)
– 0.0007
Metallic mercury – 0.0003
a The authors of the current report note that carbon dioxide is presumably a misprint for carbon monoxide. The ambient concentration of carbon dioxide is 300 ppm; about 600 mg/m3.
Source: Barker et al. (1961). Reproduced with permission.
4
Symposium’s deliberations, the terms criteria and guides for air quality were discussed and defined as follows.
•Criteria for guides to air quality are the tests which permit the determination of the nature and magnitude of the effects of air pollution on man and his environment.
•guides to air quality are sets of concentrations and exposure times that are associated with effects of varying degrees of air pollution on man, animals, vegetation and the environment in general.
During the Symposium it was further suggested that guides to air quality for a given pollutant could be divided into four categories or levels. These were defined as the concentration and exposure times, which may vary for a given pollutant, at or above which:
•either no direct or indirect health effects occurred (level 1);
• likely irritation of the sensory organs or harmful effects on vegetation, visibility reduction or other adverse effects on the environment occurred (level 2);
• likely impairment of vital physiological functions or changes that may lead to chronic diseases or shortening of life occurred (level 3); or
•acute illness or death in susceptible groups of the population might occur (level 4).
Finally, it was highlighted that for some known pollutants it might not be possible to state concentrations and exposure times corresponding to all four of these levels because:
• the effects corresponding to one or more of the levels are not known;
•exposures producing effects corresponding to certain levels also produce more severe effects; or
• the present state of knowledge does not permit any valid quantitative assessment.
Progress was made in the years following the publication of Air pollution and a number of additional reports and publications appeared on the subject: a monograph on air pollution (Barker et al., 1961), a report on a symposium on the epidemiology of air pollution (Lawther, Martin & Wilkins, 1962) and a paper surveying existing legislation on air pollution (WHO, 1963a). These provided the background against which a second meeting of experts was held in 1963. This group met as the WHO Expert Committee on Atmospheric Pollutants. Its members were drawn from Chile, France, Japan, South Africa, the united Kingdom of great Britain and northern Ireland, the united States and the uSSR.
The resulting report, Atmospheric pollutants (WHO, 1964), was again concise, at 18 pages in all. Progress in developing legal instruments for the control of air pollution was noted and attention focused on technical methods for controlling it. These included control of emissions from motor vehicles, the use of liquid petroleum gas as a means of reducing hydrocarbon emissions and methods to reduce the use of coal and thus emissions of SO2 and smoke. Increasing the use of electricity produced by “atomic power stations” and the use of natural gas were also mentioned. Further, a number of indirect means were advanced, such as improved traffic management, improved town planning, development of green belts and the introduction of “meteorological warning systems to allow temporary steps to reduce emissions of pollutants to be taken”.
In discussing smoke and how it should be monitored, the group commented, providing forward-looking advice: “the object may be to measure blackness, particle mass or surface area of particles”.
Atmospheric pollutants also reviewed the report of the WHO Interregional Symposium on Criteria for Air Quality and Methods of Measurement held in geneva in 1963 (WHO, 1963b). As a result of the
2.3 Atmospheric pollutants (WHO Technical Report Series, No. 271)

5
monoxide (CO), photochemical oxidants and nitrogen dioxide (nO2), providing narrative reviews of the literature then available. Although no guidelines were formulated, the report provided the lowest ambient concentrations, defined in terms of specific averaging times, known to be associated with effects on health (i.e. guides, as defined in Atmospheric pollutants – see section 2.2). Much of the evidence is now very dated, but a few of the summary tables of interest are reproduced below.
Table 2 reflects substantial uncertainty and/or differences of opinion within the Committee’s conclusions (see table footnotes and the wide concentration ranges proposed for SO2). By modern standards, the concentrations of SO2
suggested seem very high: the upper figure was based on data collected in London (see Table 2, footnote b).
Air quality criteria and guides for urban air pollutants was produced in 1972 by an expert group with members drawn from Canada, Egypt, India, Japan, Sweden, Switzerland, the united States and the former uSSR (WHO, 1972). It ran to 35 pages: again, a short report, which remains especially interesting in that – in addition to discussing a few common air pollutants in more detail than previous reports – it addressed the need to take into account the balance between health protection and the cost of lowering levels of air pollutants. WHO expert groups convened in the period 1957–1972 had few inhibitions about discussing methods for controlling levels of air pollutants, the likely costs of such methods and the need for “social decision-making”.
The report represented a significant step towards AQgs. It included short chapters dealing with sulfur oxides (SOx) and suspended particles, carbon
2.4 Air quality criteria and guides for urban air pollutants (WHO Technical Report Series, No. 506)
Box 2. Highlights of Atmospheric pollutants (WHO, 1964)
• The reportcalled for internationalguides toairqualityand requested thatWHO take action to formulate these. This led, later, to the development of the first edition of the WHO AQgs (WHO Regional Office for Europe, 1987).
• Thetermscriteria and guides were first defined and introduced. In addition, guides were subdivided into four levels according to concentrations and exposure times in relation to increasing severity of effects on health and/or the environment.
• The report stated that some pollutants may havemutagenic effects, butit was concluded that too little was known about this subject to permit classification of such pollutants in the defined categories.
• Forthefirsttimeitwasacceptedthatlong-termexposuretopollutantscouldinduce chronic disease and shortening of life, and that lower concentrations could lead to more severe health effects than merely irritation.
• The term “threshold concentration” was not used but it seemed that, atleast for non-mutagenic substances, the Committee accepted that such thresholds were likely to exist.
• The report concluded that it would be impossible to set internationallyapplicable emission standards, and that the prescription of such standards must be left to the discretion of individual governments or local authorities.

6
Table 2. Expected health effects of air pollution on selected population groupsa
Pollutant Excess mortality and hospital admissions
Worsening of patients with
pulmonary disease
Respiratory symptoms
Visibility and/or human annoyance
effects
SO2b 500 µg/m3
(daily average)500–250 µg/m3 c
(daily average)
100 µg/m3
(annual arithmetic mean)
80 µg/m3 (annual geometric mean)
Smokeb500 µg/m3
(daily average)250 µg/m3
(daily average)
100 µg/m3
(annual arithmetic mean)
80 µg/m3 (annual geometric mean)d
a The Committee specifically urged that this table should not be considered independently of the accompanying text: “a numerical value associated with a given effect does not mean that all exposed individuals will be thus affected. There is no valid information available that permits precise quantification of this risk. usually, the proportion of the population that may be expected to be affected is small.”
b British Standard Practice. […] values for sulfur dioxides and suspended particulates apply only in conjunction with each other. They may have to be adjusted when translated into terms of results obtained by other procedures.
c These values represent the differences of opinion within the Committee.d Based on high-volume samplers.
Source: WHO (1972). Reproduced with permission.
The report’s choice of a 4% concentration of carboxyhaemoglobin as a break point (Table 3) was agreed to be difficult and
would nowadays be regarded as too high.
Table 3. CO concentrations required to reach 4% carboxyhaemoglobin levelsa
Ambient CObTime (hours)
mg/m3 ppm
29 25 24
35 30 8
117 100 1
a The Committee specifically urged that this table should not be considered independently of the accompanying text: “…the formulation of an air quality guide is fraught with difficulties… It can be seen that the time required to reach equilibrium depends to a large extent on whether the subject has acquired CO from smoking or other sources before exposure to ambient air...”
b Light activity at sea level with initial “basal” values is assumed. Above 4% carboxyhaemoglobin levels there may be increased risk for patients with cardiovascular disease.
Source: WHO (1972). Reproduced with permission.
7
The concentrations recommended for photochemical oxidants (Table 4) are not very different from those discussed in the first edition of the WHO AQgs
(WHO Regional Office for Europe, 1987). no guides for nO2 were produced as the evidence available at that time was judged to be insufficient.
Table 4. Expected health effects of photochemical oxidants on vulnerable groups
Increased mortality
Increased asthmatic attacks
Pulmonary dysfunction
Annoyance and eye irritation
not reported to date 250 µg/m3 a
1 hour200 µg/m3
1 hour200 µg/m3
1 hour
a Oxidant as measured by neutral buffered KI [potassium iodide] method and expressed as ozone.
Source: WHO (1972). Reproduced with permission.
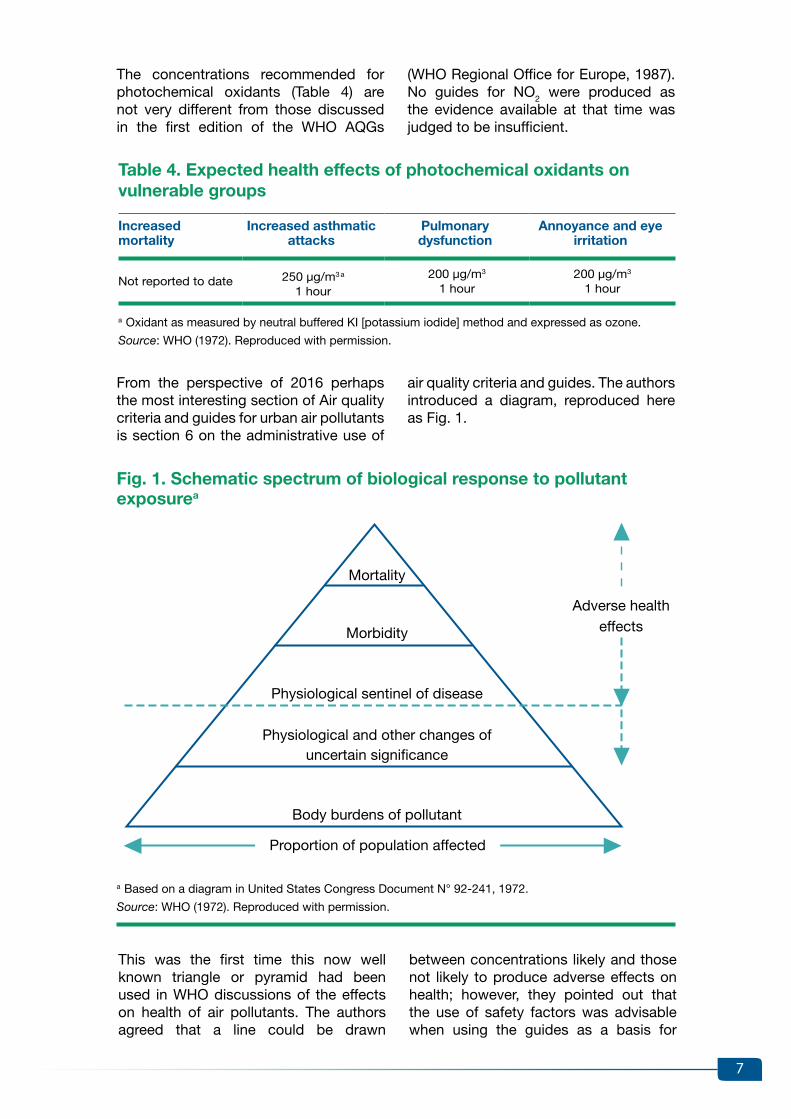
Fig. 1. Schematic spectrum of biological response to pollutant exposurea
From the perspective of 2016 perhaps the most interesting section of Air quality criteria and guides for urban air pollutants is section 6 on the administrative use of
air quality criteria and guides. The authors introduced a diagram, reproduced here as Fig. 1.
a Based on a diagram in united States Congress Document n° 92-241, 1972.
Source: WHO (1972). Reproduced with permission.
Mortality
Morbidity
Physiological sentinel of disease
Physiological and other changes of uncertain significance
Body burdens of pollutant
Proportion of population affected
Adverse health effects
This was the first time this now well known triangle or pyramid had been used in WHO discussions of the effects on health of air pollutants. The authors agreed that a line could be drawn
between concentrations likely and those not likely to produce adverse effects on health; however, they pointed out that the use of safety factors was advisable when using the guides as a basis for

8
standards because of uncertainties about dose–response relationships. This approach was followed in later reports when guidelines were recommended. The implication that standards should be set at lower concentrations than the guides suggested in the report was clear. In discussing the size of safety factors the authors listed several elements they thought should be considered:
•political considerations, with an emphasis on cost–benefit calculations (this might be seen as controversial today);
• the significance and reliability of the data suggesting effects on health;
• the source of the data (for example, from studies in animals or in humans); and
• the nature of the effect against which protection is sought (for example, mortality or some lesser effect).
A definition of standards, taken from an earlier WHO report, was also provided: “Standards of environmental quality are guides that have been adopted by governments and other competent authorities and therefore have legal force. In some contexts, however, standards may include recommendations that need not be rigidly enforced” (WHO, 1970).
The same section, discussing health protection and air pollution control costs, introduced a diagram, presumably constructed by the authors as no source was provided, reproduced here as Fig. 2. This represents a clear and helpful piece of advice to anybody setting standards.
Fig. 2. Schematic representation of degree of health protection as a function of cost of air pollution control
Source: WHO (1972). Reproduced with permission.
Possible maximum
Practical maximum
Region in which higher costs are balanced
against resulting benefitsAcceptable
minimum
Cost of control of air pollution
Deg
ree
of h
ealth
pro
tect
ion
nIL

9
The last section of the report was devoted to discussion of long-term goals. Members of the expert group argued that they had set criteria and guides for (some) urban air pollutants and that these could “be used by countries wishing to set air quality standards”. It was accepted that these standards, especially when developed as short-term goals, might vary from country to country depending on “exposure conditions, the socioeconomic situation, and on the importance of other health problems”. The expert group declined to provide such standards but pointed out that “severe effects are obviously to be avoided” and that “exposure to the air pollutants discussed in this report should be kept
as low as possible”. A rather stronger line was taken with regard to long-term goals, and in this context the following table was produced, emphasizing that these recommendations were subject to change as more data within different populations became available (see Table 5).
It is also interesting to note that the proposed long-term guide for ozone (8-hour average of 60 µg/m3) is lower than later WHO recommendations. Indeed, it is lower than both the 150–200 µg/m3 range proposed in the first edition of the WHO AQgs (WHO Regional Office for Europe, 1987) and the 100 µg/m3 proposed in the 2005 WHO AQgs global update (WHO Regional Office for Europe, 2006a).
Table 5. Recommended long-term goalsa
Pollutant Measurement method Limiting level
Sulfur oxidesb – British Standard Procedurec Annual mean 98% of observationsd below
60 µg/m3
200 µg/m3
Suspended particulatesb – British Standard Procedurec
Annual mean 98% of observationsd below
40 µg/m3
120 µg/m3
Carbon monoxide – nondispersive infraredc 8-hour average 1-hour maximum
10 µg/m3
40 µg/m3
Photochemical – oxidant as measured by neutral buffered KI method expressed as ozone
8-hour average 1-hour maximum
60 µg/m3 120 µg/m3
a The Committee specifically urged that this table should not be considered independently of the accompanying text (see section 7.2 [of the original report]). [note: the text that should accompany this table has been summarized by the authors in the current report.]
b values for sulfur oxides and suspended particulates apply only in conjunction with one another.c Methods are not those necessarily recommended but indicate those on which these units have been
based. Where other methods are used an appropriate adjustment may be necessary.d The permissible 2% of observations over this limit may not fall on consecutive days.
Source: WHO (1972). Reproduced with permission.

10
pollutants (see section 2.4) was reprinted as Chapter 3.
The advice on standard setting avoided too much focus on thresholds when considering responses at a population level. It proposed a trade-off between the costs and benefits of reducing levels of air pollutants, illustrated by a now well known graph reproduced here as Fig. 3.
The Manual on urban air quality management (Suess & Craxford, 1976) remains a valuable contribution to the field. Two chapters are especially relevant to the current discussion: Chapter 4 on ambient air quality standards and their application and Chapter 6 on economic aspects of air pollution abatement. Air quality criteria and guides for urban air
2.5 Manual on urban air quality management (WHO Regional Publications, European Series, No. 1)
Fig. 3. Derivation of ambient air quality standards
Source: Suess & Craxford (1976). Reproduced with permission.
Ris
k (r
)
Standard
RISK Cos
t (c
)
COST
a = α1r+ α2c
Level of air pollution
WEIgHTED SuM OF COST AnD R
ISK
Box 3. Highlights of Air quality criteria and guides for urban air pollutants (WHO, 1972)
• Although guidelines were not proposed in the report, the lowest ambientconcentrations defined in terms of specific averaging times known to be associated with effects on health (i.e. guides) were provided for SO2, smoke, CO and photochemical oxidants.
• Hydrogen fluoride, radioactive materials, lead and other metals that hadfeatured in earlier reports were excluded.
• Theauthorsclearlystatedthatstandardsshouldbesetatlowerconcentrationsthan the proposed guides; they suggested applying safety factors to account for uncertainties about dose–response relationships and other considerations left to regulatory authorities.
• The pyramid (or triangle) diagram of health effects due to exposure to airpollutants was used by WHO for the first time.
• The report concluded that WHO should publish critical reviews for eachindividual pollutant, which led to the inclusion of such reviews in the first edition of the WHO AQgs (WHO Regional Office for Europe, 1987).
11
greatly dependent on “political climate and public opinion” and would involve a weighing of economic development and protection of health. The approach suggested was clearly based on the perception that WHO should not be providing air quality standards, but should be providing the evidence upon which such standards might be set and, very importantly, providing advice on how standards should be set.
The dotted line in Fig. 3 was derived by adding the cost line to the risk line and applying weighting factors: α1 for risk and α2 for cost. The author pointed out that the lowest point on the dotted line could be moved from left to right by adjusting the values given to α1 and α2. This point (where the standard could be set) was taken as the point of optimal balance between costs and reduction of risks. Decisions regarding the relative values of α1 and α2 should, it was suggested, be
the International Programme on Chemical Safety, and a series of documents entitled “Environmental health criteria” began to appear. These provided international, critical reviews of the effects of chemicals or combinations of chemicals and physical and biological agents on human health and the environment (WHO, 2016b). A number of these documents dealt with air pollutants.
The period from 1976 to 1984 (when the planning meeting for the 1987 edition of the WHO AQgs was held) saw the publication of a number of very significant reviews on the effects of air pollutants on health. The WHO Regional Office for Europe published a Glossary on air pollution (1980). An initiative between WHO and the united nations Environment Programme led to the establishment of
2.6 Glossary on air pollution and the Environmental health criteria series

12
essential in order for this process to be continued.
Three editions of ambient AQgs have been published since 1987. These are intended to have a wide application in environmental decision-making, particularly in setting standards at a global level, despite the inclusion of the words “for Europe” on the cover of the first two editions.
Since 2006 WHO has worked on developing separate guidelines for indoor air quality and has published a series of three indoor-specific AQgs, providing health-based recommendations on selected air pollutants commonly found in indoor environments, biological agents (dampness and mould) and household fuel combustion.
Since the mid-1980s the WHO Regional Office for Europe has coordinated the development of a series of AQgs, widely used as reference tools to help policy-makers across the world in setting standards and goals for air quality management. Although methodologies and requirements have evolved over time, the WHO AQgs remain, in essence, manuals that provide evidence-based recommendations with the goal of protecting populations worldwide from the adverse health effects of air pollutants. Ensuring the necessary funding to conduct such work has never been easy. The support of Member States that use the WHO AQgs as a basis for policy development to improve public health is
WHO AQGs3.
for 28 organic and inorganic chemical air pollutants.
A definition of an adverse health effect proposed by the united States Environmental Protection Agency (uS EPA) was adopted: “any effect resulting in functional impairment and/or pathological lesions that may affect the performance of the whole organism or which contributes to a reduced ability to respond to an additional challenge” (uS EPA, 1980). The AQgs were intended to provide a basis for “protecting public health from adverse effects of air pollutants and for eliminating, or reducing to a minimum, those contaminants of the air that are known or likely to be hazardous to human health and well-being” (WHO Regional Office for Europe, 1987). The authors clearly stated that “compliance with recommendations regarding guideline values does not guarantee the absolute exclusion of effects at levels below such values”. They recognized the limitations
The first edition of Air quality guidelines for Europe was a complete, standalone manual on air pollution and health (WHO Regional Office for Europe, 1987). At that time the WHO regional Health for All strategy provided a stimulus and policy framework for this work, specifically through the target that “by 1995, all people of the Region should be effectively protected against recognized health risks from air pollution” (WHO Regional Office for Europe, 1985). Support for production of the guidelines and some of the funding was provided by the netherlands, following the successful publication and uptake by end-users of the WHO guidelines for drinking-water quality (WHO, 1984). A project coordinator was appointed and a total of 12 meetings were held between early 1984 and november 1986, attended by many of the most distinguished experts in the air pollution field at that time, to produce a 426-page comprehensive report, which provided recommendations
3.1 Air quality guidelines for Europe
13
in protection provided by adherence to the guidelines in sensitive groups of the population (especially those impaired by concurrent disease or other physiological limitations) and the uncertainties related to “combined exposure to various chemicals or exposure to the same chemical by multiple routes”.
A clear distinction was drawn between guidelines and standards:
It should be strongly emphasized that the guideline values are not to be regarded as standards in themselves. Before standards are adopted, the guideline values must be considered in the context of prevailing exposure levels and environmental, social, economic and cultural conditions. In certain circumstances there may be valid reasons to pursue policies which will result in pollutant concentrations above or below the guideline values.
In this regard, it was assumed that regulatory authorities would consider costs and other factors when using the AQgs as basis for setting standards, placing a heavy responsibility on regulators and exposing them to potential criticism if they proposed standards at higher concentrations than those recommended by the guidelines.
Different approaches were used to deal with carcinogenic and non-carcinogenic health end-points. In the case of genotoxic carcinogens, it was accepted that it was impossible to define a no-effect or threshold level of exposure and a risk assessment approach was adopted. A unit risk factor was calculated: this estimated the excess cancer risk likely to be imposed by lifetime exposure to the unit concentration (1 µg/m3 was adopted for most of the compounds) of the chemical considered. The methodology used to derive guidelines for non-carcinogens involved the assumption that, in general, a threshold of effect could be identified. In these cases, an approach regarded as standard in toxicological practice was adopted. Either the lowest observed adverse effect level (generally preferred) or the no observed adverse effect level (in the case of irritant effects) was used
as a starting-point to derive a numerical guideline value, after applying a series of protection factors (also referred to in the guidelines as safety or uncertainty factors). A priori, no method for agreeing on suitable protection factors was found and a range of factors was used; these represented the expert judgement of the scientists involved in the work. Such arbitrary judgements were based on considerations of extent and quality of the available evidence, the question of sensitive groups, the need to allow for possible inter-species variations in sensitivity when animal studies were used as a basis for the guideline and the reversibility, or otherwise, of the effects considered. As an example, when deriving guidelines for SO2 and particulate matter (PM) (considered in the guidelines as a combined exposure), a protection factor of 2 was used in relation to morbidity and mortality, and a protection factor of 1.5 in the case of reductions in indices of lung function.
The AQgs summarized recommended individual air pollutant guideline values for 19 pollutants for non-carcinogenic effects (excluding sensory effects and annoyance reactions), reproduced in Table 6.

14
Table 6. Guideline values for individual substances based on effects other than cancer or odour/annoyancea
Substances Time-weighted average
Averaging time Chapter
Cadmium1–5 ng/m3
10–20 ng/m3
1 year (rural areas)1 year (urban areas)
19
Carbon disulfide 100 µg/m3 24 hours 7
Carbon monoxide
100 mg/m3 b
60 mg/m3 b
30 mg/m3 b
10 mg/m3
15 minutes30 minutes
1 hour8 hours
20
1.2-Dichloroethane 0.7 mg/m3 24 hours 8
Dichloromethane(Methylene chloride)
3 mg/m3 24 hours 9
Formaldehyde 100 µg/m3 30 minutes 10
Hydrogen sulfide 150 µg/m3 24 hours 22
Lead 0.5–1.0 µg/m3 1 year 23
Manganese 1 µg/m3 1 yearc 24
Mercury 1 µg/m3d (indoor air) 1 year 25
nitrogen dioxide400 µg/m3
150 µg/m3
1 hour24 hour
27
Ozone150–200 µg/m3 100–120 µg/m3
1 hour8 hours
28
Styrene 800 µg/m3 24 hours 12
Sulfur dioxide500 µg/m3
350 µg/m3
10 minutes1 hour
30
Sulfuric acid –e – 30
Tetrachloroethylene 5 mg/m3 24 hours 13
Toluene 8 mg/m3 24 hours 14
Trichloroethylene 1 mg/m3 24 hours 15
vanadium 1 µg/m3 24 hours 31
a The Information from this table should not be used without reference to the rationale given in the chapters indicated.
b Exposure at these concentrations should be for no longer than the indicated times and should not be repeated within 8 hours.
c Due to respiratory irritancy, it would be desirable to have a short-term guideline, but the present data base does not permit such estimations.
d The guideline value is given only for indoor pollution; no guidance is given on outdoor concentrations (via deposition and entry into the food-chain) that might be of indirect relevance.
e See Chapter 30.
note: when air levels in the general environment are orders of magnitude lower than the guideline values, present exposures are unlikely to present a health concern. guideline values in those cases are directed only to specific release episodes or specific indoor pollution problems.
Source: WHO Regional Office for Europe (1987). Reproduced with permission.
had suggested that no threshold of effect could be identified; this led to the guidelines being set close to concentrations at which “significant” effects had been demonstrated. The use of a range rather than a single value
Table 7 presents the unit risks estimated for seven carcinogenic air pollutants. For cadmium, lead and ozone, ranges rather than single figures were recommended as guidelines. Further, in the case of ozone it was stated that some studies
15
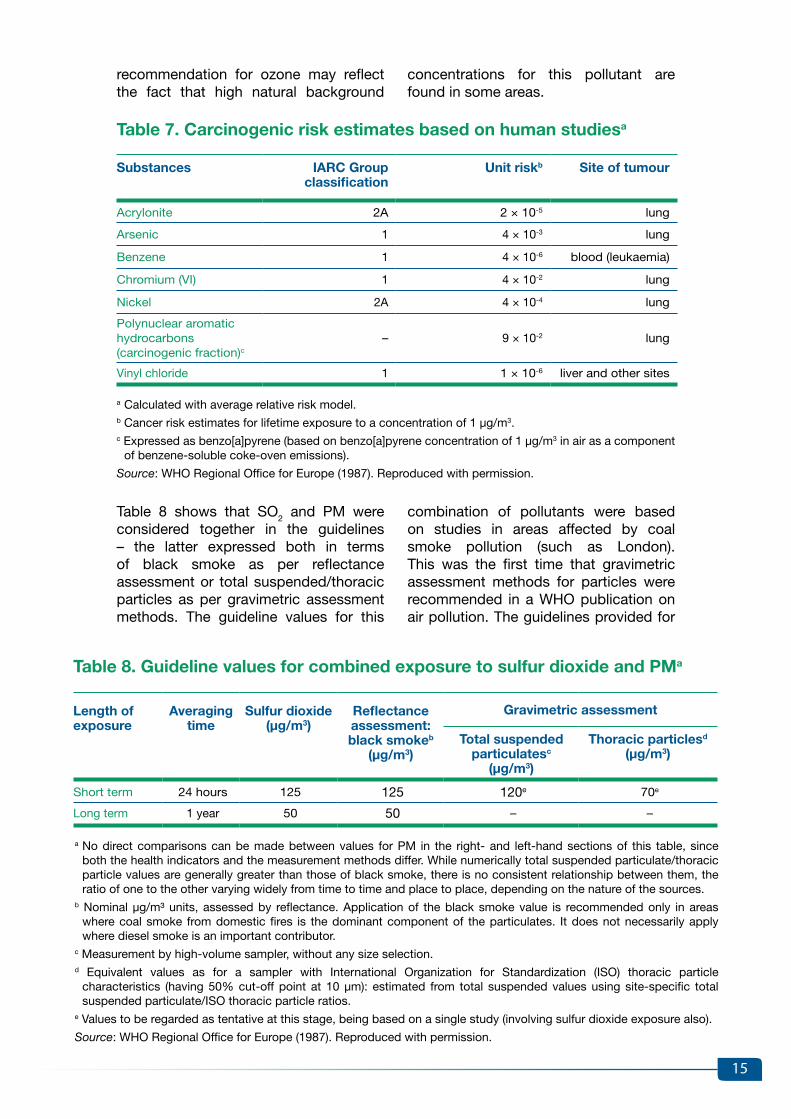
Table 7. Carcinogenic risk estimates based on human studiesa
Substances IARC Groupclassification
Unit riskb Site of tumour
Acrylonite 2A 2 × 10⁻⁵ lung
Arsenic 1 4 × 10⁻³ lung
Benzene 1 4 × 10⁻⁶ blood (leukaemia)
Chromium (vI) 1 4 × 10⁻² lung
nickel 2A 4 × 10⁻⁴ lung
Polynuclear aromatichydrocarbons(carcinogenic fraction)c
– 9 × 10⁻² lung
vinyl chloride 1 1 × 10⁻⁶ liver and other sites
a Calculated with average relative risk model.b Cancer risk estimates for lifetime exposure to a concentration of 1 µg/m3.c Expressed as benzo[a]pyrene (based on benzo[a]pyrene concentration of 1 µg/m3 in air as a component
of benzene-soluble coke-oven emissions).
Source: WHO Regional Office for Europe (1987). Reproduced with permission.
combination of pollutants were based on studies in areas affected by coal smoke pollution (such as London). This was the first time that gravimetric assessment methods for particles were recommended in a WHO publication on air pollution. The guidelines provided for
Table 8 shows that SO2 and PM were considered together in the guidelines – the latter expressed both in terms of black smoke as per reflectance assessment or total suspended/thoracic particles as per gravimetric assessment methods. The guideline values for this
recommendation for ozone may reflect the fact that high natural background
concentrations for this pollutant are found in some areas.
Table 8. Guideline values for combined exposure to sulfur dioxide and PMa
Length of exposure
Averagingtime
Sulfur dioxide (µg/m3)
Reflectanceassessment:black smokeb
(µg/m3)
Gravimetric assessment
Total suspendedparticulatesc
(µg/m3)
Thoracic particlesd
(µg/m3)
Short term 24 hours 125 125 120e 70e
Long term 1 year 50 50 – –
a no direct comparisons can be made between values for PM in the right- and left-hand sections of this table, since both the health indicators and the measurement methods differ. While numerically total suspended particulate/thoracic particle values are generally greater than those of black smoke, there is no consistent relationship between them, the ratio of one to the other varying widely from time to time and place to place, depending on the nature of the sources.
b nominal µg/m³ units, assessed by reflectance. Application of the black smoke value is recommended only in areas where coal smoke from domestic fires is the dominant component of the particulates. It does not necessarily apply where diesel smoke is an important contributor.
c Measurement by high-volume sampler, without any size selection.d Equivalent values as for a sampler with International Organization for Standardization (ISO) thoracic particle
characteristics (having 50% cut-off point at 10 µm): estimated from total suspended values using site-specific total suspended particulate/ISO thoracic particle ratios.
e values to be regarded as tentative at this stage, being based on a single study (involving sulfur dioxide exposure also).
Source: WHO Regional Office for Europe (1987). Reproduced with permission.

16
this area that dealt with the effects of the combination of black smoke and SO2
and photochemical oxidants as “winter/summer smog”.
In the report participants in the expert group meeting, based on previous work conducted by the uS EPA (Lippmann, 1988; 1989), sought to grade health effects observed at different concentrations of SO2, PM and ozone according to the degree of severity of the outcomes, as reproduced in Table 9.
The WHO Regional Office for Europe published a report after a meeting held in late 1990 (WHO Regional Office for Europe, 1992); this may be regarded as ancillary to the development of the WHO AQgs. The main goals of the report were to produce advice on the likely short-term effects on health of acute and episodic exposures to both winter and summer smog and to advise on measures that could be taken to reduce such effects. This was the last of the WHO reports in
3.2 Acute effects on health of smog episodes (WHO Regional Publications, European Series, No. 43)
thoracic particles (equivalent to PM with a diameter of 10 microns or less (PM10)) were extrapolated from figures for total suspended particles and were not based on studies in which PM10 had been measured. The possible effects of long-term exposure to PM were beginning to be recognized since they had first been suggested by Lawther (1961) as likely to be important – perhaps more important than the effects of occasional exposure to very high concentrations.
The AQgs also recommended measures to prevent pollutant-associated risks,
such as conducting population exposure-related surveys or monitoring (for example, of lead deposition in dust and soil or of radon-daughter concentrations in buildings), and underscored from the beginning the need for an integrated view of air quality management that included eco-toxicological aspects. This last point was reflected in the final section of the guidelines on effects of inorganic substances on vegetation, which described the effects of nitrogen, ozone and other photochemical oxidants and SOx on terrestrial vegetation.
Box 4. Highlights of Air quality guidelines for Europe (WHO Regional Office for Europe, 1987)
• Thiswasthefirsteditionof theWHOAQGs,providingrecommendations inthe form of numerical values/ranges or unit risk factors for a total of 28 air pollutants.
• Theauthorsrecognizedthelimitationsanduncertaintiesinhealthprotectionprovided by adherence to the guidelines, especially in the case of sensitive groups and because of multiple routes of exposure and simultaneous exposure to various chemicals.
• Itwasstronglyemphasizedthattheguidelinevaluesshouldnotberegardedasstandards in themselves. The latter would be left to the judgement of regulatory authorities, who would need to consider economic, social and cultural factors when using the guidelines as a basis for setting standards.
• Sulfurandblacksmokewereconsideredtogetherinprovidingrecommendations,and for the first time WHO recommended the use of gravimetric methods for assessment of particle concentration in this field.
• An eco-toxicological dimension was also considered; guideline values fora few pollutants, SOx, nitrogen oxides and ozone/photochemical oxidants, based on effects on terrestrial vegetation, were provided.

17
Table 9. Gradation of acute lung function, symptomatic and other responses to air pollution exposure into different classes of adversity
Response Gradation
Mild Moderate Severe/incapacitating
Change in FvC or FEva
symptoms
5–10%Mild to moderate cough
10–20%Mild to moderate cough, pain on deep inspiration, shortness of breath
20–40%/>40%Repeated/severe cough, moderate to severe pain on deep inspiration and shortness of breath; breathing distress
Limitation of activity none Few individuals choose to discontinue activity
Some/many individuals choose to discontinue activity
a note added in the current report: FvC = forced vital capacity; FEv = forced expiratory volume.
Source: WHO Regional Office for Europe (1992). Reproduced with permission.
For ozone, the report also defined the proportion of the population likely to
be affected at different concentrations (reproduced in Table 10).
Table 10. Expected acute effects of photochemical smog on days characterized by maximum 1-hour average ozone concentrations, as indicated for children and non-smoking young adults on the basis of observations made in toxicological, clinical and epidemiological studies
Ozone level (µg/m3)
Eye, nose and throat irritation
Average FEV, decrement in active people
outdoors
Imposed avoidance of time and
activity outdoors
Respiratory inflammatory and clearance
response, hyper-reactivity in active people
outdoors
Respiratory symptoms (mainly in
adults)
Overall classification
Whole population
Most sensitive 10% of
population
<100 no effect none none none none none –
200 In few sensitive people
5% 10% none Mild Some chest tightness,
cough
Mild
300 < 30% of people
15% 30% Some individuals
Moderate Increased symptoms
Moderate
400 > 50% of people
25% 50% Many individuals
Severe Further increase of symptoms
Severe
Note: In large cities, scavenging of ozone may lead to relatively low concentrations of ozone. under such circumstances, other indicators of summer-type smog may be more useful.
Source: WHO Regional Office for Europe (1992). Reproduced with permission.
Concerning measures to protect the general public, the advice focused on reducing exposure by limiting physical activity outdoors during smog episodes. Short-term abatement measures, such as traffic bans or temporary reductions in industrial emissions, were not thought likely to be very effective. The report stated that traffic bans would lead
to extreme overloading of the public transport system, and that outdoor population exposure to pollutants was likely to increase as people waited for buses or trains, walked to stations and bus stops, or walked or bicycled to work. Instead, it recommended providing advance warnings of smog episodes. It suggested that the “physically active

18
general population” should be especially targeted during periods when summer smog episodes were likely to occur (as these are associated with warm, sunny weather encouraging the population to spend more time outdoors). Those with cardiorespiratory disease should be targeted predominantly during periods when episodes of winter smog were
likely to occur, based on knowledge from the London smog episodes in 1952 (see Barker et al. (1961), outlined in section 2.3 above). The report further concluded that long-term measures to reduce baseline levels of pollution represented the most sensible and effective preventive measure.
electronically as an interactive CD-ROM and, later, on the WHO website.
For the first time, recommendations for PM were provided separately from those for SO2. It was also recognized that the rapidly expanding database of time-series studies should be used for guideline development and, importantly, that these studies did not suggest clear thresholds of effect. The results pointed to a near linear relationship between the logarithm of pollutant concentrations (24-hour average concentrations of ozone and PM monitored as PM10 or PM with a diameter of 2.5 microns or less (PM2.5)) and percentage changes in indices of effects on health, including daily mortality and admissions to hospital. Similar results were appearing with regard to SO2 and nO2; there was concern that nO2 was acting as an index or surrogate for an urban mixture of air pollutants, and effects on health of low concentrations of nO2 per se were questioned.
While conventional numerical guideline values were recommended for nO2 and SO2, a new approach was taken for PM2.5
and PM10, for both long- and short-term exposure. PM guidelines were provided as the slopes (in the form of relative risks) of the estimated concentration–response functions (CRFs) developed for several outcomes (reproduced in Tables 11 and 12). This allowed regulatory authorities to develop their own policies (by explicitly selecting a level of acceptable exposure and associated health risk) and to set standards by taking into account their local circumstances as regards ambient concentrations and socioeconomic factors.
Early in the 1990s it was already recognized that evidence of the effects of air pollutants on health was accumulating rapidly, and that the 1987 AQgs were in need of revision (Brunekreef, Dockery & Krzyzanowski, 1995). A second edition of the WHO AQgs was published in 2000 (WHO Regional Office for Europe, 2000), as a result of close cooperation with the International Programme on Chemical Safety. Funding was provided by the European Commission, the netherlands and Sweden. Work began in 1993, and more than 100 experts participated in a total of 10 meetings that were summarized in a series of WHO reports. These advance drafts were used in the years previous to the publication of the second edition to support the development of the European union’s legally binding limit values in the framework of the air quality directives. As a result of this work, detailed guidelines covering 35 air pollutants were produced, including reviews of evidence for essentially the same pollutants discussed in the first edition of the WHO AQgs (WHO Regional Office for Europe, 1987), with a few additional ones (butadiene, polychlorinated biphenyls, dibenzodioxins and dibenzofurans, fluoride and platinum). With some exceptions where evaluations from the previous WHO AQgs were retained (including for acrylonitrile, carbon disulfide, 1,2-dichloroethane, vinyl chloride, asbestos, hydrogen sulfide and vanadium), updated reviews of evidence were prepared and used as a basis for recommending guideline values. The final hard-copy report provided only summaries of the available evidence, but the lengthy reviews were made available
3.3 Air quality guidelines for Europe, second edition

19
Table 11. Summary of relative risk estimates for various end-points associated with a 10 µg/m3 increase in the concentration of PM10 or PM2.5
End-point Relative risk for PM2.5 (95% confidence interval)
Relative risk for PM10 (95% confidence interval)
Bronchodilatator use – 1.0305 (1.0201–1.0410)
Cough – 1.0356 (1.0197–1.0518)
Lower respiratory symptoms – 1.0324 (1.0185–1.0464)
Change in peak expiratory flow (relative to mean)
– −0.13% (−0.17% to −0.09%)
Respiratory hospital admissions – 1.0080 (1.0048–1.0112)
Mortality 1.015 (1.011–1.019) 1.0074 (1.0062–1.0086)
Note: The authors of the current report note that the table lacks specification that the numbers provided relate to short-term exposure.
Source: WHO Regional Office for Europe (2000). Reproduced with permission.
Table 12. Summary of relative risk estimates for effects of long-term exposure to particulate matter on the morbidity and mortality associated with a 10 µg/m3 increase in the concentration of PM2.5 or PM10
End-point Relative risk for PM2.5 (95% confidence interval)
Relative risk for PM10 (95% confidence interval)
Death 1.14 (1.04–1.24) 1.10 (1.03–1.18)
Death 1.07 (1.04–1.11) –
Bronchitis 1.34 (0.94–1.99) 1.29 (0.96–1.83)
Percentage change in FEv1, childrena −1.9% (−3.1% to −0.6%) −1.2% (−2.3% to −0.1%)
Percentage change in FEv1, adults – −1.0% (not available)
a [FEv in 1 second;] for PM2.1 rather than PM2.5
Source: WHO Regional Office for Europe (2000). Reproduced with permission.
This thinking did not represent a completely novel proposition; it had already been brought forward by WHO in 1972 (in Air quality criteria and guides for urban air pollutants, discussed in section 2.4). The same approach was developed for ozone, although for this pollutant an 8-hour average concentration of 120 µg/m3 was further recommended as a conventionally framed guideline. At this concentration it was agreed that “acute effects on public health are likely to be small”, and a cautionary note was attached to this guideline, stating: “For those public health authorities that cannot accept such levels of health
risk, an alternative is to select explicitly some other level of acceptable exposure and associated risk.” In spite of general agreement among the experts about a lack of indication of any threshold below which adverse effects of PM or ozone would not be anticipated, not all participants in the development of the guidelines regarded this approach as a step forward. Indeed, some experts argued that in the absence of a conventional guideline, regulatory authorities would be unlikely to develop and implement vigorous policies designed to reduce ambient concentrations of air pollutants.

20
Finally, another notable change from the 1987 publication was the inclusion of a chapter on the use of the guidelines in protecting public health. This was based on a report from a WHO working group on guidance for setting air quality standards, which had met in Barcelona in 1997 (WHO Regional Office for Europe, 1998). The working group included senior officials from regulatory authorities. The report reflected their expertise and experience of policy-making by explaining that air quality standards should be defined in terms of:
•how and where air pollutants should be monitored for comparison with standards;
•how the measurements should be handled in a statistical sense;
• the date by which the standard should be met; and
• the acceptable level of exceedance of the standard – for example, in terms of percentage of days per year that should be allowed or, rather, not be regarded as a failure to meet the standard.
Other issues such as the need for involvement of stakeholders in standard development, the raising of public awareness and the need for cost–benefit analysis were also raised.
Regional Office for Europe, 2004). WHO explicitly recognized that the fact that other pollutants – such as CO – were not included in the update reflected the limited resources available for the project.
The first part of this 484-page manual provided outstanding detailed reviews in nine chapters, written by recognized experts in the field, on air pollutants
Air quality guidelines: global update 2005, published in 2006, was a substantially different report from the 1987 and 2000 AQgs, as it focused on just four classical air pollutants: PM, ozone, nO2 and SO2. These were selected on the basis of the conclusions of a WHO project called “Systematic review of health aspects of air pollution in Europe” (WHO
3.4 Air quality guidelines: global update 2005
Box 5. Highlights of Air quality guidelines for Europe, second edition (WHO Regional Office for Europe, 2000)
• ThesecondeditionoftheWHOAQGsprovidedrecommendationsintheformofnumerical values/ranges and unit risk factors or CRFs for the pollutants included in the previous edition, in addition to butadiene, polychlorinated biphenyls, dibenzodioxins and dibenzofurans, fluoride and platinum. A separate section for indoor air pollutants (environmental tobacco smoke, man-made vitreous fibres and radon) was also provided.
• No new evaluations were conducted for acrylonitrile, carbon disulfide,1,2-dichloroethane, vinyl chloride, asbestos, hydrogen sulfide and vanadium, for which the recommendations from the 1987 AQgs were retained.
• ForthefirsttimeguidelineswereprovidedseparatelyforSO2 and PM.
• CRFs for PM and for ozone were developed – pollutant concentrationsassociated with specific levels of health response among defined population subgroups. A numerical guideline was proposed for ozone, while for PM only estimated relative risks for different outcomes from the CRFs were provided.
• A chapter on the use of the guidelines in protecting public health wasintroduced in this edition, discussing several air quality management issues to be considered when guidelines are to be used for the development of legally enforceable standards.

21
sources, concentrations and global trends, human exposure, health effects of susceptibility, environmental equity, health impact assessment, application of the guidelines in policy formulation and indoor air quality. The second part consisted of comprehensive health risk assessments of the four selected pollutants. The detail provided reflects the rapid expansion of research on these pollutants that occurred in the period 1995–2005.
As already stressed, a stern demand for guidelines framed in the conventional form was recognized and, in addition to concentration–effect relationships, numerical guideline values were now provided for PM, for both annual and 24-hour mean concentrations (reproduced in Tables 13 and 14).
Remarkably, the guideline values for nO2
(40 µg/m3 for annual mean and 200 µg/m3
for 1-hour mean concentrations) remained at the same levels as those set in the second edition of the WHO AQgs (WHO
Regional Office for Europe, 2000), despite many time-series studies that linked 24-hour average concentrations with effects on health. This decision reflected the residual concerns at that time that nO2
per se might not have effects on health at ambient concentrations, and that it might be acting as a surrogate for other, not routinely measured, components of combustion-related pollution mixture.
Further, a new approach was introduced in this edition of the guidelines, as interim targets were proposed for levels of three of the air pollutants: PM, ozone and SO2. These are pollutant concentrations associated with a specified decrease of mortality risk proposed as “incremental steps in progressive reduction of air pollution, and are intended for use in areas where pollution is high”. Interim targets were set on an arbitrary basis – other levels of effect might have been chosen – and they reflect the essence of benefit assessment based on linear concentration–response associations.
Table 13. AQGs and interim targets for PM: annual mean
Annual mean level
PM10(µg/m3)
PM2.5(µg/m3)
Basis for the selected level
WHO interim target 1 70 35These levels are estimated to be associated with about 15% higher long-term mortality than at AQg levels.
WHO interim target 2 50 25In addition to other health benefits, these levels lower risk of premature mortality by approximately 6% (2–11%) compared to interim target 1.
WHO interim target 3 30 15In addition to other health benefits, these levels lower risk of premature mortality by approximately another 6% (2–11%) compared to interim target 2 levels.
WHO AQgs 20 10
These are the lowest levels at which total, cardiopulmonary and lung cancer mortality have been shown to increase with more than 95% confidence in response to PM2.5 in the ACS study (323).a The use of the PM2.5 guideline is preferred.
a The authors of the current report note that reference 323 mentioned in the table is a misprint, as this should be reference 295 in the original guideline document: Pope CA et al. Lung cancer, cardiopulmonary mortality, and long-term exposure to fine particulate air pollution. JAMA, 2002, 287:1132–1141.
Source: WHO Regional Office for Europe (2006a). Reproduced with permission.

22
Table 14. AQGs and interim targets for PM: 24-hour mean
24-hour mean levela
PM10(µg/m3)
PM2.5(µg/m3)
Basis for the selected level
WHO interim target 1 150 75Based on published risk coefficients from multicentre studies and meta-analyses (about 5% increase in short-term mortality over AQg)
WHO interim target 2 100 50Based on published risk coefficients from multicentre studies and meta-analyses (about 2.5% increase in short-term mortality over AQg)
WHO interim target 3b 75 37.5 About 1.2% increase in short-term mortality over AQg
WHO AQgs 50 25Based on relation between 24-hour and annual PM levels
a 99th percentile (3 days per year).b For management purposes, based on annual average guideline values, the precise number to be
determined on the basis of local frequency distribution of daily means.
Source: WHO Regional Office for Europe (2006a). Reproduced with permission.
As emphasized in the first edition of the WHO AQgs (WHO Regional Office for Europe, 1987), the text accompanying the numbers in the tables is an integral part of the recommendations, so the guideline values and interim targets must be interpreted alongside the text explaining the reasoning behind the numbers and indicating, sometimes simplifying, assumptions and caveats. As an example, the guidelines for annual mean concentrations of PM10 were derived from the results of epidemiological studies on PM2.5 effects using a simple conversion formula: PM10 = 2 × PM2.5. Observations quoted in the supporting text, however, indicate that PM2.5 makes up, in various locations and at certain times, 40–90% of PM10.
As well as the full text with the evidence assessment, WHO published an executive summary of the guidelines in all official languages (WHO, 2016c). This contained a short introduction on the role of the guidelines in protecting public health, as well as the rationale on which the guidelines for each of the four air pollutants were based.
Chapter 9 of the guidelines focused on indoor air pollution, addressing the conditions prevalent in developing countries as a result of indoor combustion of solid fuels, and making some preliminary recommendations for WHO work to be conducted in this area, including a framework for the future
development of WHO indoor AQgs. The topic of environmental equity was also addressed (Chapter 6): the unequal distribution of environmental exposure to air pollutants and associated health risks was recognized, and policy implications as well as future research needs discussed.
Although national standards set as a result of the AQgs update vary considerably from country to country, none were set at lower levels than the recommended WHO guidelines. Setting standards below WHO AQgs would be likely to raise complaints from industry about what might be seen as an overcautious approach, considering the common perception that WHO guidelines represent “safe” (or at least safe enough) levels of exposure, and that straining for lower levels simply penalizes industry without benefiting health. Such criticism might be avoided by framing guidelines as concentration–effect relationships, suggesting that every additional reduction in ambient concentrations would be linked with benefits to health.
Finally, the importance of risk communication in relation to air pollution was clearly stated at the end of Chapter 8. Communication of health risks associated with air pollution should be addressed not only to policy-makers but to a wider audience. Public opinion and perception of risk among the general public is viewed as an important factor

23
in influencing decisions, in that “the political capability of decision-makers is directly proportional to the interests and concerns of their constituents”. The use of air quality indexes and other tools to inform people about air quality and health was briefly discussed in this section.
Evidence of the effects of air pollutants on health has continued to grow in the years following the publication of the 2005 WHO AQgs global update. The report of an expert review led by the WHO Regional Office for Europe, published in
2013, supported the update’s scientific conclusions that adverse health effects occur at air pollutant levels lower than those used to establish the guidelines (WHO Regional Office for Europe, 2013a). Considering the significant expansion of the evidence on air pollution health effects, including their better quantification and detection, the project recommended that WHO should initiate the process of developing new revisions to its ambient AQgs.
approaches from those used for outdoor air pollution.
Following the initial plan established in a working group meeting held in Bonn, germany, in 2006 (WHO Regional Office for Europe, 2006b), WHO developed indoor AQgs on selected chemical and biological contaminants of indoor air, as well as on household fuel combustion (WHO Regional Office for Europe, 2009; 2010; WHO, 2014b).
One of the results of the expert discussions held during the preparation of the 2005 WHO AQgs global update (WHO Regional Office for Europe, 2006a) was the recommendation that WHO should initiate the process of developing WHO guidelines focusing on indoor air quality. Populations spend a substantial proportion of their time in indoor environments, and problems of indoor air pollution were increasingly recognized as important risk factors for human health, requiring different management
3.5 WHO guidelines for indoor air quality
Box 6. Highlights of Air quality guidelines: global update 2005 (WHO Regional Office for Europe, 2006a)
• Thiswasthe lastWHOpublication todate thatprovidednumericalambientAQgs for PM, ozone, nO2 and SO2.
• ThesameguidelinevalueswereretainedfromthesecondeditionoftheWHOAQgs (WHO Regional Office for Europe, 2000) for nO2, and concentration–response estimates (relative risks) were presented for PM in addition to the guideline values.
• ForthefirsttimeinterimtargetswereproposedforPM,ozoneandSO2. These were pollutant concentrations associated with a specified increase of mortality risk over that expected at the guidelines level, intended to guide Member States – especially those with high levels of air pollution – in moving towards lower levels of population exposure to ambient air pollution.
• Achapterwasdevotedtoindoorairqualityandproposedaframeworkforthefuture development of WHO indoor AQgs. The topic of environmental equity was also discussed for the first time, documenting the unequal distribution of health risks due to air pollution within and among nations, and its possible underlying causes.
• The importance of risk communication to a wide range of stakeholders,including the general public, was also addressed and viewed as a necessary component in air quality management.

24
3.5.1 Dampness and mouldThe first volume of WHO guidelines for indoor air quality focused on dampness and mould and was published in 2009, as a result of collaboration between the WHO Regional Office for Europe and WHO headquarters (WHO Regional Office for Europe, 2009). Funding was provided by the governments of germany and the united Kingdom.
These guidelines addressed and reviewed the scientific evidence on health effects resulting from dampness, associate microbial growth and contamination of indoor spaces, considering both private and public spaces. Quantitative guidelines for specific biological agents could not be developed due to the complex nature of the exposure and associated uncertainties, however. Instead, a set of recommendations was provided addressing a number of defined indicators of health risk in indoor environments, such as persistent dampness and presence of mould in buildings – often as a result of insufficient moisture control and ventilation. This decision was based on the evidence showing that excess moisture on almost all indoor materials leads to growth of microbes – such as mould, fungi and bacteria – which subsequently emit spores, cells, fragments and volatile organic compounds into indoor air. Moreover, dampness initiates chemical or biological degradation of materials, which also pollutes indoor air. Dampness has been found to be a strong, consistent indicator of risk of asthma and respiratory symptoms (such as cough and wheeze) in epidemiological studies.
The objective of the guidelines was to raise general awareness and provide a tool for public health authorities on how to identify and reduce the health hazards associated with indoor exposure to biological agents. While they provided recommendations for indoor air quality management, focusing on prevention of persistent dampness and microbial growth on interior surfaces and building structures to minimize the occurrence of associated adverse health effects, they did not give instructions for achieving
those objectives. The determination of specific methods to enforce these recommendations was left to the judgement of the competent authorities, allowing for considerations of technical feasibility, level of development, resources available or human capacities, among other factors.
3.5.2 Selected pollutantsThe second volume of WHO guidelines for indoor air quality, on selected pollutants, was published in 2010 and supported by donations from the governments of Canada, France and the netherlands (WHO Regional Office for Europe, 2010).
guidelines were provided for nine indoor air pollutants: benzene, CO, formaldehyde, naphthalene, nO2, polycyclic aromatic hydrocarbons, radon, trichloroethylene and tetrachloroethylene. The pollutants were selected by the working group of experts who met in 2006 to plan the development of the guidelines (WHO Regional Office for Europe, 2006b). They considered the presence of the pollutants in indoor environments in concentrations of concern for health, as well as the availability of toxicological, epidemiological and clinical data. Regarding indoor exposure to PM, which can be higher than outdoor exposure in the presence of an indoor source of PM, readers were referred to the guideline values on PM from the 2005 WHO AQgs global update (WHO Regional Office for Europe, 2006a), which relate to all environments. A synthesis of the guidelines provided for the nine selected indoor air pollutants is reproduced in Table 15.
The development of these guidelines adopted a similar approach to that used for the previous AQgs for individual air pollutants. A unit risk approach was taken for carcinogenic compounds, as in the 1987 and 2000 AQgs. note that the recommended guideline values for nO2 remained identical to those recommended in the 2005 WHO AQgs global update (WHO Regional Office for Europe, 2006a), and it was stated that epidemiological studies provided no evidence of a threshold of effect.

25
Table 15. Summary of indoor AQGs for selected pollutants
Pollutant Critical outcome(s) for guideline definition
Guidelines Comments
Benzene •Acutemyeloidleukaemia(sufficient evidence on causality)
•Genotoxicity
•Nosafelevelofexposurecanberecommended
•Unitriskofleukaemiaper1μg/m3 air concentration is 6 × 10⁻⁶
•Theconcentrationsofairbornebenzeneassociated with an excess lifetime risk of 1/10 000, 1/100 000 and 1/1 000 000 are 17,1.7and0.17μg/m3, respectively
–
Carbon monoxide Acute exposure-related reduction of exercise tolerance and increase in symptoms of ischaemic heart disease (e.g. ST-segment changes)
•15minutes–100mg/m3
•1hour–35mg/m3
•8hours–10mg/m3
•24hours–7mg/m3
–
Formaldehyde Sensory irritation 0.1 mg/m3 – 30-minute average The guideline (valid for any 30-minute period) will also prevent effects on lung function as well as nasopharyngeal cancer and myeloid leukaemia
naphthalene Respiratory tract lesions leading to inflammation and malignancy in animal studies
0.01 mg/m3 – annual average The long-term guideline is also assumed to prevent potential malignant effects in the airways
nitrogen dioxide Respiratory symptoms, bronchoconstriction, increased bronchial reactivity, airway inflammation and decreases in immune defence, leading to increased susceptibility to respiratory infection
•200μg/m3 – 1-hour average•40μg/m3 – annual average
no evidence for exposure threshold from epidemiological studies
Polycyclic aromatic hydrocarbons
Lung cancer •Nothresholdcanbedeterminedandallindoor exposures are considered relevant to health
•Unitriskforlungcancerforpolycyclicaromatic hydrocarbon mixtures is estimated to be 8.7 × 10⁻⁵ per ng/m3 of Benzo[a]pyrene (BaP)
•Thecorrespondingconcentrationsforlifetimeexposure to BaP producing excess lifetime cancer risks of 1/10 000, 1/100 000 and 1/1 000 000 are approximately 1.2, 0.12 and 0.012 ng/m3, respectively
BaP is taken as a marker of the polycyclic aromatic hydrocarbon mixture
Radon Lung cancerSuggestive evidence of an association with other cancers, in particular leukaemia and cancers of the extrathoracic airways
•Theexcesslifetimeriskofdeathfromradon-induced lung cancer (by the age of 75 years) is estimated to be 0.6 × 10⁻⁵ per Bq/m3 for lifelong non-smokers and 15 × 10–5 per Bq/m3 for current smokers (15–24 cigarettes per day); among ex-smokers, the risk is intermediate, depending on time since smoking cessation
•Theradonconcentrationsassociatedwithanexcess lifetime risk of 1/100 and 1/1000 are 67 and 6.7 Bq/m3 for current smokers and 1670 and 167 Bq/m3 for lifelong non-smokers, respectively
WHO guidelines provide a comprehensive approach to the management of health risk related to radon
Trichloroethylene Carcinogenicity (liver, kidney, bile duct and non-Hodgkin’s lymphoma), with the assumption of genotoxicity
•Unitriskestimateof4.3×10–7perμg/m3
•Theconcentrationsofairbornetrichloroethylene associated with an excess lifetime cancer risk of 1:10 000, 1:100 000 and1:1000000are230,23and2.3μg/m3, respectively
–
Tetrachloroethylene Effects in the kidney indicative of early renal disease and impaired performance
0.25 mg/m3 – annual average Carcinogenicity is not used as an end-point as there are no indications that tetrachloroethylene is genotoxic and there is uncertainty about the epidemiological evidence and the relevance to humans of the animal carcinogenicity data

26
Finally, the guidelines addressed measures to reduce the concentrations of air pollutants both outdoors and indoors. The main measure is controlling the primary factor that determines their presence in the air: the source(s) of emission. In indoor environments, in addition, secondary factors (dispersion and dilution) can also be controlled to some extent by, for example, ensuring adequately ventilated spaces or through the use of low-emission materials in buildings and appropriate devices and fuels for indoor combustion. This last point was addressed in detail in the third volume of WHO guidelines for indoor air quality.
3.5.3 Household fuel combustion
The WHO guidelines for indoor air quality on household fuel combustion were published in 2014, building on the 2005 WHO AQgs global update for PM and carbon monoxide (WHO, 2014b). The project was coordinated by WHO headquarters, and financial support for its completion was obtained from Canada, germany, the Indian Council for Medical Research, the united Kingdom and the united nations Foundation global Alliance for Clean Cookstoves.
The evidence on health effects of indoor air pollution due to combustion of household fuels was reviewed, but the recommendations focused on the reduction of emission rates by targeting the determinants of contamination of indoor spaces, such as the use of certain fuels (coal and kerosene) and types of stoves. This approach was intended to facilitate interventions to improve indoor air quality and reduce health risks due to contamination of indoor spaces by combustion of household fuels, and to reduce safety problems associated with their use (such as burns, poisoning or house fires). The guidelines emphasized
that local ambient air quality conditions had to be considered in achieving the proposed indoor AQgs, considering the infiltration of outdoor air into indoor environments.
These were the first AQgs developed following the procedures outlined in the first edition of the WHO handbook for guideline development, published in 2012. This provides guidance on the steps needed to ensure that WHO guidelines are of high methodological quality and are developed through a transparent, evidence-based decision-making process, to guarantee that the final guidelines are free from biases and meet public health needs (WHO, 2012). This handbook, for which a second edition was published in 2014 (WHO, 2014c), provides detailed instructions for guideline developers on the following topics:
•application of high-quality methodology for guideline development using systematic search strategies, synthesis and quality assessment of the best available evidence to support the recommendations;
•appropriate collection and management of experts’ declared conflict of interest;
•expert group composition, including content experts, methodologists, target users and policy-makers, with gender and geographical balance;
• instructions for the management of group process to achieve consensus among experts;
•standards for a transparent decision-making process, taking into consideration potential harms and benefits, and end-user values and preferences;
•developing plans for implementing and adapting guidelines; and
•minimum standards for reporting.

27
Between 2011 and 2013 the WHO Regional Office for Europe coordinated two international projects co-funded by the European union: Review of evidence on health aspects of air pollution (REvIHAAP) and Health risks of air pollution in Europe (HRAPIE) (WHO Regional Office for Europe, 2013a; 2013b). REvIHAAP provided the European Commission and its stakeholders with evidence-based advice on the latest scientific aspects of air pollution and health in the form of answers (supported by extensive rationale) to a series of policy-relevant questions. This project was grounded on a review conducted by a group of experts of all air pollutants regulated in European directives 2008/50/EC and 2004/107/EC. The output of the second project, HRAPIE, was a technical report recommending CRFs for cost–benefit analysis for several mortality and morbidity effects associated with short- and long-term exposure to PM, ozone and nO2.
Results from these two projects aimed to support the comprehensive review of European union air quality policy in 2013. One of the specific expert recommendations from the REvIHAAP project, however, was that WHO should begin the process of revising the current AQgs for ambient air pollutants. This recommendation was based, inter alia, on the availability of a large amount of scientific information that had emerged since the last ambient AQgs were published in 2006, including findings revealing associations between ambient air pollutants and adverse health effects at concentrations lower than previously identified.
As a result, and in preparation for an update of the AQgs, a global consultation meeting was organized
by the WHO Regional Office for Europe in 2015 to obtain expert advice on air pollutants and other issues relevant to be considered in the future guidelines. Experts discussed the latest available scientific evidence on the health effects of 32 ambient air pollutants for which WHO had developed AQgs in the past, as well as the occurrence and trends of these pollutants in ambient air. The topic of air quality interventions to reduce ambient air pollution and improve public health was also discussed as part of this consultation (WHO Regional Office for Europe, 2016). The conclusions of the expert consultation contributed to the scoping of the content of the next update of the WHO global AQgs.
The update of the WHO global AQgs thus initiated is so far receiving funding and in-kind support from the European Commission (Directorate-general for Environment) and the governments of germany, Switzerland and the united States of America. It is expected that the next AQgs will provide updated numerical concentration limits and, where possible, an indication of the shape of the CRFs for PM10, PM2.5, ozone, nO2, SO2 and CO, for short- and/or long-term exposure. Further, a statement on the relationship between exposure to mineral dust of natural origin and health outcomes will also be developed, based on a review of the latest evidence.
The process of updating the WHO global AQgs will follow the requirements described in the second edition of the WHO handbook for guideline development (WHO, 2014c). It will face the challenge of ensuring a comprehensive systematic review of the enormous amount of new scientific evidence related to the topic of the guidelines. It will also need to use grading of recommendations
Update of the WHO global AQGs4.

28
assessment, development and evaluation (gRADE), which is the methodological framework adopted by WHO to assess the quality of the body of evidence for guideline development (gRADE Working group, 2016). This framework was initially developed in the context of clinical guidelines and interventions; it will therefore need to be adapted to the area of environmental health. This is a current topic of discussion and a work in progress by many experts in the field (Morgan et al., 2016).
The process will benefit from new available studies performed in various environmental, social and health conditions, and will face the challenge of integrating results from different geographical locations with heterogeneous levels and sources of air pollutants, in order to provide recommendations of global application.
The updated AQgs will also address, in general terms, air quality management
and the importance of reducing emissions of harmful air pollutants, which is the most effective way to improve air quality and protect populations from the adverse health effects of air pollution. As their effectiveness is highly context dependent, however, no recommendations for specific air quality interventions will be developed in the updated guidelines.
Future issues of the AQgs may consider developing evidence-based recommendations on the effectiveness of available personal interventions to decrease individual exposure to ambient air pollutants and associated health effects, like the use of protective equipment (face masks, air filters and similar) or following certain behavioural recommendations in daily activities, such as reducing outdoor exercise during peaks of air pollution. nevertheless, inclusion of these recommendations in the next update of the AQg will depend on the availability of additional resources.

29
WHO’s work on air pollution and health, and in particular the various AQgs for ambient and indoor air pollutants, have made a most important contribution to the synthesis of the latest knowledge on the health effects of air pollutants. They have provided expert and detailed guidance to regulatory authorities since the publication of the first edition of the WHO AQgs (WHO Regional Office for Europe, 1987). It has repeatedly been stressed that the guidelines are not intended to be taken as recommendations for air quality standards per se, but rather as a rigorous scientific tool that can be used by regulatory authorities as a basis for setting standards, taking into account local sociopolitical and economic conditions and prevailing ambient concentrations of air pollutants. Cost–benefit analysis of various pollution reduction options is an increasingly common tool supporting development of air quality policies. The evaluation of evidence provided by the WHO guideline process, and not only
the numerical guidelines, is an essential input to such analysis.
Achievement of clean outdoor and indoor air is recognized as a basic right, and WHO activities in the air pollution field for the past 60 years have contributed substantially in moving towards this goal. That such work should be continued is beyond doubt, especially considering recent data ranking air pollution among the top risks for mortality and lost years of healthy life globally, which affects everyone in developed and developing countries, in both urban and rural areas. This was recognized in the roadmap for an enhanced global response to the adverse health effects of air pollution, presented by WHO at the Sixty-ninth World Health Assembly (WHO, 2016d), in which further development of the AQgs is included as an element of “expanding the knowledge base” – one of the cornerstones of the global action.
Final remarks5.
Disclaimer: the views presented here reflect those of the authors and should not be taken as reflecting the views of WHO.

30
Barker K, Cambi F, Catcott EJ, Chambers LA, Halliday EC, Hasegawa A et al. (1961). Air pollution. Geneva: World Health Organization (WHO Monograph Series, No. 46; http://apps.who.int/iris/handle/10665/41722, accessed 23 May 2016).
Brunekreef B, Dockery DW, Krzyzanowski M (1995). Epidemiologic studies on short-term effects of low levels of major ambient air pollution components. Environ Health Perspect. 103(Suppl 2):3–13 (http://www.ncbi.nlm.nih.gov/pmc/articles/PMC1518847/, accessed 23 May 2016).
GRADE working group (2016). GRADE [website]. Hamilton, ON: GRADE working group (http://www.gradeworkinggroup.org/, accessed 11 July 2016).
Katz M (1969). Measurement of air pollutants: guide to selection of methods. Geneva: World Health Organization (http://apps.who.int/iris/bitstream/10665/40515/1/9241540060.pdf, accessed 23 May 2016).
Lawther PJ (1961). Urban air pollution and its effects on man. In: The air we breathe: a study of man and his environment. Springfield, Ill: Charles C. Thomas:206–11.
Lawther PJ, Martin AE, Wilkins ET (1962). Epidemiology of air pollution: report on a symposium. Geneva: World Health Organization (WHO Public Health Papers, No. 15; https://extranet.who.int/iris/restricted/handle/10665/39725?locale=en&null, accessed 23 May 2016).
Lippmann M (1988). Health significance of pulmonary function responses to airborne irritants. JAPCA. 38(7):881–7.
Lippmann M (1989). Health effects of ozone: a critical review. JAPCA. 39(5):672–95.
Morgan RL, Thayer KA, Bero L, Bruce N, Falck-Ytter Y, Ghersi D et al. (2016). GRADE: assessing the quality of evidence in environmental and occupational health. Environ Int. 92–93:611–6. (http://linkinghub.elsevier.com/retrieve/pii/S0160412016300034, accessed 1 July 2016).
Suess MJ, Craxford SR, editors (1976). Manual on urban air quality management. Copenhagen: WHO Regional Office for Europe (WHO Regional Publications, European Series, No. 1; https://www.cabdirect.org/cabdirect/abstract/19772700004, accessed 23 November 2016).
US EPA (1980). Guidelines and methodology used in the preparation of health effect assessment chapters of the consent decree water quality criteria. Washington, DC: United States Environmental Protection Agency (https://www.epa.gov/wqc/guidelines-and-methodology-used-preparation-health-effect-assessment-chapters-consent-decree, accessed 23 November 2016).
WHO (1958). Air pollution: fifth report of the Expert Committee on Environmental Sanitation. Geneva: World Health Organization (WHO Technical Report Series, No. 157; http://apps.who.int/iris/handle/10665/40416, accessed 23 May 2016).
WHO (1963a). Air pollution: a survey of existing legislation. Geneva: World Health Organization.
WHO (1963b). Interregional Symposium on Criteria for Air Quality and Methods of Measurement. Geneva: World Health Organization.
WHO (1964). Atmospheric pollutants: report of a WHO expert committee. Geneva: World Health Organization (WHO Technical Report Series, No. 271; http://apps.who.int/iris/handle/10665/40578, accessed 23 May 2016).
WHO (1968). Research into environmental pollution: report of five WHO scientific groups. Geneva: World Health Organization (WHO Technical Report Series, No. 406; http://apps.who.int/iris/handle/10665/40709, accessed 23 May 2016).
WHO (1970). National environmental health programmes: their planning, organization and administration. Report of a WHO expert committee. Geneva: World Health Organization (WHO Technical Report Series, No. 439; http://apps.who.int/iris/handle/10665/40768, accessed 23 May 2016).
References6.

31
WHO (1972). Air quality criteria and guides for urban air pollutants: report of a WHO expert committee. Geneva: World Health Organization (WHO Technical Report Series, No. 506; http://apps.who.int/iris/handle/10665/40989, accessed 23 May 2016).
WHO (1984). Guidelines for drinking-water quality, volume 1. Recommendations. Geneva: World Health Organization (http://www.who.int/water_sanitation_health/water-quality/guidelines/previous-guidelines/en/, accessed 23 November 2016).
WHO (2012). WHO handbook for guideline development. Geneva: World Health Organization (http://apps.who.int/iris/handle/10665/75146, accessed 1 July 2016).
WHO (2014a). Burden of disease from air pollution for 2012: summary of results. Geneva: World Health Organization (http://www.who.int/gho/phe/outdoor_air_pollution/burden_text/en/, accessed 1 July 2016).
WHO (2014b). WHO guidelines for indoor air quality: household fuel combustion. Geneva: World Health Organization (http://www.who.int/indoorair/publications/household-fuel-combustion/en/, accessed 23 May 2016).
WHO (2014c). WHO handbook for guideline development, second edition. Geneva: World Health Organization (http://www.who.int/kms/guidelines_review_committee/en/, accessed 1 July 2016).
WHO (2016a). Ambient air pollution: a global assessment of exposure and burden of disease. Geneva: World Health Organization (http://who.int/phe/publications/air-pollution-global-assessment/en/, accessed 21 November 2016).
WHO (2016b). Numerical list of EHCs. In: International Programme on Chemical Safety [website]. Geneva: World Health Organization (http://www.who.int/ipcs/publications/ehc/ehc_numerical/en/, accessed 11 July 2016).
WHO (2016c). Air quality guidelines – global update 2005 [website]. Geneva: World Health Organization (http://www.who.int/phe/health_topics/outdoorair/outdoorair_aqg/en/, accessed 11 July 2016).
WHO (2016d). Health and the environment: draft road map for an enhanced global response to the adverse health effects of air pollution. Geneva: World Health Organization (EB138/17; http://apps.who.int/gb/e/e_eb138.html, accessed 24 November 2016).
WHO Regional Office for Europe (1980). Glossary on air pollution. Copenhagen: WHO Regional Office for Europe (http://www.euro.who.int/__data/assets/pdf_file/0008/155717/WA15.pdf, accessed 23 November 2016).
WHO Regional Office for Europe (1985). Targets for health for all. Copenhagen: WHO Regional Office for Europe (http://www.euro.who.int/__data/assets/pdf_file/0006/109779/WA_540_GA1_85TA.pdf, accessed 26 November 2016).
WHO Regional Office for Europe (1987). Air quality guidelines for Europe. Copenhagen: WHO Regional Office for Europe (WHO Regional Publications, European Series, No.3; https://extranet.who.int/iris/restricted/handle/10665/107364, accessed 23 November 2016).
WHO Regional Office for Europe (1992). Acute effects on health of smog episodes. Copenhagen: WHO Regional Office for Europe (WHO Regional Publications, European Series, No. 43; http://www.euro.who.int/__data/assets/pdf_file/0010/156781/euro_series_43.pdf, accessed 23 November 2016).
WHO Regional Office for Europe (1998). Guidance for setting air quality standards: report on a WHO working group. Copenhagen: WHO Regional Office for Europe (https://extranet.who.int/iris/restricted/bitstream/10665/108084/1/E59641.pdf, accessed 23 May 2016).
WHO Regional Office for Europe (2000). Air quality guidelines for Europe, second edition. Copenhagen: WHO Regional Office for Europe (WHO Regional Publications, European Series, No. 91; http://www.euro.who.int/en/publications/abstracts/air-quality-guidelines-for-europe, accessed 23 May 2016).
WHO Regional Office for Europe (2004). Health aspects of air pollution: results from the WHO project “Systematic review of health aspects of air pollution in Europe”. Copenhagen: WHO Regional Office for Europe (http://www.euro.who.int/en/health-topics/environment-and-health/air-quality/publications/pre2009/health-aspects-of-air-pollution-results-from-the-who-project-systematic-review-of-health-aspects-of-air-pollution-in-europe, accessed 30 June 2016).

32
WHO Regional Office for Europe (2006a). Air quality guidelines: global update 2005 – particulate matter, ozone, nitrogen dioxide and sulfur dioxide. Copenhagen: WHO Regional Office for Europe (http://www.euro.who.int/en/health-topics/environment-and-health/Housing-and-health/publications/pre-2009/air-quality-guidelines.-global-update-2005.-particulate-matter,-ozone,-nitrogen-dioxide-and-sulfur-dioxide, accessed 23 May 2016).
WHO Regional Office for Europe (2006b). Development of WHO guidelines for indoor air quality: report on a working group meeting. Copenhagen: WHO Regional Office for Europe (http://www.euro.who.int/en/health-topics/environment-and-health/air-quality/publications/pre2009/development-of-who-guidelines-for-indoor-air-quality, accessed 23 May 2016).
WHO Regional Office for Europe (2009). WHO guidelines for indoor air quality: dampness and mould. Copenhagen: WHO Regional Office for Europe (http://www.euro.who.int/en/health-topics/environment-and-health/air-quality/publications/2009/who-guidelines-for-indoor-air-quality-dampness-and-mould, accessed 23 May 2016).
WHO Regional Office for Europe (2010). WHO guidelines for indoor air quality: selected pollutants. Copenhagen: WHO Regional Office for Europe (http://www.euro.who.int/en/health-topics/environment-and-health/air-quality/policy/who-guidelines-for-indoor-air-quality/chemical-indoor-air-pollutants-selected-pollutants-2010/who-guidelines-for-indoor-air-quality-selected-pollutants, accessed 23 May 2016).
WHO Regional Office for Europe (2013a). Review of evidence on health aspects of air pollution – REVIHAAP project: final technical report. Copenhagen: WHO Regional Office for Europe (http://www.euro.who.int/en/health-topics/environment-and-health/air-quality/publications/2013/review-of-evidence-on-health-aspects-of-air-pollution-revihaap-project-final-technical-report, accessed 23 May 2016).
WHO Regional Office for Europe (2013b). Health risks of air pollution in Europe – HRAPIE project. Recommendations for concentration–response functions for cost–benefit analysis of particulate matter, ozone and nitrogen dioxide. Copenhagen: WHO Regional Office for Europe (http://www.euro.who.int/en/health-topics/environment-and-health/air-quality/publications/2013/health-risks-of-air-pollution-in-europe-hrapie-project.-recommendations-for-concentrationresponse-functions-for-costbenefit-analysis-of-particulate-matter,-ozone-and-nitrogen-dioxide, accessed 23 May 2016).
WHO Regional Office for Europe (2016). WHO expert consultation: available evidence for the future update of the WHO global air quality guidelines (AQGs). Copenhagen: WHO Regional Office for Europe (http://www.euro.who.int/en/health-topics/environment-and-health/air-quality/publications/2016/who-expert-consultation-available-evidence-for-the-future-update-of-the-who-global-air-quality-guidelines-aqgs-2016, accessed 1 July 2016).

The WHO RegionalOffice for Europe
The World Health Organization (WHO) is a specialized agency of the united nations created in 1948 with the primary responsibility for international health matters and public health. The WHO Regional Office for Europe is one of six regional offices throughout the world, each with its own programme geared to the particular health conditions of the countries it serves.
Member States
AlbaniaAndorraArmeniaAustriaAzerbaijanBelarusBelgiumBosnia and HerzegovinaBulgariaCroatiaCyprusCzechiaDenmarkEstoniaFinlandFrancegeorgiagermanygreeceHungaryIcelandIrelandIsraelItalyKazakhstanKyrgyzstanLatviaLithuaniaLuxembourgMaltaMonacoMontenegronetherlandsnorwayPolandPortugalRepublic of MoldovaRomaniaRussian FederationSan MarinoSerbiaSlovakiaSloveniaSpainSwedenSwitzerlandTajikistanThe former Yugoslav Republic of MacedoniaTurkeyTurkmenistanukraineunited Kingdomuzbekistan
World Health Organization Regional Office for Europe
un City, Marmorvej 51, DK-2100 Copenhagen Ø, DenmarkTel.: +45 45 33 70 00/Fax: +45 45 33 70 01
Email: [email protected]: www.euro.who.int