Embed Size (px)
Citation preview
160140120100
100
120
80
56Ni
208Pb
78Ni
100Sn 132Sn
80
Prot
on n
umbe
r Z
Neutron number N60
60
40
40
20
20
00
180 200
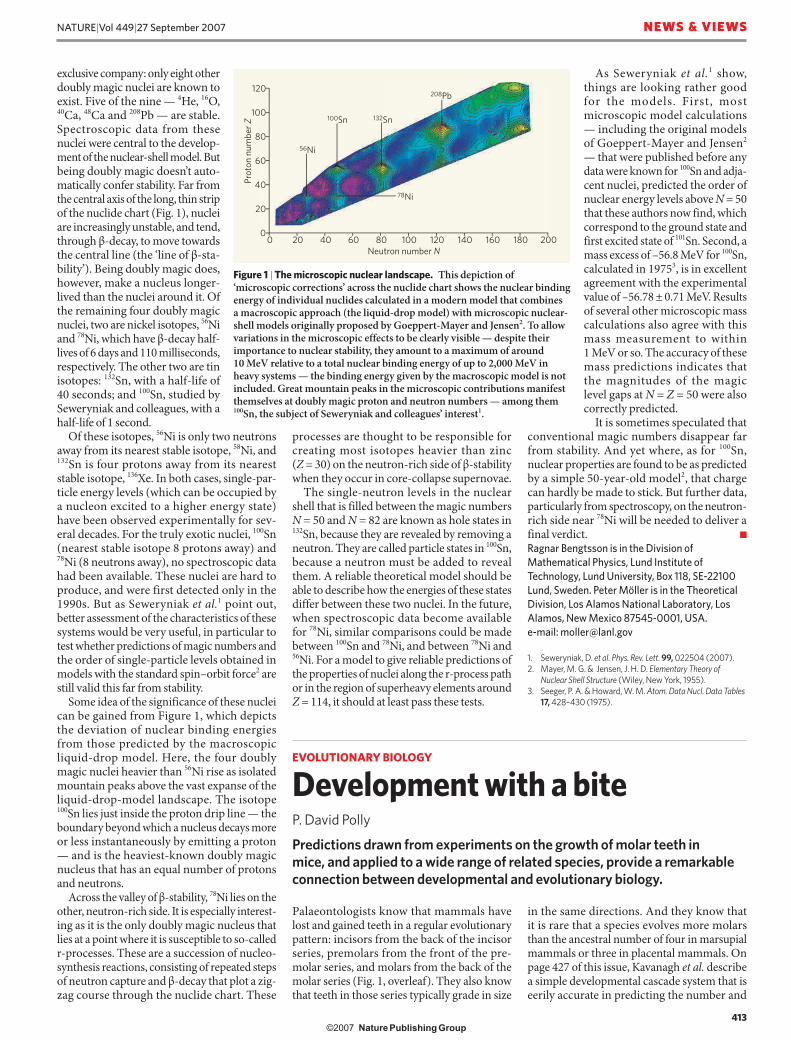
exclusive company: only eight other doubly magic nuclei are known to exist. Five of the nine — 4He, 16O, 40Ca, 48Ca and 208Pb — are stable. Spectroscopic data from these nuclei were central to the develop-ment of the nuclear-shell model. But being doubly magic doesn’t auto-matically confer stability. Far from the central axis of the long, thin strip of the nuclide chart (Fig. 1), nuclei are increasingly unstable, and tend, through β-decay, to move towards the central line (the ‘line of β-sta-bility’). Being doubly magic does, however, make a nucleus longer-lived than the nuclei around it. Of the remaining four doubly magic nuclei, two are nickel isotopes, 56Ni and 78Ni, which have β-decay half-lives of 6 days and 110 milliseconds, respectively. The other two are tin isotopes: 132Sn, with a half-life of 40 seconds; and 100Sn, studied by Seweryniak and colleagues, with a half-life of 1 second.
Of these isotopes, 56Ni is only two neutrons away from its nearest stable isotope, 58Ni, and 132Sn is four protons away from its nearest stable isotope, 136Xe. In both cases, single-par-ticle energy levels (which can be occupied by a nucleon excited to a higher energy state) have been observed experimentally for sev-eral decades. For the truly exotic nuclei, 100Sn (nearest stable isotope 8 protons away) and 78Ni (8 neutrons away), no spectroscopic data had been available. These nuclei are hard to produce, and were first detected only in the 1990s. But as Seweryniak et al.1 point out, better assessment of the characteristics of these systems would be very useful, in particular to test whether predictions of magic numbers and the order of single-particle levels obtained in models with the standard spin–orbit force2 are still valid this far from stability.
Some idea of the significance of these nuclei can be gained from Figure 1, which depicts the deviation of nuclear binding energies from those predicted by the macroscopic liquid-drop model. Here, the four doubly magic nuclei heavier than 56Ni rise as isolated mountain peaks above the vast expanse of the liquid-drop-model landscape. The isotope 100Sn lies just inside the proton drip line — the boundary beyond which a nucleus decays more or less instantaneously by emitting a proton — and is the heaviest-known doubly magic nucleus that has an equal number of protons and neutrons.
Across the valley of β-stability, 78Ni lies on the other, neutron-rich side. It is especially interest-ing as it is the only doubly magic nucleus that lies at a point where it is susceptible to so-called r-processes. These are a succession of nucleo-synthesis reactions, consisting of repeated steps of neutron capture and β-decay that plot a zig-zag course through the nuclide chart. These
pro cesses are thought to be responsible for creating most isotopes heavier than zinc (Z = 30) on the neutron-rich side of β-stability when they occur in core-collapse supernovae.
The single-neutron levels in the nuclear shell that is filled between the magic numbers N = 50 and N = 82 are known as hole states in 132Sn, because they are revealed by removing a neutron. They are called particle states in 100Sn, because a neutron must be added to reveal them. A reliable theoretical model should be able to describe how the energies of these states differ between these two nuclei. In the future, when spectroscopic data become available for 78Ni, similar comparisons could be made between 100Sn and 78Ni, and between 78Ni and 56Ni. For a model to give reliable predictions of the properties of nuclei along the r-process path or in the region of superheavy elements around Z = 114, it should at least pass these tests.
As Seweryniak et al.1 show, things are looking rather good for the models. First, most microscopic model calculations — including the original models of Goeppert-Mayer and Jensen2 — that were published before any data were known for 100Sn and adja-cent nuclei, predicted the order of nuclear energy levels above N = 50 that these authors now find, which correspond to the ground state and first excited state of 101Sn. Second, a mass excess of –56.8 MeV for 100Sn, calculated in 19753, is in excellent agreement with the experimental value of –56.78 ± 0.71 MeV. Results of several other microscopic mass calculations also agree with this mass measurement to within 1 MeV or so. The accuracy of these mass predictions indicates that the magnitudes of the magic level gaps at N = Z = 50 were also correctly predicted.
It is sometimes speculated that conventional magic numbers disappear far from stability. And yet where, as for 100Sn, nuclear properties are found to be as predicted by a simple 50-year-old model2, that charge can hardly be made to stick. But further data, particularly from spectroscopy, on the neutron-rich side near 78Ni will be needed to deliver a final verdict. ■
Ragnar Bengtsson is in the Division of Mathematical Physics, Lund Institute ofTechnology, Lund University, Box 118, SE-22100 Lund, Sweden. Peter Möller is in the Theoretical Division, Los Alamos National Laboratory, Los Alamos, New Mexico 87545-0001, USA. e-mail: [email protected]
1. Seweryniak, D. et al. Phys. Rev. Lett. 99, 022504 (2007).2. Mayer, M. G. & Jensen, J. H. D. Elementary Theory of
Nuclear Shell Structure (Wiley, New York, 1955).3. Seeger, P. A. & Howard, W. M. Atom. Data Nucl. Data Tables
17, 428–430 (1975).
Figure 1 | The microscopic nuclear landscape. This depiction of ‘microscopic corrections’ across the nuclide chart shows the nuclear binding energy of individual nuclides calculated in a modern model that combines a macroscopic approach (the liquid-drop model) with microscopic nuclear-shell models originally proposed by Goeppert-Mayer and Jensen2. To allow variations in the microscopic effects to be clearly visible — despite their importance to nuclear stability, they amount to a maximum of around 10 MeV relative to a total nuclear binding energy of up to 2,000 MeV in heavy systems — the binding energy given by the macroscopic model is not included. Great mountain peaks in the microscopic contributions manifest themselves at doubly magic proton and neutron numbers — among them 100Sn, the subject of Seweryniak and colleagues’ interest1.
EVOLUTIONARY BIOLOGY
Development with a bite P. David Polly
Predictions drawn from experiments on the growth of molar teeth in mice, and applied to a wide range of related species, provide a remarkable connection between developmental and evolutionary biology.
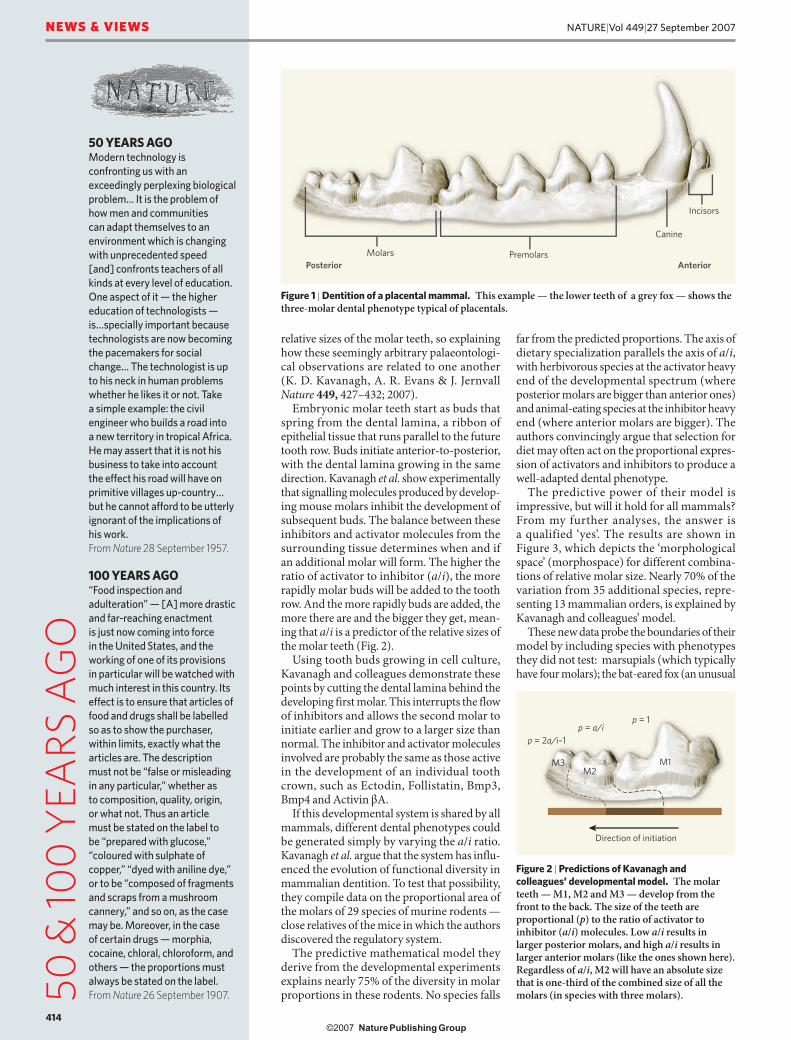
Palaeontologists know that mammals have lost and gained teeth in a regular evolutionary pattern: incisors from the back of the incisor series, premolars from the front of the pre-molar series, and molars from the back of the molar series (Fig. 1, overleaf). They also know that teeth in those series typically grade in size
in the same directions. And they know that it is rare that a species evolves more molars than the ancestral number of four in marsupial mammals or three in placental mammals. On page 427 of this issue, Kavanagh et al. describe a simple developmental cascade system that is eerily accurate in predicting the number and
413
NATURE|Vol 449|27 September 2007 NEWS & VIEWS
���������������� � � ������������������
AnteriorPosteriorPremolars
Canine
Incisors
Molars
Direction of initiation
M1M2
M3
p = 2a/i–1p = a/i
p = 1
50 &
100
YEA
RS A
GO
Figure 1 | Dentition of a placental mammal. This example — the lower teeth of a grey fox — shows the three-molar dental phenotype typical of placentals.
relative sizes of the molar teeth, so explaining how these seemingly arbitrary palaeontologi-cal observations are related to one another (K. D. Kavanagh, A. R. Evans & J. Jernvall Nature 449, 427–432; 2007).
Embryonic molar teeth start as buds that spring from the dental lamina, a ribbon of epithelial tissue that runs parallel to the future tooth row. Buds initiate anterior-to-posterior, with the dental lamina growing in the same direction. Kavanagh et al. show experimentally that signalling molecules produced by develop-ing mouse molars inhibit the development of subsequent buds. The balance between these inhibitors and activator molecules from the surrounding tissue determines when and if an additional molar will form. The higher the ratio of activator to inhibitor (a/i), the more rapidly molar buds will be added to the tooth row. And the more rapidly buds are added, the more there are and the bigger they get, mean-ing that a/i is a predictor of the relative sizes of the molar teeth (Fig. 2).
Using tooth buds growing in cell culture, Kavanagh and colleagues demonstrate these points by cutting the dental lamina behind the developing first molar. This interrupts the flow of inhibitors and allows the second molar to initiate earlier and grow to a larger size than normal. The inhibitor and activator molecules involved are probably the same as those active in the development of an individual tooth crown, such as Ectodin, Follistatin, Bmp3, Bmp4 and Activin βA.
If this developmental system is shared by all mammals, different dental phenotypes could be generated simply by varying the a/i ratio. Kavanagh et al. argue that the system has influ-enced the evolution of functional diversity in mammalian dentition. To test that possibility, they compile data on the proportional area of the molars of 29 species of murine rodents —close relatives of the mice in which the authors discovered the regulatory system.
The predictive mathematical model they derive from the developmental experiments explains nearly 75% of the diversity in molar proportions in these rodents. No species falls
far from the predicted proportions. The axis of dietary specialization parallels the axis of a/i, with herbivorous species at the activator heavy end of the developmental spectrum (where posterior molars are bigger than an terior ones) and animal-eating species at the inhibitor heavy end (where anterior molars are bigger). The authors convincingly argue that selection for diet may often act on the proportional expres-sion of activators and inhibitors to produce a well-adapted dental phenotype.
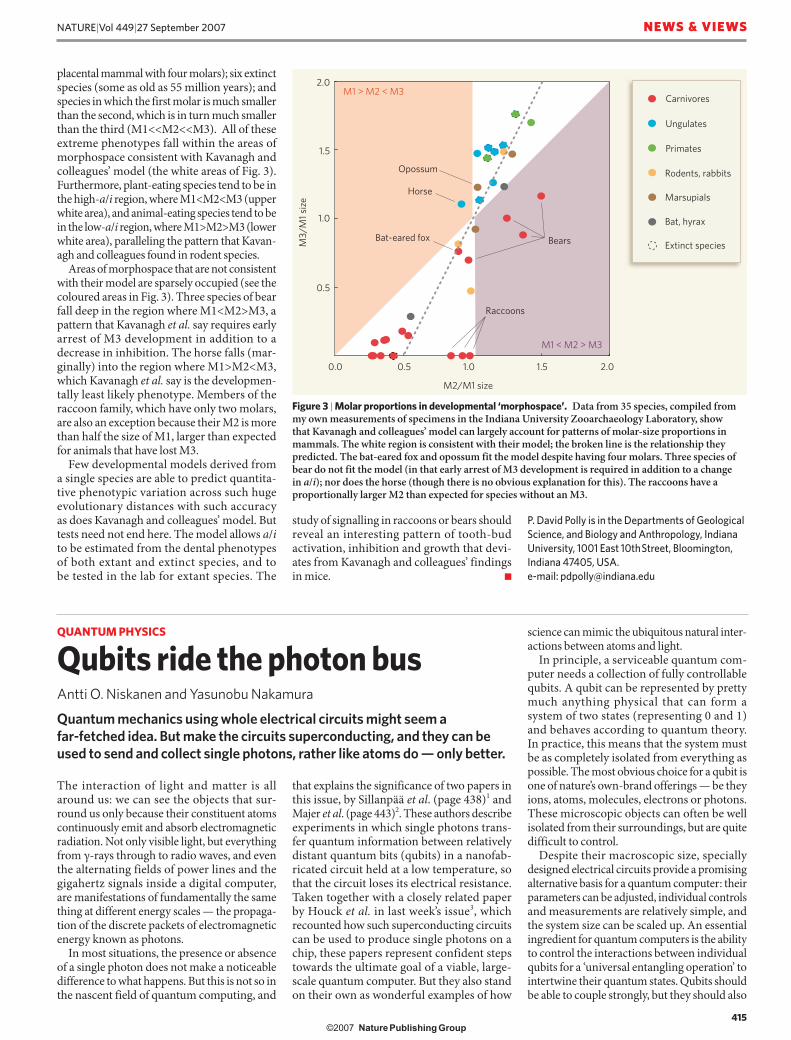
The predictive power of their model is impressive, but will it hold for all mammals? From my further analyses, the answer is a qualified ‘yes’. The results are shown in Figure 3, which depicts the ‘morphological space’ (morphospace) for different combina-tions of relative molar size. Nearly 70% of the variation from 35 additional species, repre-senting 13 mammalian orders, is explained by Kavanagh and colleagues’ model.
These new data probe the boundaries of their model by including species with phenotypes they did not test: marsupials (which typically have four molars); the bat-eared fox (an unusual
Figure 2 | Predictions of Kavanagh and colleagues’ developmental model. The molar teeth — M1, M2 and M3 — develop from the front to the back. The size of the teeth are proportional (p) to the ratio of activator to inhibitor (a/i) molecules. Low a/i results in larger posterior molars, and high a/i results in larger anterior molars (like the ones shown here). Regardless of a/i, M2 will have an absolute size that is one-third of the combined size of all the molars (in species with three molars).
50 YEARS AGOModern technology is confronting us with an exceedingly perplexing biological problem… It is the problem of how men and communities can adapt themselves to an environment which is changing with unprecedented speed [and] confronts teachers of all kinds at every level of education. One aspect of it — the higher education of technologists — is…specially important because technologists are now becoming the pacemakers for social change… The technologist is up to his neck in human problems whether he likes it or not. Take a simple example: the civil engineer who builds a road into a new territory in tropical Africa. He may assert that it is not his business to take into account the effect his road will have on primitive villages up-country…but he cannot afford to be utterly ignorant of the implications of his work. From Nature 28 September 1957.
100 YEARS AGO“Food inspection and adulteration” — [A] more drastic and far-reaching enactment is just now coming into force in the United States, and the working of one of its provisions in particular will be watched with much interest in this country. Its effect is to ensure that articles of food and drugs shall be labelled so as to show the purchaser, within limits, exactly what the articles are. The description must not be “false or misleading in any particular,” whether as to composition, quality, origin, or what not. Thus an article must be stated on the label to be “prepared with glucose,” “coloured with sulphate of copper,” “dyed with aniline dye,” or to be “composed of fragments and scraps from a mushroom cannery,” and so on, as the case may be. Moreover, in the case of certain drugs — morphia, cocaine, chloral, chloroform, and others — the proportions must always be stated on the label.From Nature 26 September 1907.
414
NATURE|Vol 449|27 September 2007NEWS & VIEWS
���������������� � � ������������������
M1 < M2 > M3
M1 > M2 < M3
1.0 1.5 2.0
1.0
2.0
0.0
Raccoons
Bears
Horse
Bat-eared fox
Opossum
Carnivores
Ungulates
Primates
Marsupials
Bat, hyrax
Extinct species
Rodents, rabbits
M2/M1 size
M3/
M1
size
1.5
0.5
0.5
placental mammal with four molars); six extinct species (some as old as 55 million years); and species in which the first molar is much smaller than the second, which is in turn much smaller than the third (M1<<M2<<M3). All of these extreme phenotypes fall within the areas of morphospace consistent with Kavanagh and colleagues’ model (the white areas of Fig. 3). Furthermore, plant-eating species tend to be in the high-a/i region, where M1<M2<M3 (upper white area), and animal-eating species tend to be in the low-a/i region, where M1>M2>M3 (lower white area), paralleling the pattern that Kavan-agh and colleagues found in rodent species.
Areas of morphospace that are not consistent with their model are sparsely occupied (see the coloured areas in Fig. 3). Three species of bear fall deep in the region where M1<M2>M3, a pattern that Kavanagh et al. say requires early arrest of M3 development in addition to a decrease in inhibition. The horse falls (mar-ginally) into the region where M1>M2<M3, which Kavanagh et al. say is the developmen-tally least likely phenotype. Members of the raccoon family, which have only two molars, are also an exception because their M2 is more than half the size of M1, larger than expected for animals that have lost M3.
Few developmental models derived from a single species are able to predict quantita-tive phenotypic variation across such huge evolutionary distances with such accuracy as does Kavanagh and colleagues’ model. But tests need not end here. The model allows a/i to be estimated from the dental phenotypes of both extant and extinct species, and to be tested in the lab for extant species. The
Figure 3 | Molar proportions in developmental ‘morphospace’. Data from 35 species, compiled from my own measurements of specimens in the Indiana University Zooarchaeology Laboratory, show that Kavanagh and colleagues’ model can largely account for patterns of molar-size proportions in mammals. The white region is consistent with their model; the broken line is the relationship they predicted. The bat-eared fox and opossum fit the model despite having four molars. Three species of bear do not fit the model (in that early arrest of M3 development is required in addition to a change in a/i); nor does the horse (though there is no obvious explanation for this). The raccoons have a proportionally larger M2 than expected for species without an M3.
study of signalling in raccoons or bears should reveal an interesting pattern of tooth-bud activation, inhibition and growth that devi-ates from Kavanagh and colleagues’ findings in mice. ■
P. David Polly is in the Departments of Geological Science, and Biology and Anthropology, Indiana University, 1001 East 10th Street, Bloomington, Indiana 47405, USA.e-mail: [email protected]
QUANTUM PHYSICS
Qubits ride the photon busAntti O. Niskanen and Yasunobu Nakamura
Quantum mechanics using whole electrical circuits might seem a far-fetched idea. But make the circuits superconducting, and they can be used to send and collect single photons, rather like atoms do — only better.
The interaction of light and matter is all around us: we can see the objects that sur-round us only because their constituent atoms continuously emit and absorb electromagnetic radiation. Not only visible light, but everything from γ-rays through to radio waves, and even the alternating fields of power lines and the gigahertz signals inside a digital computer, are manifestations of fundamentally the same thing at different energy scales — the propaga-tion of the discrete packets of electromagnetic energy known as photons.
In most situations, the presence or absence of a single photon does not make a noticeable difference to what happens. But this is not so in the nascent field of quantum computing, and
that explains the significance of two papers in this issue, by Sillanpää et al. (page 438)1 and Majer et al. (page 443)2. These authors describe experiments in which single photons trans-fer quantum information between relatively distant quantum bits (qubits) in a nanofab-ricated circuit held at a low temperature, so that the circuit loses its electrical resistance. Taken together with a closely related paper by Houck et al. in last week’s issue3, which recounted how such superconducting circuits can be used to produce single photons on a chip, these papers represent confident steps towards the ultimate goal of a viable, large-scale quantum computer. But they also stand on their own as wonderful examples of how
science can mimic the ubiquitous natural inter-actions between atoms and light.
In principle, a serviceable quantum com-puter needs a collection of fully controllable qubits. A qubit can be represented by pretty much anything physical that can form a system of two states (representing 0 and 1) and behaves according to quantum theory. In practice, this means that the system must be as completely isolated from everything as possible. The most obvious choice for a qubit is one of nature’s own-brand offerings — be they ions, atoms, molecules, electrons or photons. These microscopic objects can often be well isolated from their surroundings, but are quite difficult to control.
Despite their macroscopic size, specially designed electrical circuits provide a promising alternative basis for a quantum computer: their parameters can be adjusted, individual controls and measurements are relatively simple, and the system size can be scaled up. An essential ingredient for quantum computers is the ability to control the interactions between individual qubits for a ‘universal entangling operation’ to intertwine their quantum states. Qubits should be able to couple strongly, but they should also
415
NATURE|Vol 449|27 September 2007 NEWS & VIEWS
���������������� � � ������������������