Embed Size (px)
Citation preview
Mon. Not. R. Astron. Soc. 419, 452–464 (2012) doi:10.1111/j.1365-2966.2011.19711.x
Evolutionary models for double helium white dwarf mergersand the formation of helium-rich hot subdwarfs
Xianfei Zhang1� and C. Simon Jeffery1,2�1Armagh Observatory, College Hill, Armagh BT61 9DG2School of Physics, Trinity College Dublin, Dublin 2, Ireland
Accepted 2011 August 26. Received 2011 August 26; in original form 2011 July 24
ABSTRACTRecent surveys have demonstrated the existence of several short-period binary systems contain-ing two white dwarfs. Following orbital decay by gravitational-wave radiation, such binariesare expected to merge at a rate of two or three per thousand years per galaxy. The conse-quences of such a merger depend on the individual white dwarf masses, but are believed toinclude helium-rich subdwarfs, R CrB stars, extreme helium stars and also AM CVn systemsand possibly Type Ia supernovae.
Whilst the hydrodynamics of the merger process remains difficult to compute, it is possibleto compute the evolution of a double white dwarf merger following the destruction of onecomponent. In this paper, we describe the evolution following the merger of two helium whitedwarfs. We examine three sets of assumptions concerning the distribution of debris materialbetween a disc and a corona.
Our results demonstrate that a model comprising both fast accretion to form a (hot) coronaand slow accretion from a (cold) debris disc can reproduce the observed distribution ofhelium-rich subdwarfs in terms of their surface temperatures, gravities, nitrogen and carbonabundances.
Key words: stars: abundances – binaries: close – stars: evolution – stars: peculiar – subdwarfs– white dwarfs.
1 IN T RO D U C T I O N
It is generally accepted that about 99 per cent of stars end theirlives as white dwarfs (WDs). The majority of these are heliumwhite dwarfs with mass in the range 0.17–0.45 M�. Most heliumwhite dwarfs are the result of binary star evolution; such stars losealmost all their outer envelopes without reaching the asymptotic gi-ant branch or without ever igniting helium, and then cool to becomea white dwarf. Without this channel, an isolated star with low masswould take more than a Hubble time to evolve into a white dwarfconfiguration. Rebassa-Mansergas et al. (2011) and Brown et al.(2011) demonstrate that a large number of low-mass white dwarfsare found in binary systems, which supports binary interaction asthe dominant channel for the formation of low-mass white dwarfs atthe current epoch. According to this mechanism, a significant num-ber of binaries containing two helium white dwarfs are expected toexist in the Galaxy. In a survey of extremely low-mass white dwarfs,12 very short-period white dwarf binary systems have been found,of which three will merge due to gravitational wave radiation in lessthan 500 Myr (Kilic et al. 2010, 2011). The most likely products
�E-mail: [email protected]; [email protected]
of the merger of a binary comprising two helium white dwarfs areextremely helium-rich stars and helium-rich hot subdwarfs (Saio &Jeffery 2000; Han et al. 2002, 2003). A few tens of helium-rich hotsubdwarfs have been found in the Galaxy, of which several havebeen analysed for abundances (Stroeer et al. 2007; Naslim et al.2010). These are important candidates for understanding heliumwhite dwarf (HeWD) mergers.
Hot subdwarfs are traditionally classified into three types bytheir spectra (Drilling et al. 2003): subdwarf B (sdB), with a surfaceeffective temperature Teff in the range 20 000–40 000 K and H-Balmer absorption lines wider than in normal B stars; subdwarfO (sdO), with Teff ranging from 40 000–80 000 K with strong Heabsorption lines; and subdwarf OB (sdOB), a transition between Oand B (Moehler et al. 1990; Heber 2009). These objects are locatedbelow the upper main sequence on a Hertzsprung–Russell (HR)diagram, and are also known as extreme horizontal branch stars.This is based on the understanding that they are core He-burningstars with extremely thin hydrogen envelopes (<0.02 M�). Most,but not all, sdB stars have He II lines that are very weak for theircolour. Spectroscopically they form a relatively homogeneous class,whereas a larger variety of spectra is observed amongst sdO stars(Moehler et al. 1990), which display He II, 4686-Å and sometimesother He II lines, and in which Balmer lines may occasionally be
C© 2011 The AuthorsMonthly Notices of the Royal Astronomical Society C© 2011 RAS

Double helium white dwarf mergers 453
absent. They are frequently subdivided according to the dominantspectral features into H-strong (sdO) and He-strong-lined (He-sdO).In contrast, helium-rich sdB (He-sdB) stars are rare. The class sdOBdescribing sdB-like spectra with weak He II is now often subsumedunder the sdB class. In addition, the spectra of He-sdB and He-sdOstars can be grouped into carbon-strong-lined and nitrogen-strong-lined (Jeffery et al. 1997; Drilling et al. 2003; Stroeer et al. 2007).
Although the sdB stars are nearly naked helium stars, the ma-jority retain a thin veneer of hydrogen (≈0.02 M�). With radiativeenvelopes and high surface gravity, whatever helium there is sinksbelow the surface and makes the majority appear to be quite defi-cient in helium. Diffusion theory, which includes radiative forcesacting on ions, explains this well (Heber et al. 1986). The exis-tence within the PG and other surveys of a fraction (10 per cent:Green, Schmidt & Liebert 1986) of ‘helium-rich’ sdB and sdO starstherefore poses a major challenge. Han et al. (2002, 2003) and Han(2008) have argued that HeWD mergers can explain the formationof apparently single sdB stars, but did not distinguish between theformation of H-rich and He-rich subdwarfs. Formation channels thatmight produce clearly helium-rich subdwarfs include HeWD merg-ers, as computed by Saio & Jeffery (2000), late core-helium ignitionin a post-giant helium star (the ‘hot flasher’: Moehler et al. (2007);Miller Bertolami et al. (2008)) and the merger of a post-sdB star (acomposite CO/He white dwarf) with a helium white dwarf (Justham,Podsiadlowski & Han 2011). One unexplained piece of evidence isthe observation that He-rich hot subdwarfs may be divided intotwo groups according to whether their surfaces are nitrogen-rich orcarbon-rich (Jeffery et al. 1997; Stroeer et al. 2007). Nitrogen-richsubdwarfs are simply explained by CNO-process hydrogen burning;all original carbon and oxygen is converted to nitrogen at the sametime as the dominant helium is produced (Saio & Jeffery 2000).Carbon-rich subdwarfs are harder to explain since 3α-processedmaterial must be exposed at the surface, possibly by dredge-up af-ter helium ignition but before the star becomes a hot subdwarf. Ajudicious choice of mixing physics has yielded carbon-rich surfacesin some of the above models, but it is not yet clear whether it ispossible to explain both carbon- and nitrogen-rich groups withinthe same model, or under what conditions flash- and opacity-drivenconvection can combine to bring carbon to the surface.
In this paper, we set up three possible merger models for helium +helium white dwarf binaries. We calculate the evolution followingthat merger and compare the results with recent observational datafor helium-rich subdwarfs.
2 A BRIEF V IEW O F THE MERGER PRO CESS
There are two key requirements for a close binary white dwarf tomerge and form a single star. The first principle is gravitational ra-diation. Due to gravitational radiation, a double white dwarf systemloses orbital angular momentum Jorb and causes the binary sepa-ration a to decay until the larger star fills its Roche lobe. The rateof loss of orbital angular momentum (Landau & Lifshitz 1962) isexpressed as
JorbJorb
= −8.3 × 10⁻¹⁰ ×(
m1M�
) (m2
M�) (
m1+m2M�
)
×(
aR�
)−4
yr−1, (1)
where m1 and m2 are the masses of stars in the binary.The second requirement is the mass ratio q. If
q ≡ m1/m2 ≥ qcrit ≡ 5
6+ ζ (m2)
2, (2)
Figure 1. Schematic of three possible ways in which two helium whitedwarfs might merge.
where ζ (m2) ≡ d ln r/d ln m is obtained from the white dwarf mass–radius relation, the radius of the larger (less massive) white dwarfwill increase more quickly than the separation due to the transferof angular momentum, leading to unstable (runaway) mass transferon a dynamical time-scale (a few seconds). If q ≤ qcrit, stable masstransfer will occur, possibly leading to the formation of an AM CVnbinary: an ultrashort binary system containing two helium whitedwarfs.
Hydrodynamical simulations of the merger of two low-masswhite dwarfs suggest that a number of phases occur. Followingthe complete tidal disruption of the lower mass component (sec-ondary), its material may be redistributed around the more massivecomponent (primary) in (a) a cold Keplerian debris disc and (b) ahot spherical corona. From a schematic point of view, there are threepossible ways to combine these processes, which we shall call theslow (or cold) merger, the fast (or hot) merger and the composite(fast + slow) merger model (Fig. 1).
A disc allows cold mass to migrate towards its centre, from whereit can be accreted slowly on to the primary surface, while angularmomentum is dissipated towards the disc circumference (Lynden-Bell & Pringle 1974). The slow merger model assumes that thesecondary transfers its entire mass to form a disc around the primarywithin a few minutes, after which mass accretes from the disc to theprimary at a rate comparable to the Eddington accretion rate. Thisprocess could last for several million years (Tutukov & Yungelson1979; Iben & Tutukov 1984; Nomoto & Iben 1985; Mochkovitch& Livio 1989, 1990; Saio & Nomoto 1998; Saio & Jeffery 2000,2002).
The fast merger model assumes that the less massive white dwarfquickly transfers its entire mass to the companion surface directly,where heating to 108 K makes the material expand to form a hotcorona within a few minutes (Benz et al. 1990; Guerrero, Garcıa-Berro & Isern 2004).
The composite merger model includes both processes, in whichabout 30 ∼ 50 percent of the mass of the secondary forms a hotcorona around the survivor, while the rest of the destroyed whitedwarf forms a Keplerian disc (Yoon, Podsiadlowski & Rosswog2007; Loren-Aguilar, Isern & Garcıa-Berro 2009).
In both the slow and fast + slow modes, the accretion rate fromthe Keplerian disc has been assumed to be about half the Eddington
C© 2011 The Authors, MNRAS 419, 452–464Monthly Notices of the Royal Astronomical Society C© 2011 RAS
454 X. Zhang and C. S. Jeffery
rate, i.e. 10−5 M� yr−1, although higher rates could be realized inpractice.
3 M E T H O D S
To calculate the evolution of the WD model stars as well as thefurther evolution of the collision product, we use the stellar evolu-tion code Modules for Experiments in Stellar Astrophysics (MESA:Paxton et al. 2011). By using adaptive mesh refinement and sophis-ticated time-step controls, MESA solves the fully coupled structureand composition equations simultaneously. We set the ratio of mix-ing length to local pressure scale height, α = l/Hp, to 2.0. Theopacity tables for various metallicities are compiled by Iglesias &Rogers (1996) and Alexander & Ferguson (1994).
As Nelemans et al. (2000) shows, the most common helium whitedwarf binaries descend from systems in which both stars have M ≤2.3 M�. However, for our experiments, it is difficult to control thefinal mass of the helium white dwarf we require from a full binary-star evolution calculation. Thus, an artificial method is adopted.We start with a zero-age main-sequence star of mass 2.0 M� andevolve it until the helium core reaches the required mass. Then allthe envelope is removed by hand to produce a naked helium core,essentially a pre-WD model. These models cannot ignite centrehelium burning and evolve straight to the white dwarf sequence,ending up with a luminosity of log L/L� = −2.
Starting with this helium white dwarf model, material is accretedat the surface until the desired mass is achieved. The thermal struc-ture of the outer layers is governed by the accretion rate. Nucleosyn-thesis is included in the calculation. Once steady helium burningis established, evolution is followed until the star has evolved tobecome a white dwarf.
4 N U M E R I C A L E X P E R I M E N T S
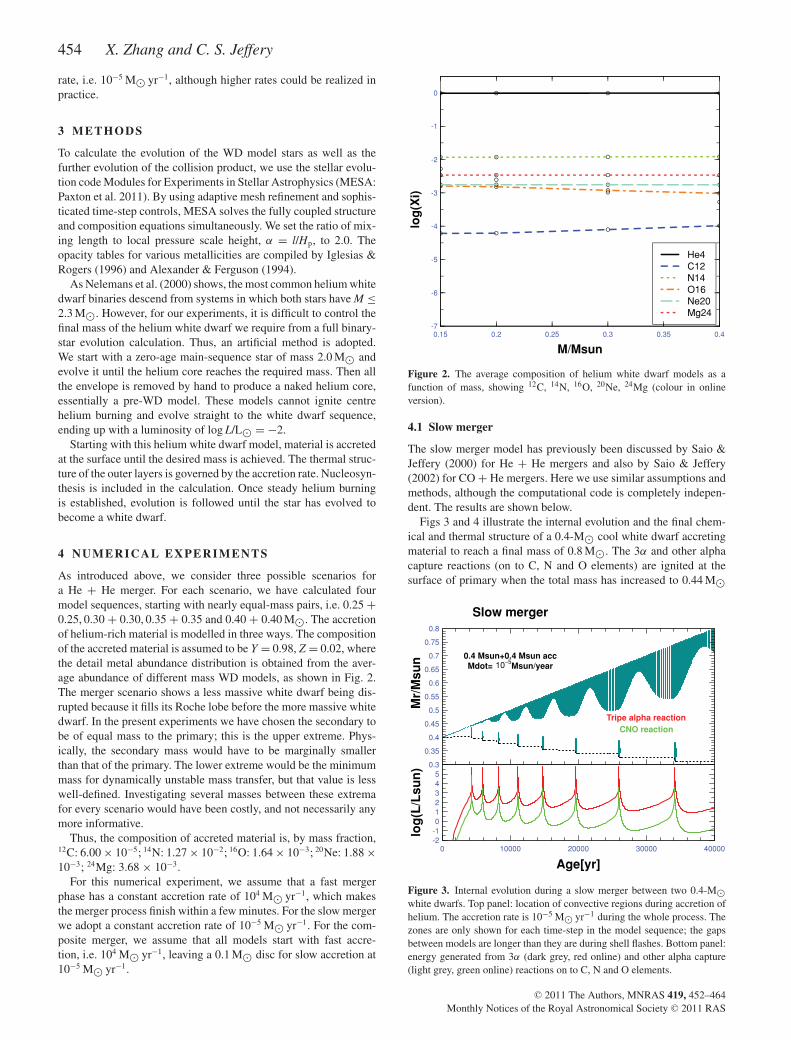
As introduced above, we consider three possible scenarios fora He + He merger. For each scenario, we have calculated fourmodel sequences, starting with nearly equal-mass pairs, i.e. 0.25 +0.25, 0.30 + 0.30, 0.35 + 0.35 and 0.40 + 0.40 M�. The accretionof helium-rich material is modelled in three ways. The compositionof the accreted material is assumed to be Y = 0.98, Z = 0.02, wherethe detail metal abundance distribution is obtained from the aver-age abundance of different mass WD models, as shown in Fig. 2.The merger scenario shows a less massive white dwarf being dis-rupted because it fills its Roche lobe before the more massive whitedwarf. In the present experiments we have chosen the secondary tobe of equal mass to the primary; this is the upper extreme. Phys-ically, the secondary mass would have to be marginally smallerthan that of the primary. The lower extreme would be the minimummass for dynamically unstable mass transfer, but that value is lesswell-defined. Investigating several masses between these extremafor every scenario would have been costly, and not necessarily anymore informative.
Thus, the composition of accreted material is, by mass fraction,12C: 6.00 × 10⁻⁵; 14N: 1.27 × 10⁻²; 16O: 1.64 × 10⁻³; 20Ne: 1.88 ×10⁻³; 24Mg: 3.68 × 10⁻³.
For this numerical experiment, we assume that a fast mergerphase has a constant accretion rate of 104 M� yr−1, which makesthe merger process finish within a few minutes. For the slow mergerwe adopt a constant accretion rate of 10−5 M� yr−1. For the com-posite merger, we assume that all models start with fast accre-tion, i.e. 104 M� yr−1, leaving a 0.1 M� disc for slow accretion at10−5 M� yr−1.
He4C12N14O16Ne20Mg24
0.15 0.2 0.25 0.3 0.35 0.4
M/Msun
-7
-6
-5
-4
-3
-2
-1
0
log
(Xi)
Figure 2. The average composition of helium white dwarf models as afunction of mass, showing 12C, 14N, 16O, 20Ne, 24Mg (colour in onlineversion).
4.1 Slow merger
The slow merger model has previously been discussed by Saio &Jeffery (2000) for He + He mergers and also by Saio & Jeffery(2002) for CO + He mergers. Here we use similar assumptions andmethods, although the computational code is completely indepen-dent. The results are shown below.
Figs 3 and 4 illustrate the internal evolution and the final chem-ical and thermal structure of a 0.4-M� cool white dwarf accretingmaterial to reach a final mass of 0.8 M�. The 3α and other alphacapture reactions (on to C, N and O elements) are ignited at thesurface of primary when the total mass has increased to 0.44 M�
0.3
0.35
0.4
0.45
0.5
0.55
0.6
0.65
0.7
0.75
0.8
Mr/
Msu
n 0.4 Msun+0.4 Msun accMdot= Msun/year10 5
Slow merger
Tripe alpha reactionCNO reaction
0 10000 20000 30000 40000
Age[yr]
-2-1012345
log
(L/L
sun
)
Figure 3. Internal evolution during a slow merger between two 0.4-M�white dwarfs. Top panel: location of convective regions during accretion ofhelium. The accretion rate is 10−5 M� yr−1 during the whole process. Thezones are only shown for each time-step in the model sequence; the gapsbetween models are longer than they are during shell flashes. Bottom panel:energy generated from 3α (dark grey, red online) and other alpha capture(light grey, green online) reactions on to C, N and O elements.
C© 2011 The Authors, MNRAS 419, 452–464Monthly Notices of the Royal Astronomical Society C© 2011 RAS
Double helium white dwarf mergers 455
-8
-7
-6
-5
-4
-3
-2
-1
00.4 Msun + 0.4 Msun post-merger
Mdot= Msun/year10 5
Slow mergerlo
g(X
i)
initial WDpost-merger
0 0.1 0.2 0.3 0.4 0.5 0.6 0.7 0.8
M/Msun
0
0.5
1
T/
K
108
He4C12C13N14O16O18Ne22
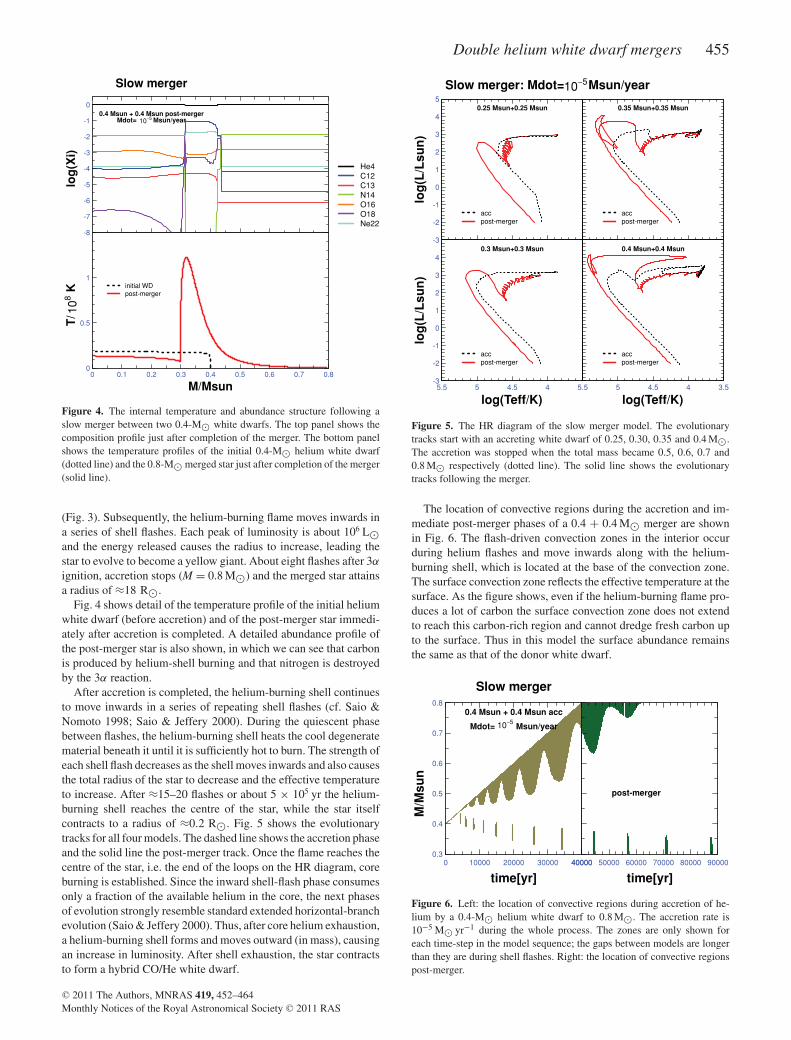
Figure 4. The internal temperature and abundance structure following aslow merger between two 0.4-M� white dwarfs. The top panel shows thecomposition profile just after completion of the merger. The bottom panelshows the temperature profiles of the initial 0.4-M� helium white dwarf(dotted line) and the 0.8-M� merged star just after completion of the merger(solid line).
(Fig. 3). Subsequently, the helium-burning flame moves inwards ina series of shell flashes. Each peak of luminosity is about 106 L�and the energy released causes the radius to increase, leading thestar to evolve to become a yellow giant. About eight flashes after 3α
ignition, accretion stops (M = 0.8 M�) and the merged star attainsa radius of ≈18 R�.
Fig. 4 shows detail of the temperature profile of the initial heliumwhite dwarf (before accretion) and of the post-merger star immedi-ately after accretion is completed. A detailed abundance profile ofthe post-merger star is also shown, in which we can see that carbonis produced by helium-shell burning and that nitrogen is destroyedby the 3α reaction.
After accretion is completed, the helium-burning shell continuesto move inwards in a series of repeating shell flashes (cf. Saio &Nomoto 1998; Saio & Jeffery 2000). During the quiescent phasebetween flashes, the helium-burning shell heats the cool degeneratematerial beneath it until it is sufficiently hot to burn. The strength ofeach shell flash decreases as the shell moves inwards and also causesthe total radius of the star to decrease and the effective temperatureto increase. After ≈15–20 flashes or about 5 × 10⁵ yr the helium-burning shell reaches the centre of the star, while the star itselfcontracts to a radius of ≈0.2 R�. Fig. 5 shows the evolutionarytracks for all four models. The dashed line shows the accretion phaseand the solid line the post-merger track. Once the flame reaches thecentre of the star, i.e. the end of the loops on the HR diagram, coreburning is established. Since the inward shell-flash phase consumesonly a fraction of the available helium in the core, the next phasesof evolution strongly resemble standard extended horizontal-branchevolution (Saio & Jeffery 2000). Thus, after core helium exhaustion,a helium-burning shell forms and moves outward (in mass), causingan increase in luminosity. After shell exhaustion, the star contractsto form a hybrid CO/He white dwarf.
-3
-2
-1
0
1
2
3
4
5
log
(L/L
sun
)
0.25 Msun+0.25 Msun
Slow merger: Mdot= Msun/year10 5
accpost-merger
5.5 5 4.5 4
log(Teff/K)
-3
-2
-1
0
1
2
3
4
log
(L/L
sun
)
0.3 Msun+0.3 Msun
accpost-merger
0.35 Msun+0.35 Msun
accpost-merger
5.5 5 4.5 4 3.5
log(Teff/K)
0.4 Msun+0.4 Msun
accpost-merger
Figure 5. The HR diagram of the slow merger model. The evolutionarytracks start with an accreting white dwarf of 0.25, 0.30, 0.35 and 0.4 M�.The accretion was stopped when the total mass became 0.5, 0.6, 0.7 and0.8 M� respectively (dotted line). The solid line shows the evolutionarytracks following the merger.
The location of convective regions during the accretion and im-mediate post-merger phases of a 0.4 + 0.4 M� merger are shownin Fig. 6. The flash-driven convection zones in the interior occurduring helium flashes and move inwards along with the helium-burning shell, which is located at the base of the convection zone.The surface convection zone reflects the effective temperature at thesurface. As the figure shows, even if the helium-burning flame pro-duces a lot of carbon the surface convection zone does not extendto reach this carbon-rich region and cannot dredge fresh carbon upto the surface. Thus in this model the surface abundance remainsthe same as that of the donor white dwarf.
0 10000 20000 30000 40000
time[yr]
0.3
0.4
0.5
0.6
0.7
0.8
M/M
sun
0.4 Msun + 0.4 Msun acc
Mdot= Msun/year10 5
Slow merger
40000 50000 60000 70000 80000 90000
time[yr]
post-merger
Figure 6. Left: the location of convective regions during accretion of he-lium by a 0.4-M� helium white dwarf to 0.8 M�. The accretion rate is10−5 M� yr−1 during the whole process. The zones are only shown foreach time-step in the model sequence; the gaps between models are longerthan they are during shell flashes. Right: the location of convective regionspost-merger.
C© 2011 The Authors, MNRAS 419, 452–464Monthly Notices of the Royal Astronomical Society C© 2011 RAS

456 X. Zhang and C. S. Jeffery
Pairs with lower masses shows a similar behaviour. However,less massive stars undergo fewer shell flashes, which take moretime to reach the centre of the star. For all slow merger models, theabundance at the surface is as the same as that of the secondarywhite dwarf.
4.2 Fast merger
For the fast merger model, we arbitrarily assumed an accretionrate of 104 M� yr−1 so that it takes only a few minutes for thematerial to be accreted. In a real merger this would be a violentand highly turbulent process, with considerable associated heating.We have here made the assumption of quasi-hydrostatic equilibriumthroughout the fast accretion phase, so there is no dynamical heatingof the accreted material. Instead we rely on the much more dominantnuclear heating to determine the post-accretion structure. Fig. 7shows various properties as a 0.4-M� cool white dwarf accretesmass to reach a final mass of 0.8 M�. The 3α and other alphacapture reactions are ignited at the surface of the primary almostimmediately. Because of the high accretion rate, nuclear ignition isdifferent from the slow merger case; there is no runaway heliumflash and burning is stable. Most of the energy released during thisprocess goes into heating the corona, which expands to ∼0.07 R�.
Fig. 8 shows more details of the temperature profile of the initialhelium white dwarf before accretion and of the post-merger starat the end of the accretion process. After the merger, the helium-burning shell reaches a peak temperature of about 4 × 10⁸ K. Adetailed abundance profile of the post-merger star is also shown inFig. 8, where it can be seen that (a) carbon is produced by heliumburning and partially mixed outward and (b) nitrogen is destroyed bythe alpha capture. An interesting thing is that at such a high temper-ature the destruction of 14N by the 14N(α, γ )18O reaction becomesmore efficient than it is at low temperature, as Warner (1967) andClayton et al. (2007) indicated. This reaction very quickly makes18O the most abundant of the CNO isotopes. This situation lasts un-til 18O begins α-capturing as the temperature continues to increase,
0.3
0.35
0.4
0.45
0.5
0.55
0.6
0.65
0.7
0.75
0.8
Mr/
Msu
n 0.4 Msun+0.4 Msun accMdot= Msun/year104
Fast merger
0 1e-05 2e-05 3e-05 4e-05
Age[yr]
-202468
10
log
(L/L
sun
)
Tripe alpha reactionCNO reaction
Figure 7. Convection zones and energy released during a fast merger. Toppanel: the location of convective regions during accretion of helium by a0.4-M� helium white dwarf. The accretion rate is 104 M� yr−1 during thewhole process. The zones are only shown for each time-step in the modelsequence. Bottom panel: the energy generated from 3α and other alphacapture (green) reactions on to C, N and O elements.
-8
-7
-6
-5
-4
-3
-2
-1
0
log
(Xi)
0.4 Msun + 0.4 Msun post-mergerMdot= Msun/year104
Fast merger
initial WDpost-merger
0 0.1 0.2 0.3 0.4 0.5 0.6 0.7 0.8
M/Msun
0
1
2
3
T/
K
108
He4C12C13N14O16O18Ne22
Figure 8. The temperature and abundance profile during a fast merger. Toppanel: the abundance profile at the time just before the end of the merger, i.e.as an accreting 0.4-M� helium white dwarf reaches 0.8 M�. Bottom panel:the temperature profile of the initial 0.4-M� helium white dwarf (dotted)and the completed 0.8-M� merger (solid).
which produces 22Ne. Thus, the abundance of 18O is very sensitiveto the physical conditions, i.e. temperature, density and composi-tion. Obviously, if the high temperature persists for a long period,22Ne will be the most abundant of the CNO isotopes. In the fastmerger, the convection speed is around 7 cm s−1, giving a convec-tive turnover time of ≈20 yr, which is sufficiently short comparedwith the evolution time following the merger. As Fig. 9 shows, thewhole envelope is fully convective at the end of the merging pro-cess and thus the hot corona is completely mixed and shows a highsurface abundance of 12C, 18O and 22Ne.
After the merger, the increasing nuclear luminosity forces thestar to expand; the radius becomes about 50 R� within 104 yr (see
0 1e-05 2e-05 3e-05 4e-05
time[yr]
0.3
0.4
0.5
0.6
0.7
0.8
M/M
sun
0.4 Msun + 0.4 Msun acc
Mdot= Msun/year104
Fast merger
5000 10000
time[yr]
post-merger
Figure 9. Left: the location of convective regions during accretion of he-lium by a 0.4-M� helium white dwarf to 0.8 M�. The accretion rate is104 M� yr−1 during the whole process. The zone are only shown for eachtime-step in the model sequence; the gaps between models are longer thanthey are during shell flashes. Right: the location of convective regions post-merger.
C© 2011 The Authors, MNRAS 419, 452–464Monthly Notices of the Royal Astronomical Society C© 2011 RAS

Double helium white dwarf mergers 457
-3
-2
-1
0
1
2
3
4
5
log
(L/L
sun
)
0.25 Msun+0.25 Msun
Fast merger: Mdot= Msun/year104
accpost-merger
5.5 5 4.5 4
log
(L/L
sun
)
-3
-2
-1
0
1
2
3
4
log(Teff/K)
0.3 Msun+0.3 Msun
accpost-merger
0.35 Msun+0.35 Msun
accpost-merger
5.5 5 4.5 4 3.5
log(Teff/K)
0.4 Msun+0.4 Msun
accpost-merger
Figure 10. Evolution tracks for fast merger models. The tracks show theinitial models for white dwarfs with inital masses 0.25, 0.30, 0.35 and0.4 M� accreting to reach final masses 0.5, 0.6, 0.7 and 0.8 M� respectively(dotted line). The solid lines show how the evolution following the mergeris completed.
Fig. 10). Subsequently, the helium-burning shell moves inwardswith a series of flashes. After ≈20 flashes, or about 7 × 10⁵ yr, thehelium-burning flame reaches the centre of the star. At the sametime, the overall radius of the star is reduced to ≈0.2 R� and theeffective temperature increases gradually. Once the flame reachesthe centre of the star, i.e. at the end of the loops on the L–Teff
diagram, central helium-core burning is established. The followingevolution behaves exactly as a helium star would (Saio & Jeffery2000), as well as the slow merger models shown above. After corehelium exhaustion a helium-burning shell develops, leading to aperiod of expansion and higher luminosity followed by contractionto the white dwarf cooling branch.
For the 0.25 + 0.25 M� model, the stored thermal energy is notenough to force expansion to the giant branch; maximum expansiononly reaches a temperature and luminosity similar to that of a bluehorizontal branch star. Higher mass pairs, i.e. 0.3 + 0.3 M� and0.35 + 0.35 M�, behave similarly to the 0.4 + 0.4 M� modelsshown. However, these stars undergo fewer shell-flash cycles andit takes more time for inward-burning flashes to reach the centre ofstar. For all of the fast merger models the surface composition isrich in 12C, 18O and 22Ne, but there is almost no 14N.
4.3 Composite merger
The composite merger model considers two processes. First, morethan half the mass of the secondary is rapidly accreted by the primaryto form a hot corona, as in the fast merger model. Secondly, theremaining material from the secondary is accreted on to the hotcorona, as in the slow merger model.
During fast accretion, the star expands as in the fast merger. Dur-ing slow accretion, the inward-burning shell flashes cause the star toexecute blue loops in the L–Teff diagram, but continuing accretion
-8
-7
-6
-5
-4
-3
-2
-1
0
log
(Xi)
0.4 Msun + 0.4 Msun post-merger
Composite merger
initial WDfast-mergerpost-merger
0 0.1 0.2 0.3 0.4 0.5 0.6 0.7 0.8
M/Msun
0
1
2
3
T/
K
108
He4C12C13N14O16O18Ne22
Figure 11. The temperature and abundance profile during a compositemerger. Top panel: the abundance profile just after completion of the merger,i.e. for a 0.4-M� helium white dwarf accreting helium to become a 0.8-M�star. Bottom panel: the temperature profile of the initial 0.4-M� heliumwhite dwarf (dotted line), the hot coronal object at the end of the fast mergerphase (dashed) and the final 0.8-M� merged star (solid).
maintains the star as a cool giant. After slow accretion terminates,the nuclear burning temperature is reduced and the temperature pro-file starts to resemble that in the slow merger model. Subsequently,the helium-burning flame propagates inwards as in both the slowand fast merger models.
Taking the 0.4 + 0.4 M� model as an example (Fig. 11), the firstfast-accretion stage takes around 16 min to form a hot corona witha radius 0.06 R� (recall that the radius of a 0.4-M� white dwarf isapproximately 0.01 R�). During the stable helium-burning phase,almost complete envelope convection brings material rich in 12C,18O and 22Ne ashes close to the surface (Fig. 13).
During the second slow-accretion phase the helium-burning shellstill heats the corona, forcing it to continue expanding. At the be-ginning of this process the corona/envelope is fully convective andthe helium-burning makes the corona rich in 12C, 18O and 22Ne.The surface abundances 12C, 18O, 22Ne and 14N subsequently de-velop a dynamic balance because of (i) the nitrogen-rich materialscontinually being accreted into the corona from the disc and (ii) theconversion of 18O to 22Ne through α-capture because temperaturesare still high. During this process, helium-flash cycles commence.The strength of each flash peak increases gradually. As the heliumflame moves inwards, the star initially expands to ≈32 R� within4 × 103 yr and then contracts away from the giant branch duringthe remainder of the slow-accretion phase (Fig. 12).
In subsequent evolution the 0.8-M� composite model behavessimilarly to the slow merger models, as shown in Fig. 13. Thus,there follow about 20 helium flashes in 6 × 10⁵ yr, each subsequentflash decreasing in intensity until the flame reaches the centre ofthe star, i.e. the end of the loops on the HR diagram. After this,a standard core-helium-burning phase is established, followed bya normal helium-shell-burning phase, leading to higher luminosityand finally cooling to the white dwarf sequence.
C© 2011 The Authors, MNRAS 419, 452–464Monthly Notices of the Royal Astronomical Society C© 2011 RAS
458 X. Zhang and C. S. Jeffery
-3
-2
-1
0
1
2
3
4
5
log
(L/L
sun
)
0.25 Msun+0.25 Msun
Composite merger
fast-accslow-accpost-merger
5.5 5 4.5 4
log(Teff/K)
-3
-2
-1
0
1
2
3
4
log
(L/L
sun
)
0.3 Msun+0.3 Msun
fast-accslow-accpost-merger
0.35 Msun+0.35 Msun
fast-accslow-accpost-merger
5.5 5 4.5 4 3.5
log(Teff/K)
0.4 Msun+0.4 Msun
fast-accslow-accpost-merger
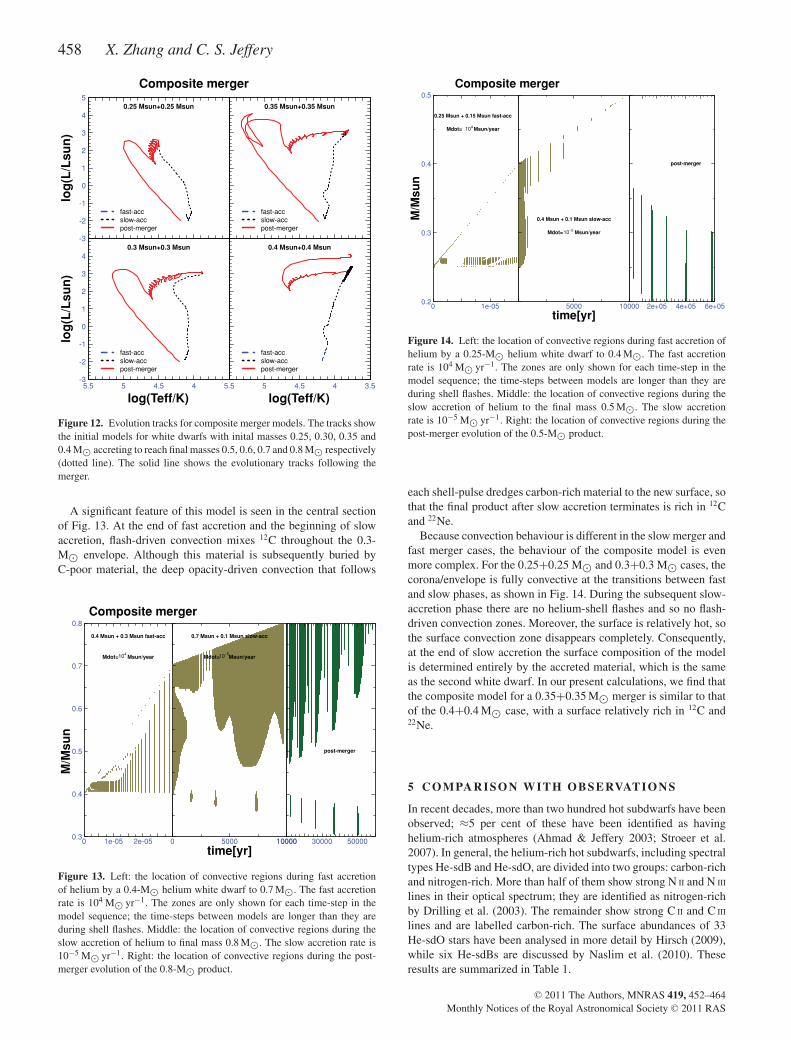
Figure 12. Evolution tracks for composite merger models. The tracks showthe initial models for white dwarfs with inital masses 0.25, 0.30, 0.35 and0.4 M� accreting to reach final masses 0.5, 0.6, 0.7 and 0.8 M� respectively(dotted line). The solid line shows the evolutionary tracks following themerger.
A significant feature of this model is seen in the central sectionof Fig. 13. At the end of fast accretion and the beginning of slowaccretion, flash-driven convection mixes 12C throughout the 0.3-M� envelope. Although this material is subsequently buried byC-poor material, the deep opacity-driven convection that follows
0 1e-05 2e-050.3
0.4
0.5
0.6
0.7
0.8
M/M
sun
0.4 Msun + 0.3 Msun fast-acc
Mdot= Msun/year104
Composite merger
0 5000 10000
time[yr]
0.7 Msun + 0.1 Msun slow-acc
Mdot= Msun/year10 5
10000 30000 50000
post-merger
Figure 13. Left: the location of convective regions during fast accretionof helium by a 0.4-M� helium white dwarf to 0.7 M�. The fast accretionrate is 104 M� yr−1. The zones are only shown for each time-step in themodel sequence; the time-steps between models are longer than they areduring shell flashes. Middle: the location of convective regions during theslow accretion of helium to final mass 0.8 M�. The slow accretion rate is10−5 M� yr−1. Right: the location of convective regions during the post-merger evolution of the 0.8-M� product.
0 1e-050.2
0.3
0.4
0.5
M/M
sun
0.25 Msun + 0.15 Msun fast-acc
Mdot= Msun/year104
Composite merger
5000 10000
time[yr]
0.4 Msun + 0.1 Msun slow-acc
Mdot= Msun/year10 5
2e+05 4e+05 6e+05
post-merger
Figure 14. Left: the location of convective regions during fast accretion ofhelium by a 0.25-M� helium white dwarf to 0.4 M�. The fast accretionrate is 104 M� yr−1. The zones are only shown for each time-step in themodel sequence; the time-steps between models are longer than they areduring shell flashes. Middle: the location of convective regions during theslow accretion of helium to the final mass 0.5 M�. The slow accretionrate is 10−5 M� yr−1. Right: the location of convective regions during thepost-merger evolution of the 0.5-M� product.
each shell-pulse dredges carbon-rich material to the new surface, sothat the final product after slow accretion terminates is rich in 12Cand 22Ne.
Because convection behaviour is different in the slow merger andfast merger cases, the behaviour of the composite model is evenmore complex. For the 0.25+0.25 M� and 0.3+0.3 M� cases, thecorona/envelope is fully convective at the transitions between fastand slow phases, as shown in Fig. 14. During the subsequent slow-accretion phase there are no helium-shell flashes and so no flash-driven convection zones. Moreover, the surface is relatively hot, sothe surface convection zone disappears completely. Consequently,at the end of slow accretion the surface composition of the modelis determined entirely by the accreted material, which is the sameas the second white dwarf. In our present calculations, we find thatthe composite model for a 0.35+0.35 M� merger is similar to thatof the 0.4+0.4 M� case, with a surface relatively rich in 12C and22Ne.
5 C OMPARI SON W I TH O BSERVATI ONS
In recent decades, more than two hundred hot subdwarfs have beenobserved; ≈5 per cent of these have been identified as havinghelium-rich atmospheres (Ahmad & Jeffery 2003; Stroeer et al.2007). In general, the helium-rich hot subdwarfs, including spectraltypes He-sdB and He-sdO, are divided into two groups: carbon-richand nitrogen-rich. More than half of them show strong N II and N III
lines in their optical spectrum; they are identified as nitrogen-richby Drilling et al. (2003). The remainder show strong C II and C III
lines and are labelled carbon-rich. The surface abundances of 33He-sdO stars have been analysed in more detail by Hirsch (2009),while six He-sdBs are discussed by Naslim et al. (2010). Theseresults are summarized in Table 1.
C© 2011 The Authors, MNRAS 419, 452–464Monthly Notices of the Royal Astronomical Society C© 2011 RAS

Double helium white dwarf mergers 459
Table 1. Atmospheric parameters of He-sdO (Hirsch 2009) and He-sdB stars (Naslim et al. 2010).Helium, carbon and nitrogen abundances are given by mass fraction.
Star Teff log g log βHe logβN log βC Sp type CN-type
HE 0001−2443 39840 5.69 −0.002 −2.74 −4.52 He-sdO N-richHE 0031−5607 39367 5.58 −0.002 −2.55 −4.52 He-sdO N-richHE 0155−3710 40521 5.61 −0.002 −2.81 −4.52 He-sdO N-richHE 0342−1702 41082 5.59 −0.004 −2.56 −4.51 He-sdO N-richHE 1135−1134 40358 5.38 −0.107 −2.53 −4.31 He-sdO N-richHE 1136−2504 41212 5.65 −0.097 −2.31 −4.32 He-sdO N-richHE 1238−1745 38743 5.48 −0.272 −2.76 −4.14 He-sdO N-richHE 1258+0113 39169 5.66 −0.237 −2.55 −4.17 He-sdO N-richHE 1310−2733 40225 5.45 −0.105 −2.28 −4.31 He-sdO N-richHE 1316−1834 41170 5.30 −0.003 −2.20 −4.52 He-sdO N-richHE 1511−1103 41090 5.46 −0.008 −2.29 −4.33 He-sdO N-richWD 0447+176 40545 5.54 −0.001 −2.71 −4.52 He-sdO N-richWD 2204+071 40553 5.52 −0.078 −2.23 −4.36 He-sdO N-richWD 2258+155 40619 5.71 −0.001 −2.76 −4.52 He-sdO N-richHD 127493 42484 5.60 −0.027 −2.50 −4.46 He-sdO N-richCD −31 4800 43080 5.87 −0.002 −2.50 −4.49 He-sdO N-richCD −24 9052 41700 5.49 −0.195 −2.39 −4.21 He-sdO N-rich
HE 1142−2311 51154 5.38 −0.016 −4.44 −1.70 He-sdO C-richHE 1251+0159 45637 5.63 −0.010 −4.46 −1.72 He-sdO C-richHE 1203−1048 44806 5.62 −0.009 −4.46 −1.71 He-sdO C-richHE 0414−5429 43970 5.52 −0.005 −2.95 −2.04 He-sdO C-richHE 0914−0341 45496 5.72 −0.004 −3.20 −2.26 He-sdO C-richHE 0958−1151 44229 5.39 −0.011 −3.24 −1.64 He-sdO C-richHE 1136−1641 43957 5.58 −0.006 −2.62 −2.05 He-sdO C-richHE 1446−1058 45240 5.67 −0.013 −2.62 −1.60 He-sdO C-richHE 2203−2210 47049 5.60 −0.009 −3.45 −1.72 He-sdO C-richHE 2347−4130 45040 5.78 −0.002 −3.52 −2.40 He-sdO C-richWD 2020−253 44105 5.51 −0.011 −2.68 −1.68 He-sdO C-richHE 0952+0227 44266 5.45 −0.009 −3.08 −1.75 He-sdO C-richUVO 0832−01 43953 5.66 −0.008 −2.77 −1.79 He-sdO C-richUVO 0904−02 46170 5.64 −0.014 −3.60 −1.56 He-sdO C-richHE 0016−3212 39186 5.13 −0.014 −2.29 −1.64 He-sdO C-richHE 1256−2738 39571 5.66 −0.094 −2.44 −1.50 He-sdO C-rich
LSB 1766 36340 5.19 −0.004 −2.71 −3.97 He-sdB N-richSB 21 35960 5.40 −0.003 −2.76 −4.34 He-sdB N-richBPS CS 29496−0010 39150 5.65 −0.002 −2.52 −4.19 He-sdB N-richLB 3229 40000 5.15 −0.007 −2.34 −3.56 He-sdB N-rich
BPS CS 22940−0009 33700 4.70 −0.007 −2.54 −2.13 He-sdB C-richBPS CS 222956−0094 34280 5.63 −0.054 −2.58 −2.46 He-sdB C-rich
5.1 Surface gravity–effective temperature diagram
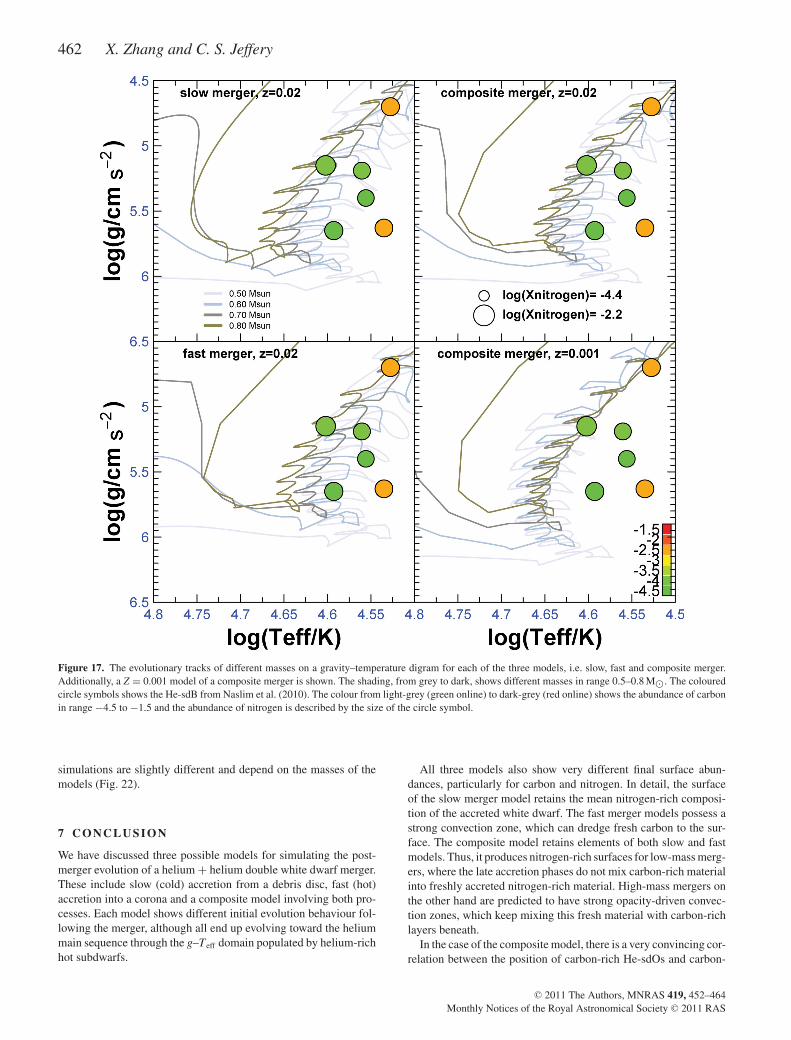
In general, the double helium white dwarf merger represents animportant evolution channel for the formation of helium-rich hotsubdwarfs. Fig. 15 shows the evolutionary tracks for all four fi-nal masses (0.5, 0.6, 0.7 and 0.8 M�) and all three model types(slow, fast and composite) on the surface gravity–effective tem-perature plane. In addition, the cases for a low-metallicity (Z =0.001) compound model are also shown. In order to demonstratethe relation between helium white dwarf mergers and He-sdO stars,Fig. 16 shows the latter superimposed on an enlarged region ofFig. 15. The carbon abundance is represented by colour, while theabundance of nitrogen is represented by size. The splitting of thedistribution is immediately apparent, for most carbon-rich stars arefound at the hotter end of the distribution with Teff ≥ 43 000 K.Two exceptions, located in the cooler and carbon-poor population,also have a very high nitrogen abundance. With the exception ofthe low-metallicity (Z = 0.001) modes, the observed positions ofhelium-rich subdwarfs in the Teff–log (g) plane can be matched very
well by the post-merger evolutionary tracks. The most carbon-richstars are more likely to be associated with high-mass evolutionarytracks, possibly with M > 0.6 M�. For Z = 0.001 all evolutionarytracks crowd together at hotter temperatures; thus only the carbon-rich stars can match these tracks. There is no evidence to suggestthat these stars have lower overall metallicities than the nitrogen-rich stars. In fact, quite the opposite is true, since surface nitrogenis representative of the sum of primordial carbon, nitrogen and oxy-gen converted to 14N in the hydrogen-burning CNO cycle, whichmay thus be taken as a proxy for initial metallicity. The majority ofHe-sdOs have significant nitrogen abundances.
Fig. 17 shows the same information for the generally cooler He-sdB stars.1 Four of these are carbon-poor and match the evolutionary
1 The spectroscopic distinction between He-sdO and He-sdB is somewhatarbitrary. It depends primarily on the presence of He II absorption and thespectral resolution and signal-to-noise ratio at which the classification datawere obtained. For convenience, we separate the groups analysed by Hirsch(2009) and Naslim et al. (2010).
C© 2011 The Authors, MNRAS 419, 452–464Monthly Notices of the Royal Astronomical Society C© 2011 RAS

460 X. Zhang and C. S. Jeffery
8.5
7.5
6.5
5.5
4.5
3.5
2.5
1.5
0.5
-0.5
log
(g/c
m
)
s2
slow merger, z=0.02
5.5 5 4.5 4
log(Teff/K)
8.5
7.5
6.5
5.5
4.5
3.5
2.5
1.5
0.5
log
(g/c
m
)
s2
fast merger, z=0.02
composite merger, z=0.02
0.50 Msun0.60 Msun0.70 Msun0.80 Msun
5.5 5 4.5 4 3.5
log(Teff/K)
composite merger, z=0.001
Figure 15. The evolutionary tracks of different masses on a gravity–temperature digram for each of the three models, i.e. slow, fast and composite merger.Additionally, a Z = 0.001 model of a composite merger is shown. The shading, from grey to dark, shows different masses in range 0.5–0.8 M�.
tracks very well (Fig. 17). However, the remaining two stars are bothcarbon-rich and nitrogen-rich, and one is too cool to match any ofthe evolutionary tracks.
5.2 Surface abundances
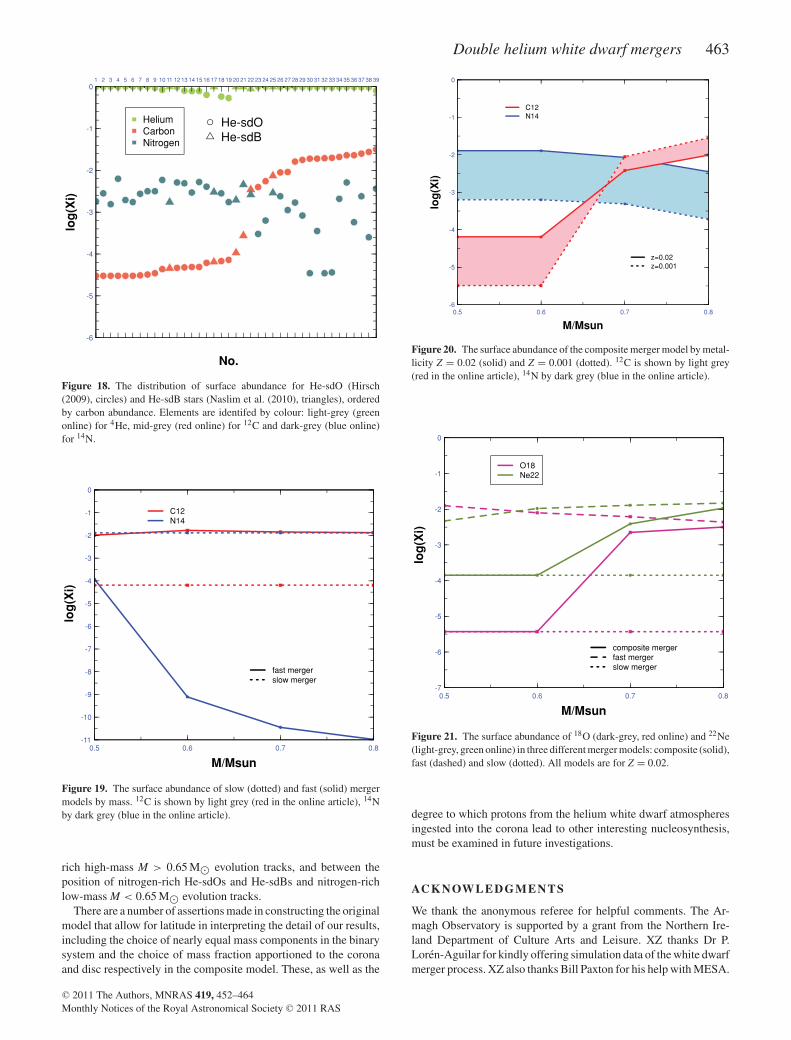
Hirsch (2009) reports that 16 He-sdO stars are carbon-rich withabundances −2.40 ≤ log βC ≤ −1.56. 17 stars are carbon-poorwith abundances −4.52 ≤ log βC ≤ −4.14, having a range of0.38 dex, which is significantly narrower than for the carbon-richcase (0.84 dex). In addition, the nitrogen abundances lie in the range−3.60 ≤ log βN ≤ −2.29 for carbon-rich He-sdO (except three withlog βN < −4) and in the range −2.81 ≤ log βC ≤ −2.20 for thecarbon-poor case. Thus, nitrogen is more abundant in carbon-poorthan in carbon-rich stars (Fig. 18).
For the slow merger model, all the products have the same surfaceabundance as the second helium white dwarf, i.e. log βC = −4.19and log βN = −1.89. Thus, they are all nitrogen-rich stars. For thefast merger model, log βC ≈ −1.9 but the nitrogen abundances arein the range −3.9 > log βN > −11.0, depending on mass. Thus, the
fast merger model produces pure carbon-rich stars, with nitrogenlikely to be unobservable (see Fig. 19). For the composite mergermodel, the surface abundances are divided into two groups by mass(Fig. 20). In general, models with final mass less than 0.7 M�will produce a nitrogen-rich star. Models with final mass greaterthan 0.7 M� will produce a carbon-rich star, but also retaining asignificant nitrogen abundance. Thus, most of the He-sdO and He-sdB stars can be explained by a double helium white dwarf merger,assuming that the accretion is divided into a fast coronal phase anda slow accretion phase.
There are several exceptions, which may come from other chan-nels. There are three He-sdO stars that are pure carbon-rich stars:HE 1142-2311, HE 1251+0159 and HE 1203-1048. It is possiblethat they come from a fast merger channel or from a merger inwhich the amount of material remaining in the disc is negligible.There are two He-sdO stars and two He-sdB stars (HE 0016-3212,HE 1256-2738, BPS CS 22940-0009 and BPS CS 222956-0094)that are are nitrogen-rich as well as carbon-rich. They are locatednear the low-mass evolution tracks. It is possible that these fourstars come from a different evolution channel, for example the late
C© 2011 The Authors, MNRAS 419, 452–464Monthly Notices of the Royal Astronomical Society C© 2011 RAS

Double helium white dwarf mergers 461
Figure 16. The evolutionary tracks of different masses on a gravity–temperature digram for each of the three models, i.e. slow, fast and composite merger.Additionally, a Z = 0.001 model of a composite merger is shown. The shading, from grey to dark, shows different masses in range 0.5–0.8 M�. The colouredcircle symbols shows the He-sdO from Hirsch (2009). The colour from light-grey (green online) to dark-grey (red online) shows the abundance of carbon inrange −4.5 to −1.5 and the abundance of nitrogen is described by the size of the circle symbol.
helium-flash channel (Moehler et al. 2007; Miller Bertolami et al.2008).
6 A D D I T I O NA L A BU N DA N C E P R E D I C T I O N S
In addition to 12C and 14N, surface abundances of the isotopes 13C,18O and 22Ne are also generated in our calculations. They show thedifferent behaviour in different models.
6.1 18O and 22Ne
As discussed above, the surface composition following a slowmerger should be the same as the mean composition of the ac-creted white dwarf. In a fast merger, 18O and 22Ne are both enriched
by α-captures on 14N followed by extensive convective mixing.However, the composite merger model is slightly different: 18Oand 22Ne are only enriched for final masses greater than 0.7 M�(Fig. 21).
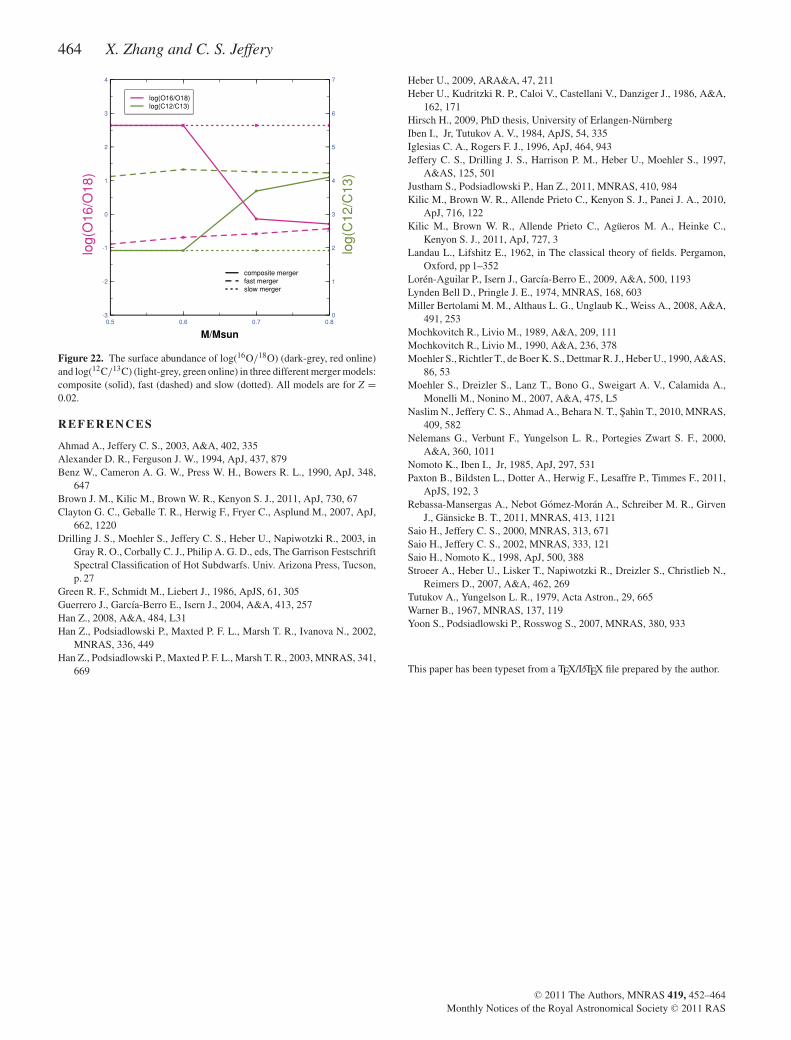
6.2 16O/18O and 12C/13C
In all of our models, the 13C and 16O abundances remained almostunchanged during the whole simulation. Thus, the ratio of 16O/18Oand 12C/13C changed significantly due to the production of 12C and18O. From the slow merger model to the fast merger model the ratioof 16O/18O decreases by a factor of about 1000, while the 12C/13Cratio increases by about 100. The results of the composite merger
C© 2011 The Authors, MNRAS 419, 452–464Monthly Notices of the Royal Astronomical Society C© 2011 RAS
462 X. Zhang and C. S. Jeffery
Figure 17. The evolutionary tracks of different masses on a gravity–temperature digram for each of the three models, i.e. slow, fast and composite merger.Additionally, a Z = 0.001 model of a composite merger is shown. The shading, from grey to dark, shows different masses in range 0.5–0.8 M�. The colouredcircle symbols shows the He-sdB from Naslim et al. (2010). The colour from light-grey (green online) to dark-grey (red online) shows the abundance of carbonin range −4.5 to −1.5 and the abundance of nitrogen is described by the size of the circle symbol.
simulations are slightly different and depend on the masses of themodels (Fig. 22).
7 C O N C L U S I O N
We have discussed three possible models for simulating the post-merger evolution of a helium + helium double white dwarf merger.These include slow (cold) accretion from a debris disc, fast (hot)accretion into a corona and a composite model involving both pro-cesses. Each model shows different initial evolution behaviour fol-lowing the merger, although all end up evolving toward the heliummain sequence through the g–Teff domain populated by helium-richhot subdwarfs.
All three models also show very different final surface abun-dances, particularly for carbon and nitrogen. In detail, the surfaceof the slow merger model retains the mean nitrogen-rich composi-tion of the accreted white dwarf. The fast merger models possess astrong convection zone, which can dredge fresh carbon to the sur-face. The composite model retains elements of both slow and fastmodels. Thus, it produces nitrogen-rich surfaces for low-mass merg-ers, where the late accretion phases do not mix carbon-rich materialinto freshly accreted nitrogen-rich material. High-mass mergers onthe other hand are predicted to have strong opacity-driven convec-tion zones, which keep mixing this fresh material with carbon-richlayers beneath.
In the case of the composite model, there is a very convincing cor-relation between the position of carbon-rich He-sdOs and carbon-
C© 2011 The Authors, MNRAS 419, 452–464Monthly Notices of the Royal Astronomical Society C© 2011 RAS
Double helium white dwarf mergers 463
HeliumCarbonNitrogen
He-sdOHe-sdB
1 2 3 4 5 6 7 8 9 10 11 12 13 14 15 16 17 18 19 20 21 22 23 24 25 26 27 28 29 30 31 32 33 34 35 36 37 38 39
No.
-6
-5
-4
-3
-2
-1
0
log
(Xi)
Figure 18. The distribution of surface abundance for He-sdO (Hirsch(2009), circles) and He-sdB stars (Naslim et al. (2010), triangles), orderedby carbon abundance. Elements are identifed by colour: light-grey (greenonline) for 4He, mid-grey (red online) for 12C and dark-grey (blue online)for 14N.
C12N14
fast mergerslow merger
0.5 0.6 0.7 0.8
M/Msun
-11
-10
-9
-8
-7
-6
-5
-4
-3
-2
-1
0
log
(Xi)
Figure 19. The surface abundance of slow (dotted) and fast (solid) mergermodels by mass. 12C is shown by light grey (red in the online article), 14Nby dark grey (blue in the online article).
rich high-mass M > 0.65 M� evolution tracks, and between theposition of nitrogen-rich He-sdOs and He-sdBs and nitrogen-richlow-mass M < 0.65 M� evolution tracks.
There are a number of assertions made in constructing the originalmodel that allow for latitude in interpreting the detail of our results,including the choice of nearly equal mass components in the binarysystem and the choice of mass fraction apportioned to the coronaand disc respectively in the composite model. These, as well as the
C12N14
z=0.02z=0.001
0.5 0.6 0.7 0.8
M/Msun
-6
-5
-4
-3
-2
-1
0
log
(Xi)
Figure 20. The surface abundance of the composite merger model by metal-licity Z = 0.02 (solid) and Z = 0.001 (dotted). 12C is shown by light grey(red in the online article), 14N by dark grey (blue in the online article).
O18Ne22
composite mergerfast mergerslow merger
M/Msun0.5 0.6 0.7 0.8
-7
-6
-5
-4
-3
-2
-1
0
log
(Xi)
Figure 21. The surface abundance of 18O (dark-grey, red online) and 22Ne(light-grey, green online) in three different merger models: composite (solid),fast (dashed) and slow (dotted). All models are for Z = 0.02.
degree to which protons from the helium white dwarf atmospheresingested into the corona lead to other interesting nucleosynthesis,must be examined in future investigations.
AC K N OW L E D G M E N T S
We thank the anonymous referee for helpful comments. The Ar-magh Observatory is supported by a grant from the Northern Ire-land Department of Culture Arts and Leisure. XZ thanks Dr P.Loren-Aguilar for kindly offering simulation data of the white dwarfmerger process. XZ also thanks Bill Paxton for his help with MESA.
C© 2011 The Authors, MNRAS 419, 452–464Monthly Notices of the Royal Astronomical Society C© 2011 RAS
464 X. Zhang and C. S. Jeffery
log(O16/O18)log(C12/C13)
composite mergerfast mergerslow merger
M/Msun0.5 0.6 0.7 0.8
-3
-2
-1
0
1
2
3
4
0
1
2
3
4
5
6
7
log(
O16
/O18
)
log(
C12
/C13
)Figure 22. The surface abundance of log(16O/18O) (dark-grey, red online)and log(12C/13C) (light-grey, green online) in three different merger models:composite (solid), fast (dashed) and slow (dotted). All models are for Z =0.02.
R E F E R E N C E S
Ahmad A., Jeffery C. S., 2003, A&A, 402, 335Alexander D. R., Ferguson J. W., 1994, ApJ, 437, 879Benz W., Cameron A. G. W., Press W. H., Bowers R. L., 1990, ApJ, 348,
647Brown J. M., Kilic M., Brown W. R., Kenyon S. J., 2011, ApJ, 730, 67Clayton G. C., Geballe T. R., Herwig F., Fryer C., Asplund M., 2007, ApJ,
662, 1220Drilling J. S., Moehler S., Jeffery C. S., Heber U., Napiwotzki R., 2003, in
Gray R. O., Corbally C. J., Philip A. G. D., eds, The Garrison FestschriftSpectral Classification of Hot Subdwarfs. Univ. Arizona Press, Tucson,p. 27
Green R. F., Schmidt M., Liebert J., 1986, ApJS, 61, 305Guerrero J., Garcıa-Berro E., Isern J., 2004, A&A, 413, 257Han Z., 2008, A&A, 484, L31Han Z., Podsiadlowski P., Maxted P. F. L., Marsh T. R., Ivanova N., 2002,
MNRAS, 336, 449Han Z., Podsiadlowski P., Maxted P. F. L., Marsh T. R., 2003, MNRAS, 341,
669
Heber U., 2009, ARA&A, 47, 211Heber U., Kudritzki R. P., Caloi V., Castellani V., Danziger J., 1986, A&A,
162, 171Hirsch H., 2009, PhD thesis, University of Erlangen-NurnbergIben I., Jr, Tutukov A. V., 1984, ApJS, 54, 335Iglesias C. A., Rogers F. J., 1996, ApJ, 464, 943Jeffery C. S., Drilling J. S., Harrison P. M., Heber U., Moehler S., 1997,
A&AS, 125, 501Justham S., Podsiadlowski P., Han Z., 2011, MNRAS, 410, 984Kilic M., Brown W. R., Allende Prieto C., Kenyon S. J., Panei J. A., 2010,
ApJ, 716, 122Kilic M., Brown W. R., Allende Prieto C., Agueros M. A., Heinke C.,
Kenyon S. J., 2011, ApJ, 727, 3Landau L., Lifshitz E., 1962, in The classical theory of fields. Pergamon,
Oxford, pp 1–352Loren-Aguilar P., Isern J., Garcıa-Berro E., 2009, A&A, 500, 1193Lynden Bell D., Pringle J. E., 1974, MNRAS, 168, 603Miller Bertolami M. M., Althaus L. G., Unglaub K., Weiss A., 2008, A&A,
491, 253Mochkovitch R., Livio M., 1989, A&A, 209, 111Mochkovitch R., Livio M., 1990, A&A, 236, 378Moehler S., Richtler T., de Boer K. S., Dettmar R. J., Heber U., 1990, A&AS,
86, 53Moehler S., Dreizler S., Lanz T., Bono G., Sweigart A. V., Calamida A.,
Monelli M., Nonino M., 2007, A&A, 475, L5Naslim N., Jeffery C. S., Ahmad A., Behara N. T., Sahın T., 2010, MNRAS,
409, 582Nelemans G., Verbunt F., Yungelson L. R., Portegies Zwart S. F., 2000,
A&A, 360, 1011Nomoto K., Iben I., Jr, 1985, ApJ, 297, 531Paxton B., Bildsten L., Dotter A., Herwig F., Lesaffre P., Timmes F., 2011,
ApJS, 192, 3Rebassa-Mansergas A., Nebot Gomez-Moran A., Schreiber M. R., Girven
J., Gansicke B. T., 2011, MNRAS, 413, 1121Saio H., Jeffery C. S., 2000, MNRAS, 313, 671Saio H., Jeffery C. S., 2002, MNRAS, 333, 121Saio H., Nomoto K., 1998, ApJ, 500, 388Stroeer A., Heber U., Lisker T., Napiwotzki R., Dreizler S., Christlieb N.,
Reimers D., 2007, A&A, 462, 269Tutukov A., Yungelson L. R., 1979, Acta Astron., 29, 665Warner B., 1967, MNRAS, 137, 119Yoon S., Podsiadlowski P., Rosswog S., 2007, MNRAS, 380, 933
This paper has been typeset from a TEX/LATEX file prepared by the author.
C© 2011 The Authors, MNRAS 419, 452–464Monthly Notices of the Royal Astronomical Society C© 2011 RAS