Embed Size (px)
Citation preview

6b. Walker_PAGE 03292011.docx 3/29/2011 6:02 PM
611
Evolving Executive Equity
Compensation and the Limits of
Optimal Contracting
David I. Walker
INTRODUCTION ............................................................................. 613
I. THEORY AND BACKGROUND ............................................... 617 A. Using Equity Compensation to Align
Managerial and Shareholder Interests ................... 617 B. Conventional Economic Determinants of
Optimal Equity Compensation Design ................... 621 C. Optimal Equity Compensation in the Presence
of Tax and Accounting Concerns and
Transaction Costs .................................................. 624 1. Accounting Rules ........................................ 624 2. Tax Rules .................................................... 626 3. Transaction Costs ....................................... 627 4. Intangible Considerations ........................... 627
D. The Managerial Power View of the
Executive Compensation Process ............................ 628
II. EMPIRICAL OBSERVATIONS ................................................ 629 A. Equity Pay Instruments Actually Observed ............ 630 B. Aggregate Increase in Stock and Decline in
Option Compensation ............................................. 632 1. Explaining the Shift from Option to Stock
Compensation ............................................. 634
Professor of Law and Maurice Poch Faculty Research Scholar, Boston University School
of Law. For their valuable comments, the author thanks Dhammika Dharmapala, Vic Fleischer,
Elizabeth Nowicki, Gregg Polsky, Herwig Schlunk, Dan Shaviro, Chuck Whitehead, David
Yermack, and participants in workshops at Boston University School of Law, University of
Colorado School of Law, Florida State University College of Law, New York University School of
Law, the Canadian Law and Economics Association Conference, the Conference on Empirical
Legal Studies, and, of course, the Vanderbilt Law Review Symposium on Executive
Compensation. The author thanks Marion Harris and Liam Ryan for excellent research
assistance.

6b. Walker_PAGE 03292011.docx 3/29/2011 6:02 PM
612 VANDERBILT LAW REVIEW [Vol. 64:2:611
a. Firm and Market Economic
Determinants .................................... 634 b. The Burst of the Dot-Com Bubble ..... 636 c. Rebalancing Equity Portfolios .......... 636 d. Options-Related Scandals ................. 637 e. Dividend Pressure ............................ 638 f. Stock Option Accounting ................... 639
2. What Does the Shift from Option to
Stock Compensation Tell Us About
Efficient Contracting? ................................. 641 C. Firm-to-Firm Variation in the Use of Stock and
Option Compensation ............................................. 641 1. 1997 Distribution ........................................ 642 2. 2007 Distribution ........................................ 645
a. Censored or Truly Trimodal? ............ 647 b. Explaining the Observed
Distribution ...................................... 648 i. Transaction Costs .................. 648 ii. Explanations Suggested
by Proxy Statement
Disclosures ............................ 649 iii. Mixed Equity Grants and
the Naïve Diversification
Heuristic ................................ 652 iv. Other Contributors to
the 2007 Distribution of
Equity Mix ............................. 655 3. Firm-to-Firm Variation in Equity Mix—
Summary ..................................................... 656 D. Within-Firm Variation in Equity Pay Packages ..... 657
1. Economic Theory and Individualization ...... 657 2. In Practice, Individualization of
Equity Mix Is Limited ................................. 658 a. S&P 500 Data ................................... 658 b. Proxy Statements .............................. 660
3. Explaining the Limited
Individualization of Equity Mix .................. 660 a. Transaction Costs ............................. 660 b. Signaling Issues ............................... 661 c. View that Individualization Is
Less Important than Consistent
Team Incentives ................................ 662 d. Naïve Diversification Heuristic ......... 663

6b. Walker_PAGE 03292011.docx 3/29/2011 6:02 PM
2011] EXECUTIVE EQUITY COMPENSATION 613
e. Self-Selection into Firms Obviates
the Need for Individualization .......... 664 4. Statistical Analysis of Intra-Firm Equity
Grant Behavior ........................................... 664 a. Lockstep Versus Non-
lockstep Firms .................................. 664 b. CEO Versus Non-
CEO Equity Pay Mix......................... 665 5. Intra-firm Variation in Equity Mix—
Summary ..................................................... 666
III. IMPLICATIONS ................................................................... 666 A. Regulation of Risk-Taking Incentives ..................... 667 B. Regulation of Executive Pay-Setting Processes ....... 669 C. Empirical Work on Executive Compensation .......... 669
CONCLUSION ................................................................................ 670
APPENDICES AND TABLE ............................................................... 672
INTRODUCTION
Executive equity compensation in the United States is
evolving. At the turn of the millennium, stock options dominated the
equity pay landscape, accounting for over half of the aggregate ex ante
value of senior executive pay at large public companies, while
restricted stock and similar compensation (stock) accounted for only
about ten percent.1 By 2006, stock grants had displaced options as the
single largest component of senior executive compensation at these
firms.2 Accompanying this shift has been increased variation among
companies in their relative emphasis on stock and options in equity
pay packages.3 Both phenomena provide an opportunity for a rich
exploration of executive pay contracting focusing specifically on equity
pay design.
This Article begins that exploration and has two primary aims.
First, this Article describes the evolution in executive equity pay
practices and the current equity compensation landscape. Second, it
considers the extent to which this evolution and the current use of
1. See infra Part II.B.
2. See infra Part II.B.
3. See infra Part II.C.

6b. Walker_PAGE 03292011.docx 3/29/2011 6:02 PM
614 VANDERBILT LAW REVIEW [Vol. 64:2:611
stock and option pay can be explained as a function of efficient
contracting (and what ―efficient contracting‖ means in this context).
Why focus specifically on equity pay design—the relative use of
stock and options? As an initial matter, the subject is central to an
important current policy debate in Washington. Although both stock
and options can align executive incentives with shareholder interests,
these instruments have very different incentive and risk properties.
Some commentators and policymakers believe that heavy use of
options led to excessive risk taking which contributed to the recent
financial meltdown as well as earlier fiascos at Enron, WorldCom,
Tyco, and other major U.S. corporations.4 There is, accordingly, a push
in Washington and in academia for pay practices that will promote
more conservative behavior. These practices include increasing
vesting periods for equity pay, and, in some cases, replacing options
with restricted stock.5 But, as noted previously, the transition from
options to stock is already well under way, at least in the aggregate.
Clearly, the policy debate should be informed by an up-to-date picture
of these pay practices.
In addition, exploration of the evolution in the use of stock and
options should provide important insights into contracting over
executive pay. Most finance researchers embrace the optimal
contracting model of the pay-setting process. Once it chooses to
compensate its executives with equity instruments, a company acting
in accordance with that model would select a mix of stock and options
that minimizes agency costs in light of particular firm, market, and
executive characteristics. Prior to 2005, accounting rules favored
options over stock and may have dominated other considerations.6
Today, the regulatory playing field for stock and options is essentially
4. See, e.g., Judith F. Samuelson & Lynn A. Stout, Are Executives Paid Too Much?, WALL
ST. J., Feb. 25, 2009, at A13 (arguing that the widespread use of stock options in executive
compensation encouraged executives to focus on shorter-term goals and take greater risks).
5. See, e.g., Sanjai Bhagat & Roberta Romano, Reforming Executive Compensation:
Focusing and Committing to the Long-Term, 26 YALE J. ON REG. 359, 361 (2009) (suggesting that
executives not be allowed to dispose of equity compensation prior to retirement); Richard A.
Posner, Are American CEOs Overpaid, and, if so, What if Anything Should Be Done About It?, 58
DUKE L.J. 1013, 1045–46 (2009) (suggesting that restricted stock should constitute a minimum
fraction of CEO pay); Susanne Craig, Cuomo, Frank Seek to Link Executive Pay, Performance,
WALL ST. J., Mar. 13, 2009, at C1 (relating comments of House Financial Services Committee
Chairman Barney Frank advocating broader application of rules tying executive pay to long-term
performance).
6. See infra Part I.C.1.

6b. Walker_PAGE 03292011.docx 3/29/2011 6:02 PM
2011] EXECUTIVE EQUITY COMPENSATION 615
level,7 and current equity compensation arrangements should provide
an unbiased gauge of the efficiency of executive pay packages, the
barriers to efficient design, and prospects for improvement through
regulation.
My exploration of the evolution and current state of executive
equity pay design is divided into three parts. I begin by outlining and
analyzing the dramatic aggregate shift away from options and
towards restricted stock over the last decade at large, public
companies. It is unlikely that changes in the firm, market, or
individual characteristics that generate the conventional economic
determinants of equity compensation design—such as firm growth
opportunities, firm and market risk, or executive appetite for risk—
fully account for the change.8 Other important factors include the 2004
change in generally accepted accounting principles (―GAAP‖) that
leveled the financial accounting playing field for stock and option
compensation, the burst of the dot-com bubble in 2000 that increased
the perceived risk of option compensation, and a number of corporate
scandals beginning around 2002 that featured options and that may
have increased the reputational cost to firms and executives of
utilizing option compensation. To be sure, consideration of accounting
rules, perceived option risk, and public hostility towards options is not
necessarily inconsistent with efficient contracting. Such consideration
may simply reflect optimization occurring at another level.
Next, I disaggregate the pay data so as to explore the trends on
a firm-by-firm basis. In the late 1990s, many companies relied
exclusively on options in delivering equity pay. Between 1996 and
1998, for example, forty percent of the sampled firms routinely
granted options but failed to grant a single share of restricted stock.9
The data from this period are consistent with a model in which firms
divided into two types—firms for which equity pay effectively meant
options, as a result of favorable accounting treatment or other factors,
and firms with an equity menu that included both stock and options.
One observes more variation in the use of stock and options in
recent years than in the 1990s, but many companies continue to rely
on a single equity compensation instrument, granting only stock or
only options. However, companies granting a roughly fifty-fifty mix of
7. Of course, whether the playing field remains level and for how long depends on the
outcome of efforts to increase regulation of executive pay noted above.
8. See infra text accompanying notes 73–78.
9. See infra Part II.C.1.

6b. Walker_PAGE 03292011.docx 3/29/2011 6:02 PM
616 VANDERBILT LAW REVIEW [Vol. 64:2:611
stock and options are also frequently observed.10 The current
clustering of equity pay ―mix‖ is puzzling within a model that views
stock and options not as different in kind but as points along an
economic continuum. Clustering might result from the additional
transaction costs of employing more than one equity instrument,
including the cost of complexity, but company proxy statement
disclosures regarding executive pay provide little confidence that firms
are optimizing equity pay arrangements even within the constraints of
transaction costs.11 Additional data suggest that clustering at a fifty-
fifty mix may follow from a tendency to allocate resources pro rata
among instruments, a decisionmaking shortcut known as the naïve
diversification heuristic.12
Finally, I examine the mix of stock and options granted to the
individual members of executive teams. Despite the theoretical
importance of individual risk preferences, existing equity holdings,
and primary job roles to equity pay design, seventy-eight percent of
S&P 500 executives received the same mix of equity compensation in
2006 and 2007 as one or more of their colleagues in the executive
suite, and in thirty-nine percent of the cases, all five members of the
top team received the same mix.13 The high frequency with which
firms grant options but not stock, stock but not options, or the same
ratio of stock to options to each of their senior executives indicates
that individualized optimization of equity pay packages is not
pervasive. Limited individualization may result from transaction
costs, including signaling costs, but more troubling is the assertion in
numerous company proxy statements that a uniform mix of equity
instruments serves to align incentives within the executive team. I
argue that this view is overly simplistic and often incorrect.14
In combination, the data presented in this Article suggest that
executive equity pay design is at best boundedly efficient. The
conventional economic determinants of equity design, such as growth
opportunities, firm and market risk, and executive risk preferences,
clearly fail to tell the entire story. The evidence might be viewed as
undermining the idea that executive pay packages are optimized, but
at the least it demonstrates that optimization is limited by transaction
10. See infra Part II.C.2.
11. Proxy statements provide various rationales for the use of stock, stock options, or both,
but rarely invoke transaction costs. See infra Part II.C.2.b.ii.
12. See infra Part II.C.2.b.iii.
13. See infra Part II.D.2.a. The size of the senior executive team varies firm by firm, but
companies are required to report compensation for five executives.
14. See infra Part II.D.3.

6b. Walker_PAGE 03292011.docx 3/29/2011 6:02 PM
2011] EXECUTIVE EQUITY COMPENSATION 617
costs or heuristics, and that forces generally not emphasized in the
finance literature—such as accounting rules, perceived option risk,
and complexity—are important determinants of equity compensation
design.
However, many puzzles remain. This Article provides a
number of possible explanations for why individualization of the mix
of equity instruments granted to executives is not more pervasive and
why the distribution of the mix of stock and options granted is
clustered, but it provides no definitive answers. Despite these puzzles,
the findings of this Article have important implications for the
regulation of executive pay and for future empirical work on executive
pay design.
I. THEORY AND BACKGROUND
One aim of this Article is to test whether senior executive
equity pay practices are consistent with a story of efficient or
―optimal‖ contracting. This Part briefly explains how stock and option
compensation could be used to reduce managerial agency costs and
create more efficient contracts. It also considers the effect of
accounting and tax rules and transaction costs on equity design under
an efficient contracting model, as well as a competing/complementary
model that does not assume that boards and executives negotiate pay
arrangements at arm‘s length.
A. Using Equity Compensation to Align Managerial
and Shareholder Interests
Managerial agency costs arise from separation of ownership
and control.15 These costs reflect the divergence between share value
15. See Michael C. Jensen & William H. Meckling, Theory of the Firm: Managerial
Behavior, Agency Costs and Ownership Structure, 3 J. FIN. ECON. 305 (1976). In brief, the Jensen
and Meckling (―J&M‖) model begins with a sole proprietor-manager who sells shares of equity to
nonmanaging outsiders, which creates a wedge between the manager‘s private incentives and
the incentives of the shareholders generally. The outside shareholders cannot perfectly (or
costlessly) observe the manager‘s effort or focus, and performance results are not completely
within the manager‘s control. Thus, the shareholders cannot ensure perfect fidelity to their
objectives, and the manager, who now owns less than 100 percent of the cash flow rights, will
tend to consume excessive perks, loaf, and otherwise extract private benefits, since he enjoys 100
percent of the benefit of such activities, but only a fraction of the cost, which is borne pro rata by
all shareholders. The optimal contract in this situation would minimize agency costs, which J&M
defined as the sum of 1) monitoring costs incurred by the principal, 2) bonding costs incurred by
the manager-agent to better ensure loyalty to shareholder wealth maximization, and 3) the cost

6b. Walker_PAGE 03292011.docx 3/29/2011 6:02 PM
618 VANDERBILT LAW REVIEW [Vol. 64:2:611
maximizing actions of employees and employees‘ actual actions, plus
the monitoring and bonding expenditures undertaken to reduce that
divergence. Agency costs in the modern, widely-held corporation are,
of course, unavoidable,16 but they can be reduced by designing
compensation to better align managers‘ economic interests with those
of shareholders. Clearly, long-term, equity-based compensation can
play a role in shaping managerial incentives that straight salary
cannot.17
Both stock and options tie pay to stock price performance.
Stock compensation does so in a linear fashion. The paradigm case of
stock compensation is a grant of stock at no explicit cost to the
executive that cannot be sold or otherwise transferred until it ―vests‖
in a certain number of years. If the executive‘s employment
terminates prior to vesting, the stock typically must be returned.
Assuming that the stock will ultimately vest, in the interim, the value
of this restricted stock moves dollar for dollar with the firm‘s share
price.
Options provide the holder with a right, but no obligation, to
purchase shares of stock at a pre-determined exercise price.18 Thus,
the defining feature of an option is that the payoff is based on the
positive difference, if any, between the share price at exercise or
settlement and the strike price of the instrument. If the share price on
a potential exercise date fails to exceed the strike price, the option
provides zero payout. Compensatory stock options typically are
granted with an exercise price equal to the market price of the
underlying stock on the date of the grant, and, like restricted stock,
options typically vest and become exercisable several years following
grant.
As described in the following figure, the value of an option
increases and decreases with increases and decreases in the value of
of the residual divergence between the manager‘s actual decisions and shareholder wealth-
maximizing decisions.
16. Going private transactions are an extreme way of reducing agency costs.
17. The effect is not always salutary. Given their human capital investment in their firms,
executives tend to be more risk-averse than shareholders. Compensating executives with equity
can increase executive risk aversion. See infra note 24 and accompanying text.
18. The strike price of employee stock options is almost always a fixed price specified at
grant, and almost always equal to the fair market value of the stock at grant. A few firms have
experimented with indexing strike prices to a basket of competing stocks or to a broad measure
of the stock market, such as the S&P 500, with the idea of focusing the option payout on firm-
specific performance rather than market movements generally. See Alfred Rappaport, New
Thinking on How to Link Executive Pay with Performance, HARV. BUS. REV. Mar.–Apr. 1999, at
91, 101.

6b. Walker_PAGE 03292011.docx 3/29/2011 6:02 PM
2011] EXECUTIVE EQUITY COMPENSATION 619
the underlying shares, but the relationship is not linear, it is convex.19
An option that is far out of the money—that is, with strike price far in
excess of the value of the underlying shares—has a very low value and
a value that is relatively insensitive to small changes in the price of
the underlying shares. The value of an option that is far in the
money—that is, with strike price far below the value of the underlying
shares—approaches the current share price less the exercise price,
and that value moves dollar for dollar with small changes in the price
of the underlying shares. The situation in between is, well, in between.
The sensitivity of an option‘s value to small changes in the
underlying share price is known as the option‘s delta, and delta is
simply the slope of the curve that plots the value of the option against
the value of the underlying stock.20 Compared with a share of
19. When graphed, a convex relationship presents a U-shaped curve. The relationship
between option value and the price of the underlying shares tracks the right half of the U.
20. For example, an option delta of .75 means that when the price of the underlying shares
changes by a small amount, the value of the option changes by seventy-five percent of that
amount. See JOHN C. HULL, OPTIONS, FUTURES, AND OTHER DERIVATIVES 251 (6th ed. 2006)
(explaining the concept of the option delta).
6b. Walker_PAGE 03292011.docx 3/29/2011 6:02 PM
620 VANDERBILT LAW REVIEW [Vol. 64:2:611
restricted stock, an at-the-money option on a single share of stock is
both less expensive to grant and less sensitive to share price
movement. However, per dollar of compensation expense, options
produce stronger incentives than restricted stock. For example, an at-
the-money option on a single share of stock might have a value that is
forty percent of the value of a share of restricted stock, but a delta that
is seventy-five percent of the delta of a share of restricted stock,
yielding almost twice the sensitivity to share price per dollar of
compensation expense.21
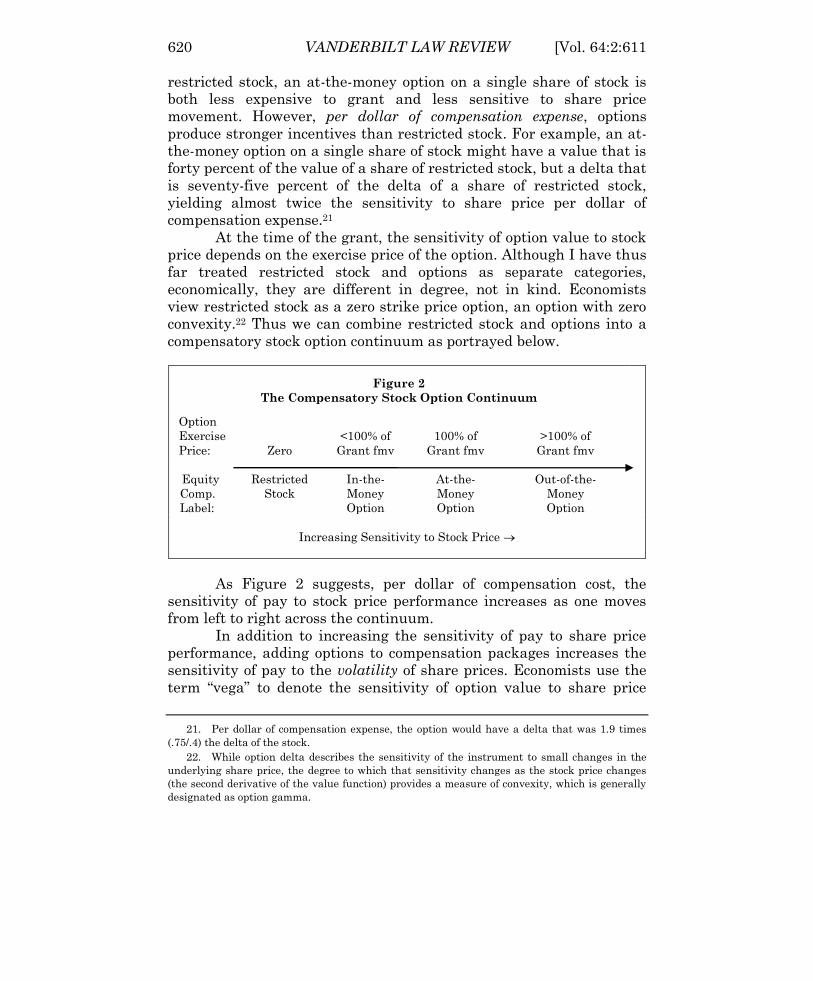
At the time of the grant, the sensitivity of option value to stock
price depends on the exercise price of the option. Although I have thus
far treated restricted stock and options as separate categories,
economically, they are different in degree, not in kind. Economists
view restricted stock as a zero strike price option, an option with zero
convexity.22 Thus we can combine restricted stock and options into a
compensatory stock option continuum as portrayed below.
Figure 2
The Compensatory Stock Option Continuum
Option
Exercise
Price: Zero
<100% of
Grant fmv
100% of
Grant fmv
>100% of
Grant fmv
Equity
Comp.
Label:
Restricted
Stock
In-the-
Money
Option
At-the-
Money
Option
Out-of-the-
Money
Option
Increasing Sensitivity to Stock Price
As Figure 2 suggests, per dollar of compensation cost, the
sensitivity of pay to stock price performance increases as one moves
from left to right across the continuum.
In addition to increasing the sensitivity of pay to share price
performance, adding options to compensation packages increases the
sensitivity of pay to the volatility of share prices. Economists use the
term ―vega‖ to denote the sensitivity of option value to share price
21. Per dollar of compensation expense, the option would have a delta that was 1.9 times
(.75/.4) the delta of the stock.
22. While option delta describes the sensitivity of the instrument to small changes in the
underlying share price, the degree to which that sensitivity changes as the stock price changes
(the second derivative of the value function) provides a measure of convexity, which is generally
designated as option gamma.

6b. Walker_PAGE 03292011.docx 3/29/2011 6:02 PM
2011] EXECUTIVE EQUITY COMPENSATION 621
volatility.23 The value of shares is not directly affected by increases or
decreases in volatility, and thus stock has vega of zero. The value of an
option increases, however, with increasing volatility, and thus options
have positive vega. The sensitivity of pay to stock price volatility is
important in assessing the effect of compensation design on the
willingness of executives to take on risky projects.
B. Conventional Economic Determinants of Optimal Equity
Compensation Design
Of course, executive pay provides compensation as well as
incentives, and optimizing the design of pay packages involves a
tradeoff. On the one hand, firms want to provide high-powered
incentives to encourage employees to work hard and to take on risky
projects.24 On the other hand, pay packages have to be mutually
acceptable, and nondiversified employees apply large discounts to
risky, high-powered incentive arrangements, creating a gap between
their cost to shareholders and their value to employees.25 The optimal
pay arrangement would balance incentive generation with risk-
bearing costs. From a shareholder‘s perspective, it‘s all about getting
the most bang for your buck.
Ideally, employee, firm, and market characteristics should all
be considered in determining the optimal sensitivity of equity
compensation to share prices and volatility, and each of these areas
contributes one or more of the economic determinants of equity pay
sensitivity that are discussed in the literature. At the firm level,
theoretical models developed by corporate finance researchers suggest
that greater growth opportunities should result in more convex
executive pay contracts that increase the incentives to exploit those
23. Hull, supra note 20, at 373, 791.
24. All else being equal, executives and other employees whose financial and human capital
generally is overinvested in their companies tend to disfavor risky projects relative to diversified
shareholders. See Brian J. Hall, Six Challenges in Designing Equity-Based Pay, 15 J. APPLIED
CORP. FIN. 21, 29 (2003). In the wake of the recent financial crisis, regulators are concerned that
incentive pay packages may have encouraged executives to take on too much risk, although the
link is far from clear. The more traditional concern, however, has been a tendency towards
conservatism.
25. See Brian J. Hall & Kevin J. Murphy, Stock Options for Undiversified Executives, 33 J.
ACCT. & ECON. 3, 5 (2002) (explaining that ―[r]estricting the trading and hedging activities of
option recipients‖ causes executives receiving the options to ―value the options below their cost to
shareholders‖); see also John E. Core et al., Executive Equity Compensation and Incentives: A
Survey, ECON. POL‘Y REV., Apr. 2003, at 27, 30 (noting that equity compensation is risky because
stock prices are a noisy measure of firm performance and that recipients must be compensated
for taking on the non-diversifiable risk).

6b. Walker_PAGE 03292011.docx 3/29/2011 6:02 PM
622 VANDERBILT LAW REVIEW [Vol. 64:2:611
opportunities.26 To some extent, as growth opportunities increase, the
benefit of encouraging executives to take on risk and maximize firm
value more than offsets the discount the executives apply to risky
compensation. In the same vein, optimal sensitivity of pay to
performance increases with the desired riskiness of projects,27 but
decreases with firm risk generally and with firm leverage, which itself
increases the risk of an option contract.28 The overall market
environment affects optimal sensitivity in a similar fashion, that is,
market volatility should be negatively correlated with sensitivity.29
Finally, optimal sensitivity increases with the marginal productivity
of executive effort at the firm.30
Numerous employee characteristics have been modeled by
corporate finance researchers, but risk aversion appears to be the
most important—and certainly the most frequently modeled—
individual trait affecting optimal sensitivity.31 A highly risk-averse
26. See John Core & Jun Qian, Option-Like Contracts for Innovation and Production 2 (Jan.
2000) (unpublished manuscript), available at http://papers.ssrn.com/sol3/papers.cfm?
abstract_id=207968. In practice, more convex pay contracts means more option-heavy pay
packages.
27. See, e.g., Chongwoo Choe, Leverage, Volatility and Executive Stock Options, 9 J. CORP.
FIN. 591, 593 (2003) [hereinafter Choe, Leverage]; Chongwoo Choe, Maturity and Exercise Price
of Executive Stock Options, 10 REV. FIN. ECON. 227, 229 (2001).
28. See, e.g., Choe, Leverage, supra note 27, at 593 . Although increased volatility increases
the value of an option, the value of an option at grant reflects expected volatility. Because
executives cannot diversify away option risk, as firm risk increases, the cost to executives of
added convexity increases.
29. See Richard A. Lambert & David F. Larcker, Stock Options, Restricted Stock, and
Incentives 3 (Apr. 2004) (unpublished manuscript), available at http://papers.ssrn.com/sol3/
papers.cfm?abstract_id=527822.
30. See, e.g., id.
31. Studies examining risk aversion alone or in combination with other factors include
Ingolf Dittmann & Ernst Maug, Lower Salaries and No Options? On the Optimal Structure of
Executive Pay, 62 J. FIN. 303, 308 (2007); Gerald A. Feltham & Martin G.H. Wu, Incentive
Efficiency of Stock Versus Options, 6 REV. ACCT. STUD. 7 (2001); Brian J. Hall & Kevin J.
Murphy, Optimal Exercise Prices for Executive Stock Options, 90 AM. ECON. REV. 209, 209 (2000);
Hall & Murphy, supra note 25, at 7; Yisong S. Tian, Too Much of a Good Incentive? The Case of
Executive Stock Options, 28 J. BANKING & FIN. 1225, 1226 (2004); Lambert & Larcker, supra note
29, at 23; Yisong S. Tian, Optimal Contracting, Incentive Effects and the Valuation of Executive
Stock Options 4 (Apr. 30, 2001) (unpublished manuscript) [hereinafter Tian, Contracting],
available at http://papers.ssrn.com/sol3/papers.cfm?abstract_id=268738.
Other characteristics that have been modeled include loss aversion, effort aversion, overall
wealth, firm equity held, and outside investment opportunities. See, e.g., Anna Dodonova & Yuri
Khoroshilov, Optimal Incentive Contracts for Loss-Averse Managers: Stock Options Versus
Restricted Stock Grants, 41 FIN. REV. 451, 452 (2006) (loss aversion); Oded Palmon et al.,
Optimal Strike Prices of Stock Options for Effort-Averse Executives, 32 J. BANKING & FIN. 229,
230 (2008) (effort aversion); Dittmann & Maug, supra at 308 (effort aversion); Feltham & Wu,

6b. Walker_PAGE 03292011.docx 3/29/2011 6:02 PM
2011] EXECUTIVE EQUITY COMPENSATION 623
optionee will more greatly discount options with more remote payoff
prospects. Thus, as risk aversion increases, the optimal design shifts
in the direction of stock.32
Depending on firm and employee characteristics (and on model
specifications), researchers have concluded that optimal equity
compensation design ranges from far in-the-money options (essentially
restricted stock) to far out-of-the-money options.33 Optimal equity
compensation design is quite sensitive to model specification, but even
within a given model, optimal sensitivity is highly dependent on the
assumptions listed above. Yisong Tian, for example, finds that at-the-
money options are nearly optimal for executives who exhibit relatively
low risk aversion; in-the-money options are optimal for those with
somewhat greater risk aversion; and for executives who are highly
risk averse, restricted stock is optimal.34
Some of these theoretical findings are supported by empirical
research. For example, John Core and Wayne Guay find that firms
actively manage the level of new CEO equity incentives in response to
deviations between existing incentives and optimal incentives
associated with economic determinants such as firm size, growth
opportunities, and monitoring costs.35 In another study, Guay finds a
positive association between the sensitivity of CEO wealth to firm risk
and investment opportunities.36
supra at 7 (effort aversion); Tian, Contracting, supra at 40 (effort aversion, overall wealth, firm
equity held, and outside investment opportunities).
32. See, e.g., Tian, Contracting, supra note 31, at 32; see also Hall, supra note 24, at 31
(noting that under plausible assumptions, the ―value-to-cost discount for stock is two to three
times less than that of‖ at-the-money options).
33. Compare Hall & Murphy, supra note 31, at 26–27 (concluding that ―when existing
compensation is adjusted, incentives are maximized through restricted stock grants rather than
options‖), and Dittmann & Maug, supra note 31, at 305 (reporting results of a model indicating
that CEOs should receive restricted stock instead of options), with Lambert & Larcker, supra
note 29, at 2 (―[E]xercise price in the optimal contract is frequently far ‗out of the money.‘ ‖).
34. See Tian, Contracting, supra note 31, at 32–33. He suggests, for example, that options
are more likely to be optimal for younger executives who are less likely to be risk averse than
older executives nearing retirement. Id.
35. See John Core & Wayne Guay, The Use of Equity Grants to Manage Optimal Equity
Incentive Levels, 28 J. ACCT. & ECON. 151, 152 (1999) (using delta as the measure of equity
incentives).
36. See Wayne R. Guay, The Sensitivity of CEO Wealth to Equity Risk: An Analysis of the
Magnitude and Determinants, 53 J. FIN. ECON. 43, 43 (1999) (using a vega-type measure of
sensitivity of wealth to risk).

6b. Walker_PAGE 03292011.docx 3/29/2011 6:02 PM
624 VANDERBILT LAW REVIEW [Vol. 64:2:611
C. Optimal Equity Compensation in the Presence of Tax and
Accounting Concerns and Transaction Costs
Absent tax and accounting concerns and transaction costs, the
optimal contracting model predicts that companies that choose to
compensate executives with firm equity would finely tailor equity
compensation along the continuum presented above, taking into
consideration firm, market, and individual employee characteristics.
In the real world, firms do not and should not be expected to achieve
this level of optimality. This Section discusses the impact of tax and
accounting rules and transaction costs on equity pay design.
1. Accounting Rules
Through 2005, U.S. financial accounting rules favored
conventional nondiscounted options over other forms of equity pay.37
Specifically, companies were required to recognize as compensation
expense the grant date intrinsic value of stock or options issued to
employees.38 (The intrinsic value of an option, also known as the
option spread, is the positive difference, if any, between the value of
the underlying stock and the option exercise price.) The expense was
accrued ratably over the vesting period of the instrument, and at that
point the accounting books were closed.39 There was no requirement to
update the expense for an option grant as its intrinsic value fluctuated
over time. As a result, no expense was recorded at any point for
options issued at or out of the money, because, by definition, these
options had zero intrinsic value on the date of grant.40 By contrast,
restricted stock grants resulted in an accounting expense equal to the
full fair market value of the underlying stock at grant, despite the
37. David I. Walker & Victor Fleischer, Book/Tax Conformity and Equity Compensation, 62
TAX L. REV. 399, 403–04, 410–11 (2009).
38. See Am. Inst. of Certified Pub. Accountants, Accounting for Stock Issued to Employees,
Accounting Principles Bd. Opinion No. 25 (1972) [hereinafter APB 25].
39. See id. para. 12.
40. The FASB attempted to rationalize equity compensation accounting in the 1990s, but
they succeeded only in implementing an elective regime that effectively left the 1972 standard in
place while requiring firms to include pro forma earnings statements reflecting ―fair value‖
accounting for options in the footnotes to their financials. See Fin. Accounting Standards Bd.,
Accounting for Stock-Based Compensation, Statement of Fin. Accounting Standards No. 123, § 5
(1995) [hereinafter SFAS 123]. Fair value was and is defined as the value arrived at through use
of the Black-Scholes option pricing model or another appropriate model. Id. § 19.

6b. Walker_PAGE 03292011.docx 3/29/2011 6:02 PM
2011] EXECUTIVE EQUITY COMPENSATION 625
restrictions on transfer.41 Discounted or in-the-money options resulted
in an accounting expense equal to the ―spread‖ at grant.
In December 2004, the Financial Accounting Standards Board
(―FASB‖) issued a new standard requiring firms to determine the
grant date fair value of all equity compensation and to recognize the
expense over the vesting period of the stock or option.42 For option
compensation, this rule requires firms to calculate a grant date value
using an option pricing model. The new standard largely eliminates
the previous accounting-induced distortions between stock and option
compensation, between discounted and nondiscounted options, and
between conventional fixed exercise price options and options with
exercise prices linked to a market index.43
At this point some readers may ask why the old accounting
rules would have created a distortion. Why would a financial
accounting rule that has no impact on cash flow influence equity
compensation design? Wouldn‘t market analysts have seen through
efforts by managers to minimize reported compensation expense
through heavy use of stock options? The extent to which accounting
treatment influences compensation choices is unclear. Changes in
equity pay composition in the wake of the accounting standard
revision, as presented below, support the notion that accounting
matters, but other changes in the contracting environment make it
impossible to isolate the impact of the change in GAAP.
Two other points are worth noting. First, there is a theoretical
basis for believing that even cosmetic accounting effects (those having
no direct impact on cash flows) are economically significant. The
positive accounting literature has shown that in some cases reported
earnings matter independently of cash flow because debt covenants
and other contractual provisions may be tied to reported earnings.
Given transaction costs, even cosmetic changes in earnings can affect
the value of these contracts and thus shareholder value.44 And, of
41. See id. § 18. The accounting expense for restricted stock is equal to the full fair market
value of the stock at grant assuming that the employee is required to pay nothing explicitly for
the stock, as is typical.
42. See generally Fin. Accounting Standards Bd., Share-Based Payment, Statement of Fin.
Accounting Standards No. 123 (rev‘d 2004).
43. I say ―largely‖ because some potential for distortion remains. The fair value of an option
is determined using the Black-Scholes or binomial model and is manipulable. Thus, options
provide some accounting flexibility that stock compensation does not provide. See Walker &
Fleischer, supra note 37, at 418–21 (describing potential for option expense manipulation).
44. See ROSS L. WATTS & JEROLD L. ZIMMERMAN, POSITIVE ACCOUNTING THEORY 133
(1986). The general idea is that in the presence of transaction costs, both renegotiation of
earnings-based contracts to adjust for cosmetic changes and failure to do so can be costly.

6b. Walker_PAGE 03292011.docx 3/29/2011 6:02 PM
626 VANDERBILT LAW REVIEW [Vol. 64:2:611
course, managers are particularly sensitive to one type of contract tied
to reported earnings—executive compensation contracts. Earnings-
based bonuses may be affected by even cosmetic increases in reported
income.45
Second, unrelated empirical data confirm managerial
sensitivity to accounting rules and practices. The evidence indicates
that accounting choices vary systematically between firms, that
corporations make operational changes in response to changes in
accounting rules, and that firms sacrifice cash flows to boost reported
earnings.46 Whether rational or not, managers act as if accounting
rules matter, and so they do matter.
2. Tax Rules
While the accounting-based distortion in equity pay design has
largely been eliminated, tax-induced distortions remain and have
recently become more important. Current U.S. tax rules all but
preclude firms from issuing explicitly discounted stock options (that is,
options with exercise prices less than the fair market value of the
underlying stock at grant). Under regular U.S. tax rules,
compensation arising from a nondiscounted option is not taxed until
the option is exercised.47 But under IRC § 409A, which was enacted in
2004, compensation income arising from a discounted option would be
taxed at vesting, rather than at exercise, and would be subjected to an
additional twenty percent penalty tax.48 Given § 409A, the current
equity pay menu is effectively limited to restricted stock (and
economically similar instruments such as performance shares) and
nondiscounted options.49
45. See David I. Walker, Financial Accounting and Corporate Behavior, 64 WASH. & LEE L.
REV. 927, 927 (2007); see also Gregg D. Polsky, Controlling Executive Compensation Through the
Tax Code, 64 WASH. & LEE L. REV. 877, 923–24 (2007) (arguing that section 162(m) of the
Internal Revenue Code, which disallows tax deductions for certain executive pay in excess of $1
million per year that is not performance based, encourages firms to adopt objective, formulaic
bonus structures that can be manipulated through cosmetic adjustments to earnings).
46. See generally Walker, supra note 45, at 935–43.
47. However, in calculating alternative minimum taxable income, the spread on an ISO at
exercise is included. I.R.C. § 56(b)(3).
48. See generally David I. Walker, The Non-option: Understanding the Dearth of Discounted
Employee Stock Options, 89 B.U. L. Rev. 1505 (2009).
49. Apparently, deductibility under § 162(m) of the Internal Revenue Code represents a
second order tax consideration. Stock options qualify fairly easily as performance-based pay for
purposes of this section and, thus, option payouts generally are fully deductible. Conventional,
time-vested restricted stock is not considered performance-based pay and deductibility may be
limited. One way to ensure deductibility of restricted stock is to condition vesting on

6b. Walker_PAGE 03292011.docx 3/29/2011 6:02 PM
2011] EXECUTIVE EQUITY COMPENSATION 627
3. Transaction Costs
In light of the impact of IRC § 409A, it is highly unlikely that a
firm wishing to create an equity pay package with intermediate
convexity—that is, incentive properties in between those of stock and
those of an at-the-money option—would issue an explicitly discounted
option.50 Instead, the firm would likely issue a combination of
restricted stock and an at-the-money option. Although either approach
can be used to achieve intermediate convexity, issuing two equity
instruments instead of one increases transaction costs for both the
firm and the employee. For the firm, maintaining and administering
both stock and option plans increases the cost of drafting plans,
drafting grant and (in the case of options) exercise documentation,
maintaining systems to track unvested instruments, preparing SEC
disclosures and tax documents, and so forth. For the employee,
receiving both stock and options increases the cost of comprehending
the economics and tax consequences of the compensation and of
complying with SEC and IRS rules and regulations.
This is not to suggest, however, that the issuance of an
explicitly discounted option (if not precluded under § 409A) would not
also lead to additional transaction costs, at least initially. Employees
are familiar with at-the-money options and restricted stock. They
would have to invest time and effort in coming to understand a
discounted option. However, if discounted options were common, one
would think that the costs involved in achieving intermediate
convexity through discounting would be less than that of combining
stock and nondiscounted options.51
4. Intangible Considerations
Other considerations undoubtedly come into play when firms
design compensation packages. In a world in which no tax or
achievement of performance objectives as well as continued employment. Many firms do so, but
many other companies continue to grant conventional time-vested restricted stock. See infra text
accompanying note 67. As firms commonly report in their proxy statements, deductibility under
§ 162(m) is a consideration, not a prerequisite, in compensation design.
50. As discussed infra note 58, compensation consultant Frederick W. Cook & Co. reports
that since 2005, none of the largest 250 members of the S&P 500 has issued explicitly discounted
options.
51. I also do not mean to suggest that incremental transaction costs associated with
concurrent grants of stock and options are large. To the contrary, I suspect that the incremental
administrative costs are modest, although the cost of complexity could be significant. See infra
Part II.C.2.b.i.
6b. Walker_PAGE 03292011.docx 3/29/2011 6:02 PM
628 VANDERBILT LAW REVIEW [Vol. 64:2:611
accounting rules discouraged discounted options, firms might still
avoid issuing such options to senior executives and might instead
substitute more costly packages of at-the-money options and restricted
stock because explicitly discounted options might be viewed by
investors or the financial press as a give-away to the executives. There
is evidence that explicitly discounted options are perceived as being
more valuable, relative to nondiscounted options, than they actually
are.52 By the same token, executives likely discount out-of-the-money
options beyond the true economic discount, which may account for the
paucity of these instruments, despite the lack of any tax or accounting
rule discouraging firms from granting out-of-the-money options.
D. The Managerial Power View of the Executive
Compensation Process
The discussion thus far has been predicated on the idea that
companies optimize executive pay arrangements to minimize agency
costs and maximize shareholder value. Most of the theoretical and
empirical literature on executive pay proceeds from this basis, and
this will be the standard against which the findings discussed in this
Article will be tested. There is reason, however, to doubt whether this
optimal contracting view provides a fully accurate picture of the
executive pay-setting process. Many observed features of executive
compensation appear to be inconsistent with a share value optimizing
model and more consistent with a model developed several years ago
by two colleagues and me.53 This alternative view is based on the idea
that executive pay practices do not uniformly reflect arm‘s length
bargaining, and that executives exert more influence over the terms of
their pay than would be expected in an arm‘s length bargaining
situation. Under this managerial power view of the compensation-
setting process, investor and financial press outrage play an important
role in disciplining compensation. As a result, executives seek out low
salience channels of pay and other means of camouflaging their
compensation to minimize outrage and boost their own pay. We did
not argue that this managerial power view of executive pay should
replace the optimal contracting view, but that the two mechanisms
52. See Brian J. Hall, The Pay to Performance Incentives of Executive Stock Options 32
(Nat‘l Bureau of Econ. Research, Working Paper No. 6674, 1998), available at http://papers.
ssrn.com/sol3/papers.cfm?abstract_id=108563 (finding a ―bias toward valuing options according
[to] what they would be worth if exercised today‖).
53. See generally Lucian Arye Bebchuk et al., Managerial Power and Rent Extraction in the
Design of Executive Compensation, 69 U. CHI. L. REV. 751 (2002).

6b. Walker_PAGE 03292011.docx 3/29/2011 6:02 PM
2011] EXECUTIVE EQUITY COMPENSATION 629
likely coexist, providing relatively more or less explanatory power at
particular firms.
A managerial power view of executive pay can enhance our
understanding of the use of stock and options in several ways. For
example, I suggested above that public relations considerations might
explain the absence of in-the-money options. This is really a
managerial power story since explicitly discounted strike prices are
likely to be highly salient and create significant investor backlash.
Moreover, as I will discuss below, the reduction in option usage
following mandated expensing would be consistent with the
managerial power view if recognition of option pay as an expense
increases salience relative to footnoting the expense. Thus, while the
main thrust of this Article is to evaluate equity pay evolution against
an efficient contracting backdrop and to re-evaluate what efficient
contracting means in this context, I will consider alternative
managerial power explanations from time to time.
II. EMPIRICAL OBSERVATIONS
This Part describes current senior executive equity pay design
at S&P 500 firms and the evolution of equity pay over the last decade
and evaluates those practices and that evolution in light of the theory
discussed above. Specifically, this Part investigates (1) the evolution of
the composition of senior executive equity compensation, both in the
aggregate and on firm-by-firm basis; (2) differences among firms in
how executives are currently compensated; and (3) variations in
equity pay arrangements within the executive suites of individual
firms.54
Although non-equity compensation is discussed from time to
time to provide context, the focus of this analysis is on the use of stock
and options. My underlying assumption is that companies first decide
to compensate with equity and then decide whether the form of equity
pay should be restricted stock, performance shares, options, stock
appreciation rights, or some combination of these and similar
instruments.55 As discussed above, absent accounting considerations
or other constraints, efficient contracts should include the mix of stock
54. The ultimate source for the data analyzed is individual company proxy statements.
However, as discussed in the Appendix, most of the data is taken from S&P‘s Compustat
databases. See infra Appendix A.
55. This view is consistent with the process described in most large company proxy
statement disclosures regarding executive pay. See infra note 117 and accompanying text.

6b. Walker_PAGE 03292011.docx 3/29/2011 6:02 PM
630 VANDERBILT LAW REVIEW [Vol. 64:2:611
and options that best balances incentives and risks. Focusing
specifically on equity mix allows one to determine the extent to which
these choices vary from firm to firm and within the executive suites of
individual firms. An alternative mode of analysis that focused on the
incentive properties of an executive‘s entire compensation package
might miss patterns in equity pay practices that this study seeks to
illuminate.
Similarly, this analysis focuses largely on grants of equity
compensation rather than the portfolios of equity held by executives. I
recognize that the incentives created by an executive‘s existing
holdings of stock and options often outweigh those arising from the
latest year‘s compensation.56 However, I am looking for patterns in
grant practices that may or may not be driven by optimal contracting.
Moreover, as we will see, an examination of intra-firm variation in the
relative use of stock and options suggests that the extent to which
firms optimize new grants based on existing individual executive
portfolios is limited.57
A. Equity Pay Instruments Actually Observed
Although the utilization of various equity pay instruments has
evolved over the last decade, there has been no real change in the
fundamental building blocks. Consistent with tax and accounting
rules discouraging explicitly discounted options, observed equity pay
instruments fall into one of two discrete categories: (1) nondiscounted
option-like instruments; or (2) restricted stock and equivalent
instruments.58
In the analysis that follows, ―options‖ will include conventional
time-vested employee stock options, including both nonqualified stock
options and incentive stock options;59 performance-vested stock
56. See, e.g., Core et al., supra note 25, at 35–38.
57. See infra Part II.D.
58. For a more detailed overview of long-term executive incentive compensation practice at
large U.S. public companies, see FREDERICK W. COOK & CO., THE 2009 TOP 250: LONG-TERM
INCENTIVE GRANT PRACTICES FOR EXECUTIVES (2009).
59. The non-qualified and incentive labels applied to stock options refers to their federal
income tax treatment. See MYRON S. SCHOLES ET AL., TAXES AND BUSINESS STRATEGY: A
PLANNING APPROACH 191–95 (2d ed. 2001) (discussing option tax treatment). Although these
differences are important in some cases, given various limitations and current tax rates, the
large majority of options granted are non-qualified options. See Brian J. Hall & Jeffrey B.
Liebman, The Taxation of Executive Compensation, 14 TAX POL‘Y & ECON. 7 (2000) (estimating
that about five percent of options granted are incentive stock options).

6b. Walker_PAGE 03292011.docx 3/29/2011 6:02 PM
2011] EXECUTIVE EQUITY COMPENSATION 631
options, which add a performance criterion to vesting in addition to
the traditional retention criterion;60 and stock appreciation rights
(―SARs‖), which are contracts, payable in shares or cash, that are
economically equivalent to stock options. The large majority of options
issued by large U.S. corporations are conventional, time-vested
options. Frederick W. Cook‘s 2009 report on the pay practices of the
250 largest S&P companies indicates that eighty-six percent of
companies issuing options issued conventional, time-vested options,
eight percent issued SARs, and six percent issued performance-vested
options.61 As noted, the strike prices of almost all compensatory
options issued by U.S. corporations are set equal to the fair market
value of the company‘s stock on the date of the option grant. Cook‘s
survey reported no instances of options issued in the money in 2009
and only two percent of companies issuing out-of-the-money options.62
My own review of fiscal year 2007 proxy statements of fifty randomly
selected S&P 500 companies confirms the predominance of
conventional options. Ninety-six percent of options granted by the
sampled companies consisted of conventional at-the-money options.63
In the restricted stock category, we observe conventional time-
vested restricted stock that becomes nonforfeitable and unrestricted
once a period of continued employment has passed,64 performance-
vested restricted stock,65 and performance shares.66 Performance
Employee stock options generally become exercisable, or vest, in installments, often ratably
across the period beginning on the first anniversary of the grant and ending on the fourth
anniversary of the grant. See FREDERICK W. COOK & CO., supra note 58, at 13 (providing data
indicating vesting schedules of three to five years for ninety-eight percent of the executive stock
options analyzed). If employment is terminated prior to vesting, options generally are forfeited.
60. As an example, in 2007 the CEO of Home Depot received an option grant that only vests
if the company‘s share price exceeds the grant date price by twenty-five percent for thirty
consecutive trading days. See Home Depot, Proxy Statement (Form DEF 14A), at 32 (Apr. 11,
2008).
61. See FREDERICK W. COOK & CO., supra note 58, at 7, 18–23.
62. See id. at 7. Cook‘s 2009 survey omits the category of discounted options. Cook‘s 2008
survey reports no instances of companies granting discounted options since 2005. See FREDERICK
W. COOK & CO., THE 2008 TOP 250: LONG-TERM INCENTIVE GRANT PRACTICES FOR EXECUTIVES
(2008).
63. Data on file with author.
64. Restricted stock awards may vest in installments or ―cliff vest‖ on a single date. As in
the case of options, most senior executive stock awards vest on a three- to five-year schedule.
FREDERICK W. COOK & CO., supra note 58, at 13.
65. Performance-vested restricted stock is analogous to performance-vested options. For
example, in 2007 Moody‘s granted restricted stock to senior executives that vests relatively
slowly, or relatively quickly, depending on growth in the company‘s annual operating income. See
Moody‘s Corp., Proxy Statement (Form DEF 14A), at 24–25 (Mar. 19, 2008).

6b. Walker_PAGE 03292011.docx 3/29/2011 6:02 PM
632 VANDERBILT LAW REVIEW [Vol. 64:2:611
shares are economically equivalent to performance-vested restricted
stock.67 Participants in performance share plans are entitled to receive
shares (or the cash value equivalent) at the end of a specified period
(often three years), but the number of shares actually delivered is a
function of some measure of company performance, such as absolute
or relative return on equity or earnings growth.68 In the analysis that
follows, restricted stock (performance-vested or conventional) and
performance shares are referred to generally as ―stock.‖
There is more diversity in the design of stock awards than
options awards. In my hand-collected sample of 2007 S&P 500 proxy
statements, I found that forty-five percent of stock awards consisted of
conventional time-vested restricted stock, twenty percent consisted of
performance-vested restricted stock, and thirty-five percent consisted
of performance shares.69
B. Aggregate Increase in Stock and Decline in
Option Compensation
Over the last decade, there has been a marked reduction in
option compensation and an increase in stock compensation in the
executive suites of S&P 500 companies. The following figure describes
the aggregate contribution of stock options and stock to total senior
executive pay at a panel of 350 companies that were members of the
S&P 500 in 2008 and for which executive pay data is available from
66. Performance shares were formerly known as phantom stock. See, e.g., Eli Ofek and
David Yermack, Taking Stock: Equity-Based Compensation and the Evolution of Managerial
Ownership, 55 J. FIN. 3, 7 (2000).
67. The difference between the two devices is that restricted stock is granted at the time of
the award and is forfeited if the shares fail to vest, while performance shares are not issued until
performance criteria are met. But this difference is not significant economically. For example,
under either type of plan, participants may be entitled to dividends.
68. Northern Trust Corporation‘s fiscal year 2007 performance share awards are typical.
Each participant was assigned a target number of shares. If the company achieves average
three-year earnings per share (EPS) growth of 10 percent, 100 percent of the target shares will
vest at the end of three years. If EPS growth is between 8 percent and 10 percent, a fraction of
the shares will vest. If EPS growth exceeds 10 percent, a multiple of target shares, up to 125
percent at 12 percent average EPS growth, will vest. See Northern Trust Corp., Proxy Statement
(Form DEF 14A), at 46 (Apr. 15, 2008).
69. Data on file with author. As discussed supra note 47 and accompanying text,
deductibility of conventional time-vested restricted stock payouts may be limited under § 162(m)
of the Internal Revenue Code, but deductibility of conventional time-vested stock option payouts
generally is not limited. This difference likely explains the greater use of performance-vested
stock than performance-vested options.

6b. Walker_PAGE 03292011.docx 3/29/2011 6:02 PM
2011] EXECUTIVE EQUITY COMPENSATION 633
1993.70 As the figure indicates, at the peak of the dot-com bubble in
2000, options accounted for over sixty percent of the aggregate ex ante
value of senior executive pay at these companies; stock accounted for
about ten percent. In 2007, options accounted for twenty-five percent,
while stock accounted for thirty-three percent. Moreover, while the
contribution of option pay to ex ante compensation has risen and
fallen over the years, prior to 2002, stock had never accounted for
fifteen percent of total ex ante compensation. Preliminary data for
2009 suggest that the shift from options to stock continues. 71
70. The analysis was limited to the S&P 500 group of companies because of the labor
intensive process of determining total stock grants in the pre-2006 period. See infra Appendix A.
A panel approach was used to ensure that changes in aggregate compensation were not driven by
changes in the membership of the S&P 500. However, an analogous graph based on the equity
grants of the historic S&P 500 membership each year would be very similar.
71. As discussed in Appendix B, Compustat data for stock grants and total compensation is
not directly comparable before and after 2006. Appendix B describes how the data were adjusted
to increase comparability. Nonetheless, while the relative contribution of stock and options in
each period should be comparable, the absolute contributions of both to total compensation may
not be fully comparable pre-2006 and post-2007. Non-equity compensation includes salary,
annual bonuses, long-term incentive compensation that is not equity based, perquisites, and
other compensation such as earnings on deferred compensation that are treated as
compensation.

6b. Walker_PAGE 03292011.docx 3/29/2011 6:02 PM
634 VANDERBILT LAW REVIEW [Vol. 64:2:611
1. Explaining the Shift from Option to Stock
Compensation
The shift from a heavy emphasis on options and limited use of
stock compensation to a mix favoring stock represents a substantial
reduction in the average convexity of equity pay packages.72 What
accounts for the shift in emphasis? This Section considers the role
played by the economic determinants related to firm, market, and
employee characteristics, as well as other potential contributing
factors. The bottom line is that, while accounting treatment is a
leading suspect, it is very hard to disentangle the numerous
confounding factors causing this shift.
a. Firm and Market Economic Determinants
Although directionally consistent with the shift in emphasis
from options to stock over the last decade, it seems unlikely that
changes in firm or market fundamentals fully explain the shift. The
firm level fundamentals most commonly identified in the theoretical
and empirical literature as impacting the optimal mix of stock and
options include growth opportunities, risk, and leverage.73 As the
following chart describes, proxies for growth opportunities (price-to-
earnings ratios and market-to-book ratios) were somewhat greater for
the panel of companies whose compensation is described in Figure 3
for the period prior to the peak of the dot-com bubble, when option pay
dominated, than for recent years that have witnessed an aggregate
shift in favor of stock. Reduced growth opportunities would be
consistent with reduced reliance on options in the later period.74 My
proxies for leverage (ratio of long-term debt to total shareholder
equity) and risk (stock price volatility) were lower for the earlier
period, which again is consistent with decreased use of options in the
72. Because equity compensation in practice consists of binary combinations of stock and at-
the-money options, convexity is essentially a function of the option-heaviness of the equity pay
package; henceforth the terms ―option-heaviness‖ and ―convexity‖ will be used interchangeably.
73. See supra Part I.B.
74. In his comment on this Article, Some Thoughts on the Evolution of Executive Equity
Compensation, 64 VAND. L. REV. EN BANC (forthcoming 2011), Professor Herwig Schlunk
provides a much more sophisticated analysis of the change in perceived growth opportunities
based on changes in price/earnings ratios (―P/E‖) relative to the riskless return. His analysis
indicates that the reduction in perceived growth opportunities across the period is greater than
the simple analysis provided here would suggest. However, Schlunk does not argue that the
corresponding shift from option to stock compensation is evidence of optimal contracting. Rather,
he argues that the shift reflects managerial opportunism.

6b. Walker_PAGE 03292011.docx 3/29/2011 6:02 PM
2011] EXECUTIVE EQUITY COMPENSATION 635
later period since debt holders should prefer executives to take less
risk and executives should discount risky compensation more as
volatility increases.75
Figure 4
Weighted Average Fundamentals for Panel of
350 Large Companies76
1993–1997 2003–2007
Price/Earnings 21.2 18.1
Market/Book 4.9 4.0
Debt/Equity 0.33 0.39
Volatility 23% 25%77
However, the magnitudes of these differences, particularly the
difference in average volatility, are relatively modest, and the
differences depend heavily on the exact period of measurement and
the group of companies under observation. Perhaps some kind of
tipping point story could be told, but otherwise firm fundamentals do
not seem to tell the entire story.
There also has been some increase in volatility across the
period at the broader market level. Over the 1993–1997 period, the
Chicago Board Options Exchange Volatility Index averaged 15.5
percent; over the 2003–2007 period, the index averaged 16.1 percent.78
Again, however, while directionally consistent with an increasing
preference for stock over options, the four percent increase in market
75. Recall that increasing volatility increases the value of an option but also increases the
discount placed on an option by a non-diversified, risk-averse executive. See supra note 25 and
accompanying text.
76. All data is taken from the Compustat datasets. P/E is based on twelve-month trailing
basic earnings per share and reflects averages of quarterly data. M/B and D/E reflect averages of
annual data. D/E is defined as long term debt plus preferred stock divided by total shareholder
equity. Volatility is sixty-month average volatility as reported in the Compustat database and
utilized therein to calculate option values.
77. Volatility data is not reported after 2006, so the volatility figures for the latter period
are for the sixty-month period beginning on January 1, 2002 and ending December 31, 2006.
There has been a large increase in firm-level volatility over the last fifty years, but it is
difficult to account for the dramatic shift in equity design in the present decade based on that
long-term trend. See Diego Comin & Thomas Philippon, The Rise in Firm-Level Volatility: Causes
and Consequences 6 (Nat‘l Bureau of Econ. Research, Working Paper No. 11388, 2005).
78. Volatility index data is available at CBOE, http://www.cboe.com/data/Historical
Volatility.aspx (last visited Mar. 2, 2011).

6b. Walker_PAGE 03292011.docx 3/29/2011 6:02 PM
636 VANDERBILT LAW REVIEW [Vol. 64:2:611
volatility across the period seems much too small to account for the
dramatic shift in emphasis from option to stock compensation.
b. The Burst of the Dot-Com Bubble
Some of the reduction in option utilization post-2000 may
reflect a return to normalcy following the dot-com boom and crash.
There is no survivor bias to the data presented in Figure 3.
Technology firms that blossomed in the late 1990s and subsequently
fell out of the S&P 500 are excluded from the panel. Nonetheless, the
boom in the broader stock market and the options-based fortunes that
were being made in the technology industries undoubtedly had a
spillover effect on compensation design at large firms generally.
Options looked very attractive to executives as stock prices marched
upward during the 1990s, and irrational exuberance may have
contributed to pay packages consisting of seventy percent equity at the
peak.79
Of course, that perception reversed as prices began sliding. As
noted previously, risk aversion is the most frequently modeled
individual-level characteristic affecting the optimal convexity of pay
packages. While average stock price volatilities were not significantly
higher after the dot-com crash than before, the burst of the bubble
undoubtedly affected the perceived risk of options to executives, which
would have shifted optimal pay packages in the direction of stock or
cash.
c. Rebalancing Equity Portfolios
As many researchers have noted, in determining whether an
executive has the appropriate level and type of incentives, one should
look at the executive‘s entire equity portfolio, not simply a single
year‘s grant.80 The same principle applies in aggregate, and it is
conceivable that the shift from option-heavy to stock-heavy grants
after 2001 represents a rebalancing after several years of option-heavy
grants. It is somewhat difficult to explain the unprecedented increase
in stock compensation, but the shift is consistent with rebalancing to
maintain pay sensitivity to stock price while limiting sensitivity to
stock price volatility. A board could obviously reduce an executive‘s
exposure to stock price volatility by paying her with cash instead of
79. See supra Figure 3.
80. See, e.g., Core et al., supra note 25, at 154, 180.

6b. Walker_PAGE 03292011.docx 3/29/2011 6:02 PM
2011] EXECUTIVE EQUITY COMPENSATION 637
options, but doing so would also reduce the link between stock price
and executive wealth.
However, the longer the shift in favor of stock compensation
continues, the harder it will be to attribute that shift to temporary
rebalancing rather than to a new steady-state equilibrium, and we
may have already passed the point at which the rebalancing
explanation loses power. Options typically are exercised within five or
six years of grant,81 and the S&P 500 index rose steadily between 2003
and the middle of 2007, ultimately surpassing the 2000 peak, which
would have facilitated exercise of options granted in the late 1990s. It
is doubtful that a large overhang of options persists from the boom
years of the 1990s.
d. Options-Related Scandals
A number of scandals since 2000 may have increased the
negative connotations associated with options and encouraged firms to
deemphasize their use in equity pay packages. Options figured
prominently in the accounting scandals at Enron, WorldCom, and
Tyco. Although the causes of the malfeasance in these cases were
several, it was argued that option-heavy pay packages received by the
senior executives of these firms led them to manipulate financial
results and prop up share prices in the face of decaying business
fundamentals.82 In addition, in 2006, the Wall Street Journal brought
to light a wide ranging stock option backdating scandal that
dominated business page headlines for almost a year and ultimately
led to SEC investigation of over 100 U.S. companies.83 Although the
81. See J. Carr Bettis et al., Exercise Behavior, Valuation, and the Incentive Effects of
Employee Stock Options, 76 J. FIN. ECON. 446, 447 (2005) (finding for a sample of 140,000 option
exercises by executives at almost 4000 firms between 1996 and 2002 that, on average, options
were exercised a little over two years following vesting and more than four years prior to
expiration); Jennifer N. Carpenter, The Exercise and Valuation of Executive Stock Options, 48 J.
FIN. ECON. 127, 138 (1998) (finding for a sample of forty firms (mainly large manufacturers) that
executive stock options granted between 1983 and 1984 were, on average, exercised after 5.8
years); Steven Huddart & Mark Lang, Employee Stock Option Exercises: An Empirical Analysis,
21 J. ACCT. & ECON. 5, 20 (1996) (finding that the median fraction of option life elapsed at the
time of exercise ranged from 0.21 to 0.38 for options granted by seven public companies to a wide
range of employees).
82. See, e.g., Paul M. Healy & Krishna G. Palepu, The Fall of Enron, 17 J. ECON.
PERSPECTIVES 3, 13 (2003) (noting that ―[h]eavy use of stock option awards linked to short-term
stock price may explain the focus of Enron‘s management on creating expectations of rapid
growth and its efforts to puff up reported earnings to meet Wall Street‘s expectations‖).
83. Although credit for discovering backdating properly belongs to finance professor Erik
Lie, the scandal received public attention after it was exposed in the Wall Street Journal. See
Erik Lie, On the Timing of CEO Stock Option Awards, 51 MGMT. SCI. 802, 810 (2005) (providing

6b. Walker_PAGE 03292011.docx 3/29/2011 6:02 PM
638 VANDERBILT LAW REVIEW [Vol. 64:2:611
shift in emphasis from options to stock was largely accomplished by
the time the backdating scandal was revealed, the scandal may have
discouraged any rebound in option use with the recovery of the equity
markets in 2006 and 2007.
e. Dividend Pressure
The corporate scandals in the early 2000s may have caused
investors to increase the value placed on dividends. Steady dividends
can play a corporate governance role in checking empire building and
ensuring that reported earnings are real.84 The 2003 reduction in tax
rates for qualified dividend receipts also increased investor appetites
for dividends, relative to other means of distributing gains to
shareholders, and firms responded by increasing both regular and
special dividend payouts.85
An increased preference for dividends could have contributed to
the shift from option-heavy executive pay packages to more stock-
heavy packages. Holders of restricted stock typically receive
dividends, while options holders generally receive no credit for
dividends paid.86 As a result, paying a dividend can be contrary to the
interests of an executive who is holding options on a large number of
shares. Holdings of restricted stock, on the other hand, do not
discourage dividend payouts. In fact, dividends are a useful source of
liquidity for executives who are constrained by vesting requirements
or shareholding guidelines from disposing of the underlying shares.
Not surprisingly, numerous studies have demonstrated a negative
convincing evidence that options were backdated); Charles Forelle & James Bandler, The Perfect
Payday: Some CEOs Reap Millions by Landing Stock Options When They Are Most Valuable,
WALL ST. J., Mar. 18, 2006, at A1 (reporting evidence of option backdating to a broad
readership).
84. See generally RICHARD A. BREALEY ET AL., PRINCIPLES OF CORPORATE FINANCE (8th ed.
2005).
85. The Jobs and Growth Tax Relief Reconciliation Act of 2003 cut the top marginal federal
income tax rate applicable to dividends from thirty-five percent to fifteen percent. For evidence
on the impact on dividend payouts, see Jeffrey R. Brown et al., Executive Financial Incentives
and Payout Policy: Firm Responses to the 2003 Dividend Tax Cut, 62 J. FIN. 1935, 1935 (2007)
(reporting that thirty-five percent of S&P 1500 firms increased dividend payouts in 2003
compared with twenty-seven percent increasing payouts in the two prior years and that the rate
of firms newly adopting dividend programs increased from about one in one hundred in 2001 and
2002 to one in ten in 2003).
86. See Kevin J. Murphy, Executive Compensation, in 3 HANDBOOK OF LABOR ECONOMICS
2485, 2509–10 (Orley Ashenfelter & David Card eds., 1999).

6b. Walker_PAGE 03292011.docx 3/29/2011 6:02 PM
2011] EXECUTIVE EQUITY COMPENSATION 639
association between option holdings and dividend payouts,87 and
Jeffrey Brown, Nellie Liang, and Scott Weisbenner have shown that
executives with greater stock ownership tended to increase dividends
following the 2003 tax cut while executives holding more options did
not.88 Sophisticated investors would have anticipated this
phenomenon and should have pushed for more stock and fewer options
in executive pay packages, consistent with the observed shift in
aggregate pay practices.89
f. Stock Option Accounting
In its December 2004 Statement of Financial Accounting
Standards (―SFAS‖) No. 123R, the FASB mandated ―fair value‖
accounting for options and other forms of equity compensation
effective for fiscal years beginning after June 15, 2005. For most
companies, the change was effective with the 2006 calendar and fiscal
year,90 and, as discussed above, the change largely eliminated
accounting preferences for at-the-money options over stock and
discounted options.
At first blush, the change in the accounting standard might
appear to have occurred too late to account for a shift in emphasis
from options to stock that began around 2002. But the change in
accounting rules was not a surprise. The FASB clearly signaled its
intention to revisit stock option accounting in 2002,91 and firms may
have realized that the momentum had shifted at the time of Enron‘s
2001 bankruptcy. Moreover, although the change in accounting rule
did not take effect until 2006, it had retroactive effect in requiring
that an expense be recognized for any previously granted option that
remained unvested. Thus, companies that were sensitive to the
accounting treatment of equity would have felt the new rule‘s impact
well before its effective date.
87. See, e.g., Christine Jolls, Stock Repurchases and Incentive Compensation (Nat‘l Bureau
of Econ. Research, Working Paper No. W6467, 1998) (finding that companies that rely heavily on
stock option compensation for executives are more likely than other firms to repurchase shares,
presumably as an alternative to paying dividends).
88. See Brown et al., supra note 85.
89. I thank Dhammika Dharmapala for this suggestion.
90. About seventy-five percent of S&P 500 firms have a fiscal year ending in December. See
generally STANDARD & POOR‘S 500 GUIDE (13th ed. 2010).
91. See Fin. Accounting Standards Bd., Invitation to Comment: Accounting for Stock-Based
Compensation: A Comparison of FASB Statement No. 123, Accounting for Stock-Based
Compensation, and Its Related Interpretations, and IASB Proposed IFRS, Share-based Payment,
FASB Index No. 1102–001 (Nov. 18, 2002).

6b. Walker_PAGE 03292011.docx 3/29/2011 6:02 PM
640 VANDERBILT LAW REVIEW [Vol. 64:2:611
On the other hand, it is entirely possible that causation runs in
the opposite direction. The FASB first seriously attempted to
rationalize equity compensation accounting in 1995 but was rebuffed
by corporate interests and congressional saber rattling.92 By 2004, the
shift from option to stock compensation may have reduced the
perceived cost of the accounting change to such an extent that,
combined with the scandals mentioned above, corporate and political
resistance to expensing option compensation were overcome. It is
likely that both stories are true to some extent. The shift away from
options probably facilitated revision of the accounting rules, and the
revision of the accounting rules further contributed to the shift from
options to stock.
Although it is difficult to disentangle the effects of accounting,
option-related scandals, and other factors, two recent studies have
concluded that changes in equity pay practices in the 2000s relate, at
least in part, to stock option expensing. Lawrence Brown and Yen-
Jung Lee found that reductions in option use following the
announcement of SFAS 123R were associated with the strength of
debt contracting concerns and other factors that proxied for a firm‘s
willingness to exploit the previous accounting treatment and with
reliance on option compensation generally.93 An association between
substantial reliance on option compensation and reduction in option
use, however, would seem to be equally consistent with a story of
firms moving away from options because of reputational concerns
following option-related scandals. Mary Ellen Carter, Luann Lynch,
and Irem Tuna found that firms that voluntarily began expensing
options prior to mandatory expensing reduced option use and
increased reliance on restricted stock.94 The authors recognized the
possibility that these companies might have first decided to shift from
options to stock and then to expense option grants.95 Their
examination of proxy statements supported the idea that changes in
92. See SFAS 123, supra note 40; Expensing Stock Options: Can FASB Prevail?
KNOWLEDGE@WHARTON, http://knowledge.wharton.upenn.edu/article.cfm?articleid=975 (last
visited Feb. 2, 2011) (―The last FASB effort to require an options-expense treatment, back in
1994, foundered in the face of political and industry opposition that threatened the Board‘s very
existence.‖).
93. See Lawrence D. Brown & Yen-Jung Lee, The Impact of SFAS 123R on Changes in
Option-Based Compensation (May 2007) (unpublished manuscript), available at
http://ssrn.com/abstract=930818.
94. See Mary Ellen Carter et al., The Role of Accounting in the Design of CEO Equity
Compensation, 82 ACCT. REV. 327 (2007).
95. See id. at 353.

6b. Walker_PAGE 03292011.docx 3/29/2011 6:02 PM
2011] EXECUTIVE EQUITY COMPENSATION 641
pay practices followed the expensing decision and not vice versa, but
they could not rule out reverse causation.96
2. What Does the Shift from Option to Stock Compensation
Tell Us About Efficient Contracting?
At the least, the recent shift from option to stock compensation
suggests that factors that are not widely discussed by economists—
financial accounting rules for equity compensation, option ―taint‖
resulting from corporate scandals, and/or a perception that option
compensation is riskier following the burst of a market bubble, despite
the fact that firm-level risk is essentially unchanged—play an
important role in compensation design. It seems unlikely that
fundamental changes in firm, market, or even individual risk
characteristics, as conventionally described, fully explain the shift.
To be sure, this evidence is not necessarily inconsistent with
share value maximizing contracting. Responsiveness to accounting
standards might be in the shareholders‘ interest if driven by debt
covenant concerns or other factors discussed in the positive accounting
literature. Also, responsiveness to option backlash in the financial
press or in Washington could be in the shareholders‘ interest. And
even if executive preferences or distastes for certain equity
instruments are irrational, adapting pay packages to exploit those
tastes might be in the shareholders‘ interest. This evidence does
suggest, however, that in order to conclude that executive equity pay
packages observed throughout the 1990s and 2000s were the product
of efficient contracting, our conception of efficient contracting would
have to be widened considerably beyond that currently in vogue.
C. Firm-to-Firm Variation in the Use of Stock and
Option Compensation
The overall trends in equity pay practices over the last decade
are instructive, but in order to gain a deeper understanding of the
forces shaping executive equity pay, this Section disaggregates the
data and examines the variation in equity pay design from firm to
firm. This Section focuses on the variation in the mix of stock and
options granted to executives in the late 1990s, prior to the dot-com
crash and rationalization of the stock option accounting rules, and
again in 2007 after the dust had settled (although perhaps
96. See id. at 354.

6b. Walker_PAGE 03292011.docx 3/29/2011 6:02 PM
642 VANDERBILT LAW REVIEW [Vol. 64:2:611
momentarily). We observe increased variation in the mix of stock and
options granted, but in both periods we also observe clustering of firms
at the extreme positions, that is, exclusive use of options or exclusive
use of stock, and in the latter period at a 50/50 mix of stock and
options. The high degree of clustering suggests that there may be
barriers to firms optimizing equity pay through combinations of stock
and options. In the 1990s, accounting rules may have created a
hurdle, but accounting rules cannot explain the clustering in recent
years.
1. 1997 Distribution
The distribution of the mix of stock and options granted to
panel firm executives in 1997 is portrayed in the following histogram.
The mix is defined as the ratio of the value of stock compensation
conferred to the total value of equity compensation conferred. Thus,
the ratio for an executive who received options, but not stock, would be
zero; the ratio for an executive who received stock, but not options,
would be one. The ratios for executives who received both stock and
options fall somewhere in between.97
97. Stock value is the value of the stock at grant with no adjustment for restrictions. Option
value is the Black-Scholes ex ante value as reported in Compustat. The x-axis labels in the figure
represent the midpoint of ratio ranges. For example, the eighty-nine observations at x-axis label
0.55 represent ratios greater than 0.50 up to and including 0.60.

6b. Walker_PAGE 03292011.docx 3/29/2011 6:02 PM
2011] EXECUTIVE EQUITY COMPENSATION 643
Sixty percent of panel firm executives who received equity
compensation in 1997 received an option grant but not stock. The
roughly four-to-one aggregate ratio of option compensation to stock
compensation for 1997 documented in Figure 3 did not result from
most executives receiving an option-heavy mix of both stock and
options, but from eight percent of executives receiving stock pay only
and another thirty percent receiving a varied mix of stock and options.
Although not apparent from Figure 5, the variation in equity
pay practices in 1997 took place largely at the firm level, rather than
at the individual executive level. Instances in which some executives
of a firm received stock or options only, while others received the other
instrument only, or a mix of stock and options, were the exception. For
example, fifty-two percent of the panel firms that granted equity pay
in 1997 issued options but not stock. To be sure, not all companies
issued equity to each senior executive each year,98 and some firms
might have granted stock in one year and options in another.
However, even when gauged over a broader period, many firms
98. Eighty-six percent of the executives at panel firms received some amount of equity
compensation during 1997.

6b. Walker_PAGE 03292011.docx 3/29/2011 6:02 PM
644 VANDERBILT LAW REVIEW [Vol. 64:2:611
limited themselves to providing exclusively option compensation in the
mid to late 1990s. For example, forty percent of panel companies
issuing equity to their senior executives over the 1996–1998 period
failed to grant a single share of restricted stock.
The pattern of the 1997 distribution is difficult to reconcile
with an efficient contracting story focusing solely on the conventional
economic determinants of equity pay design. While one can imagine
an environment in which growth opportunities, risk, leverage, and
other economic factors would lead a large majority of firms to rely
exclusively on options, in that scenario, one would expect a
distribution resembling the left side of a ―u‖ as the optimal package
would consist of options but not stock at the largest number of firms,
very option-heavy packages including some stock at the next largest
group of firms, and more balanced to stock-heavy packages at a
decreasing number of firms. Instead, in the mid to late 1990s, we
observe a uniform or perhaps normal distribution of mixed equity
grants seemingly appended to a large number of option-only
observations, as well as a smaller, but still significant, number of
stock-only observations.
The 1997 distribution suggests the existence of (at least) two
types of companies99: companies at which the equity compensation
menu consisted solely of options, and companies at which both stock
and options were on the menu. What would account for a large
number of companies limiting equity compensation to options? The
most obvious explanation would seem to be differing responses to the
inconsistent accounting treatment of stock and options under the old
rule, SFAS 123. Firms that viewed option expense footnoting as
equivalent to recognition should have selected the mix of stock and
options (including option-only or stock-only packages) that optimized
incentive creation and risk-bearing costs. On the other hand, firms
that considered compensation expense recognition to be more costly
than footnoting would have been more likely to forgo stock and rely
purely on option compensation. However, while accounting rules may
be a key part of the explanation, as the next subsection describes, we
continue to observe clustering in the distribution of stock and options
in the equity compensation mix even after the accounting playing field
99. A third possible type would be firms that limited equity compensation to stock.
However, the frequency of stock-only grants is more plausibly explained as censoring of the
distribution than is the frequency of option-only grants. See infra notes 103–07 and
accompanying text for more on the censoring possibility.
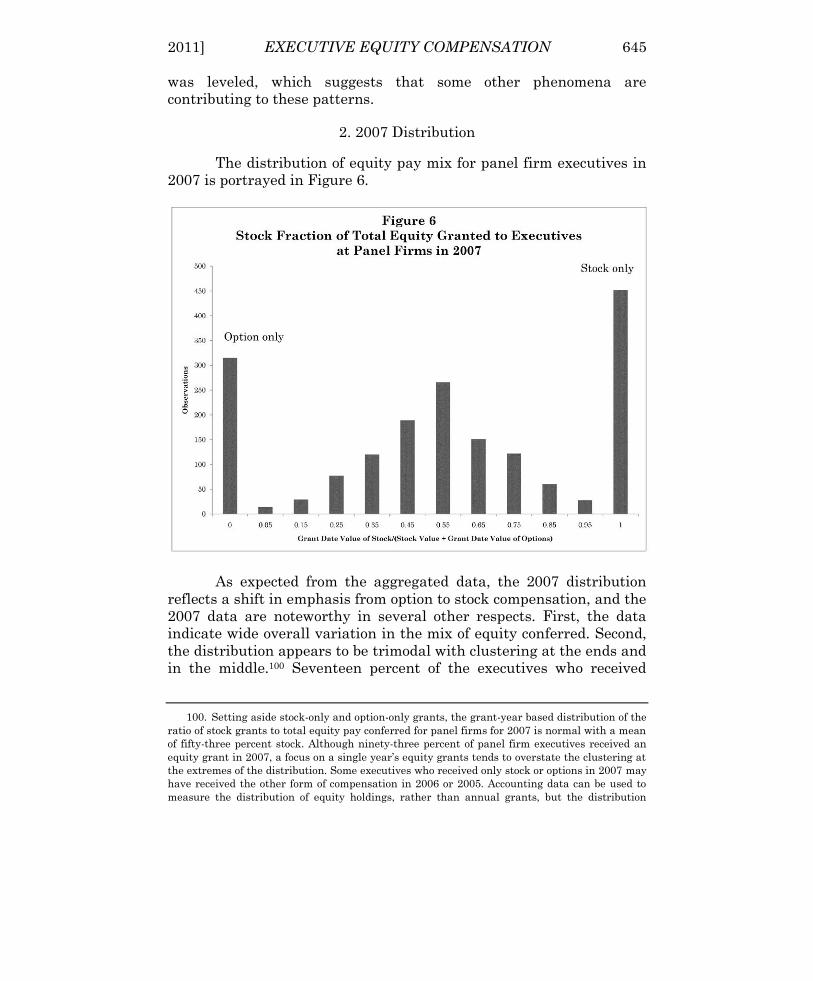
6b. Walker_PAGE 03292011.docx 3/29/2011 6:02 PM
2011] EXECUTIVE EQUITY COMPENSATION 645
was leveled, which suggests that some other phenomena are
contributing to these patterns.
2. 2007 Distribution
The distribution of equity pay mix for panel firm executives in
2007 is portrayed in Figure 6.
As expected from the aggregated data, the 2007 distribution
reflects a shift in emphasis from option to stock compensation, and the
2007 data are noteworthy in several other respects. First, the data
indicate wide overall variation in the mix of equity conferred. Second,
the distribution appears to be trimodal with clustering at the ends and
in the middle.100 Seventeen percent of the executives who received
100. Setting aside stock-only and option-only grants, the grant-year based distribution of the
ratio of stock grants to total equity pay conferred for panel firms for 2007 is normal with a mean
of fifty-three percent stock. Although ninety-three percent of panel firm executives received an
equity grant in 2007, a focus on a single year‘s equity grants tends to overstate the clustering at
the extremes of the distribution. Some executives who received only stock or options in 2007 may
have received the other form of compensation in 2006 or 2005. Accounting data can be used to
measure the distribution of equity holdings, rather than annual grants, but the distribution

6b. Walker_PAGE 03292011.docx 3/29/2011 6:02 PM
646 VANDERBILT LAW REVIEW [Vol. 64:2:611
equity grants in 2007 received options, but not stock. Twenty-five
percent received stock, but not options. Another twenty-five percent
received a mix composed of forty to sixty percent stock, by value.101
Third, the distribution of grants consisting of both stock and options is
normal and centered, roughly, at a 50/50 mix. Indeed, ten percent of
the mix observations fall within the center two percent of the range,
that is, forty-nine to fifty-one percent stock. Fourth, although it is not
apparent from this graph, most of the variation in mix is still
occurring at the firm level rather than at the individual level.
Thirteen percent of panel firms granted options but not stock to each
of their executives who received equity in 2007, and twenty percent of
firms granted stock but not options. In other words, the large majority
of observations at either extreme of the distribution reflect consistent
firm reliance on one form of equity compensation or the other.102
A distribution ranging from 100 percent at-the-money options,
through concurrent grants of stock and options, to stock-only grants,
could be consistent with economic theory predicting that market,
industry, and employee-level characteristics determine the optimal
convexity of equity pay packages. However, it is difficult to square a
trimodal distribution with the view that firms are optimizing equity
pay convexity through the selection of equity instruments. One way to
see this is to think of the x-axis in Figure 6 as the extent to which the
equity pay packages are in the money. The option-only observations
are essentially all at-the-money options. As one moves to the right, the
equity pay packages move increasingly into the money until they
become 100 percent in the money at restricted stock. Viewed in this
way, we see that nondiscounted equity pay packages are very popular,
modestly discounted packages are unpopular, significantly discounted
packages are quite popular, severely discounted packages are
unpopular, and maximally discounted packages are popular again.
based on accounting data remains censored or trimodal. Moreover, given the overall shift in
emphasis from option compensation to stock in recent years, accounting-based data may
overstate the extent to which firms are granting a mix of stock and options. Eli Lilly, for
example, consistently issued options to its senior executives through 2003. In 2004 through 2006,
it issued a mix of stock and options. In 2007 and since, it has issued stock exclusively.
Apparently, 2004 through 2006 were transition years. However, accounting data for 2007 and
later years continues to reflect mixed grants issued in 2004 through 2006.
101. The middle two columns of the histogram represent stock ratios ranging from just over
forty percent up to and including sixty percent.
102. The extent to which firms grant the same equity compensation mix to the various
members of the executive team is explored further in the following section. See infra Part
II.C.2.b.

6b. Walker_PAGE 03292011.docx 3/29/2011 6:02 PM
2011] EXECUTIVE EQUITY COMPENSATION 647
a. Censored or Truly Trimodal?
One possible explanation for this pattern is that the histogram
reflects not a true trimodal distribution but a severely censored
normal distribution with the ―tails‖ of the distribution cut off and
stacked up at the endpoints. Some censoring of the data would be
expected because the observed endpoints, 100 percent stock and 100
percent at-the-money options, are somewhat artificial.
Consider the option-only endpoint. Several theoretical studies
find that out-of-the-money options should be optimal in certain
situations,103 but these options are rarely observed. The paucity of out-
of-the-money options might be explained as the result of excessive
discounting of these options by recipients. There is evidence that
recipients overvalue strike price discounts associated with in-the-
money options.104 This effect may result from a salience bias.105 If
strike price discounts are highly salient, it would make sense that
strike price premiums would be as well. But in this case, salience
would have the opposite effect. Highly salient strike price premiums
would result in executives applying excessive discounts to out-of-the-
money options.106 If out-of-the-money options would be economically
optimal in some cases, but for irrational executive antipathy, their
absence might explain some clustering of observations at the (at-the-
money) option-only end of the distribution.
Stock-only grants lie at the other end of the equity pay
spectrum. Some clustering of observations at this end of the
distribution might be explained as follows: Per dollar of equity
compensation conferred, pay sensitivity to share price is reduced as
one moves from option-only packages to mixed stock and option
packages and then to stock-only packages. Further reduction in
sensitivity requires a reduction in the size of stock grants relative to
non-equity compensation. Thus, stock-only grants might reflect a
wider range of pay for performance sensitivities than mixed grants,
103. See supra notes 33–34 and accompanying text.
104. See Hall, supra note 52, at 32 (finding a ―bias toward valuing options according [to]
what they would be worth if exercised today‖).
105. On the salience bias, see generally A. Tversky & D. Kahneman, Availability: A Heuristic
for Judging Frequency and Probability, 5 COGNITIVE PSYCHOL. 207 (1973).
106. The managerial power model of the compensation-setting process explains the dearth of
out-of-the-money options as outrage management. In-the-money options would produce outrage
on the part of investors and the financial press. Nondiscounted options, whether at or out of the
money, are likely to produce similar investor and financial press response. If so, compensation
value per unit of outrage is maximized by granting options at the money. See Bebchuk et al.,
supra note 53.

6b. Walker_PAGE 03292011.docx 3/29/2011 6:02 PM
648 VANDERBILT LAW REVIEW [Vol. 64:2:611
and a distribution focused solely on the mix of stock and options might
censor a broader distribution of pay for performance sensitivity. If so,
however, we would expect that the proportion of executives receiving
stock-only grants who receive relatively modest amounts of equity
relative to non-equity pay would exceed the proportion of executives
receiving grants of both stock and options who received relatively
modest equity pay. The 2007 data provide only limited support for this
idea.107
Moreover, even if some censoring of the data is to be expected,
the question remains whether the frequency of option-only and stock-
only observations reflects only censoring, or whether we have a true
trimodal distribution of option-only, stock-only, and roughly equal
grants. Censoring alone does not seem likely to account for the large
amount of clustering of observations at 100 percent stock and 100
percent options relative to the normal curve in between. At the 100
percent option end of the spectrum, in particular, the rate of decline in
observations from the right suggests that any censored tail would not
be fat or long enough to account for the clustering that is observed.
Still another possibility is that the optimal distribution of
equity mix is actually U-shaped. The extreme position of 100 percent
options or 100 percent stock might be optimal for most firms. If so,
however, the normal distribution of mixed grants in between is exactly
inverted. No matter how it is sliced, the observed 2007 distribution is
hard to square with a view that firms are blending stock and option
grants to optimize the convexity of equity pay.
b. Explaining the Observed Distribution
i. Transaction Costs
The 2007 distribution of equity mix might be explained based
on transaction costs. If creating and administering both stock and
107. For twenty-two percent of the executives who received stock grants but not options in
2007, the value of the stock accounted for a relatively modest thirty percent or less of total
compensation. For executives receiving both stock and options, in only nine percent of the cases
did equity pay account for thirty percent or less of total compensation. However, executives who
received options but not stock were more likely than executives in either of the other two groups
to receive pay packages that were light on equity compensation. In thirty-one percent of these
cases, equity value accounted for thirty percent or less of total compensation. Thus, this data is
as or more consistent with the intuitive idea that firms that place relatively less emphasis on
equity pay are more likely to utilize a single pay instrument rather than both stock and option
pay than with truncation of equity mix at the stock-only end of the distribution. See infra
Appendix C.

6b. Walker_PAGE 03292011.docx 3/29/2011 6:02 PM
2011] EXECUTIVE EQUITY COMPENSATION 649
stock option programs is more expensive than maintaining only one or
the other, we would expect some firms, for which—transaction costs
aside—a mix of stock and option compensation would be optimal, to
limit themselves to a single form of equity pay. It would also make
sense that firms for which a 50/50 mix of stock and options would be
optimal would be more likely to overcome the transaction costs
involved in granting both stock and options than firms for which a
90/10 or 10/90 mix would be optimal. Thus, although there is no a
priori reason for positing a uniform distribution absent transaction
costs, a transaction cost story could explain the transformation of a
uniform distribution into the trimodal distribution with a normally
distributed center observed in the 2007 histogram.
I am skeptical that administrative costs play much of a role in
decisions to grant stock, options, or both. Drafting stock and option
plans and the documents used to administer these plans is routine
and should not be particularly expensive. Moreover, executives do not
seem to be shy about spending money on the design and
administration of their own compensation. Practitioners that I have
interviewed share my skepticism that administrative costs play an
important role in the design of executive compensation packages.
Other transaction costs could be more important. There is a
cost of complexity, and options are inherently complex. Executives
may not understand the relationships between share price, volatility,
and option value. Even with modifications, the Black-Scholes option
pricing model does not accurately value compensatory options.108
Restricted stock is much more transparent, but moves to tie vesting to
performance metrics add complexity to plain vanilla stock. Some
companies explicitly recognize the cost of complexity in their proxy
statement discussions of executive pay. In 2007, for example, Ford
Motor Company eliminated new grants of performance stock citing the
desire to ―remove[ ] a level of complexity from the annual equity grant
process.‖109
ii. Explanations Suggested by Proxy
Statement Disclosures
In their proxy statements, companies are required to describe
the processes by which executive compensation decisions are made
108. See Walker & Fleischer, supra note 37, at 424–26 (discussing inadequacy of the Black-
Scholes model for valuing long-term, non-transferable options).
109. Ford Motor Co., Proxy Statement (Form DEF 14A), at 39 (Apr. 4, 2008).

6b. Walker_PAGE 03292011.docx 3/29/2011 6:02 PM
650 VANDERBILT LAW REVIEW [Vol. 64:2:611
and the bases for these decisions.110 Examination of these disclosures
sheds some light on firm choices regarding equity pay instruments. Of
course, these disclosures should be taken with a grain of salt. They are
often written by lawyers rather than business people and contain a
fair amount of boilerplate language. Thus, it may not be surprising
that proxy statements reveal little indication that firms are focusing
on optimizing the convexity of equity compensation in issuing options,
stock, or a mix of the two.
A. Firms Issuing Solely
Stock or Options
As noted above, equity packages consisting solely of stock or
solely of options are not necessarily inconsistent with optimal
contracting. The corner solution may be the efficient equity pay ―mix‖
for these firms. For example, in its 2008 proxy statement, Exxon Mobil
said the company relies exclusively on restricted stock awards because
doing so ―supports a risk/reward profile that reinforces a long-term
view.‖111 Options, by implication, might incentivize excessive short-
term risk taking. In addition, some firms that grant stock exclusively
note the higher perceived value of stock to executives.112 This
explanation is in line with the suggestion in Part II.B that the
bursting of the dot-com bubble may have increased the perceived risk
of options to executives.
Other rationales cited by firms relying exclusively on stock as
equity compensation have less to do with optimizing incentives. Firms
grant stock to encourage retention,113 to allow executives to build an
ownership stake,114 or to introduce other performance metrics into the
equity pay process.115 But options that vest over time also encourage
retention and allow executives to build ownership, and firms that rely
exclusively on options sometimes cite these goals as well. The vesting
of restricted stock is more commonly tied to performance measures
110. See SEC Regulation S–K, Item 402, 17 C.F.R. § 229.402 (2010).
111. Exxon Mobil Corp., Proxy Statement (Form DEF 14A), at 23 (Apr. 10, 2008).
112. See, e.g., Consol. Edison Inc., Proxy Statement (Form DEF 14A), at 26 (Apr. 11, 2008);
Lennar Corp., Proxy Statement (Form DEF 14A), at 20 (Mar. 7, 2008).
113. See, e.g., Pinnacle W. Capital Corp., Proxy Statement (Form DEF 14A), at 19 (Apr. 10,
2008); Verizon Commc‘ns Corp., Proxy Statement (Form DEF 14A), at 26 (Mar. 17, 2008).
114. See, e.g., Bemis Co., Proxy Statement (Form DEF 14A), at 18 (Mar. 19, 2008).
115. See, e.g., Progress Energy Inc., Proxy Statement (Form DEF 14A), at 27 (May 14, 2008);
Int‘l Paper Co., Proxy Statement (Form DEF 14A), at 52 (Apr. 8, 2008).

6b. Walker_PAGE 03292011.docx 3/29/2011 6:02 PM
2011] EXECUTIVE EQUITY COMPENSATION 651
than option vesting, but there is no inherent reason that this should
be the case.
Switching from options to stock reduces the number of shares
that must be granted per dollar of compensation cost, and managing
shareholder dilution is sometimes listed as a rationale for granting
equity in the form of stock.116 While plausible enough, this shareholder
relations consideration has nothing to do with optimizing incentives.
Finally, some firms note that reliance on stock is related to managing
compensation expense for accounting purposes,117 which simply seems
to be an acknowledgement that options are no longer ―free‖ from an
accounting perspective.
Companies that rely exclusively on options as equity pay often
cite as goals attracting and retaining executives and aligning their
goals with those of shareholders,118 although retention seems to be
emphasized less and shareholder alignment emphasized more by
these firms relative to stock-focused companies. These companies
often note that options provide value to executives only if share prices
increase,119 which is true descriptively, but is not much of an
explanation for granting all equity pay in the form of options.
B. Firms Issuing Both
Stock and Options
The proxy statement disclosures of companies granting both
stock and options suggest that these companies tend to view the
instruments as serving different purposes. Conventional time-vested
restricted stock, which has value as long as the firm is solvent, is often
described as a retention tool or a means for executives to build a stake
in their companies.120 Options are described as a means of placing
value at risk or of tying compensation to shareholder gains.121
116. See, e.g., Verizon Commc‘ns Corp., Proxy Statement (Form DEF 14A), at 25 (Mar. 17,
2008); Lennar Corp., Proxy Statement (Form DEF 14A), at 20 (Mar. 7, 2008).
117. See, e.g., Unisys Corp., Proxy Statement (Form DEF 14A), at 24 (June 18, 2008); Lennar
Corp., Proxy Statement (Form DEF 14A), at 20 (Mar. 7, 2008).
118. See, e.g., Analog Devices, Proxy Statement (Form DEF 14A), at 27 (Feb. 6, 2008); U.S.
Bancorp, Proxy Statement (Form DEF 14A), at 22 (Mar. 4, 2008); Ecolab Inc., Proxy Statement
(Form DEF 14A), at 29 (Mar. 19, 2008).
119. See, e.g., U.S. Bancorp, Proxy Statement (Form DEF 14A), at 22 (Mar. 4, 2008);
Schlumberger Ltd., Proxy Statement (Form DEF 14A), at 22 (Feb. 29, 2008).
120. See, e.g., Mattel, Inc., Proxy Statement (Form DEF 14A), at 37 (Apr. 24, 2008); Int‘l
Game Tech., Proxy Statement (Form DEF 14A), at 25 (Feb. 27, 2008).
121. See, e.g., Mattel, Inc., Proxy Statement (Form DEF 14A), at 37 (Apr. 24, 2008); Int‘l
Game Tech., Proxy Statement (Form DEF 14A), at 25 (Feb. 27, 2008).

6b. Walker_PAGE 03292011.docx 3/29/2011 6:02 PM
652 VANDERBILT LAW REVIEW [Vol. 64:2:611
This is not to say that firms that grant both stock and options
do so independently. According to proxy statements, these firms
generally determine the ex ante value of equity compensation they
plan to confer on executives and then divide that value between equity
instruments with a view towards balancing the goals of retention and
incentive generation.122 As noted above, ten percent of mixed grants of
stock and options in 2007 were an almost exact 50/50 mix by ex ante
value. There is no reason to think that a 50/50 mix would hit some
sort of convexity sweet spot, but once the viewpoint shifts to balancing
the use of complex equity instruments serving differing, although
complementary purposes, it is not surprising that this sort of rough
balancing takes place. In fact, it is perfectly consistent with the naïve
diversification heuristic discussed in the next subsection.
iii. Mixed Equity Grants and the Naïve
Diversification Heuristic
As Shlomo Benartzi and Richard Thaler describe the naïve
diversification heuristic, ―when asked to make several choices at once,
people tend to diversify,‖ and the allocations tend to take the form of
1/n, that is, equal allocation among the range of choices.123 In an
experiment on retirement savings, participants offered an investment
menu including one bond fund and one stock fund tended to select a
50/50 allocation.124 More interesting and surprising is Benartzi and
Thaler‘s finding that when given a choice of several stock funds and
one bond fund, allocations to stocks increased, and when given a
choice between several bond funds and one stock fund, allocations to
bonds increased, all of which is consistent with 1/n allocation.125
Although the data is not quite so clean, these patterns also
appear in allocations of executive equity pay into stock and options. As
noted above, ―stock‖ compensation can and does take the form of
conventional time-vested restricted stock, performance-vested
restricted stock (which is actually time and performance vested), and
122. See, e.g., Mattel, Inc., Proxy Statement (Form DEF 14A), at 37 (Apr. 24, 2008) (dividing
value equally into stock and options); Coca-Cola Co., Proxy Statement (Form DEF 14A), at 39
(Mar. 3, 2008) (allocating sixty percent of value to options and forty percent to stock); Kimberly
Clark Corp., Proxy Statement (Form DEF 14A), at 43 (Mar. 4, 2008) (dividing equally into time-
vested restricted stock, performance-vested restricted stock, and options).
123. Shlomo Benartzi & Richard H. Thaler, Naïve Diversification Strategies in Defined
Contribution Savings Plans, 91 AM. ECON. REV. 79, 80 (2001).
124. See id. at 82 (reporting that thirty-four percent of respondents chose an exact 50/50 mix
and, on average, allocated fifty-four percent of funds to the stock fund).
125. Id.

6b. Walker_PAGE 03292011.docx 3/29/2011 6:02 PM
2011] EXECUTIVE EQUITY COMPENSATION 653
performance shares, which are contractual arrangements that are
equivalent economically to performance-vested restricted stock. Each
of these tools is available to every public company as are variants on
conventional time-vested options, although option variants are much
less frequently observed.
Beginning in 2006, all forms of stock compensation are coded
as a single category in Compustat, which limits analysis, but prior to
that year, conventional time-vested restricted stock and performance-
vested restricted stock were coded as ―restricted stock‖ and
performance shares were coded as a separate category. Thus, for 2005
and prior years, one can identify and analyze the division of equity
pay into three categories—two classes of stock and options.
Of 1,898 executives included in this study for 2005, 640
received a grant of restricted stock and options in that year but no
performance shares. One hundred sixty-four received a grant of
performance shares and options but no restricted stock. In total, 804
executives received restricted stock or performance shares, but not
both, and options. For these executives, options represented fifty-three
percent of ex ante equity pay, on average. For firms that made a
decision to divide equity pay between two instruments—one form of
stock and options—the allocations were distributed around a roughly
50/50 mix, which is consistent with naïve diversification.126
However, 144 executives received a grant of restricted stock,
performance shares, and options in 2005. For these executives, who
received three equity instruments, options represented only thirty-two
percent of total equity pay, on average. The difference in option use
between these two sets of companies is puzzling from an optimal
contracting perspective. Performance shares, time-vested restricted
stock, and performance-vested restricted stock have essentially the
same effect on incentive generation and risk-bearing costs.127 Thus,
126. Given Compustat‘s coding practices, we cannot know whether ―restricted stock‖ grants
in 2005 consisted of conventional, time-vested restricted stock or of performance-vested
restricted stock, and it is possible that some executives received both. Given the relative scarcity
of performance-vested restricted stock, however, we can safely assume that cases in which firms
made grants of both time-vested restricted stock and performance-vested restricted stock were
few.
127. To be sure, performance shares and performance-vested restricted stock can provide an
element of optionality that is not present in conventional time-vested restricted stock. If
minimum performance targets are not met, the stock is lost. Generally, however, plans provide
for a range of performance targets and payouts and cap payouts on the high side as well, so the
asymmetric payouts that are achievable with options generally are not achievable with
performance shares or performance-vested stock. The 2005 data suggest that firms consider
performance shares and restricted stock to be roughly equivalent. When paired singly with

6b. Walker_PAGE 03292011.docx 3/29/2011 6:02 PM
654 VANDERBILT LAW REVIEW [Vol. 64:2:611
they should substitute for each other within an optimized pay
package, but not substitute for options. Instead, we see that when
three instruments are employed, option utilization falls, on average, to
one-third, which is consistent with 1/n naïve diversification.
A possible explanation for this data—which is consistent with
optimal contracting theory—is that the second stock instrument
replaced non-equity compensation. That is, some companies might
have decided to replace cash-based incentive pay with performance
shares. In this story, firms that adopted the second stock instrument
would maintain conventional stock and option grants, but as a fraction
of equity pay granted, option use would decline. However, the evidence
does not support this alternative hypothesis. For the 804 executives
who received one form of stock compensation, option pay represented
twenty-eight percent of total compensation; whereas options
accounted for only nineteen percent of total pay for executives who
received two forms of stock. It seems clear that the issuance of a
second stock instrument displaced option use consistent with 1/n
diversification among equity instruments.128 This data is summarized
in the following figure.
options, restricted stock constituted forty-six percent of the mix, on average, while performance
shares constituted forty-eight percent of the mix, on average.
128. Similarly, the inclusion of a third equity compensation instrument did not appear to
increase total compensation. Among executives receiving two equity instruments, mean total ex
ante compensation was $5.4 million ($11.6 million for CEOs only); among executives receiving
three instruments, mean total ex ante pay was $5.2 million ($10.7 million for CEOs only).

6b. Walker_PAGE 03292011.docx 3/29/2011 6:02 PM
2011] EXECUTIVE EQUITY COMPENSATION 655
Although the evidence seems compelling, it is unclear why
sophisticated directors advised by experienced compensation
consultants would fall victim to the naïve diversification heuristic.
Further research is needed on this question. Here I can only speculate.
One possibility might be that the complexity of compensation schemes
leads consultants and directors to focus on the technical differences
between equity instruments, rather than their economic similarities,
which in turn leads to naïve diversification.
iv. Other Contributors to the 2007 Distribution of
Equity Mix
Several other factors may play a role in generating the
trimodal distribution of equity mix observed in recent years, or
portions of it. Although the issuance of both stock and options might
represent optimization of incentives and risk-bearing costs, grants of
multiple equity instruments could also represent an effort to reduce

6b. Walker_PAGE 03292011.docx 3/29/2011 6:02 PM
656 VANDERBILT LAW REVIEW [Vol. 64:2:611
transparency and the salience of individual elements of executive pay
in accordance with the managerial power model of the pay-setting
process.129
Along the same lines, but perhaps less nefariously, the recent
requirement that companies expense options may have removed an
obstacle to non-option equity compensation at some firms. Once the
accounting playing field was leveled, these firms gained access to a
new compensation tool—restricted stock—but they weren‘t forced to
abandon their old tools. As we have seen over the years, executive
compensation instruments have a tendency to multiply. The advent of
options, for example, did not totally displace non-equity incentive
compensation. Obviously, if stock pay is treated as an add-on, one
would see more mixed grants.
Alternatively, perhaps consultants profit from proposing more
complex arrangements. Companies employing compensation
consultants are less likely to rely exclusively on stock or exclusively on
options in granting equity pay than are companies that go it alone,130
but it is possible that the decision to hire a consultant follows from the
decision to adopt a more complex pay arrangement rather than the
reverse.131
Finally, one might think that executive equity mix would vary
by industry or perhaps by headquarters location. But the data reveal
few obvious industry patterns, and a recent study of option plans
suggests that headquarters location is unlikely to impact the design of
executive compensation.132
3. Firm-to-Firm Variation in Equity Mix—Summary
Increased variation in executive equity pay mix in recent years
may represent a move in the direction of optimal contracting, but the
129. See supra Part I.D (discussing the managerial power view of the compensation-setting
process).
130. Of thirty-one S&P 500 companies that did not utilize a compensation consultant in
2007, fifteen (forty-eight percent) issued stock or options exclusively or almost exclusively (over
ninety-five percent) to their senior executives in 2006 and 2007. Less than twenty-five percent of
companies that employed a consultant relied exclusively or almost exclusively on stock or
options. This difference is statistically significant at the one percent level. Data on file with
author.
131. Ruth Bender, Paying For Advice: The Role of the Remuneration Consultant in U.K.
Listed Companies, 64 VAND. L. REV. 361, 368–69 (2011).
132. Kedia and Rajgopal have recently found that headquarters location explains variation
in broad-based option plans, but the authors found no evidence that location affected senior
executive options plans. See Simi Kedia & Shiva Rajgopal, Neighborhood Matters: The Impact of
Location on Broad Based Stock Option Plans, 92 J. FIN. ECON. 109, 125 (2009).
6b. Walker_PAGE 03292011.docx 3/29/2011 6:02 PM
2011] EXECUTIVE EQUITY COMPENSATION 657
clustering of grants at 100 percent stock, 100 percent options, and a
roughly 50/50 mix suggest significant limits to that optimization.
While various transaction costs likely influence the observed patterns,
decisionmaking in accordance with the naïve diversification heuristic
may be particularly helpful in explaining the distribution of mixed
equity grants.
D. Within-Firm Variation in Equity Pay Packages
Although we observe significant variation in recent years in the
relative weight of stock and options in equity pay packages looking
across S&P 500 firms, variation in the packages provided to the senior
executives of a given firm generally is limited. The various members of
the executive suite typically receive differing levels of equity
compensation, but more often than not, the fraction of stock and
options in these packages is the same. This ―lockstep‖ grant behavior
is more common among firms issuing solely stock or options, but it is
frequently observed even in cases in which executives receive both
stock and option grants in the same year. The limited degree of
individualization may be surprising given the emphasis on individual
risk characteristics in the optimal contracting literature.133
1. Economic Theory and Individualization
As discussed above, the optimal convexity or mix of stock and
options in executive pay packages should be a function of market,
firm, and individual characteristics. Absent transaction costs,
optimizing firms would be expected to tailor equity pay packages for
individual executives and/or specific executive roles. Individual risk
preferences, current holdings of stock and options, and individual
scope to influence share price would all play a role. As we have seen,
the theoretical literature on equity compensation focuses heavily on
individual risk characteristics. Tian, for example, finds that the
optimal equity package ranges from restricted stock to at-the-money
options depending on the degree to which the recipient is risk
averse.134
133. The limited degree of individualization will not be surprising to practitioners. The
primary aim of this section is to describe intra-firm grant practices and offer thoughts on why we
do not observe a higher degree of individualization of equity mix. I do not mean to make any
claims regarding the ―right‖ level of individualization in the presence of transaction costs and
other limitations.
134. See Tian, Contracting, supra note 31, at 32.

6b. Walker_PAGE 03292011.docx 3/29/2011 6:02 PM
658 VANDERBILT LAW REVIEW [Vol. 64:2:611
The empirical literature takes individual factors into account
as well.135 For example, Core and Guay find that firms actively
manage the level of new CEO equity incentives in response to
deviations between existing incentives and optimal incentives.136
Unless executives at particular firms maintain their equity holdings
in lockstep, one would expect variation in new grants based on the
individualized equity portfolios of the executives. In terms of specific
executive roles, one might imagine that, all else being equal, heads of
research and development or technology should receive relatively
option-heavy pay packages to encourage risk taking, while chief
operating officers should receive relatively stock-heavy packages
reflecting their greater focus on near-term performance.
2. In Practice, Individualization of Equity Mix Is Limited
a. S&P 500 Data
An examination of recent grants of stock and options to
executives indicates that individualization is not the norm. In
analyzing the degree to which stock and options are granted in
lockstep fashion, I focused on grant-year data for the entire
membership of the S&P 500 for the years 2006 and 2007, and I
retained data for the top five executives for each firm-year for
comparability.137 This left me with complete data for 943 firm-years. I
defined lockstep grants as follows: for executives receiving only stock
(or only options) in a year, the grant was in lockstep if any of the
executive‘s colleagues received only stock (or only options). For
executives receiving a mix of stock and options, grants received by two
or more executives were considered to be in lockstep if the standard
deviation of the percentage of stock in each executives grant was less
than one percent.138
135. See supra notes 35–36 and accompanying text.
136. Core & Guay, supra note 35, at 152–54.
137. I am principally interested in within-firm variation in recent years (given much greater
inter-firm variation) and thus there was no reason to limit my analysis to the panel of firms for
which data is available back to 1992.
138. The one percent standard deviation cutoff is arbitrary, but is meant to count as lockstep
cases with minor deviations in the mix of stock and options granted resulting from rounding the
number of shares in equity grants or from grants occurring on different dates. For example, the
five top executives of Assurant, Inc. received grants of both stock and options for 2006. Assurant,
Inc., Proxy Statement (Form DEF 14A), at 22 (Apr. 12, 2007). The ratios of the values of their
stock grants to the sums of those values and the values of their option grants were 21.9 percent,
20.4 percent, 21.4 percent, 20.9 percent, and 22.5 percent, with a standard deviation of 0.9

6b. Walker_PAGE 03292011.docx 3/29/2011 6:02 PM
2011] EXECUTIVE EQUITY COMPENSATION 659
The frequency of equity grants made in lockstep is detailed in
the following figure.
Seventy-eight percent of the executives who received an equity
grant in 2006 or 2007 received their grants in lockstep with one or
more colleagues. Thirty-nine percent of grants were made in complete
lockstep, that is, each member of the executive team received the same
mix of stock and options. However, the likelihood of receiving a grant
in lockstep was not uniform across the distribution of grants. Ninety-
five percent of the executives who received solely stock in 2006 or 2007
had one or more colleagues who also received stock but not options in
that year, and sixty-two percent of stock-only grants were made in
complete lockstep. Ninety-six percent of the executives who received
solely options in 2006 or 2007 had one or more colleagues who also
received options but not stock in that year, and sixty-two percent of
option-only grants were made in complete lockstep. But lockstep
percent. This spread in ratios is at the high end of what was considered to represent a lockstep
grant. To provide further context, the one percent standard deviation cutoff is about five percent
of the standard deviation of the stock percentage (nineteen percent) for the entire population of
1,064 executives who received a mix of stock and options.
6b. Walker_PAGE 03292011.docx 3/29/2011 6:02 PM
660 VANDERBILT LAW REVIEW [Vol. 64:2:611
grants of a combination of stock and options were also common. Sixty-
five percent of the executives who received both stock and options in
2006 or 2007 received a ratio of stock to options that was essentially
the same as that received by one or more colleagues in that year, and
twenty-one percent of mixed stock and option grants were made in
complete lockstep, that is, with each member of the executive team
receiving the same ratio of stock and options that year.
b. Proxy Statements
Frequent readers of the executive compensation sections of
proxy statements will not be surprised by the high degree of lockstep
equity grant behavior. Companies commonly describe a process
through which they determine the individualized value of equity pay
to be granted to each executive, and then describe either a firm-wide
or executive suite-wide decision to grant equity to participants in the
form of stock, options, or a specific mix of stock and options.139 There
are exceptions. In 2007, for example, McGraw-Hill‘s CEO received a
more option-heavy equity pay package than his subordinates, which
the compensation committee explained as follows:
We believe that the CEO should have a greater portion of long-term incentive
compensation tied to stock options to provide greater upside and downside leverage
based on share price performance. If our share price performance fails to result in an
increase in the value delivered to our shareholders, we believe the equity gains realized
by the CEO should have greater alignment with this outcome than the other named
executive officers.140
The McGraw-Hill approach matches the prediction of finance
researchers, but it represents the exception, not the norm. Why don‘t
more firms individualize equity mix?
3. Explaining the Limited Individualization of Equity Mix
a. Transaction Costs
Transaction costs could play two roles in encouraging lockstep
equity grant behavior. First, to the extent that transaction costs,
including the cost of complexity, result in companies relying
exclusively on a single equity instrument, lockstep ―mix‖ follows
inevitably. Second, even in cases in which companies decide to grant
both stock and options, informational barriers—principally the costs of
139. See, e.g., supra notes 111–15 and accompanying text.
140. McGraw-Hill Cos., Proxy Statement (Form DEF 14A), at 30 (Mar. 20, 2008).

6b. Walker_PAGE 03292011.docx 3/29/2011 6:02 PM
2011] EXECUTIVE EQUITY COMPENSATION 661
collecting and verifying data on individual characteristics—may
render individualization of equity packages inefficient. In order to
individualize effectively, a company would need information on each
executive‘s risk aversion, holdings of company equity and other
wealth, etc. This data gathering would be costly and imperfect, and, as
noted below, executives might have an incentive to conceal certain
information.
On the other hand, a great deal of information that would be
useful in individualizing equity mix is readily available and
objectively determinable. Most firms already keep track of executive
holdings of employer equity as a result of shareholding guidelines. An
executive‘s position within the firm is transparent, as is his age. It
would seem that using these factors alone, firms could improve upon
lockstep grants of equity mix. The stated policies of some firms not to
consider existing equity holdings when determining new equity grants
further undermine the notion that transaction costs prevent
individualization, although these comments could reflect
rationalization more than affirmative policy.141
b. Signaling Issues
In order to fine tune equity mix, firms would need to take
executive risk aversion into account, but because risk aversion is not
objectively verifiable, an executive who reveals a high degree of risk
aversion could undermine his career prospects.142 Suppose, for
example, that a firm offered executives a menu of equally valued
equity pay packages ranging from 100 percent restricted stock,
through a mix of stock and options, to 100 percent options. Although
the pure stock package would be relatively more valuable to a highly
risk-averse executive (and the package would be more efficient),
accepting that package might be read as revealing a lack of confidence
in the firm‘s outlook or in an executive‘s own abilities, rather than
inherent risk aversion. 143
141. See, e.g., Gen. Dynamics Corp., Proxy Statement (Form DEF 14A), at 18 (Mar. 21, 2008)
(―[A]s a matter of principle, we do not consider the value of past equity grants when determining
current compensation. Our responsibility in setting compensation is to ensure that the value of
the equity grants, at the time they are received, is reasonable.‖).
142. The economic literature on signaling posits that inferences can be drawn from choices
that have differing costs for differing types. See Michael Spence, Job Market Signaling, 87 Q.J.
ECON. 355, 358–59 (1973).
143. Of course, a high degree of inherent risk aversion might in itself be incompatible with
certain executive roles in certain industries (e.g., chief development officer of a high tech
company), while in other cases it might be viewed as a plus (e.g., COO of a utility company). This

6b. Walker_PAGE 03292011.docx 3/29/2011 6:02 PM
662 VANDERBILT LAW REVIEW [Vol. 64:2:611
Again, however, many of the individual factors that should play
a role in optimizing equity mix—such as an executive‘s age, position
within the firm, and existing equity holdings—are objectively
determinable and thus present much less of a signaling concern. The
fact that an executive nearing retirement would prefer safer stock to
riskier options should not signal a lack of confidence (or should
produce a weaker signal). Moreover, a highly risk-averse executive
may be able to reduce the negative signals sent by selecting a
relatively safe equity pay package by demonstrating that his non-firm
financial decisions are equally conservative. In sum, there would seem
to be plenty of room to increase individualization even taking into
account signaling concerns.
c. View that Individualization Is Less Important than
Consistent Team Incentives
Another possible explanation for lockstep equity grants is that
perceived benefits of uniform equity pay design offset the potential
gains from individualization. Although executives have distinct
primary roles within a company that might suggest differing
incentives, many proxy statement disclosures stress the importance of
uniform incentives that ensure that each executive is focused on the
same team goals. Coca-Cola‘s 2008 proxy statement notes that the
company uses ―the same combination of stock options and [stock] for
all employees who are eligible for long-term equity compensation. This
is to ensure that all eligible participants are aligned against the same
objectives and priorities.‖144
Although ensuring commonality of interests has surface
appeal, this approach ignores two key facts. First, executives receive
differing amounts of equity pay, which throws off the alignment of
analysis assumes that a range of inherent risk aversion levels would be compatible with the job
role and that the information problem lies in distinguishing inherent risk aversion from low
skill.
At some companies executives are given a choice between receiving equity compensation in
the form of stock or options. See, e.g., Best Buy Co., Proxy Statement (Form DEF 14A), at 34–36
(May 12, 2008) (describing plan that allows senior executives to choose between equal value
packages including one-hundred-percent options, a 50/50 mix of restricted stock and options, and
two other combinations). Signaling aside, if the company set the price differential between the
two instruments in such a way that shareholders would be indifferent, providing executives with
a choice would seem to increase welfare. To my knowledge, however, very few companies employ
this approach, perhaps because of the potential negative signals sent by those who do not elect
option-heavy packages.
144. Coca-Cola Co., Proxy Statement (Form DEF 14A), at 39 (Mar. 3, 2008).

6b. Walker_PAGE 03292011.docx 3/29/2011 6:02 PM
2011] EXECUTIVE EQUITY COMPENSATION 663
risk-taking incentives. Second, executives come into the year holding
differing equity portfolios and differ in other ways (for example, pre-
dispositions, retirement horizons) that affect their overall risk
preferences. Given these differences, individualization of current
equity grants actually would be needed to avoid disparate risk
preferences within the executive team. This is not to say that uniform
equity mix is not a reasonable first approximation of the optimal
equity mix for each executive, but it can only be a rough
approximation.
Along the same lines, there may be morale-building value in
the rough sort of egalitarianism that follows from lockstep grants of
equity, that is, having everyone on the team receive the same mix of
stock and options (although, to be sure, the CEO generally gets a lot
more of both). In addition, lockstep grants of equity and all other
compensation elements would ensure that the ordinal ranking of total
compensation within the executive suite is preserved at least until the
equity pay vests.145 Suppose a firm made a restricted stock grant with
ex ante value of $1.2 million to the COO and an option grant with ex
ante value of $1 million to a senior VP and that salary, cash bonus
opportunities, and all other elements of their pay packages were made
in the same 1.2/1 ratio. It is quite possible that the senior VP‘s pay
package could be more valuable at vesting, potentially leading to a
disgruntled COO.
d. Naïve Diversification Heuristic
As discussed in the previous section, there is a tendency among
firms that utilize one form of stock pay and options to divide equity
grant value equally between the two instruments and among firms
utilizing two forms of stock and options to divide value equally among
the three instruments.146 These tendencies are more consistent with
the 1/n naïve diversification heuristic than with optimizing incentive
generation and risk-bearing costs. Of course, to the extent that firms
adopt this heuristic, there would be no reason to expect
individualization of equity pay mix.
145. I thank Dan Shaviro for this suggestion. The value of equity grants post-vesting would,
of course, depend on individual decisions regarding exercise. These decisions could disrupt the
ordinal ranking of compensation within the executive suite even if all compensation were
granted in lockstep. However, executives might reasonably view post-vesting gains and losses as
being personal and distinct from pre-vesting value changes.
146. See infra Part II.C.2.iii.

6b. Walker_PAGE 03292011.docx 3/29/2011 6:02 PM
664 VANDERBILT LAW REVIEW [Vol. 64:2:611
e. Self-Selection into Firms Obviates the Need
for Individualization
Still another possibility is that firms establish equity
compensation philosophies and that individual executives select firms
that suit their risk preferences. If that were the case, individualization
would be unnecessary. But this story seems implausible. As Figures 5
and 6 demonstrate, there have been dramatic shifts in equity design
over the last decade at most large public companies that would have
disrupted the alignment of individual and firm risk preferences, and
yet, there have not been equally dramatic increases in executive
turnover.147
4. Statistical Analysis of Intra-Firm Equity Grant Behavior
a. Lockstep Versus Non-lockstep Firms
Although some of these explanations for lockstep equity design
behavior appear to be testable, statistical analysis comparing a group
of thirty firms that individualized pay packages in 2006 and 2007 with
a group of almost 200 firms that granted stock, options, or a mix of the
two in lockstep revealed few significant differences. The data are
reported in the appendix. If informational costs tend to deter firms
from individualizing pay packages within the executive suite, one
might expect that firms that rely more heavily on equity pay or that
are larger and have greater resources would be more likely to bear
those costs and individualize. Individualizing firms did rely slightly
more heavily on equity in 2006/2007 (fifty-four percent of total
compensation consisted of equity versus fifty percent for lockstep
firms) and had greater sales, assets, and market capitalization, on
average, than the lockstep firms, but the differences were not
statistically significant.
The dearth of statistically significant results might reflect the
difficulty of clearly identifying lockstep and individualizing firms, the
paucity of firms that individualize, or the fact that individualization,
when it does occur, is driven by unique events that arise from time to
time at most firms, relating to executive turnover or similar events.
For example, the data indicate that individualizing companies
provided lower average returns to shareholders than lockstep
companies during the years immediately preceding the equity grants.
147. See infra Parts II.C.1–.2.

6b. Walker_PAGE 03292011.docx 3/29/2011 6:02 PM
2011] EXECUTIVE EQUITY COMPENSATION 665
It is conceivable that subpar performance led to increased executive
turnover at these firms, which tended to disrupt lockstep equity grant
behavior. In any event, the data appear to rebut any notion that
individualization is pervasive when it comes to the selection and mix
of equity instruments.
b. CEO Versus Non-CEO Equity Pay Mix
Even if information, signaling, or other transaction costs
preclude fine tuning of pay packages based on a particular individual‘s
characteristics or preferences, we might expect to observe systematic
variation in equity pay convexity based on primary executive role.
However, a comparison of CEO equity pay packages to those granted
to subordinate executives provided no evidence of systematic
variation.
CEO equity packages might be expected to be more option
heavy than packages delivered to subordinates for several reasons.
First, at most firms, CEOs have the greatest potential to impact share
price, which suggests that CEO pay should be most closely tied to
share price performance. Second, CEOs tend to have greater wealth
than their subordinates, which reduces the relative cost of risky
compensation. Finally, CEOs tend to hold more company stock than
their subordinates, which dampens a manager‘s appetite for taking on
firm-specific risk and increases the value of high-powered incentives
to shareholders.148 As noted above, McGraw-Hill‘s proxy disclosures
indicate that that company has adopted just such an approach in
determining equity pay mix.
The 2006 and 2007 S&P 500 data discussed above were used to
investigate this hypothesis. Obviously, in cases in which all five top
executives receive only one form of equity, CEO equity ―mix‖ is
identical to that of subordinates. However, even after eliminating
cases in which firms granted only options or only stock to their senior
executives, CEO equity pay packages were only three percent more
option heavy than subordinate packages, on average, and the
difference in means between the two populations was not statistically
148. This final factor is somewhat ambiguous, however, as increased shareholdings also
reduce the subjective value of high-powered incentives to the executive relative to their cost. See
Hall & Murphy, supra note 31, at 210–11 (finding that the value of at-the-money options to
executives relative to the cost to shareholders is ―decreasing in risk aversion, increasing in non-
firm-related wealth, and decreasing in holdings of company stock‖).
6b. Walker_PAGE 03292011.docx 3/29/2011 6:02 PM
666 VANDERBILT LAW REVIEW [Vol. 64:2:611
different from zero.149 This data provides no evidence that equity pay
packages granted to CEOs are systematically more option heavy than
those granted to subordinates.150
5. Intra-firm Variation in Equity Mix—Summary
Individualization of executive equity pay mix within executive
suites is not pervasive. To the extent that lockstep grants are
attributable to the naïve diversification heuristic or a simplistic view
that lockstep annual grants align team incentives, this behavior is
suboptimal. However, transaction costs may play a significant role.
Moreover, lockstep behavior is not necessarily in conflict with Core
and Guay‘s findings that firms take existing CEO equity holdings into
account in making new CEO grants. This evidence does not rule out
the possibility that firms optimize equity grants for the CEO and then
use the same equity mix below, but at a minimum the evidence
indicates that firms generally are not optimizing throughout the
executive suite in the manner Core and Guay suggest.
III. IMPLICATIONS
The preceding Parts focused on several phenomena that cause
us to question whether equity pay packages are optimally designed or
to re-evaluate what efficient contracting means in this context,
including the dramatic shift in emphasis from options to stock in the
2000s, the current trimodal distribution of the use of stock and options
from firm to firm, and the limited individualization of equity mix
within executive suites. Many puzzles remain, and this work should
be viewed as part of an accretion of theory and evidence on the
executive pay-setting process.
149. After eliminating observations in which each executive at a firm received only stock or
only options, I was left with 3,303 S&P 500 executive equity grants for 2006 and 2007, consisting
of 634 CEO grants and 2,669 grants to subordinate executives. The mean ratio of stock value to
total equity value for CEOs was 0.508 and for subordinate executives was 0.525. A two-tailed t-
test was used to compare the means. The test yielded a t-statistic of –1.27 and a probability that
there is in fact no difference in means of 20.5 percent.
150. CFO equity packages were also examined. One might expect CFO equity packages to be
less option heavy given the nature of the role and the purported link between options holdings
and earnings management. However, average S&P 500 CFO equity mix for 2006 and 2007 was
virtually indistinguishable from the mix granted to the remaining senior executives. Only the
CEO and CFO positions are identified in Compustat, so no analysis was performed for the COO
or chief technology officer roles.

6b. Walker_PAGE 03292011.docx 3/29/2011 6:02 PM
2011] EXECUTIVE EQUITY COMPENSATION 667
Although the primary thrust of this Article is descriptive, this
Part will briefly explore the implications of the phenomena we have
observed for corporate governance regulation, as well as for future
empirical work in this area.
A. Regulation of Risk-Taking Incentives
Compensation structures that encouraged executives to take on
excessive risk are among the most frequently cited causes of the
recent financial crisis. In order to reduce the chances of a
reoccurrence, many policymakers and commentators have called for
more conservative pay arrangements.151 The bank bailout legislation
enacted early in 2009 directs the Treasury to promulgate
compensation standards for bailed out firms that will ―exclude
incentives for senior executive officers . . . to take unnecessary and
excessive risks that threaten the value‖ of participating companies.152
More specifically, the bailout legislation precludes grants of options,
limiting equity compensation to ―long-term restricted stock.‖153 There
is interest in Congress in expanding substantive executive pay
regulation beyond banks.154
To a large extent, however, a shift to a more conservative mix
of equity compensation has already occurred. In recent years, many
firms have switched from option-heavy pay packages to stock-heavy
packages or to more balanced mixes of stock and option pay. At these
firms, the shift away from option-heavy packages should have reduced
executive appetites for risk. Of course, even at these firms, the shift
from options towards stock does not mean that longer holding periods
151. See, e.g., Bhagat & Romano, supra note 5, at 363, 366–67 (suggesting that executives
not be allowed to dispose of equity compensation prior to retirement); Posner, supra note 5, at
1045–46 (recommending that a ―significant share‖ of executive compensation should be
backloaded and suggesting that restricted stock should constitute a minimum fraction of CEO
pay); Craig, supra note 5 (relating comments of House Committee on Financial Services
Chairman Barney Frank advocating broader application of rules tying executive pay to long-term
performance).
152. American Recovery and Reinvestment Act of 2009, Pub. L. No. 111–5, § 7001(b)(2)–
(3)(A) (2009).
153. Id. Under the Act, the stock cannot vest before the government loans are repaid. See id.
154. See, e.g., Craig, supra note 5 (reporting comments of House Financial Services
Committee Chairman Barney Frank suggesting more widespread linkage of executive pay to
long-term company performance); Press Release, H. Comm. on Fin. Servs., 111th Cong.,
Chairman Frank Holds News Conference to Discuss the Committee Agenda and Priorities for the
Coming Year (Feb. 2, 2009), available at http://www.knowledgeplex.org/news/3000221.html
(indicating in question and answer session that the potential extension of executive
compensation regulation ―doesn‘t just go for TARP recipients‖).

6b. Walker_PAGE 03292011.docx 3/29/2011 6:02 PM
668 VANDERBILT LAW REVIEW [Vol. 64:2:611
for equity pay, which have been widely suggested, would not be
beneficial.155
Regulators should also recognize that the shift in emphasis
from options to stock over the last decade has not been uniform. As we
have seen, equity compensation at a substantial minority of firms
continues to consist almost entirely of options. The question that this
Article does not resolve is whether reliance on options at these
―holdouts‖ is efficient. Evidence on equity mix clustering, lack of
individualization, and equity grant behavior that is consistent with
the naïve diversification heuristic causes one to doubt the extent to
which companies are optimizing equity grants. But one does not have
to subscribe to the view that all executive pay arrangements are
efficiently designed to conclude that one-size-fits-all pay regulation
could be costly. Even if boards follow heuristics in designing equity
pay packages, across the board mandates that preclude firms from
issuing options could push pay arrangements further away from the
efficient frontier.156
On the other hand, the efficiency cost of imposing substantive
executive pay regulation on companies must be a function of the
efficiency of existing arrangements. If all executive pay packages are
optimized currently, forcing firms to shift to a one-size-fits-all mix
results in maximum efficiency loss. If current packages are not
optimized currently, the efficiency loss of mandated regulation is less.
This effect is fairly obvious if deviations from optimality result not
from transaction costs but from reliance on heuristics or from a failure
to fully understand how stock and options can be combined to manage
risk and optimize incentives. But even if current arrangements are
optimized once transaction costs are taken into account, the point still
holds, if only to a lesser degree. It seems fairly clear that executive
equity mix is far from ideal currently. Of course, this line of argument
does not suggest that coercive pay regulation is a good idea, only that
the cost of such regulation might be less than one would predict if one
believed that current pay packages were finely tuned and completely
efficient.
155. See, e.g., Bhagat & Romano, supra note 5, at 361 (advocating significantly greater
holding periods for equity-based incentive compensation).
156. See David I. Walker, The Challenge of Improving the Long-Term Focus of Executive Pay,
51 B.C. L. REV. 435, 468–69 (2010) (suggesting that any coercive pay regulation aimed at
remedying short-term thinking by executives should be limited to restricting the holding period
of pay—and not the methods or instruments—in order to minimize inefficiencies); see also
Bhagat & Romano, supra note 5, at 371–72 (recommending that executive pay consist of some
combination of long-term stock and long-term option compensation).

6b. Walker_PAGE 03292011.docx 3/29/2011 6:02 PM
2011] EXECUTIVE EQUITY COMPENSATION 669
B. Regulation of Executive Pay-Setting Processes
Substantive pay regulation aside, the trimodal distribution of
equity mix convexity and the limited individualization within
executive suites suggest that there is room for improvement in the
processes utilized in determining equity pay mix. To the extent that
deviations from the ideal equity mix result from transaction costs,
improvement could be obtained only by reducing those costs. It seems
likely, however, that some of the deviations reflect board reliance on
heuristics or a failure to fully understand how stock and options can
be combined to manage risk and optimize incentives. To this extent,
improvement might be gained through regulation of the pay-setting
process. Such regulation might even include shareholder ―say on
pay.‖157 Although we cannot expect uninformed shareholders to
contribute in a useful way to a dialogue about equity pay design,
evidence from the UK experience with ―say on pay‖ suggests the
possibility of improvements in compensation design resulting from
coordinated intervention.158
C. Empirical Work on Executive Compensation
The analysis presented in this Article is quite preliminary. It
offers more puzzles than answers. Nonetheless, some of the findings
regarding limitations on efficient contracting should be of interest and
importance to researchers doing empirical work in this area. Chief
among these, perhaps, is the paucity of individualized equity pay
design within executive suites. Although it seems perfectly
appropriate for researchers to take into account an executive‘s entire
portfolio in analyzing her incentives and risks, it does not seem
appropriate to assume that firms routinely consider individual
157. ―Say on pay‖ proposals uniformly involve an advisory up-or-down shareholder vote on
executive compensation. See Jeffrey N. Gordon, “Say on Pay”: Cautionary Notes on the U.K.
Experience and the Case for Shareholder Opt-In, 46 HARV. J. ON LEGIS. 323, 324–25, 338–40,
348–53 (2009) (discussing U.S. legislative proposals and corporate governance activists‘ attempts
to implement ―say on pay‖). The Dodd-Frank financial regulatory reforms enacted in 2010
mandate non-binding shareholder voting on executive pay beginning in 2011. Dodd-Frank Wall
Street Reform and Consumer Protection Act, Pub. L. No. 111–203, § 951 (2010).
158. See Fabrizio Ferri & David Maber, Say on Pay Votes and CEO Compensation: Evidence
from the UK 3–4, 23–25 (Oct. 15, 2010) (unpublished manuscript), available at
http://ssrn.com/abstract=1420394 (finding that 2002 U.K. ―say on pay‖ legislation had no effect
on the level or growth rate of CEO pay, but finding an increase in pay sensitivity to poor
performance). But see Gordon, supra note 157, at 345 (suggesting that the effect documented by
Ferri and Maber could result in excessive executive conservatism).

6b. Walker_PAGE 03292011.docx 3/29/2011 6:02 PM
670 VANDERBILT LAW REVIEW [Vol. 64:2:611
portfolios in designing new equity grants. Existing portfolios may or
may not play a role in determining the amount of equity pay received
by an executive, but these and other individual characteristics appear
to play little role in determining the mix of stock and options at the
majority of companies, which grant stock and options in lockstep.159
CONCLUSION
In the 1990s, there was little variation in the convexity of
executive equity pay packages. There was variation in the size of
option grants relative to other pay, but little variation in the mix of
stock and options. Today, as a result of the leveling of the accounting
playing field and other factors, there is much greater variation.
Ultimately, the ―empirical‖ question those of us working in this area
seek to answer is whether executive pay processes are reasonably
efficient. It is the contention of this Article that, given the increased
variation, a focus on the mix of stock and options in pay packages can
provide useful insights into the efficiency of those processes. This
Article should be seen as beginning the process of mining that
variation in hopes of learning more about firm choices in this
important area.
In my view, the primary lesson that should be learned from
this first pass at the data is that equity pay design, like executive pay
generally, is at best boundedly efficient. Looking closely at the
evolution and current state of equity compensation mix, as we have
done, reveals several features that suggest a lack of or limitations on
efficient contracting. First, although directionally consistent with
changes in the conventional economic determinants of mix, the
dramatic shift over the last decade from very heavy reliance on
options to a more balanced emphasis on stock and options suggests
that option expensing, option taint, and/or increased perceived option
risk played leading roles. Second, the trimodal distribution of the mix
of stock and options being granted in recent years suggests that
optimizing convexity is not the sole consideration of issuing firms, and
heuristics appear to be a key factor. Third, the extent to which the
same mix of stock and options is granted to the various member of the
executive suite indicates that individual optimization is quite limited.
159. As noted above, it is possible that companies optimize equity mix for CEOs and then
apply the same mix in granting equity to subordinate executives. See supra notes 148–51 and
accompanying text. It is clear, however, that firms generally do not optimize for each member of
the executive team.

6b. Walker_PAGE 03292011.docx 3/29/2011 6:02 PM
2011] EXECUTIVE EQUITY COMPENSATION 671
This evidence does not necessarily demonstrate that firms are not
maximizing share value in determining equity pay mix, but if the
packages observed represent optimal contracts, ―optimization‖ must
be occurring at a broader level than traditionally conceived, and
transaction costs must play an important part in the decisionmaking.
6b. Walker_PAGE 03292011.docx 3/29/2011 6:02 PM
672 VANDERBILT LAW REVIEW [Vol. 64:2:611
APPENDICES AND TABLE
Appendix A: Data Source and Limitations
Annual disclosure of senior executive compensation is mandated for
Securities Exchange Act-reporting companies under SEC regulation. These proxy
statement disclosures are the ultimate source of data for this analysis. The
regulations have evolved over the last decade, requiring disclosure in ever greater
detail. One constant, however, has been the requirement to disclose compensation
detail for the five most senior executives of the company.160
Although details of the disclosure rules have changed frequently, the revision
in the accounting rules for stock options in 2004 resulted in a fairly fundamental
change in reporting.161 Through 2005, firms reported the entire ex ante value of stock
grants in their summary compensation tables, as well as the number of shares
underlying option grants. Beginning in 2006, firms reported the pro-rated annual
accounting expense associated with stock and option awards in this pivotal table. Full
grant date values were reported elsewhere in the proxy statement.162
S&P‘s Compustat database includes executive compensation data extracted
from the proxy statements of firms currently or historically included in the S&P 1500
index. The dataset goes back to 1992 and serves as the primary source of data for this
Article, as supplemented to the extent necessary by examining individual firm proxy
statements.163
Compustat‘s database has evolved along with the evolution of SEC reporting
requirements, with a major change in the way data are compiled through 2005 and
beginning in 2006. In brief, beginning in 2006, Compustat reports the grant data fair
value of stock and option awards as well as the annualized expense associated with
such awards. Moreover, Compustat‘s primary measure of total compensation (TDC1)
currently includes the grant date value of all instruments expensed as stock and all
instruments expensed as options. Through 2005, this measure included the grant date
value of actual stock and option grants but an ex post measure of the value of
phantom stock grants. As discussed below, I have modified this measure of total
compensation to increase the comparability of pre-2006 and post-2005 data.
160. Actually, even this requirement has evolved somewhat. The current rule requires
disclosure for the CEO, CFO, and the three most highly compensated employees other than the
CEO and CFO; prior rules required disclosure for the firm‘s CEO and the four most highly
compensated employees other than the CEO. Compare 17 C.F.R. § 229.402(a)(3)(ii)–(iii) (2007)
(new rule), with 17 C.F.R. § 229.402(a)(i)–(ii) (2006) (old rule). However, for most firms the two
rules produce the same list of executives.
161. See Fin. Accounting Standards Bd., supra note 42.
162. See SEC Reg. S–K, 17 C.F.R. § 229.402(c)(2)(vi) (2010) (detailing requirements for
summary compensation table); SEC Reg. S–K, 17 C.F.R. § 229.402(d)(2)(viii) (2010) (detailing
requirements for table of plan-based awards).
163. The Compustat database is not error-free. We found numerous examples of miscoded
data, and surely many more cases eluded us since we focused on errors that produced outlier
results, such as the 2006 $2.2 million restricted stock grant to an executive of Baxter
International that is coded in Compustat as a $2.2 billion grant. However, I have no reason to
think that I could do a better job than S&P of coding this data even if I had several lifetimes to
accomplish the task.

6b. Walker_PAGE 03292011.docx 3/29/2011 6:02 PM
2011] EXECUTIVE EQUITY COMPENSATION 673
Appendix B: Compustat Data Definitions 1992–2005 and 2006
to Present and Modifications
Compustat revised many of its executive compensation data definitions
following the FASB‘s 2004 revisions to stock option accounting and the SEC‘s
revisions to proxy disclosures. These definitional changes complicate comparison of
data across the two periods.
Ideally, we would have variables representing the total ex ante value of all
stock awards (time-vested restricted stock, performance-vested restricted stock, and
performance shares) and all option awards (traditional, performance vested, and
SARs) for each year. These variables exist under the 2006 reporting format and are
labeled STOCK_AWARDS_FV and OPTION_AWARDS_FV. For options, including
SARs, there is a comparable variable under the 1992 reporting format,
OPTION_AWARDS_BLK_VALUE, which is a Compustat generated ex ante valuation
using the Black-Scholes methodology. For stock, there is not a comparable 1992
format variable. The variable RSTKGRNT provides the ex ante value of time-vested
and performance-vested restricted stock grants, but does not include the value of
performance shares. Under the 1992 reporting format, the ex post values of
performance share grants were included along with long-term non-equity plan awards
in the variable LTIP. Thus, in order to track and compare the ex ante value of all
stock awards across the two periods, I constructed a total ex ante stock value for
1992–2005 that is roughly comparable to STOCK_AWARDS_FV by multiplying the
target number of any performance shares granted (SHRTARG) by the granting
company‘s year-end share value and summing this data with RSTKGRNT.
The inconsistency in stock grant reporting carries over to the total
compensation variable TDC1, which is provided under both formats. Under the 1992
format, TDC1 includes salary, bonus, other annual compensation, the grant date
value of restricted stock (but not performance shares), the grant date value of options
and SARs (computed based on the Black-Scholes methodology), long-term incentive
plan payouts (including performance share payouts), and other total compensation.
The 2006 version of TDC1 includes salary, bonus, non-equity incentive plan
payouts, the grant date value of stock (including performance shares) and options
(including SARs), deferred compensation earnings reported as compensation, and
other compensation. It is not apparent how one would perfectly reconcile these two
measures given the data available under the two formats. However, it is necessary to
adjust the 1992 TDC1 measure to include ex ante performance share value if one
wishes to compare the contribution of stock grants (including performance shares) and
options to total compensation. Thus, I have created an adjusted TDC1 variable under
the 1992 format equal to TDC1 as reported, less LTIP payouts, plus ex ante value of
performance shares and non-equity plan awards.

6b. Walker_PAGE 03292011.docx 3/29/2011 6:02 PM
674 VANDERBILT LAW REVIEW [Vol. 64:2:611
Appendix C: Descriptive Statistics for Lockstep Equity Design
Firms vs. Individualizing Firms 2006–2007
Lockstep Firms Individualizing Firms
N Mean Median N Mean Median P Value
Variable:
Equity % of Total Comp. 197 49.7 51.3 31 54.1 55.9 0.165
Sales ($ million) 197 14371 6359 31 17537 8390 0.585
Assets ($ million) 197 33606 8419 31 58417 12442 0.419
Market Cap. ($ million) 195 21359 10289 30 26651 12536 0.503
Total Sh. Return (1 yr) 195 20.84 17.91 30 8.28 8.93 0.000***
Total Sh. Return (3 yrs) 189 25.47 18.22 30 13.21 13.26 0.001***
ROA (%) 197 7.45 6.59 31 6.37 5.04 0.344
Volatility (%) 195 29.3 25.3 30 24.7 22.2 0.029**
Tobin‘s Q 163 1.85 1.38 22 1.69 1.39 0.647
Debt/Equity Ration 194 0.27 0.14 30 0.36 0.16 0.527
G Index 181 9.35 9 28 9.04 9 0.510
E Index 181 2.10 2 28 2.18 2 0.767
This table reports means, medians, and P values from two-sided t-tests of the
significance of the difference in means for potential determinants of equity pay design
behavior. The symbols *, **, and *** indicate significance at the 10%, 5%, and 1%
levels.
Lockstep firms granted the same ratio of stock to total equity pay (including
ratios of zero and one) to at least four of the top five executives in 2006 or 2007, and
equity grants in the other year were not inconsistent with the lockstep behavior.
Individualizing firms did not grant the same ratio of stock to total equity pay
to any two executives in 2006 or 2007, and grants in the other year were not
inconsistent with individualization.
Equity % of Total Compensation: Averaged for the top five executives for
2006 and 2007.
Sales, Assets, Market Capitalization, 1 and 3 Year Total Shareholder Return
& Return on Assets: Averages of 2005 and 2006 data from Compustat. In accordance
with common practice, determinants are lagged by one year.
Volatility: 60 month volatility through year end 2006 per Compustat.
Tobin‘s Q: Averages of 2005 and 2006 data from Compustat. Q = (market
value of common stock + book value of debt and preferred stock) / book value of total
assets.
Debt/Equity: Averages of 2005 and 2006 data from Compustat. Debt = long
term debt + preferred stock. Equity = market value of common at year end.
G and E index: 2006 data from RiskMetrics.