Embed Size (px)
Citation preview
Evolving Methods in Iris Recognition
and Implications from200 Billion Iris Comparisons
John Daugman

1.Overview: How iris recognition works2.Some significant large public deployments3.Review of recent test methods and reporting4.Significance of the flat ROC (or DET) curve5.Evolving methods, pushing the envelope
• iris acquisition “on-the-move” and “at-a-distance”• Active Contours, and generalised embedded coordinates• processing non-cooperative iris images acquired off-axis• better exclusion of eyelashes, eyelids, and reflections• quality scoring to pre-qualify images• reduced resolution, and severe image compression

1. Overview: How iris recognition works

- Even “dark brown” eyes have rich texture when images are captured in the infrared band…

…although the lunar (“cratered”) appearance seen in the infrared band is quite different from the “interwoven” texture usually seen in lighter coloured eyes in the visible band.


Bits in IrisCodes are equally like to be ‘1’ or ‘0’
- This makes them maximum-entropy bitwise.
- If different irises had some common structure,then this distribution would not be uniform.
When bits from IrisCodes derived from different eyes are compared, those comparisons are Bernoulli trials.


Badly defocused iris images do not cause False Matches, because theIrisCode phase bits then just become random, determined by pixel noise.This is an advantage of phase over correlation-based coding methods.

Genetically identical eyeshave iris patterns that areuncorrelated in detail:
Monozygotic Twins A

Iris Patterns are Epigenetic
Every biometric lies somewhere on a continuum between being genetically determined (genotypic) or not (epigenetic)
Examples of genotypic traits: DNA, blood type, gender, race
Examples of epigenetic traits: fingerprints (except for type correlations); and iris patterns (except for eye colour)
Example at middle of continuum: facial appearance. (Identical twins look identical, but they both change over time like everyone, yet they track each other as they age.)

Genetically identical eyeshave iris patterns that areuncorrelated in detail:
Monozygotic Twins A(6 year-old boys)

Genetically identical eyeshave iris patterns that areuncorrelated in detail:
Monozygotic Twins B(18 year-old women)

Genetically identical eyeshave iris patterns that areuncorrelated in detail:
Monozygotic Twins C(78 year-old men)

IrisCode Logic and Normalizations


“Extreme Value Distribution” for Best Match Score after Multiple Rotations


200 billion is a lot of iris comparisons in that histogram. A typical galaxy contains “just” 100 billion stars…
AndromedaGalaxy: about100 billion stars

…so we would need to combine all the stars in two galaxies, to equal the number of iris comparisons in that histogram.
Bodes Galaxy:…again, about100 billion stars

Empirical performance in this range was confirmed also by IBG’s ITIRT Report (2005) testing these algorithms.
In 1.7 billion comparisons between different irises, the smallest HD score observed by IBG was in the vicinity of 0.28 (consistent with this Table).
The “Peta-Comparisons” zone: the number of cross-comparisons necessary to search for duplicate identities in a database size of UK


Each one-percentile point reduction indecision threshold reduces FMR by about another factor of 10.
Why huge database searches are survivable:


2. Some significant large public deployments- UK Project IRIS: Iris Recognition Immigration System
IRIS statistics as of 30 July 2007:
“100,000 frequent travellers have been enrolled, growing by 2,000per week, and there have been around 500,000 IRIS automated entries since January 2006, with currently around 12,000 IRIS arrivals into the UK per week.” (-- Pat Abrahamsen, UK Home Office)
A “frequent flier” programme that allows enrolled participants to enter the UK from abroad without passport presentation, and without asserting their identityin any other way. Cameras at automated gates operate in identification mode, searching a centralised database exhaustively for any match.

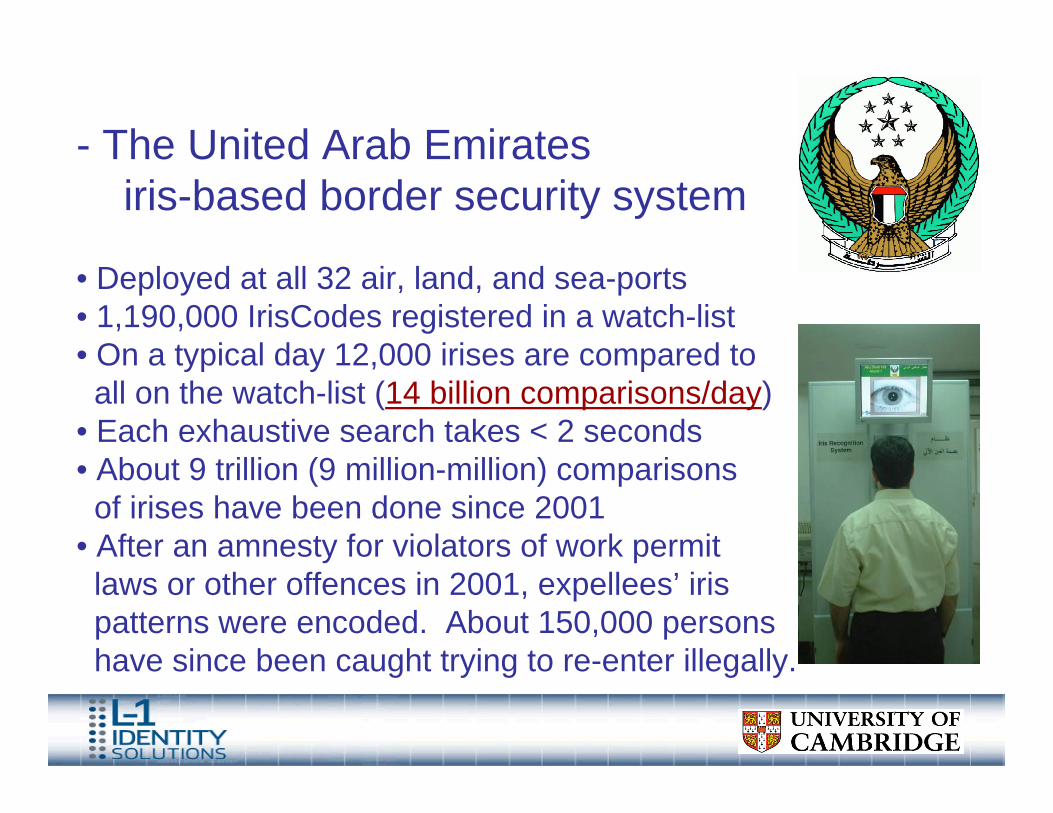
- The United Arab Emiratesiris-based border security system
• Deployed at all 32 air, land, and sea-ports• 1,190,000 IrisCodes registered in a watch-list• On a typical day 12,000 irises are compared to _all on the watch-list (14 billion comparisons/day)• Each exhaustive search takes < 2 seconds• About 9 trillion (9 million-million) comparisons _of irises have been done since 2001• After an amnesty for violators of work permit _laws or other offences in 2001, expellees’ iris _patterns were encoded. About 150,000 persons _have since been caught trying to re-enter illegally.


Residency Permit Applications

U.S. Police Departments: bookings and releases

U.S. Marines in Iraq: control of points of entry into Fallujah
All males of military age entering the city are identified. Overall, some 3,800 iris cameras like this one are in use by U.S. Forces in Iraq.
“It helps enormously. It enables us to identify individuals connected with various activities.”
- Gen. David Petraeus


Takhtabaig Voluntary Repatriation Centre, Pakistan-Afghan border
The United NationsHigh Commission forRefugees (UNHCR)administers cash grantsfor returnees, using irisidentification.

Sharbat Gula (1984); identified (2002) by these iris algorithms (using photographs by National Geographic)

Schiphol Airport (NL):iris recognition in lieu ofpassport presentation

Access to condominium building, and elevator programming (!), by iris recognition

3. Review of recent test methods and reporting

Comparative biometric testing history: UK National Physical Laboratory, 2001
Iris False Match Rate:0 in 2.7 million comparisons
False non-Match Rate:0.002 (best of 3)

Generating ROC (or DET) curves requires moving the decision threshold, from conservative to liberal, to see a trade-off between Type I and Type II errors.
Therefore even if a biometric technology is configured in deployments with pre-determined decision thresholds that avoid False Matches in practice,
ROC testing will generate (and report) False Matches.

Three very important points to note:
1. It is possible to attribute any FMR to any biometric, as the decision threshold criterion sweeps out its path from extremely conservative (“reject everyone,” ensuring that FMR = 0%), to extremely liberal (“accept everyone,” making FMR = 100%).
2. As the ROC curves approach either of their corner limits, allbiometrics converge, and look roughly comparable. They look equally accurate when high FMRs (e.g. 0.001) are tolerated.
3. What is most important is the flatness of any ROC curve, (slope = likelihood ratio), since this reveals the extent to which the FMR can be reduced without much (or any) cost to FnMR.

The UK NPL study obtained no False Matches for the iris algorithms at the standard deployed threshold of 0.32 Hamming Distance, and clearly the best performance.
But all subsequent testers wanted to shift the decision threshold so that False Matchescould be generated, and ROC curves plotted.

Comment (JD): note how flat the ROC curves remain, over many orders-of-magnitude in FMR.

Cou
rtesy
of D
r. V
alor
ieVa
lenc
ia, P
hD, A
uthe
nti-c
orp
Rep
ort:
“Iris
Rec
ogni
tion
Inte
rope
rabi
lity
and
Imag
e Q
ualit
y,”
13 J
uly
2007
, Aut
hent
i-cor
p. U
RL:
ww
w.a
uthe
nti-c
orp.
com
Authenti-corp study of 3 iris recognition algorithms and image quality:Flat ROC curve (Cambridge = black) over almost 6 orders-of-magnitude
HD=0.32DecisionCriterion

Comment (JD): Again note the flat ROC curves over many orders-of-magnitude; and the achievement of a False Matchrate of 1 in a million, while False non-Match Rate is 1%
International Biometric Group, Independent Test Report ITIRT, 2005
1 /1,000,000

Performance of the 2006 Cambridge algorithms on the publicly released part of the NIST iris image database
False non-Match Rate remains below 1% while the ROC curve approaches a False Match Rate of 1 in a million.
At much higher HD threshold decision criteria, the Equal Error Rate (EER) is about 0.001 - 0.002
(Note the greatly magnified scale, zoomed into the 0.95 -1.00 range, so the ROC curve looks less flat.)

NIST iris test images: 242161: Quality Score = 10/100
NIST Iris Challenge Evaluation used images acquired with the Quality Checking feature disabled.
If any image in a group of 3 was deemed acceptable, then all the images (like this one) were deemedacceptable and used for the test.

NIST iris test images: 246587: Quality Score = 2/100

NIST iris test images: 246215: Quality Score = 5/100

NIST iris test images: 240596: Quality Score = 40/100(printed patterned contact lens)

NIST iris test images: 245268: Quality Score = 9/100(defocused, and printed patterned contact lens)

NIST iris test images: 242245: Quality Score = 13/100

NIST iris test images: 241307: Quality Score = 0/100(raster interlace creates Moire fringes)

NIST iris test images: 243887: Quality Score = 37/100(printed patterned contact lens)


4. Significance of the Flat ROC CurvesThe slope of an ROC curve is called the likelihood ratio.
At any given decision threshold criterion, this slope is equal to
the ratio of the two probability distributions at that criterion.

All the studies reveal remarkably flat ROC curves:FMR can be changed over many orders-of-magnitude, while FnMR hardly changes

The slope of log ROC curves for these algorithms is about 2 : 10,000(the FnMR only doubles while FMR is reduced by a factor of 10,000
when the HD threshold changes from about 0.37 to about 0.32).
• So, while citing a FnMR of about 1% - 2%, testers _could equally well cite a FMR of: 1 in a million, or _1 in 100,000, or 1 in 10,000, or 1 in 1,000…
• FnMR is hardly a function of FMR over this range. _FnMR is mainly determined by the number of _rubbish images included; not the threshold used.
• A fair comparison between face recognition and _iris recognition as tested by NIST would require _the face gallery to include images like this:
• To report that iris recognition has a False Match _Rate of 1 in 1,000 (as NIST has done, because _such a point can be found on the ROC curve…) _is arbitrary, misleading, and mischievous.

Conclusions from flat ROC curves and recent test reports
In the words of one US Government sponsor of NIST 2006 FRVT and ICE tests:“The deck was stacked against iris.”
1. The reputation for accuracy that iris recognition has earned is a consequence of the very rapidly decaying tail of the Imposters’ distribution, due to the binomial combinatorics.
2. This rapid decay means that tiny reductions in threshold cause huge reductions in FMR, with little effect on FnMR. This enables large database operation in identification mode.
3. Several independent testing organisations have confirmed that the algorithm is “highly resistant to imposter matches”(e.g. IBG-ITIRT Report 2005, Executive Summary, p. 17).
4. Recent NIST reports dispute the iris reputation for accuracy by selecting a point on the ROC curve where FMR = 0.001. Since hi-resolution face recognition based on skin texture can also reach this, NIST concludes they are “comparable.”
5. By including many bad iris images (Quality Check disabled), NIST obtained FnMR of 1% or higher at FMR = 0.001 point and declared the iris reputation for accuracy is undeserved.

5. Challenges: Evolving methods iniris recognition that push the envelope
New adaptations of the iris recognition algorithms for more demanding conditions of image capture such as:
• iris on-the-move• iris at-a-distance• iris off-axis (deviated gaze)• iris recognition in anomalous eyes• iris at reduced resolution or severe compression

i. Anomalous eye shapesThe “polar unwrapping” approach to iris mapping and normalization makes simplifying assumptions about circular shapes and boundaries…

…but these are often not true in reality:


Actual inner and outer boundaries (blue)compared with true circles (red):
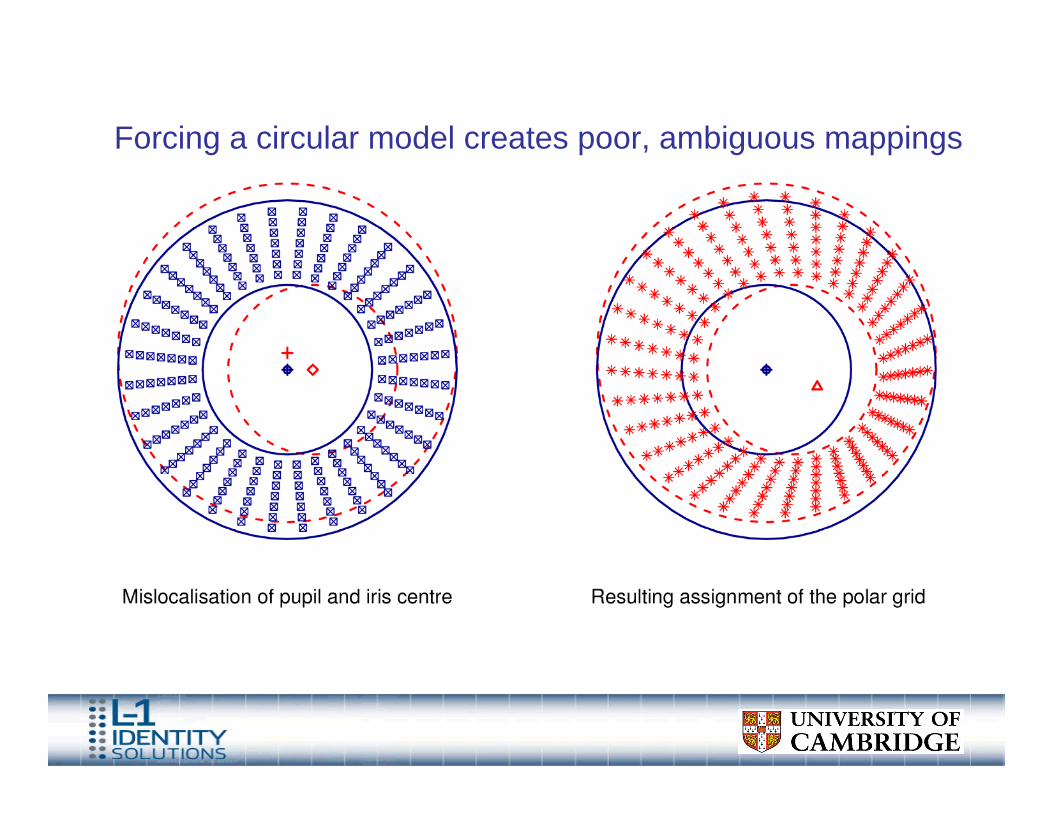
Forcing a circular model creates poor, ambiguous mappings

…with significant and irrecoverable mapping distortions:


Bit shift dislocations and higher HD scores are the result.


Result of modelling the boundaries with Active Contours…

…creating a generalized embedded iris coordinate system.

-- Even a “square pupil” can be accommodated by Active Contours,modelling it accurately with 16 Fourier components:
Motto: “Don’t force a round peg into a square hole!”

ii. Iris images acquired off-axis

…can be “corrected” by Fourier-based trigonometry to estimate the gaze angle and make a corrective affine transformation, effectively “rotating the eye in its socket, towards the camera:”

iii. Exclusion of eyelashes and reflections

Occluding eyelashes are detected and masked out (prevented from influencing the IrisCode) by statistical…
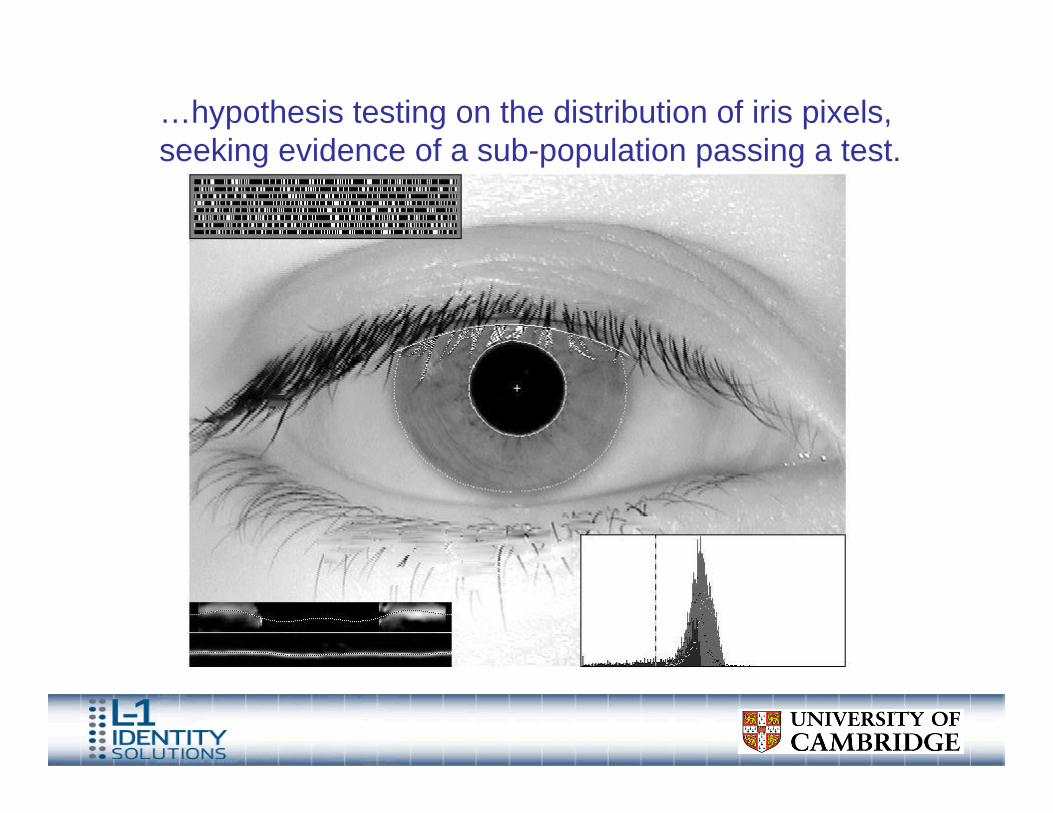
…hypothesis testing on the distribution of iris pixels, seeking evidence of a sub-population passing a test.

In the visible band of light in unconstrained environments (e.g. outdoors), ambient corneal reflections are common. An iris acquired in the visible band often looks like this:
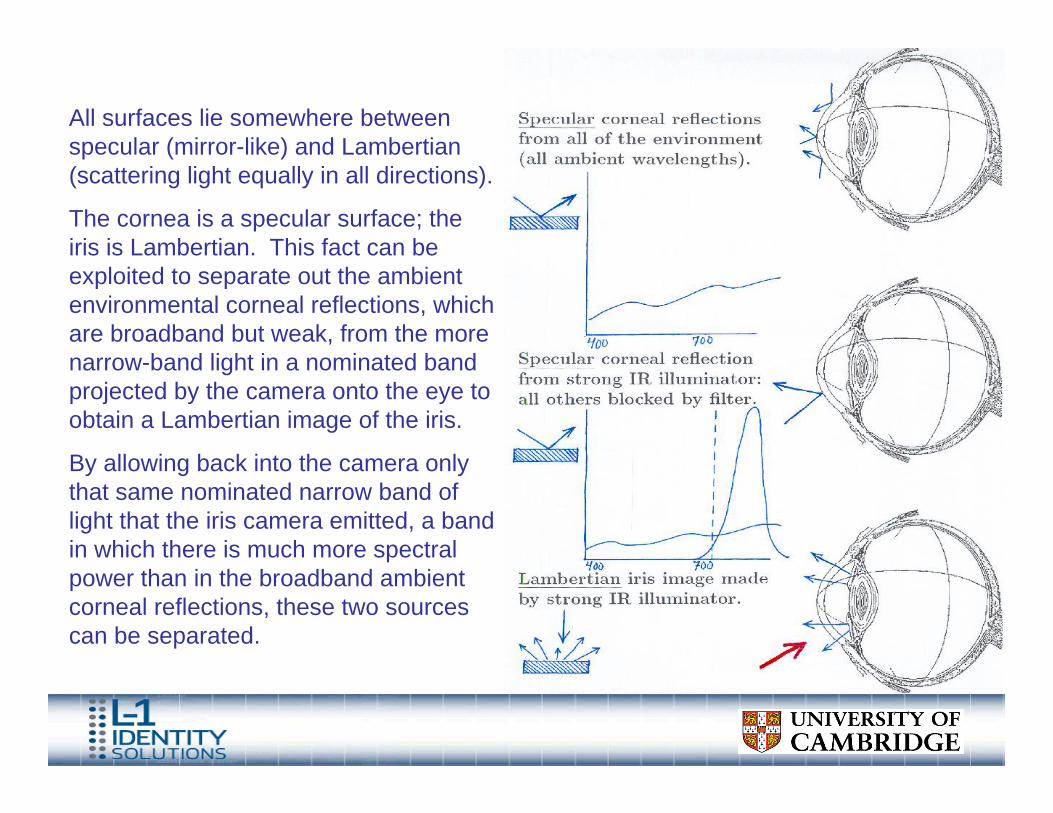
All surfaces lie somewhere between specular (mirror-like) and Lambertian(scattering light equally in all directions).
The cornea is a specular surface; the iris is Lambertian. This fact can be exploited to separate out the ambient environmental corneal reflections, which are broadband but weak, from the more narrow-band light in a nominated band projected by the camera onto the eye to obtain a Lambertian image of the iris.
By allowing back into the camera only that same nominated narrow band of light that the iris camera emitted, a band in which there is much more spectral power than in the broadband ambient corneal reflections, these two sources can be separated.

The result is an image acquired in narrowband near-infrared light, from which almost all ambient environmental corneal reflections (except for that of the illuminator) have been “scrubbed.”

Obviously any reflections from eyeglasses must be scrubbed out too, prior to localization of the iris boundaries. If these reflections cover part of the iris, a logical mask must be set to prevent these pixels from influencing the IrisCode, just as with eyelashes and eyelids.

iv. Quality scoring to pre-qualify images
NIST iris test image 242161: Quality Score = 10/100
Among useful Quality factors are:• focus score (frequency spectrum)
• amount of eyelid occlusion
• resolution (size of the iris in pixels)
• boundary contrast, and texture energy
• raster interlace shear from motion
• gaze deviation (off-axis acquisition)
These factors should be combined in a logical, not a linear or an additive way, since they should have veto power. E.g. it should not be possible for excellent focus to compensate for closed eyelids.

v. Reduced resolution and compressionHalf-size resolution in
QCIF (Quarter Common Intermediate Format), in which the iris radius may typically be only 50 pixels, seems acceptable. No impact on FMR; but there is a small cost in FnMR.
Sarnoff “iris-on-the-move”and “iris-at-a-distance”acquires iris images at this resolution, and then up-samples.
How much further can reduction in resolution requirement be pushed?

For example, is it reasonable to expect to work at this resolution of iris image acquisition?
(iris radius: 20 pixels)

A new synthesis is needed between optics and algorithms,for the co-design of image capture systems and of the algorithms that must recognize the resulting images.
This new discipline is driven by the demands to push theenvelop of iris image acquisition ever further:
• IoM - Iris-on-the-Move and Iris-at-a-Distance
• IaS - Iris-across-the-Street ?
• IaT - Iris-across-Town ?
• IfA - Iris-from-the-Air ?

The HubbleIris Camera

Effect of JPEG compression

Region-of-Interest cropping and JPEG-2000 compression allows iris images
to be compressed to only 2,000 – 2,500 bytes with little impact on performance

Effect of JPEG + ROI isolation compression

Effect of JPEG-2000 + ROI isolation compression


Interoperability of the ROI and compression methods, compared with original

Some biometric cartoons from the UK press…


Thank you!
http://www.CL.cam.ac.uk/users/jgd1000/