Embed Size (px)
Citation preview

27th Annual INCOSE International Symposium (IS 2017)
Adelaide, Australia, July 15-20, 2017
Evolving tolerance management for increased robustness of subsea installation operations
Lars Petter Bryn
South East Norway University College
Gerrit Muller
South East Norway University College
Copyright © 2017 by Lars Petter Bryn and Gerrit Muller. Published and used by INCOSE with permission.
Abstract. Low oil prices leads to a need for large cost reductions and improved effectiveness in the
subsea oil and gas industry. At the same time, production in harsher environment and deeper water is
inducing a need for more complex production systems. Increasing complexity reduces the tolerances
for successful manufacturing and installation. Increasing robustness of the installation process can
reduce installation costs. Robustness of the installation process is dependent on successful tolerance
management. This paper investigates different methods for tolerance management. The conclusion is
that successful tolerance management partly is independent on the chosen method for tolerance
analysis. The research shows that successful tolerance management relies on understanding of the
tolerance chain, cooperation, and early initiation. We applied system modelling as a system
engineering approach to support manually calculated tolerance budgets. The research finds that this
supports understanding, exploration, and communication. We recommend this as best practice. The
research shows that tolerance management can contribute to increased robustness of the installation
process by including manufacturing and operational factors in the tolerance analysis. System
modelling and budgeting support discussion and exploration of these factors.
Introduction
Domain. This paper focuses on the subsea oil and gas domain, and Subsea Production Systems (SPS).
The industry seeks technology to enable production in deeper water and harsher environment. This
increases the complexity of the production system and its installation. Increasing complexity
decreases the margins for successful fabrication and installation of the SPS, consequently increasing
the requirements for engineering and design. Harsher environment increases the requirements of
materials in the SPS, increasing the hardware costs. Simultaneously, the industry faces challenges of
low oil prices. As of January 2016, some of the world’s largest oil and gas companies had shelved
investments in new oil and gas projects worth of 400 million USD (Adams 2016). Globally, the
industry was facing 258000 layoffs of oil and gas workers as of December 2015 (Borney 2016). This
induces the need for reducing costs and improving effectiveness in all stages of the production. Cost
reductions are however in conflict with the need for more complex production systems. A solution to
this conflict demands a holistic and systematic approach, where operators and contractors need to
consider issues outside their area of responsibility. We research how SPS contractors can contribute
to reduce costs despite the increasing complexity of the production systems.
Company of research. The company being target for this research is a Norwegian based supplier of
products and services to the oil and gas industry. The company consists of several business areas.
The business area that delivers SPSs is target for this research. This business area supplies
Engineering, Procurement & Construction (EPC) in the subsea oil and gas domain.
Problem. The competition to win contracts for supplying SPSs is intense. Costs are a determining
factor in these competitions. The installation process contributes substantially to the total project costs
of a SPS development. Installation time and vessel/rig rental determine the installation costs. Rental

cost of installation rigs can be up to 8 million NOK per day. Installation of one single Xmas Tree
(XT) can vary in length from two to four weeks. Consequently, installation of one single XT can cost
between 112 and 224 million NOK. According to engineers, the typical price of a XT is 40 million
NOK. We see that reduction of installation costs can contribute to a significant decrease of the break-
even rate. An aspect of the installation cost is the robustness of the installation operations. Reduced
margins for successful manufacturing and installation challenge the robustness of the installation
process. This results in increased installation costs. Improved robustness of the installation process
depends on successful tolerance management. The company faces challenges with inconsistency of
tolerance analysis methods.
Goal. The company needs to increase competitiveness. Reducing costs is a prerequisite for increased
competitiveness in this setting. Ensuring robustness of installation would save the company’s clients
installation costs, and consequently improve the company’s competitiveness towards competing
contractors. To achieve a robust installation process, we want to minimize sensitivity towards external
noise, causing failure and delay. Failures or delays cause the operators additional installation costs,
and we want to reduce these costs.
The goal of this research is evolving tolerance management to support increased robustness of the
installation process.
Solution - SE application. We use system modelling and budgeting as tools to manage tolerances.
System modeling is a core SE technique and focuses on visualizing different views of the system of
interest. This approach facilitates exploration, discussion, validation, and training, which all generate
understanding of the system of interest. System modeling and simulation used during architecture
and design can reduce the risk of system failure (INCOSE 2015).
Research questions. We ask the following research questions:
- How can current tolerance analysis methods evolve to improve tolerance management? - What factors impact the tolerance management approach?
- How can tolerance management support robustness of installation?
To answer these questions, we research previous and current methods for tolerance management in
the company. We investigate tolerance issues occurred in previous projects and the reason for the
occurrence. By using tolerance budgets and system modelling for tolerance management in a study
for a SPS, we validate this method. We interview clients of the company to identify their needs in
deployment of a SPS.
Subsea context
Subsea oil and gas project costs. Operators of oil and gas production determine the commercial
robustness of a production project by calculating a break-even rate. The break-even rate is the
breaking point where the up-front investments (CAPEX) and operating costs (OPEX) are in balance
with the income from the production. Consequently, the break-even rate is a metric for the lowest
price needed per sold unit for commercial successfulness of a project. The commercial successfulness
is dependent on the oil price, and the production volume. There is uncertainty associated with break-
even rate and commercial successfulness. The oil price floats, and even though operators make an
estimate over OPEX throughout the project life cycle, the exact maintenance and workover cost is
unknown. Operators continuously strive to reduce the break-even rate. Operators consider the costs
of installation of a SPS as part of CAPEX.
Subsea Production System. Figure 1 shows a typical SPS. The production unit, known as a Xmas
tree (XT), is a package of valves that controls the flow of hydrocarbons. Templates are structures with
several XT slots and a manifold in the middle, enabling cluster placement of XTs. Satellite guide
bases enable installation of XTs on stand-alone wells. Production jumpers connect the satellite XTs

to a manifold for gathering of production flow. The flow is further transported topside to a Floating
Production, Storage and Offloading vessel (FPSO), an oil platform or other tieback solutions. In the
company researched, different product groups, called work packs (WPs), produce the different
components in a SPS system.
Figure 1. Field layout with template and satellite structures
Manufacturing and installation of a SPS. When installing the components in a SPS, there must be
some clearance between the components for the installation to be possible. There are tolerances in
both manufacturing and installation of the SPS. We define installation tolerances as an envelope for
successful and safe installation; this refers to how much two components can be misaligned and still
be able to install successfully. We define manufacturing tolerances as the maximum deviation a
component characteristic can have from the nominal design value without losing functionality as part
of the SPS. The manufacturing tolerances, the clearances between the components and the needed
envelope for successful and safe installation all together form a tolerance chain that will affect the
success of the final installation. Engineers assess and analyze the tolerance chain through complex
calculation operations. We define engineering, design, assessment, and analysis of the tolerance chain
as tolerance management.
Robustness of the installation process. Factors such as seabed conditions, sea depth, sea currents
and weather affect the degree of difficulty and time spent on the installation operation. Sea depth
determines the time spent on lowering tools and equipment down to the seabed. The sea depth is also
affecting the weight of the installation wires and landing strings, causing additional stress factors such
as torsion. Seabed conditions refer to incline of seabed and seabed materials. Muddy seabed
conditions compromises visibility, increasing the time spent on the installation operation. Sea currents
can cause tools and equipment to drift during installation, making the installation operation difficult.
The same applies for weather conditions. These factors affect the robustness of the installation
process. ANSI and IEEE defines in “Standard Glossary of Software Engineering Terminology”
robustness as “the degree to which a system or component can function correctly in the presence of
invalid inputs or stressful environmental conditions” (IEEE 1990). Stressful environmental
conditions are noise factors that may cause failure or delay of the installation process. There are two
main categories for noise factors; Internal and external. The external noise factors refer to factors that
are uncontrollable, such as sea state, swell and current. Internal noise relates to controllable factors,
such as wear of products and manufacturing errors. In this setting, we define robustness as the ability
to perform the installation operation correctly the first time, within project specific cost and time
limits.
Template Manifold
Satellite
well
Production
jumper
Reservoir

Subsea installation
XT Configurations. There are two main configurations of the XTs: the horizontal XT (HXT) and
the vertical XT (VXT); see Figure 2.
Figure 2. Horizontal and vertical Xmas tree
The Tubing Hanger (TH) holds the tubing going into the reservoir. The TH is installed in the HXT
after the HXT has been installed. For the VXT it is installed in the wellhead prior to installation of
the VXT. The VXT configuration enables retrieval of the VXT without retrieving the TH, which
enables easier work over and maintenance operations. A template system requires alignment and
orientation of the XT towards the tie-in hub on the manifold. The tie-in hub on the manifold is a fixed
structure with no possibilities for adjustment. The VXTs require alignment towards the TH in
addition. This means that the VXT aligns towards two separate components being in separate planes.
We define this envelope for alignment with six degrees of freedom. This refers to the possible
rotational misalignment of VXT; see Figure 3. Operators have until the recent years most commonly
used the HXT configuration. Today, the VXTs are more common. The complexity of the tolerance
chain has increased due to turnover from HXTs to VXTs.
Figure 3. Rotational alignment of the VXT, relative to the well axis
Critical areas in the tolerance chain. Figure 4 shows a simple explanation of the sequences in the
installation. The figure deviates between operations for specific types of subsea systems, and common
operations, such as the landing of the Blow-Out Preventer (BOP).
VXT front view VXT top view VXT side view

Figure 4. Flowchart of operations in the installation sequence
Operators monitor production using down-hole sensors. Hydraulic and electric lines to these sensors
run through the XT sleeve and further through the TH. This is where the TH interfaces the VXT. The
critical part of this interface is the mating between the hydraulic connectors, the production bore, and
the annulus bore. The most critical alignment is in the Rz-direction, meaning that rotational alignment
is determining successful mating. These interfaces require an exact and correct mating for successful
installation. This makes the orientation of the TH a critical factor for the orientation of the VXT. The
tie-in hub on the VXT interfaces the tie-in hub on the manifold if in a template, or the termination
head of a production jumper if on a satellite well.
Research method
We performed this research with a combination of industry-as-laboratory (Muller 2013), and action
based research (Muller 2013). Parts of the research target methods for tolerance management used by
the company, and we evaluate the methods. The basis for this evaluation is a combination of
qualitative interviews with key personnel involved in conducting the methods, and research of the
results of the methods. The interview objects are company engineers, holding system engineering
and product engineering positions in the projects researched. As part of the research, we also used a
third method for tolerance management in an ongoing project. Qualitative interviews with product
engineers involved are basis for the evaluation of this method. We evaluate the methods for the
following aspects:
- Credibility amongst engineers applying the methods
- Reliability
To ensure that we also have the clients in focus, we use qualitative interviews of company clients as
basis for identification of their needs in deploying a SPS. The interview objects are system engineers
representing their respective company. We acknowledge that the interviewed engineers do not
necessarily represent the opinion of their company, but their own views and perspectives.
The numbers we show in this research are illustrative; for confidentiality, the values have been
adapted slightly.
Current way of working with tolerance management in the company
Handling of tolerances. The concept of installation tolerances is a top-down approach – this concept
Installation of wellhead
assembly and guide structure
Landing BOP
Installation of tubing hanger
Installation of VXT
Installation of template
Landing of wellhead
assembly in template
Tie-in connection
between VXT and production
jumper
Tie-in connection between VXT and
Manifold
Mating between VXT orientation/isolation sleeve
and tubing hanger
Metrology study of VXT hub
Prefabrication of production jumper
Installation of production jumper
Drilling
Installation and orientation with Tubing hanger Running and
orientation tool
Satellite well operations
Template operations
Common operations
Sub-processes
Installation of
Manifold

focuses on systems and the interaction between components. Engineers strive for having as large
installation tolerances as possible to maximize robustness of the installation process. The concept of
machining and fabrication tolerance is a bottom-up approach – machining and fabrication tolerances
are the margins of how much products can differ from the target, or drawing specifications without
loss of functionality. While engineers strive for allowing as large fabrication tolerances as possible,
they strive for having as little deviation from nominal as possible. Company WPs are responsible for
handling the machining and fabrication tolerances of their own products. The installation tolerances
and tolerance chain are different, as managing of this requires cooperation between the WPs and
external stakeholders.
Company project execution diagram. The company has a diagram for standard execution of
projects. This diagram links and details all activities in project execution, and ensures predictability.
A project consists of several phases, starting with the feasibility and concept phase and ending with
commissioning; see Figure 5.
Figure 5. Stages in the company project execution diagram
There are no procedures or specifications in the project execution diagram for management of the
tolerance chain. This does not imply that the company has not conducted tolerance management in
previous projects, but this implies two things:
Tolerance management is conducted internally by the work packages as part of design
How to conduct tolerance management is up to each project to decide
Not having a standardized method for conducting tolerance management leads to less predictability
and more uncertainty on this topic. Conduction by work packages leads to larger risks for tolerance
issues as a multidisciplinary approach may be lacking. The result of the tolerance management is
consequently dependent on the choices made and actions performed by the engineers involved in the
process.
Discovery of issues and Non Conformance Reports. Company engineers discover issues during
manufacturing and while testing the produced equipment. There are several stages of testing, and the
final stage of testing before hand-over to client is System Integration Testing (SIT). The purpose of
SIT is to assemble smaller parts of the production system and test functionality and mechanical
interfaces. Another purpose of SIT is to test offshore procedures for installation, operation, and
retrieval of system components. SIT is the most critical testing stage to discover issues that requires
design changes. At this stage, changes are costly, and can induce delays of delivery. However,
engineers cannot fully validate tolerance management until this stage, and while installing the
equipment subsea. The company has a system for recording issues discovered during manufacturing,
fabrication and testing of equipment. When engineers discover issues, they report this as a Non
Conformance Report (NCR). The NCR includes reason for NCR, why, how and when the engineers
discovered the issue, and the responsible owner of the issue. The responsible owner then has to
manage the issue and is responsible for closing the NCR.
Engineers may also solve issues without reporting NCRs. Issues occurring during installation is not
part of company scope of work. Company engineers are hence not reporting these in the NCR system.
The consequence is that not all issues occurring are traceable in the NCR system. Hence is the NCRs
alone not a perfectly suited measure of the effectiveness of a tolerance management method in the
perspective of robustness of installation.
Feasability and concept
Tender phase: Tender and
kick-off
System definition
Detailing and fabrication
Testing and completion
Installation and
commissioning support
Pre-execution Project execution Commissioning

Tolerance management in the company. The company has identified that currently the process of
tolerance management is inconsistent regarding methodology and results. Inconsistency is
constraining development of the tolerance management process. Further, it complicates transfer of
experience between projects. The company wishes to standardize this process to ensure consistency.
Previous research developed a method for tolerance management using tolerance budgets and system
modeling (Henanger 2015). This method needs further validation. Two other methods have
previously been in use for tolerance management by the company. One of these methods involves
dedicated software. The other utilizes manual calculations. We study if any of these methods is
preferred to the other. A decisive factor for such preference is the credibility and reliability of the
methods. The purpose of this study is to recommend a standardized method for tolerance management
in the company.
The client’s needs
We have interviewed three clients about their needs in deploying a SPS. Clients identify installation
cost as an important factor of a SPS project. The strategies to achieve low installation costs are
dependent on the client and the project. We identify the following needs:
- Low weight and volume of system components
- Flexibility in installation
- Independency from specialty tools
Independency from specialty tools reduces hardware costs and the need for special competence of
such tools. Specialty tools in this setting means tooling having one purpose for functionality, and/or
being specifically adapted for a project. Independency enables re-use of tools from project to project.
Flexibility in installation reduces the installation time. A flexible order of operations enables
operators to perform installation based on availability of the components and weather conditions. The
client addressing flexibility as a need argues that product standardization will mitigate increasing
complexity of the SPS as consequence of increased flexibility. They argue that they earn additional
cost of standardization back by the reduced lead-time for products.
Size and weight of the system components determine the lifting capacity and size requirements for
the installation rig or vessel. The rental costs increase with the size of the vessel, rigs being the most
costly.
Tolerance is a challenge to the company. Tolerance issues can lead to delays in the delivery and errors
during installation. They can cause severe commercial consequences to clients. Hence, the clients are
expecting on-time deliveries, and no tolerance related errors during installation.
Tolerance management in practice
Research basis. We use three company projects as basis for this research. We hereby refer to these
projects as project A, B and C.
We research various methods for tolerance management. Project teams performed tolerance
management differently in project A and B. We conduct a comparative research of the methods they
used, focusing on credibility and reliability of the methods. First, we study tolerance issues reported
for these projects. The numbers of tolerance issues reported indicates the reliability of the methods.
Secondly, we interview key personnel involved about the methods’ credibility. In addition, we
research the time spent on the methods. By comparing the time spent on each method with the result
of the method, this can imply the efficiency of the method.

Tolerance management in project A. Project A is located on the coast of Congo. The project
consists of 18 satellite production wells, 10 satellite water injection wells, and 6 manifolds. The sea
depth is approximately 1350m. The operator of the project is a large international oil company.
Project A used a software tool (RD&T 2016) for tolerance management currently in use in the car
industry, being new to the company. The software utilizes the Geometrical Dimensioning &
Tolerancing (GD&T) method for input. GD&T is a symbolic language for manufacturing drawings
that defines and communicates the allowed deviation of the location, dimension, orientation, size and
form of each feature of a design model. This enables an accurate calculation of the tolerance chain in
3D. Additionally, this creates a direct link between the tolerance analysis and manufacturing. The
software utilizes a statistical model for calculation of the tolerance chain. This statistical model uses
given tolerance criteria and utilizes a ten-sigma Monte Carlo simulation with a uniform probability
distribution. The software treats the mean value of the simulation as the statistically most probable
tolerance value. Engineers that applied the software state that the outcome of the model is hard to
predict. In the worst case, the actual manufactured component may end up outside the bounds of
predicted tolerance values.
Result of tolerance management in project A. An estimate shows that the hours spent on this
activity is approximately 3500 hours. The total amount of hours booked on this project is
approximately 2358600. This means that this activity makes up 0.13 % of the total. We study NCRs
reported in project A and find 57 NCRs that relate to tolerance issues. However, this number is
inaccurate due to variation in descriptions of NCRs and difficulties in sorting out NCRs that relates
to tolerances. As engineers may solve issues without reporting NCRs, there may be more issues than
the NCR system shows.
Credibility of tolerance management in project A. Engineers involved in project A are not
conclusive about the method used. The GD&T method makes the creation of the input to the method
time consuming. Engineers point out in the evaluation of the method that both understanding of the
software and understanding of tolerances are key factors for successful conduction. Engineers
involved in this also point out that not being in control over every operation within the software makes
validation of the result difficult. This decreases the value of the accurate result.
Installation issues in project A. Through interviews with engineers that participated in the
installation sequence in project A, we learn that project A experienced some installation issues. These
issues relate to installation of the THs. When installing a SPS, operators use a Blow-Out Preventer
(BOP) as a tool for temporarily control the pressure in the well during installation and drilling. Down-
whole equipment such as the TH is lowered through the BOP and into the well. Due to the sea depth
and weight of the landing string, a torsion effect of the landing string occurred, consequently leading
to the landing string being in a non-concentric position in the BOP. See Figure 6. The left most figure
shows the landing string in nominal position, with the TH installation tools and the TH in the BOP.
The rightmost picture shows the effect of torsion of the landing string, leading to a non-concentric
position in the BOP. The consequence of the landing string being in a non-concentric position is
failure of installation of the TH. In project A, this led to repeated attempts before successful
installation of the TH, consequently compromising the robustness of the installation operation.
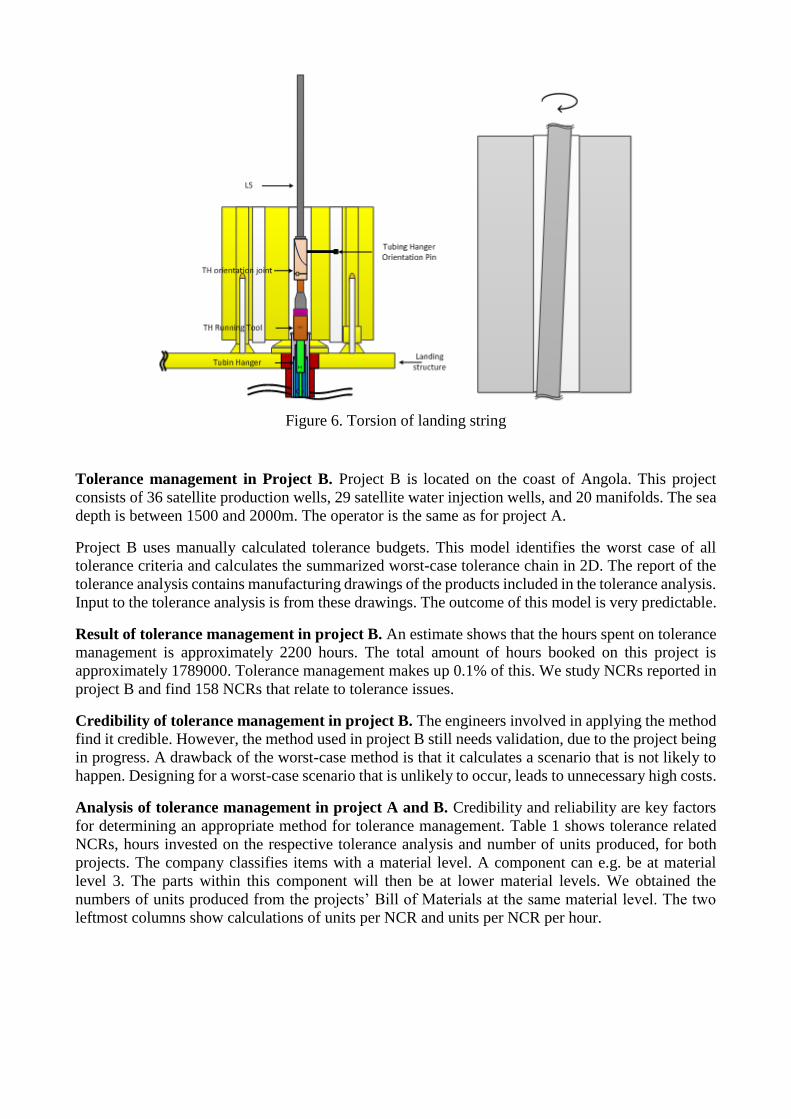
Figure 6. Torsion of landing string
Tolerance management in Project B. Project B is located on the coast of Angola. This project
consists of 36 satellite production wells, 29 satellite water injection wells, and 20 manifolds. The sea
depth is between 1500 and 2000m. The operator is the same as for project A.
Project B uses manually calculated tolerance budgets. This model identifies the worst case of all
tolerance criteria and calculates the summarized worst-case tolerance chain in 2D. The report of the
tolerance analysis contains manufacturing drawings of the products included in the tolerance analysis.
Input to the tolerance analysis is from these drawings. The outcome of this model is very predictable.
Result of tolerance management in project B. An estimate shows that the hours spent on tolerance
management is approximately 2200 hours. The total amount of hours booked on this project is
approximately 1789000. Tolerance management makes up 0.1% of this. We study NCRs reported in
project B and find 158 NCRs that relate to tolerance issues.
Credibility of tolerance management in project B. The engineers involved in applying the method
find it credible. However, the method used in project B still needs validation, due to the project being
in progress. A drawback of the worst-case method is that it calculates a scenario that is not likely to
happen. Designing for a worst-case scenario that is unlikely to occur, leads to unnecessary high costs.
Analysis of tolerance management in project A and B. Credibility and reliability are key factors
for determining an appropriate method for tolerance management. Table 1 shows tolerance related
NCRs, hours invested on the respective tolerance analysis and number of units produced, for both
projects. The company classifies items with a material level. A component can e.g. be at material
level 3. The parts within this component will then be at lower material levels. We obtained the
numbers of units produced from the projects’ Bill of Materials at the same material level. The two
leftmost columns show calculations of units per NCR and units per NCR per hour.
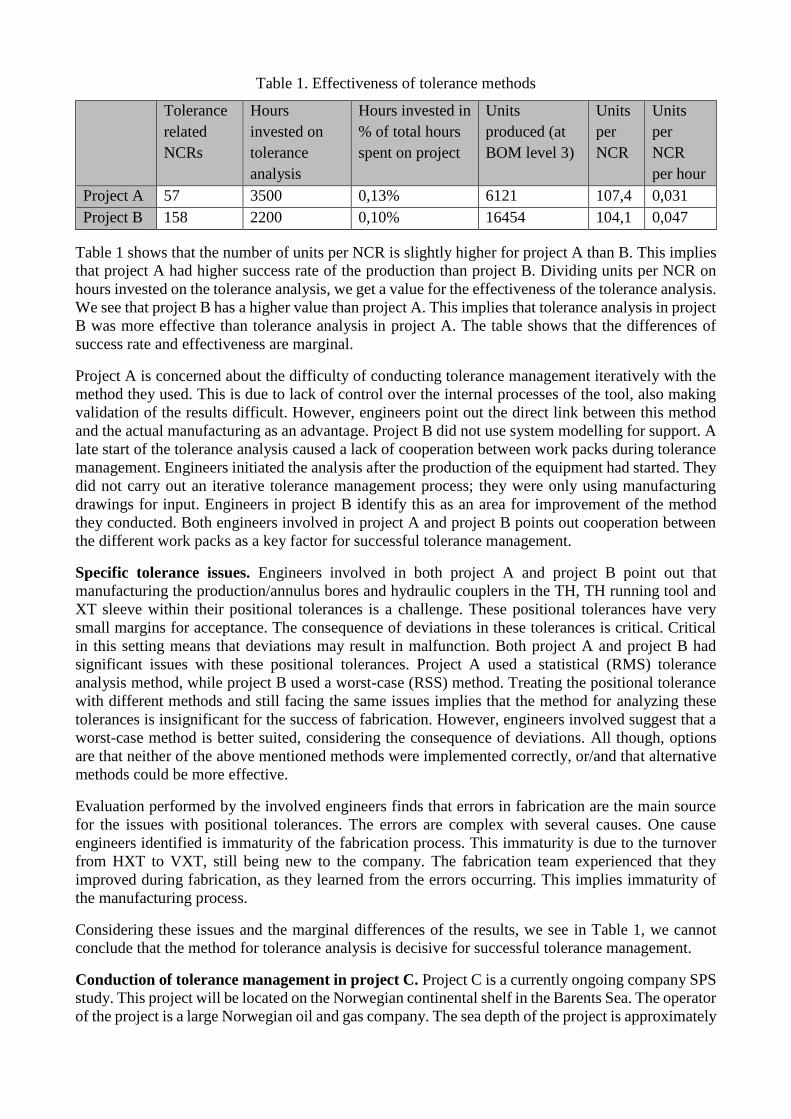
Table 1. Effectiveness of tolerance methods
Tolerance
related
NCRs
Hours
invested on
tolerance
analysis
Hours invested in
% of total hours
spent on project
Units
produced (at
BOM level 3)
Units
per
NCR
Units
per
NCR
per hour
Project A 57 3500 0,13% 6121 107,4 0,031
Project B 158 2200 0,10% 16454 104,1 0,047
Table 1 shows that the number of units per NCR is slightly higher for project A than B. This implies
that project A had higher success rate of the production than project B. Dividing units per NCR on
hours invested on the tolerance analysis, we get a value for the effectiveness of the tolerance analysis.
We see that project B has a higher value than project A. This implies that tolerance analysis in project
B was more effective than tolerance analysis in project A. The table shows that the differences of
success rate and effectiveness are marginal.
Project A is concerned about the difficulty of conducting tolerance management iteratively with the
method they used. This is due to lack of control over the internal processes of the tool, also making
validation of the results difficult. However, engineers point out the direct link between this method
and the actual manufacturing as an advantage. Project B did not use system modelling for support. A
late start of the tolerance analysis caused a lack of cooperation between work packs during tolerance
management. Engineers initiated the analysis after the production of the equipment had started. They
did not carry out an iterative tolerance management process; they were only using manufacturing
drawings for input. Engineers in project B identify this as an area for improvement of the method
they conducted. Both engineers involved in project A and project B points out cooperation between
the different work packs as a key factor for successful tolerance management.
Specific tolerance issues. Engineers involved in both project A and project B point out that
manufacturing the production/annulus bores and hydraulic couplers in the TH, TH running tool and
XT sleeve within their positional tolerances is a challenge. These positional tolerances have very
small margins for acceptance. The consequence of deviations in these tolerances is critical. Critical
in this setting means that deviations may result in malfunction. Both project A and project B had
significant issues with these positional tolerances. Project A used a statistical (RMS) tolerance
analysis method, while project B used a worst-case (RSS) method. Treating the positional tolerance
with different methods and still facing the same issues implies that the method for analyzing these
tolerances is insignificant for the success of fabrication. However, engineers involved suggest that a
worst-case method is better suited, considering the consequence of deviations. All though, options
are that neither of the above mentioned methods were implemented correctly, or/and that alternative
methods could be more effective.
Evaluation performed by the involved engineers finds that errors in fabrication are the main source
for the issues with positional tolerances. The errors are complex with several causes. One cause
engineers identified is immaturity of the fabrication process. This immaturity is due to the turnover
from HXT to VXT, still being new to the company. The fabrication team experienced that they
improved during fabrication, as they learned from the errors occurring. This implies immaturity of
the manufacturing process.
Considering these issues and the marginal differences of the results, we see in Table 1, we cannot
conclude that the method for tolerance analysis is decisive for successful tolerance management.
Conduction of tolerance management in project C. Project C is a currently ongoing company SPS
study. This project will be located on the Norwegian continental shelf in the Barents Sea. The operator
of the project is a large Norwegian oil and gas company. The sea depth of the project is approximately

1250m. The operator wants to explore a combined solution with installation of VXTs in 4-slot
templates and installation of VXTs on satellite Installation Guide Structures (IGS).
For tolerance management in project C, we used tolerance budgets supported by system modeling.
The tolerance chain starts with drilling of the well, and ends when all parts of the SPS is installed and
connected. Due to simplicity and company scope, the tolerance budget we used in this investigation
summarizes the tolerance chain in installation of the Vertical XT (VXT), relative to the well axis. The
tolerance budget considers manufacturing tolerances as well as installation tolerances. We used
system modelling to support the tolerance budget by visualization.
During this research, we investigate the use of tolerance budgets and system modeling for successful
tolerance management. We divided the tolerance budget into tolerance nodes, and modeled the nodes
in the budget; see Figure 7 as an example. Tolerance management should be an iterative process:
Work pack engineers supply input for tolerance values, system engineers calculate the tolerance
chain, find areas of concern and give feedback to the WP engineers. WP engineers make adjustments
and supply new input. We initiated tolerance management during early design phase to research if
this enables an iterative adjustment process. We showed the models during design meetings with
design engineers from all work packages present. An important part of the method is to enhance
communication, and get the involved engineers to understand the tolerance chain and the
dependencies of tolerances between components. Understanding and communication are
prerequisites for cooperation. Understanding and cooperation are also important for achieving the
overall goal of improving robustness and reducing costs. Another purpose of system modelling is to
prevent loss of tacit knowledge, enabling future investigation of the tolerance budget by any engineer.
The benefit of this is consistency in how the company performs tolerance management.
This method requires some additional work during the engineering phase of the projects. One
engineer need to generate the budget, create the models and iteratively update this throughout the
engineering phase. It is important to note that the input to the budget and the models shall come from
the WPs.
We ask design engineers in project C how they consider the supporting models. They respond that
the supporting models enhance understanding, and supports discussion and exploration. They also
highlight that the models allow for future verification and modification by any engineer.

Figure 7. Example of a model of a tolerance node
We conducted tolerance management in the study phase of a project. To mitigate tolerance issues in
the tie-in hub on the VXT and on the manifold/production jumper, engineers in project C decided to
change from a horizontally connected to a vertically connected tie-in system. This reduces the
misaligning effect of rotation of the XT. Except for engineers hours put into design of the system,
this had no additional cost.
Project C learned from the installation process in project A that torsion of the landing string could
cause issues. To mitigate such issues, we included the non-concentricity of the landing string in the
tolerance chain. Through further exploration of this issue, design engineers came up with a solution
to this problem; see Figure 8. The solution is a centralizer attached to the landing string that will keep
the landing string in a concentric position in the BOP.
Figure 8. Centralizer to mitigate torsion effects
Method for tolerance management. Based on the evaluation of the tolerance management methods
used in project A and B, and the findings in project C, we suggest a method for tolerance management.
We find that the most appropriate method for performing tolerance management is using manually
calculated tolerance budgets supported by modelling for visualization. We suggest using a
combination of worst-case and statistical method. Engineers shall assess which of the two being the
most appropriate for each respective part of the tolerance analysis. As the WPs are responsible for the
tolerances of their own products, management of the tolerance chain is a multidisciplinary task,
crossing boundaries of the WPs. Hence; Systems engineers should have the responsibility, and initiate
tolerance management. However, the different work packs shall supply detailed tolerance calculations
for each component. This can ensure cooperation between the WPs, highlighted by engineers in
project A and B as a key factor for successful tolerance management. We suggest initiating tolerance
management as early as possible, already in the concept and feasibility stage if applicable. Using
tolerance budgets and system modelling requires some additional work during the engineering phase
of a project. However, it is important to find the balance in the time spent creating the models and the
complexity of the models. The purpose of these models is to enhance communication, understanding,
and exploration. We show through project C that we achieve the enhancements using simple models,
adapted to their specific intention.
Tolerance management and robustness of installation. We identified that reduction of installation
costs reduces the break-even rate. Further, we identified that robustness of the installation process
can contribute to reduction of the installation costs. Through interviews with clients, we learned that
clients expect the installation process to be fully robust. Project A experienced issues in the
installation sequence that compromised the robustness of the installation. As a mitigating action,
project C accounted for this issue in the tolerance analysis. This shows that tolerance management
can contribute to a robust installation process, consequently reducing installation costs and the break-
even rate. Findings from only one project where the operator has not yet carried out the actual
installation operation are the basis for this conclusion. Based on the observations, actions and
interviews from project A and C, we propose the following focus areas to support a robust installation
process:
Thorough tolerance management
- Manufacturing contributions considered - Thorough tolerance management should
consider tolerance contributions from manufacturing. This means that possible deviations
from nominal due to manufacturing factors of both tools and equipment shall be included
in the tolerance chain
- Interfaces considered
- Operational factors considered - Operational factors are such as torsion of the landing
string, which could result in a non-centric position relative to the well.
Maturity of tools - Maturity of tools relates to the Technology Readiness Level (TRL) of the
installation tool used
Maturity of operations - Maturity of operations considers the combined maturity of the tool used and
the equipment installed for a specific operation. For instance, this could be installing newly
developed equipment using field proven tools. A field proven tool is not necessarily ensuring
maturity of the operation
By considering and mitigating such factors, tolerance management could support a robust installation
operation, consequently supporting a reduction of the break-even rate. Another important factor is to
learn from other projects. Ensuring proper knowledge transferring is critical for improvement and
development of the tolerance management process. Project C used tolerance budgets and system
modelling for tolerance management, and this supported exploration and discussion of both
manufacturing and operational factors.

Conclusions
The goal of this research was to identify which factors impact the approach for tolerance management,
with the purpose of evolving tolerance management to increase robustness of subsea installation
operations, and increase the company’s competitiveness. To achieve this, we have studied different
methods for tolerance management. We asked the following research question: What factors impact
the tolerance management approach? Through the study we conducted, we found that understanding
of tolerance chain is a success criterion. The study shows that system modelling and budgeting
enhances understanding and discussion. The study also showed that cooperation between the work
packages is important. The tolerances between the interacting components are critical to achieve
success during installation of an SPS. A factor impacting the approach for tolerance management is
hence that the work packages develop understanding of each other’s tolerances, and that culture for
systematic thinking is developed. The research shows that system modelling and budgeting enabled
an iterative design process. In the project where this method was used, the WPs cooperated to find
design solutions to mitigate tolerance issues. Another factor impacting the approach for tolerance
management is the necessary and available competence. Some approaches require special
competence. The company should consider whether this is considered core competence or if this
needs to be hired in. Considering understanding and cooperation, a key question is if that competence
is transferable across projects and work packages. An example of this is project B, which used a
method of tolerance analysis that partly relied on hired expertise, and very few key people. This led
to limited understanding for tolerance analysis amongst other engineers involved in the project. We
also saw that there are pros and cons of the approach for calculating the tolerance chain. Manual
calculations are perceived to develop an understanding of tolerance chain, and is easy to adapt.
Calculations in dedicated software is perceived as accurate, but is harder to adapt, and does not
support understanding of the tolerance chain. Additionally, dedicated software is requiring special
competence. The research we performed also showed that use of statistically calculated tolerances
and tolerance calculations based on worst-case scenarios deviates minimally in impact of the
tolerance management approach.
The industry seeks reduction of the break-even rate. Installation costs determine substantial shares of
OPEX. We identified a potential for reducing the installation costs by increasing robustness of the
installation process. We asked the research question: How can tolerance management support
robustness of installation? Through the research, we learned that tolerance management could support
a robust installation process by including manufacturing and operational factors in the tolerance
analysis. A prerequisite for this is proper knowledge and experience sharing between projects.
Tolerance budgets and system modelling supported exploration and discussion of manufacturing and
operational factors.
Future Research
For future research, we suggest baselining and imbedding the integrated tolerance management
process at enterprise level. The purpose of this is to control effective and efficient tolerance
management and consequently SPS installation savings.
The research shows that tolerance issues occur partly due to immaturity of products and
manufacturing processes. Maturity is a topic that could benefit for further investigation.
In this paper, we have focused on mitigating external noise factors. Future research could focus on
internal noise factors by implementing the Taguchi methods for increasing robustness of the
manufacturing process. We have not assessed quantity and time spent on tolerance issues outside the
NCR system in this paper. This can be issues occurring in the installation process. We suggest that
future research continue the investigation of robustness of the installation process by investigating
time and quantity of tolerance issues outside the NCR system.

References
Adams C., 2016, "Financial Times," The Financial Times LTD 2016, 14 January 2016. [Online].
Available: http://www.ft.com/intl/cms/s/0/50bbaec2-ba0e-11e5-bf7e-8a339b6f2164.html.
[Accessed 26 April 2016].
Borney N., 2016, "USA Today," Gannett Satellite Information Network, LLC, 8 January 2016.
[Online]. Available: http://www.usatoday.com/story/money/2015/12/31/energy-oil-gas-us-
jobs/78066610/. [Accessed 26 April 2016].
(IEEE1990) IEEE, IEEE Standard Glossary of Software Engineering Terminology, New York:
IEEE, 1990.
INCOSE (2015). Systems engineering Handbook: A Guide for Systems Life Cycle Process and
Activities (4th ed.). D.D. Waldem, G.J. Roedler, K.J. Forsberg, R. D. Hamelin, and T.M.
Shortell (eds.). San Diego CA: International Council on Systems Engineering. Pubished by
John Wiley & Sons, Inc.
Muller G., (2013) "System Engineering Research Methods," CSER, Atlanta, 2013.
Henanger T. and G. Muller, 2015, "Managing Installation Tolerances through System Modeling and
Tolerance Budgeting," INCOSE 2015 in Seattle, USA.
RD&T, 2016 RD&T Technology AB, 13 05 2016. [Online]. Available: www.RDNT.se. [Accessed
13 05 2016].
Biography
Lars Petter Bryn works as a Systems Engineer in a Norwegian company
suppling products and services to the oil and gas industry. He holds a
Bachelor degree in energy and environmental engineering from Oslo
University College from 2011. From 2011 until 2013, Lars Petter
worked as a consultant engineer within building services, designing and
dimensioning heating, water supply and ventilation in commercial and
public buildings. He started to work as a system engineer in 2013 and
has 3 years of experience as a systems engineer in the subsea oil and gas
industry. Lars Petter has worked with several subsea production system
projects and has experience with system integration testing and tolerance
analysis of system components. This paper is the result of the research
done for his M.Sc. in Systems Engineering at the University College of
Southeast Norway.
Gerrit Muller, originally from the Netherlands, received his Master’s
degree in physics from the University of Amsterdam in 1979. He worked
from 1980 until 1997 at Philips Medical Systems as a system architect,
followed by two years at ASML as a manager of systems engineering,
returning to Philips (Research) in 1999. Since 2003 he has worked as a
senior research fellow at the Embedded Systems Institute in Eindhoven,
focusing on developing system architecture methods and the education
of new system architects, receiving his doctorate in 2004. In January
2008, he became a full professor of systems engineering at Buskerud and
Vestfold University College in Kongsberg, Norway. He continues to
work as a senior research fellow at the Embedded Systems Innovations
by TNO in Eindhoven in a part-time position. All information (System
Architecture articles, course material, curriculum vitae) can be found at:
Gaudí systems architecting http://www.gaudisite.nl/
Gerrit Muller
Lars Petter Bryn
![Audiovisual robustness: exploring perceptual tolerance to ...folk.uio.no/paalh/publications/files/mtap2014-audiovisual.pdf · established at the time [34]. As multiplexing became](https://img.pdfslide.net/doc/110x75/5e6c709cc0293f2bf34a9651/audiovisual-robustness-exploring-perceptual-tolerance-to-folkuionopaalhpublicationsfilesmtap2014-.jpg)