Embed Size (px)
Citation preview
2021 Evergy Investor Day

2021 Evergy Investor Day2
Important InformationForward Looking Statements
Statements made in this presentation that are not based on historical facts are forward-looking, may involve risks and uncertainties, and are intended to be as of the date when made. Forward-looking statements include, but are
not limited to, statements relating to Evergy’s strategic plan, including, but not limited to, those related to earnings per share, dividend, operating and maintenance expense and capital investment goals; the outcome of legislative
efforts and regulatory and legal proceedings; future energy demand; future power prices; plans with respect to existing and potential future generation resources; the availability and cost of generation resources and energy
storage; target emissions reductions; and other matters relating to expected financial performance or affecting future operations. Forward-looking statements are often accompanied by forward-looking words such as “anticipates,”
“believes,” “expects,” “estimates,” “forecasts,” “should,” “could,” “may,” “seeks,” “intends,” “proposed,” “projects,” “planned,” “target,” “outlook,” “guidance,” “remain confident,” “goal,” “will” or other words of similar meaning.
Forward-looking statements involve risks, uncertainties and other factors that could cause actual results to differ materially from the forward-looking information.
In connection with the safe harbor provisions of the Private Securities Litigation Reform Act of 1995, Evergy, Inc., Evergy Kansas Central, Inc. and Evergy Metro, Inc. (collectively, the Evergy Companies) are providing a number
of risks, uncertainties and other factors that could cause actual results to differ from the forward-looking information. These risks, uncertainties and other factors include, but are not limited to: economic and weather conditions and
any impact on sales, prices and costs; changes in business strategy or operations; the impact of federal, state and local political, legislative, judicial and regulatory actions or developments, including deregulation, re-regulation,
securitization and restructuring of the electric utility industry; decisions of regulators regarding, among other things, customer rates and the prudency of operational decisions such as capital expenditures and asset retirements;
changes in applicable laws, regulations, rules, principles or practices, or the interpretations thereof, governing tax, accounting and environmental matters, including air and water quality and waste management and disposal; the
impact of climate change, including increased frequency and severity of significant weather events and the extent to which counterparties are willing to do business with, finance the operations of or purchase energy from the
Evergy Companies due to the fact that the Evergy Companies operate coal-fired generation; prices and availability of electricity in wholesale markets; market perception of the energy industry and the Evergy Companies; the
impact of the Coronavirus pandemic on, among other things, sales, results of operations, financial condition, liquidity and cash flows, and also on operational issues, such as the availability and ability of the Evergy Companies’
employees and suppliers to perform the functions that are necessary to operate the Evergy Companies; changes in the energy trading markets in which the Evergy Companies participate, including retroactive repricing of
transactions by regional transmission organizations and independent system operators; financial market conditions and performance, including changes in interest rates and credit spreads and in availability and cost of capital and
the effects on derivatives and hedges, nuclear decommissioning trust and pension plan assets and costs; impairments of long-lived assets or goodwill; credit ratings; inflation rates; the transition to a replacement for the London
Interbank Offered Rate benchmark interest rate; effectiveness of risk management policies and procedures and the ability of counterparties to satisfy their contractual commitments; impact of physical and cybersecurity breaches,
criminal activity, terrorist attacks and other disruptions to the Evergy Companies’ facilities or information technology infrastructure or the facilities and infrastructure of third-party service providers on which the Evergy Companies
rely; ability to carry out marketing and sales plans; cost, availability, quality and timely provision of equipment, supplies, labor and fuel; ability to achieve generation goals and the occurrence and duration of planned and unplanned
generation outages; delays and cost increases of generation, transmission, distribution or other projects; the Evergy Companies’ ability to manage their transmission and distribution development plans and transmission joint
ventures; the inherent risks associated with the ownership and operation of a nuclear facility, including environmental, health, safety, regulatory and financial risks; workforce risks, including those related to the Evergy Companies’
ability to attract and retain qualified personnel, maintain satisfactory relationships with their labor unions and manage costs of, or changes in, retirement, health care and other benefits; disruption, costs and uncertainties caused by
or related to the actions of individuals or entities, such as activist shareholders or special interest groups, that seek to influence Evergy’s strategic plan, financial results or operations; the possibility that strategic initiatives,
including mergers, acquisitions and divestitures, and long-term financial plans, may not create the value that they are expected to achieve in a timely manner or at all; difficulties in maintaining relationships with customers,
employees, regulators or suppliers; and other risks and uncertainties.
This list of factors is not all-inclusive because it is not possible to predict all factors. Additional risks and uncertainties are discussed from time to time in current, quarterly and annual reports filed by the Evergy Companies with the
Securities and Exchange Commission (SEC). Reports filed by the Evergy Companies with the SEC should also be read for more information regarding risk factors. Each forward-looking statement speaks only as of the date of the
particular statement. The Evergy Companies undertake no obligation to publicly update or revise any forward-looking statement, whether as a result of new information, future events or otherwise, except as required by law.
Non-GAAP Financial Measures
Evergy uses adjusted EPS and adjusted O&M which are non-GAAP financial measures. A reconciliation of the non-GAAP measures to the most directly comparable GAAP measure is included in the appendix.
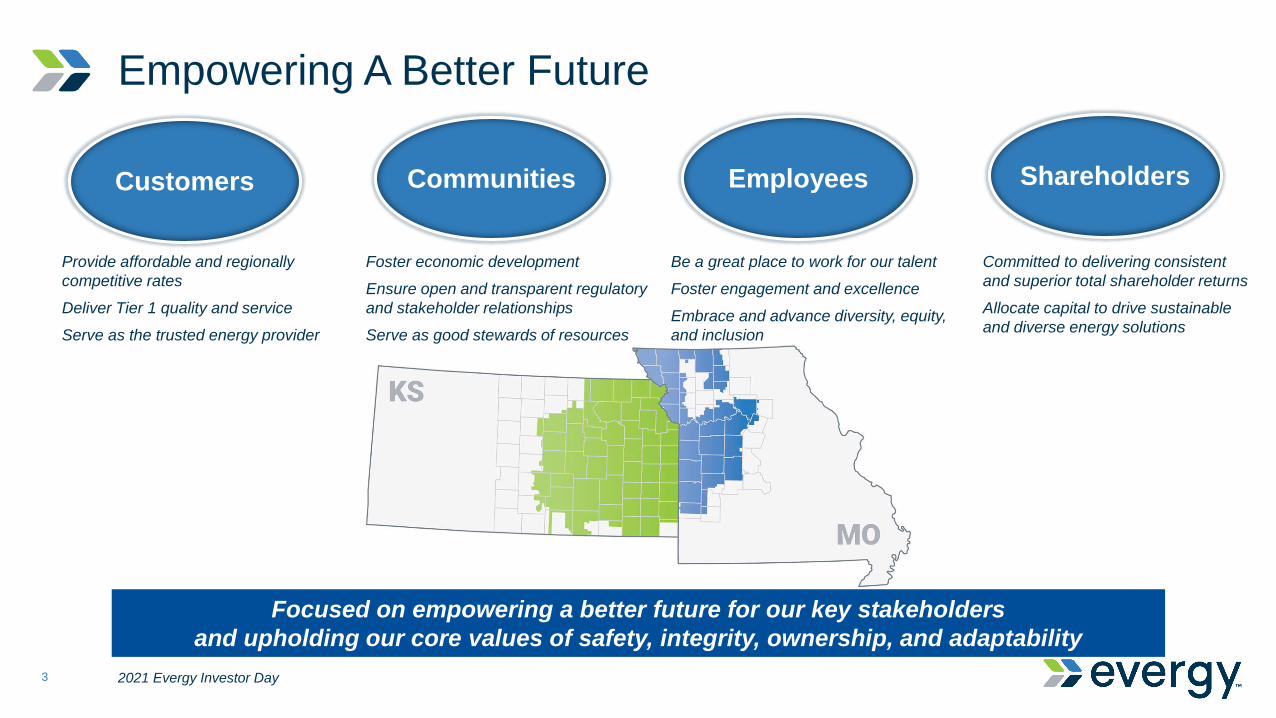
Empowering A Better Future
2021 Evergy Investor Day3
Customers Communities Employees Shareholders
Provide affordable and regionally
competitive rates
Deliver Tier 1 quality and service
Serve as the trusted energy provider
Focused on empowering a better future for our key stakeholders
and upholding our core values of safety, integrity, ownership, and adaptability
Foster economic development
Ensure open and transparent regulatory
and stakeholder relationships
Serve as good stewards of resources
Be a great place to work for our talent
Foster engagement and excellence
Embrace and advance diversity, equity,
and inclusion
Committed to delivering consistent
and superior total shareholder returns
Allocate capital to drive sustainable
and diverse energy solutions

A Focus On Service
2021 Evergy Investor Day4
Supporting Hurricane Ida Relief Storm Restoration
Winter Storm Uri

Evergy’s Executive Leadership Team
2021 Evergy Investor Day5
David CampbellPresident & Chief Executive Officer
Kirk AndrewsEVP & Chief Financial Officer
Kevin BryantEVP & Chief Operating Officer
Greg GreenwoodEVP & Chief Strategy Officer
Lesley ElwellSVP & Chief Human
Resources Officer
Heather HumphreySVP General Counsel &
Corporate Secretary
Charles KingSVP & Chief Technology Officer
Chuck CaisleySVP Public Affairs &
Chief Customer Officer
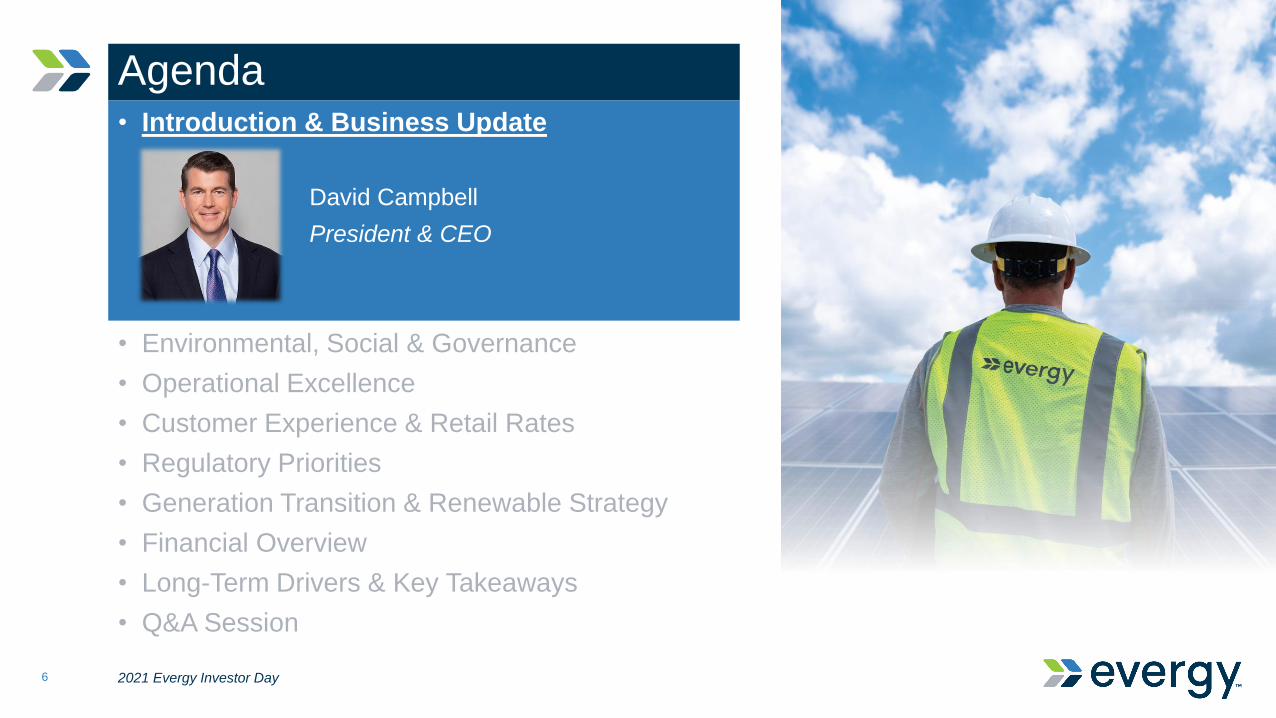
Agenda
2021 Evergy Investor Day6
• Introduction & Business Update
David Campbell
President & CEO
• Environmental, Social & Governance
• Operational Excellence
• Customer Experience & Retail Rates
• Regulatory Priorities
• Generation Transition & Renewable Strategy
• Financial Overview
• Long-Term Drivers & Key Takeaways
• Q&A Session
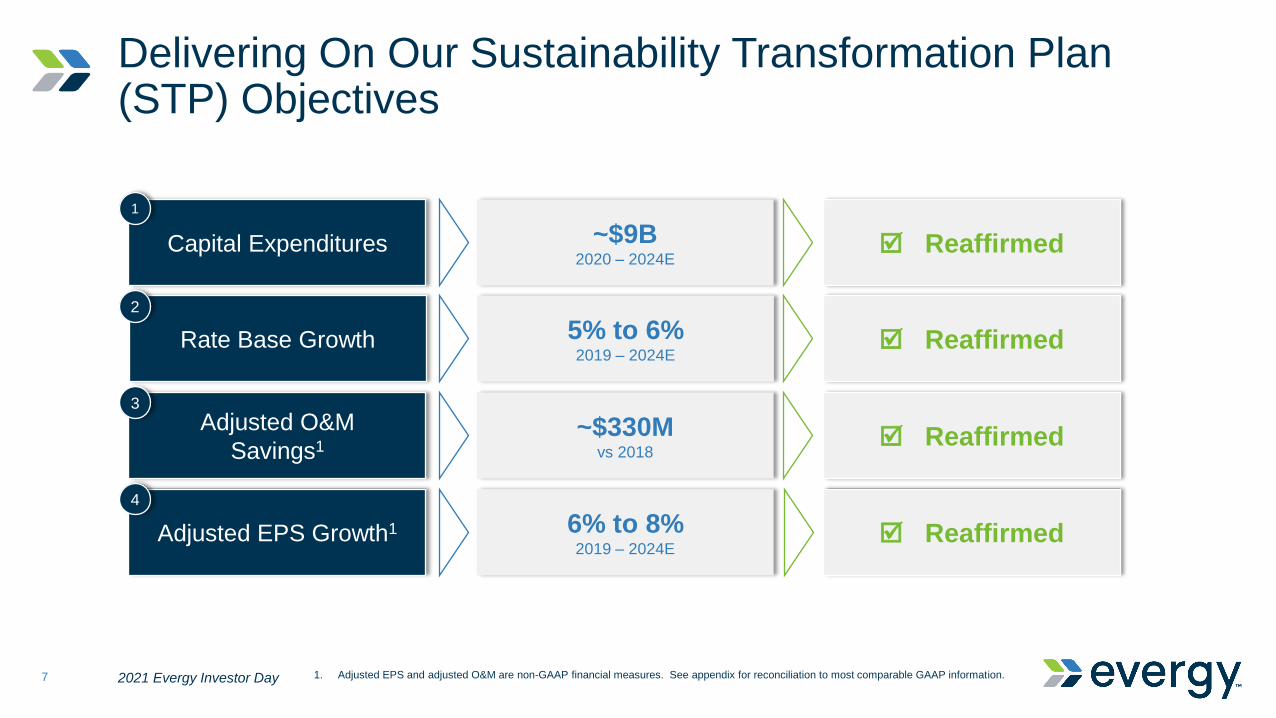
Capital Expenditures ~$9B2020 – 2024E
Delivering On Our Sustainability Transformation Plan (STP) Objectives
2021 Evergy Investor Day7
Rate Base Growth
1
5% to 6%2019 – 2024E
Adjusted EPS Growth1
2
6% to 8%2019 – 2024E
Adjusted O&M
Savings1~$330M
vs 2018
3
4
1. Adjusted EPS and adjusted O&M are non-GAAP financial measures. See appendix for reconciliation to most comparable GAAP information.
Reaffirmed
Reaffirmed
Reaffirmed
Reaffirmed

Consistent Earnings Growth | Initiating 2022E Outlook
2021 Evergy Investor Day8
Targeted Adjusted EPS Growth1
$2.89$3.10
$3.30$3.53
2019A 2020A 2021E2 2022E3
7%7%
1.Adjusted EPS is a non-GAAP financial measure.
2.Mid-point of 2021 adjusted EPS (non-GAAP) guidance range of $3.20 - $3.40.
3.Mid-point of 2022 adjusted EPS (non-GAAP) guidance range of $3.43 - $3.63.
Reaffirming
Guidance
$3.20 - $3.40
Initiating 2022 adjusted EPS1 (non-GAAP) guidance range of $3.43 to $3.63
Initiating
Guidance
$3.43 - $3.63
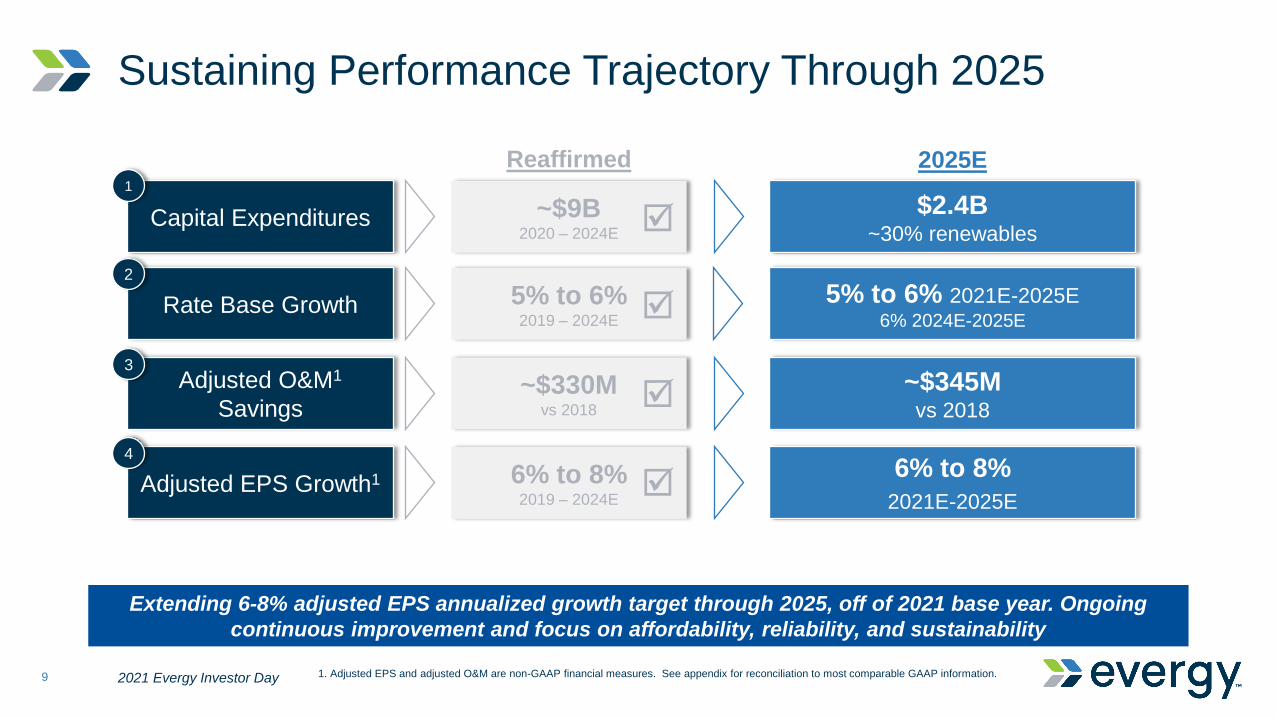
Capital Expenditures ~$9B2020 – 2024E
$2.4B~30% renewables
Sustaining Performance Trajectory Through 2025
2021 Evergy Investor Day9
Rate Base Growth
1
5% to 6%2019 – 2024E
Adjusted EPS Growth1
2
6% to 8%2019 – 2024E
Adjusted O&M1
Savings~$330M
vs 2018
3
4
Reaffirmed
2025E
6% to 8%
2021E-2025E
~$345Mvs 2018
Extending 6-8% adjusted EPS annualized growth target through 2025, off of 2021 base year. Ongoing
continuous improvement and focus on affordability, reliability, and sustainability
1. Adjusted EPS and adjusted O&M are non-GAAP financial measures. See appendix for reconciliation to most comparable GAAP information.
5% to 6% 2021E-2025E6% 2024E-2025E
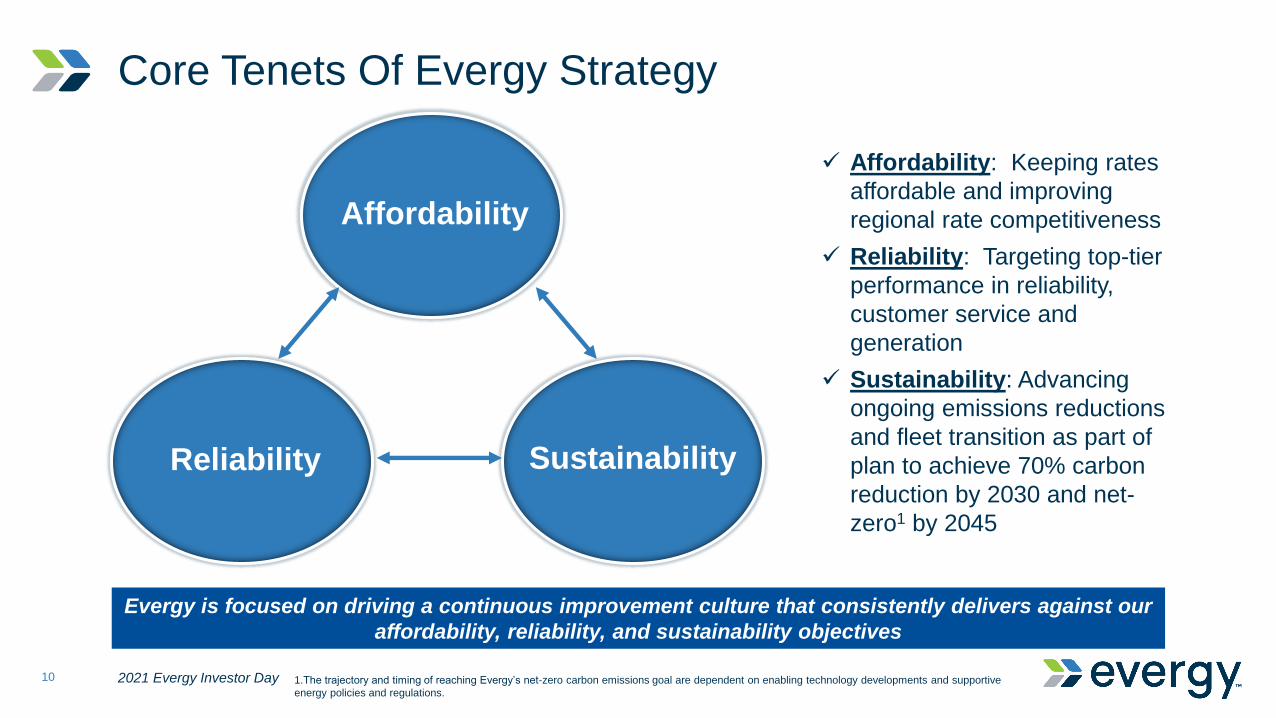
Core Tenets Of Evergy Strategy
2021 Evergy Investor Day10
Affordability
Reliability Sustainability
✓ Affordability: Keeping rates
affordable and improving
regional rate competitiveness
✓ Reliability: Targeting top-tier
performance in reliability,
customer service and
generation
✓ Sustainability: Advancing
ongoing emissions reductions
and fleet transition as part of
plan to achieve 70% carbon
reduction by 2030 and net-
zero1 by 2045
Evergy is focused on driving a continuous improvement culture that consistently delivers against our
affordability, reliability, and sustainability objectives
1.The trajectory and timing of reaching Evergy’s net-zero carbon emissions goal are dependent on enabling technology developments and supportive
energy policies and regulations.
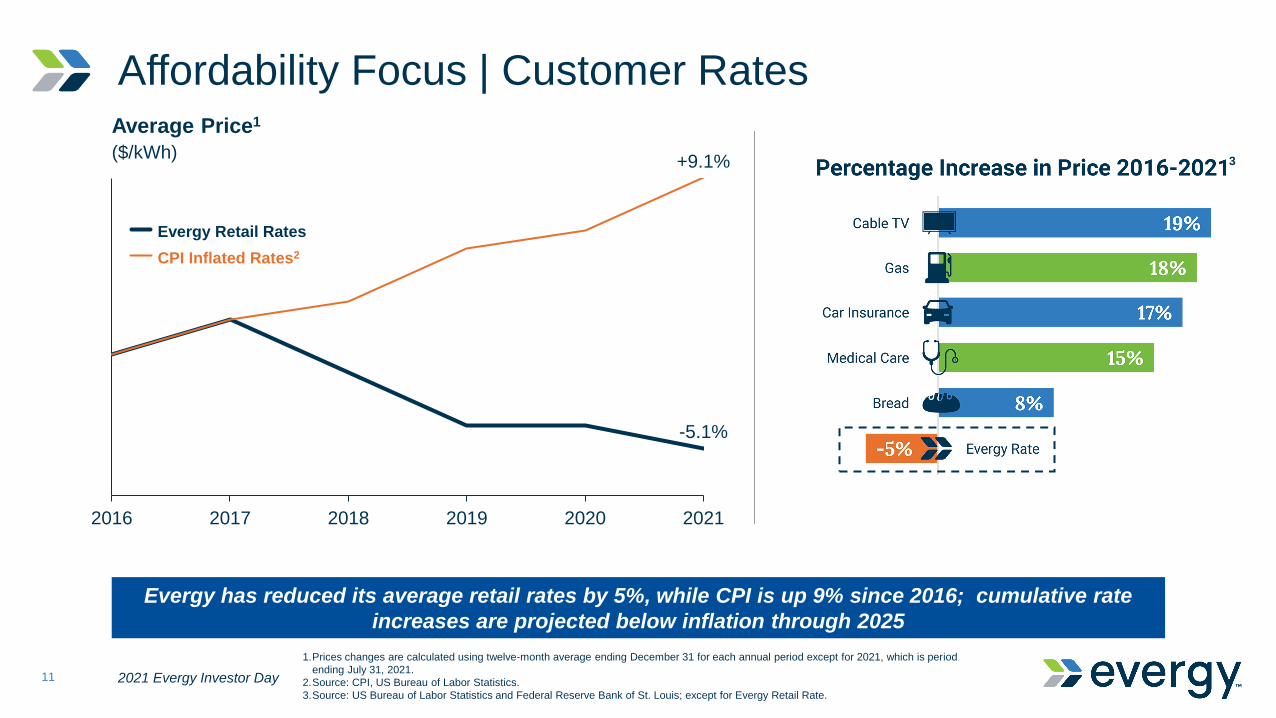
Affordability Focus | Customer Rates
2021 Evergy Investor Day11
2016 2017 2018 2019 2020 2021
+9.1%
Average Price1
($/kWh)
-5.1%
Evergy Retail Rates
CPI Inflated Rates2
Evergy has reduced its average retail rates by 5%, while CPI is up 9% since 2016; cumulative rate
increases are projected below inflation through 2025
1.Prices changes are calculated using twelve-month average ending December 31 for each annual period except for 2021, which is period
ending July 31, 2021.
2.Source: CPI, US Bureau of Labor Statistics.
3.Source: US Bureau of Labor Statistics and Federal Reserve Bank of St. Louis; except for Evergy Retail Rate.
3

1,3061,187
1,064960
2019A2018A
Adjusted O&M1
$ in millions
2020A 2025E2
-$242
-$345 or
-26%
-$104
Affordability Focus | Adjusted O&M
2021 Evergy Investor Day12
Significant ongoing cost improvements advance affordability objectives and support infrastructure
investments that improve reliability and the customer experience
1.Adjusted O&M is a non-GAAP financial measure. See appendix for reconciliation to most comparable GAAP information.
2.2025E adjusted O&M (non-GAAP) guidance of $957M to $967M.
Nearly $20M
additional O&M
efficiencies
beyond original
STP target of
~$977M in 2024
~

Reliability Focus | Operational Excellence
2021 Evergy Investor Day13
Modernizing transmission and distribution lines
Investing in smart grid technologies
Innovating vegetation management practices
Focusing on seasonal generation flexibility to meet demand in peak seasons
SAIDIOutage minutes per customer
SAIFIOutage frequency per customer
2019 2020
-5%
20202019
-4%
Targeting top-tier performance in reliability, customer service, and generation through grid
modernization and continuous improvement in operations
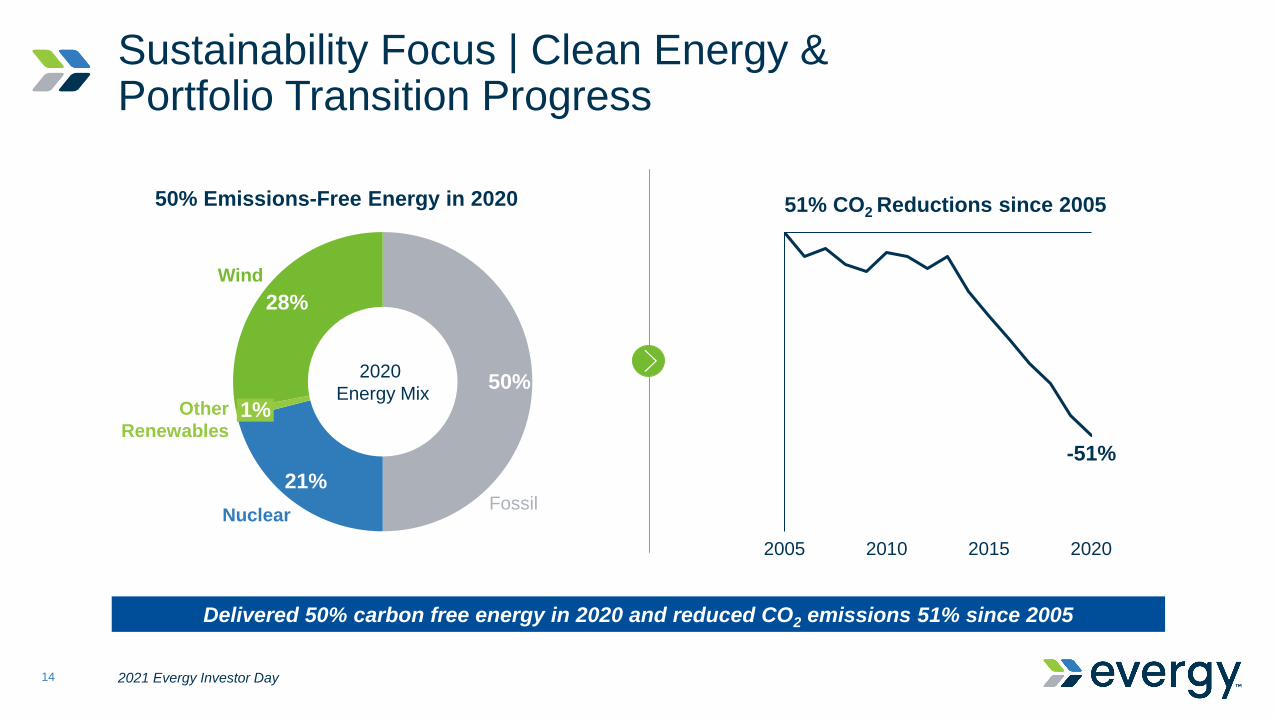
Sustainability Focus | Clean Energy & Portfolio Transition Progress
2021 Evergy Investor Day14
Delivered 50% carbon free energy in 2020 and reduced CO2 emissions 51% since 2005
50% Emissions-Free Energy in 2020
-51%
2005 2010 2015 2020
51% CO2 Reductions since 2005
50%
21%
28%
1%
Fossil
Other
Renewables
Nuclear
Wind
2020
Energy Mix

Sustainability Focus | Emissions Reductions Track Record & Targets
2021 Evergy Investor Day15
Track record of significant emissions reductions and targeting net zero carbon emissions by 2045
51%CO2 emissions
98%SO2 emissions
89%NOX emissions
Achieved Emissions Reductions Since 2005 CO2 Emission Reductions Targets1
-51%
-70%
-100%
0%
2020A 2030
Target
2045
Target
Net-Zero
1.Targets vs. 2005 levels; the trajectory and timing of reaching Evergy’s net-zero carbon emissions goal are dependent on enabling technology
developments and supportive energy policies and regulations.
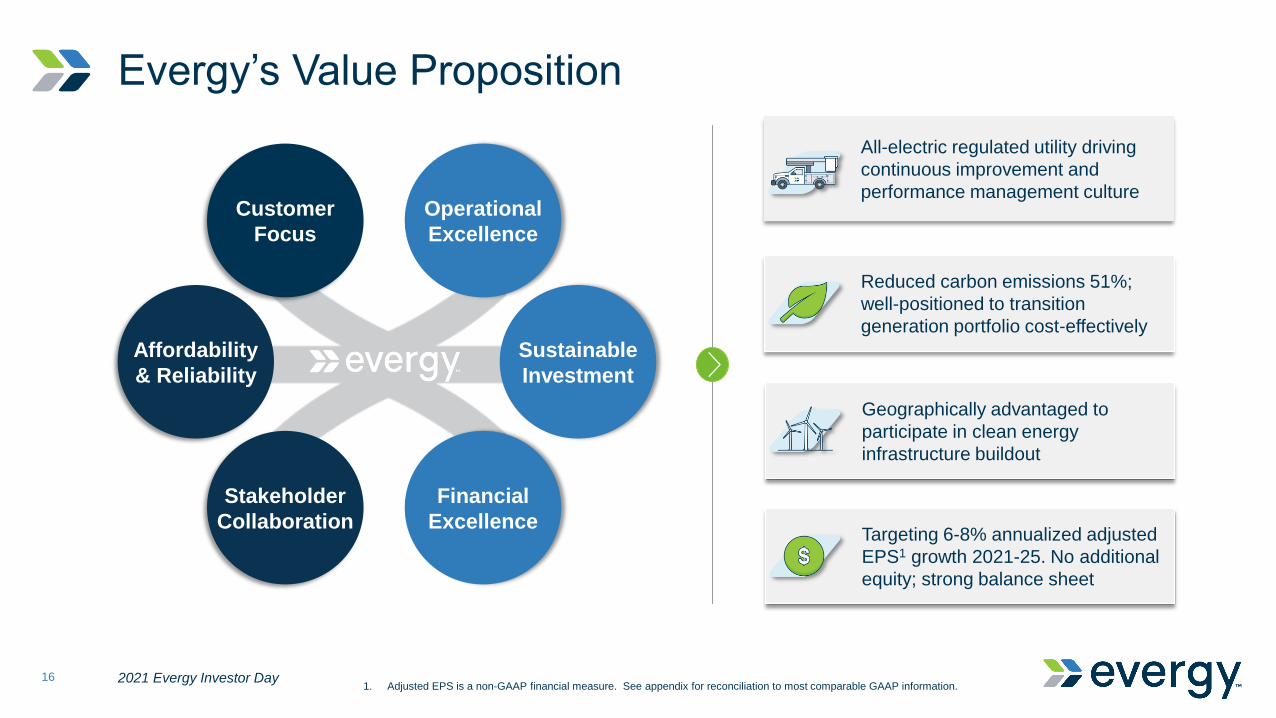
Targeting 6-8% annualized adjusted
EPS1 growth 2021-25. No additional
equity; strong balance sheet
Evergy’s Value Proposition
2021 Evergy Investor Day16
All-electric regulated utility driving
continuous improvement and
performance management cultureCustomer
Focus
Stakeholder
Collaboration
Operational
Excellence
Sustainable
Investment
Financial
Excellence
Affordability
& Reliability
1. Adjusted EPS is a non-GAAP financial measure. See appendix for reconciliation to most comparable GAAP information.
Reduced carbon emissions 51%;
well-positioned to transition
generation portfolio cost-effectively
Geographically advantaged to
participate in clean energy
infrastructure buildout
Agenda
2021 Evergy Investor Day17
• Environmental, Social & Governance
Heather Humphrey
SVP General Counsel
& Corporate Secretary
• Operational Excellence
• Customer Experience & Retail Rates
• Regulatory Priorities
• Generation Transition & Renewable Strategy
• Financial Overview
• Long-Term Drivers & Key Takeaways
• Q&A Session
• Introduction

ESG Efforts Align With & Support Evergy Strategy
2021 Evergy Investor Day18
Mission, Vision &
Values
Five-Year Strategic
Plan
MISSIONWe empower a better
future
VALUESPeople First,
Safety, Integrity,
Ownership, Adaptability
STRATEGIC PRIORITESAffordability, Reliability,
Sustainability
Evergy’s ESG focus aligns with the Company’s mission, values, and strategic priorities;
implementing a robust and accelerating focus across ESG priorities
Governance
• Board oversight
• Board composition and
diversity
• Cybersecurity
• Enterprise risk oversight
• Executive compensation
Social
• Economic development
• Community engagement
• Human capital
development
• Diversity, equity and
inclusion
• Supplier diversity
Environmental
• Emissions reductions
• Natural resources
management
• Customer solutions
• Community impacts
• Energy efficiency
Evergy Carbon Emissions Reductions vs Peers
2021 Evergy Investor Day19
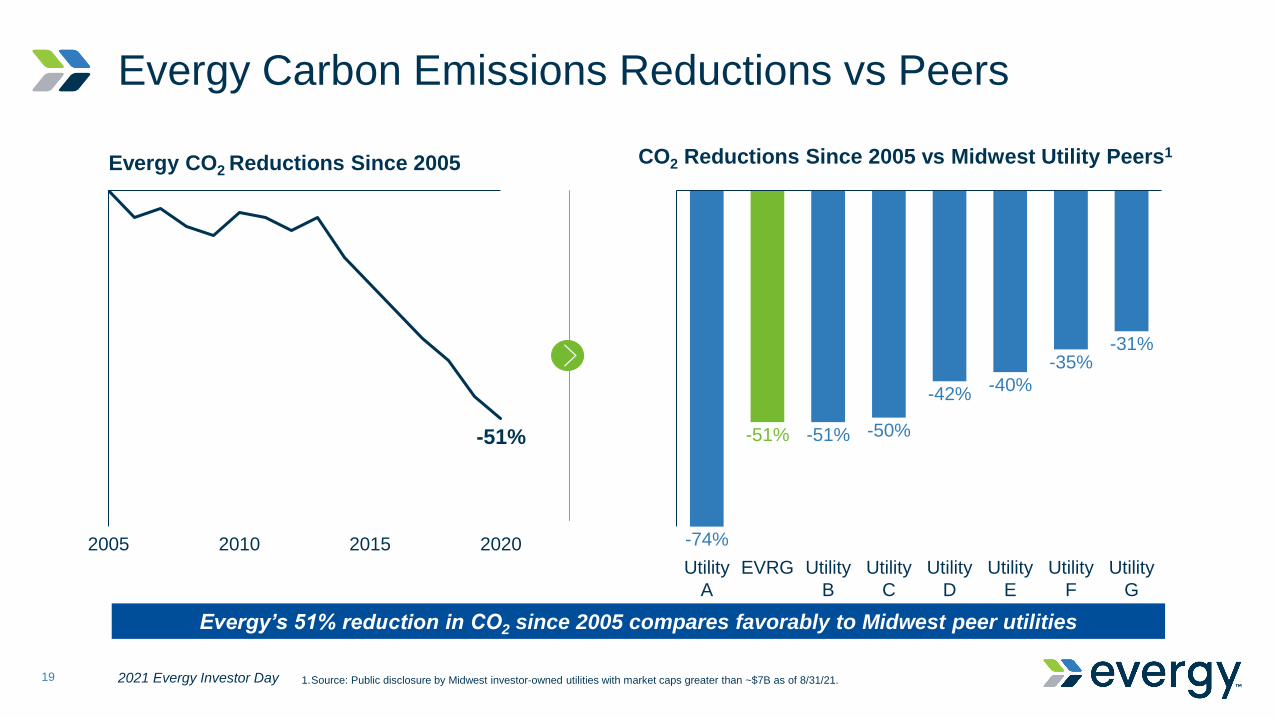
Evergy’s 51% reduction in CO2 since 2005 compares favorably to Midwest peer utilities
-51%
20202005 2010 2015
Evergy CO2 Reductions Since 2005
-74%
-51% -51% -50%
-42%-40%
-35%-31%
Utility
A
Utility
E
Utility
D
EVRG Utility
B
Utility
C
Utility
G
Utility
F
CO2 Reductions Since 2005 vs Midwest Utility Peers1
1.Source: Public disclosure by Midwest investor-owned utilities with market caps greater than ~$7B as of 8/31/21.

Relative Clean Energy Mix
2021 Evergy Investor Day20
Evergy’s emission-free energy mix compares favorably to Midwest peer utilities
75%
50%44%
35%29% 27% 25%
18%
Utility 2EVRG
2020 Emission-free Energy Mix – Evergy and Midwest Peer Utilities1
Utility 4Utility 1 Utility 3 Utility 5 Utility 6 Utility 7
1.Represents 2020 MWh's produced from renewables and nuclear generation sources compared to total generation as disclosed by Midwest
investor-owned utilities with market caps greater than ~$7B as of 8/31/21.
Generation Portfolio Transition
21
Annual EPS Growth
Target of 6% - 8%1
Annual Dividend Growth
Target of 6% - 8%2
Attractive Total
Shareholder Return
2021 Evergy Investor Day 1.Renewables include both owned and power purchase agreements.
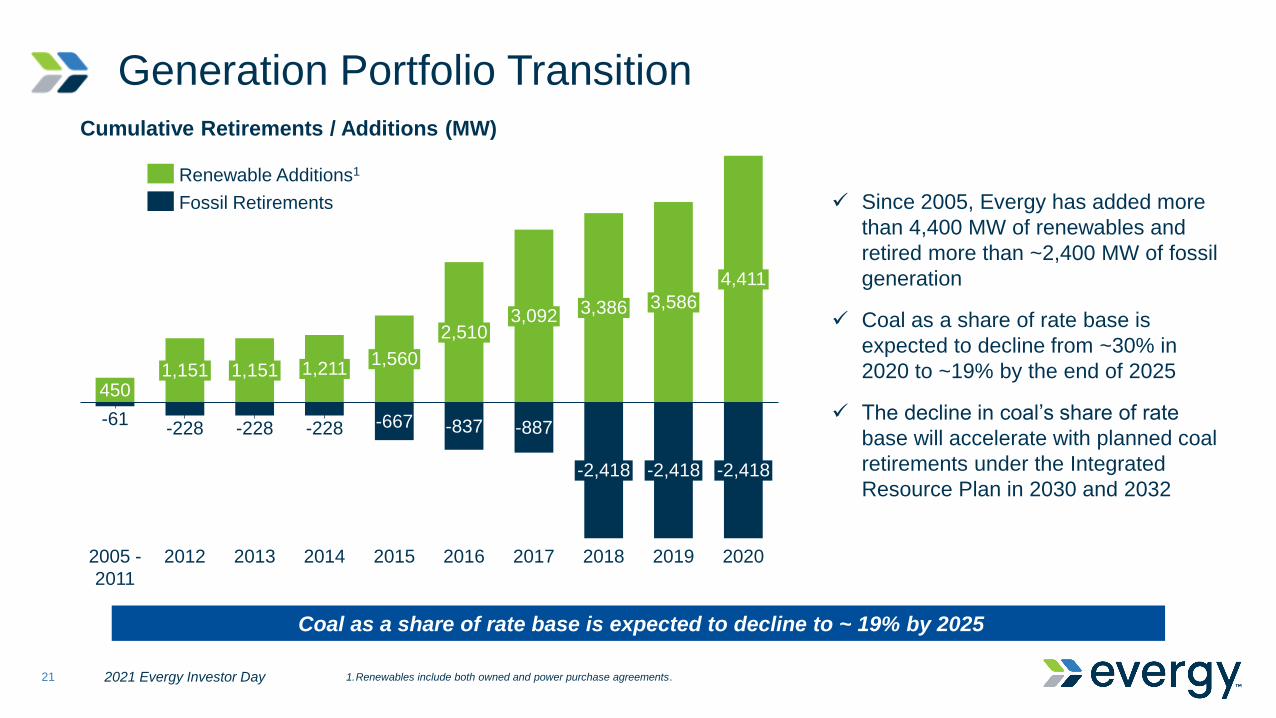
✓ Since 2005, Evergy has added more
than 4,400 MW of renewables and
retired more than ~2,400 MW of fossil
generation
✓ Coal as a share of rate base is
expected to decline from ~30% in
2020 to ~19% by the end of 2025
✓ The decline in coal’s share of rate
base will accelerate with planned coal
retirements under the Integrated
Resource Plan in 2030 and 2032
Coal as a share of rate base is expected to decline to ~ 19% by 2025
450
-61-228 -228 -228 -667 -837 -887
Cumulative Retirements / Additions (MW)
2012
2,510
2005 -
2011
1,151 1,151
3,586
2013
1,211
2014
1,560
2015 2016
3,092
2017
3,386
-2,418
2018
-2,418
2019
4,411
-2,418
2020
Renewable Additions1
Fossil Retirements
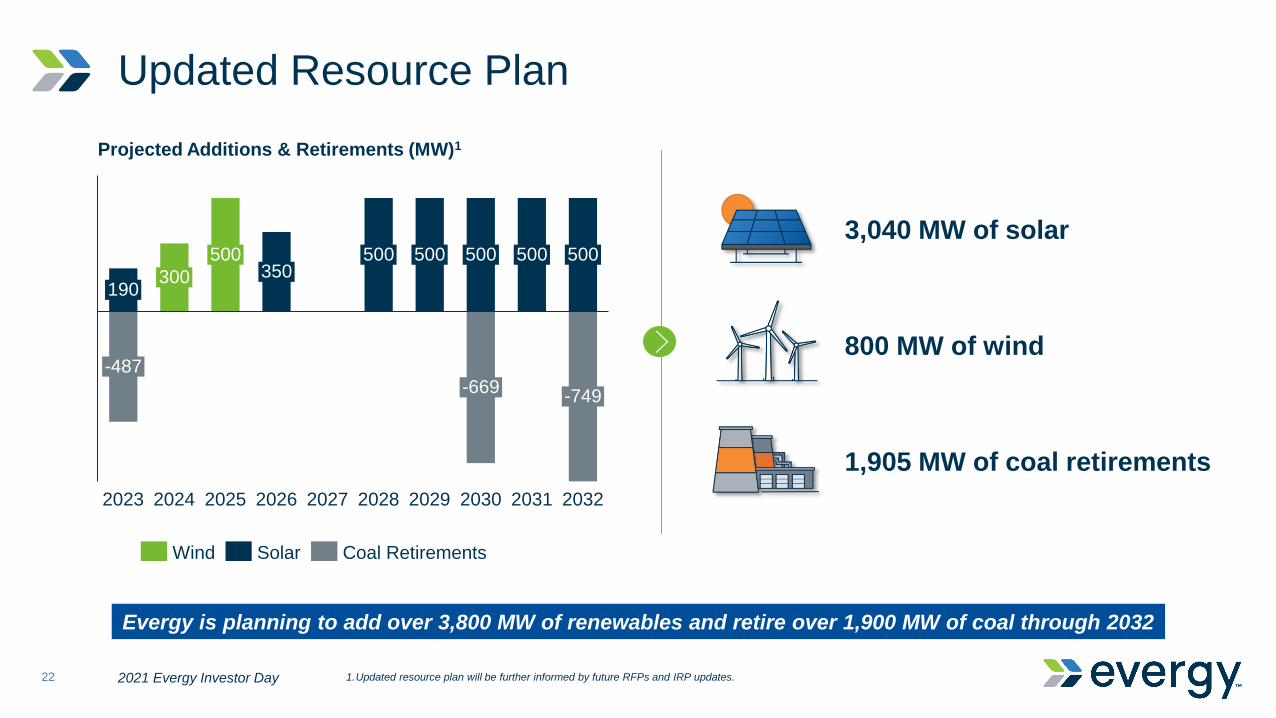
Updated Resource Plan
2021 Evergy Investor Day22
Evergy is planning to add over 3,800 MW of renewables and retire over 1,900 MW of coal through 2032
202520242023
-487
Projected Additions & Retirements (MW)1
2026
190300
500350
-749
2027
500
2028
500
2029
500
-669
2030
500
2031
500
2032
3,040 MW of solar
800 MW of wind
Coal RetirementsWind Solar
1,905 MW of coal retirements
1.Updated resource plan will be further informed by future RFPs and IRP updates.

$156 MILLIONSPENT WITH
DIVERSE
SUPPLIERS
23
Social | Community & Employee Engagement1
240+ community
Boards with Evergy
representatives
30 20,000EMPLOYEE
VOLUNTEER HOURS
~$2MCOVID
RELIEF
FUNDS
YEARS
ACTIVE
SUPPLIER
DIVERSITY
INITIATIVE
$7.5 MILLIONIN PHILANTHROPIC SUPPORT
Evergy’s
“People First”
culture fosters
engagement,
diversity, equity,
and inclusion
1.All stats as of 2020.
Employee Snapshot: 55% Bargaining
Unit, 23% Female, 15% People of Color
2021 EEI
Innovation Awardfor Supplier Diversity
150+Diverse Vendors in
2020
Named a
Top U.S. Utility
in Economic
Development
2021 Evergy Investor Day

24
Human Capital Development
2021 Evergy Investor Day
~280,000 training hours
provided to more than
5,000 employees
20% increase in
employee engagement
since 2019
7 Business Resource Groups focused on:
• Fostering a diverse, equitable, and inclusive workplace
• Developing future leaders
• Connecting employees throughout our entire service territory
• Strengthening our company culture
~10,000 hours of education provided through “Evergy Analytics University” to upskill and prepare
employees for the technology shift associated with changing, data-driven work processes
Evergy is focused on being a diverse, equitable, and inclusive company
that empowers better futures for our employees and our communities
Human Performance
Initiative kicked off in
2021 to:
• Improve performance
• Reduce safety
incidents
• Improve culture
Diversity, Equity & Inclusion initiatives focused
on development, recruiting, engagement, and
supplier diversity
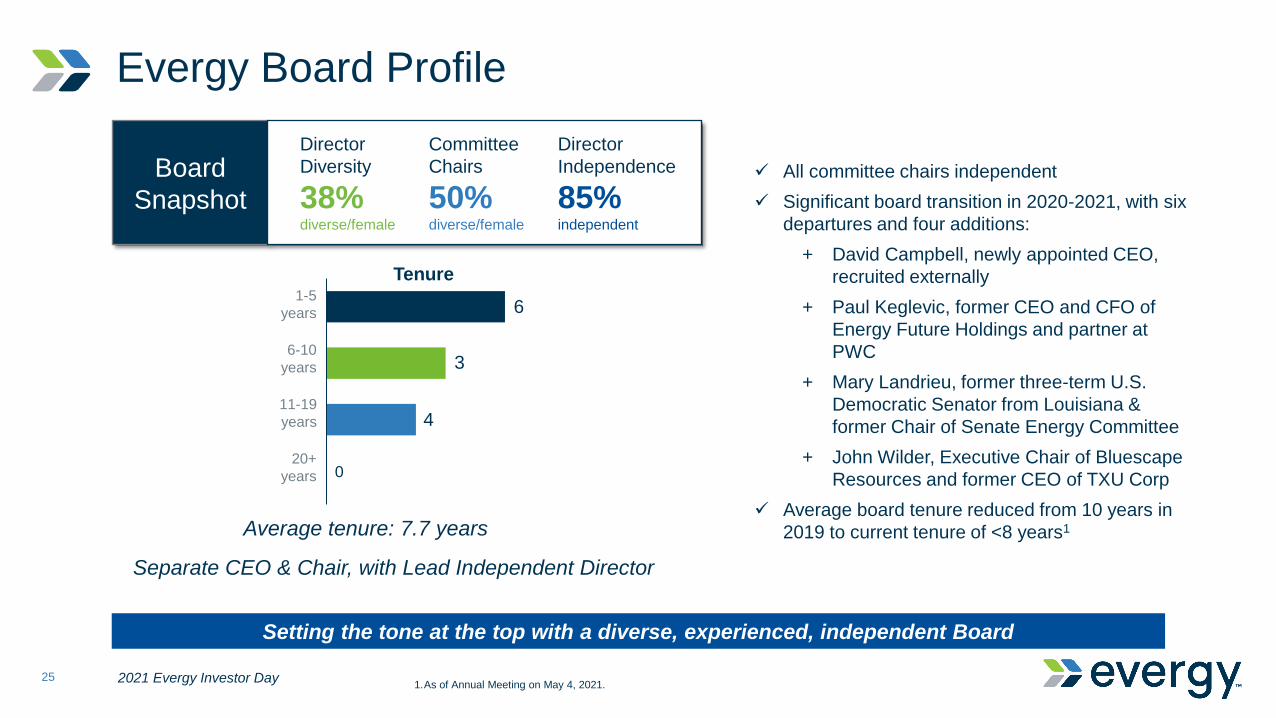
Evergy Board Profile
2021 Evergy Investor Day25
Board
Snapshot
Committee
Chairs
50%diverse/female
Director
Diversity
38%diverse/female
Director
Independence
85%independent
6
3
4
0
11-19
years
1-5
years
6-10
years
20+
years
Tenure
Average tenure: 7.7 years
Setting the tone at the top with a diverse, experienced, independent Board
✓ All committee chairs independent
✓ Significant board transition in 2020-2021, with six
departures and four additions:
+ David Campbell, newly appointed CEO,
recruited externally
+ Paul Keglevic, former CEO and CFO of
Energy Future Holdings and partner at
PWC
+ Mary Landrieu, former three-term U.S.
Democratic Senator from Louisiana &
former Chair of Senate Energy Committee
+ John Wilder, Executive Chair of Bluescape
Resources and former CEO of TXU Corp
✓ Average board tenure reduced from 10 years in
2019 to current tenure of <8 years1
Separate CEO & Chair, with Lead Independent Director
1.As of Annual Meeting on May 4, 2021.

Published first TCFD report; significantly expanded Sustainability Report
Introduced net zero target by 2045 and 70% emissions reduction by 2030
Modified 2021 executive incentive plan to support Diversity, Equity & Inclusion initiatives
Won EEI Innovation Award for Supplier Diversity, recognizing Light Source program
Updated Resource Plans in KS and MO with 3,840 MW of new renewable generation by 2032
Closed $2.5B Sustainability-linked Master Credit Facility
Additional 2021 Actions
2021 Evergy Investor Day26
Accelerating ESG focus in both actions and disclosure
✓
✓
✓
✓
✓
✓
Agenda
2021 Evergy Investor Day27
• Operational Excellence
Kevin Bryant
EVP & COO
• Customer Experience & Retail Rates
• Regulatory Priorities
• Generation Transition & Renewable Strategy
• Financial Overview
• Long-Term Drivers & Key Takeaways
• Q&A Session
• Introduction
• Environmental, Social & Governance

Driving Operational Excellence
2021 Evergy Investor Day28
Operational
Excellence
Safety
ReliabilityCost Control
Infrastructure
Modernization
Daily focus on operational excellence, consistent execution, and continuous improvement
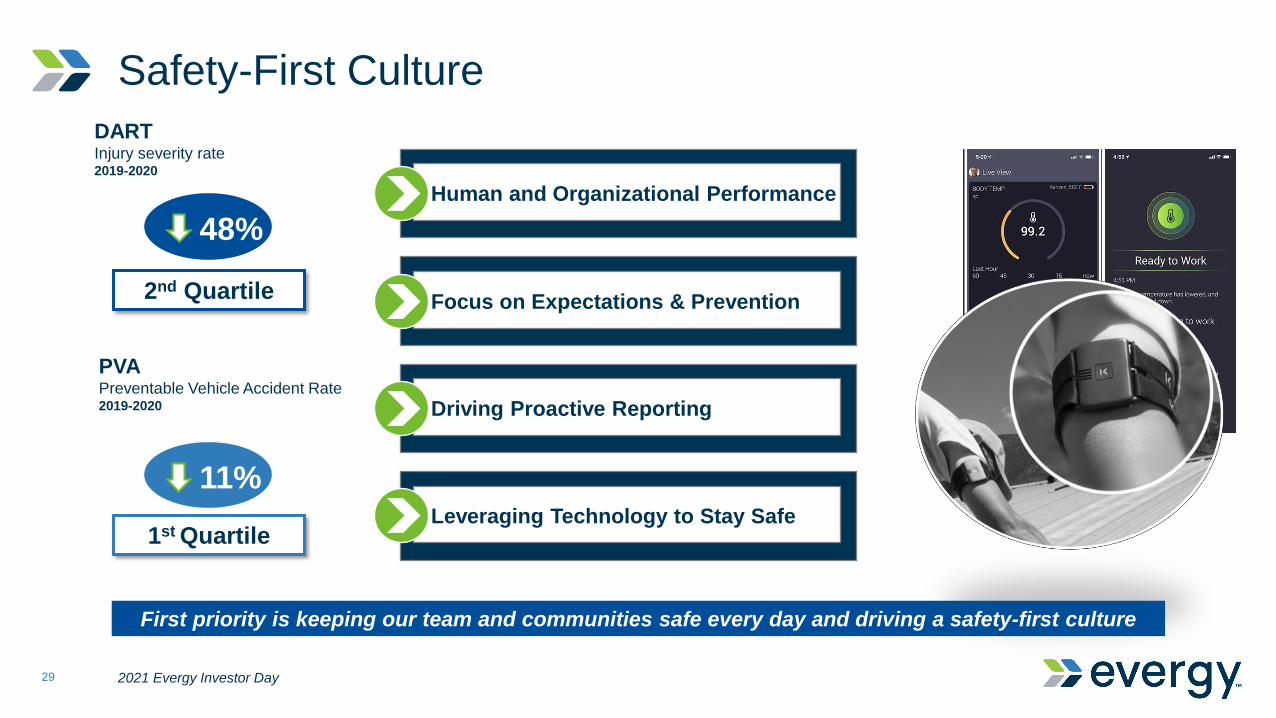
Safety-First Culture
2021 Evergy Investor Day29
Human and Organizational Performance
Focus on Expectations & Prevention
Driving Proactive Reporting
Leveraging Technology to Stay Safe
First priority is keeping our team and communities safe every day and driving a safety-first culture
PVAPreventable Vehicle Accident Rate2019-2020
48%
2nd Quartile
11%
1st Quartile
DARTInjury severity rate2019-2020
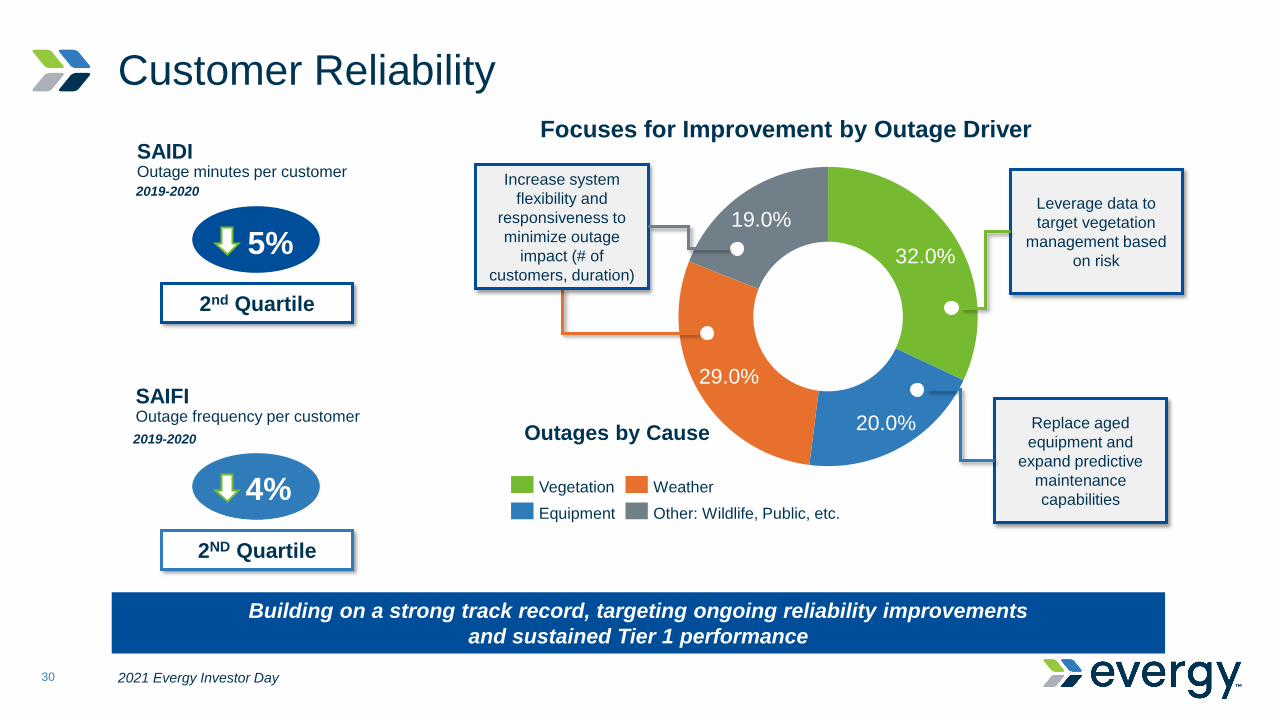
Customer Reliability
2021 Evergy Investor Day30
Outages by Cause
32.0%
20.0%
29.0%
19.0%
Vegetation
Other: Wildlife, Public, etc. Equipment
Weather
Focuses for Improvement by Outage Driver
Increase system
flexibility and
responsiveness to
minimize outage
impact (# of
customers, duration)
Leverage data to
target vegetation
management based
on risk
Replace aged
equipment and
expand predictive
maintenance
capabilities
Building on a strong track record, targeting ongoing reliability improvements
and sustained Tier 1 performance
SAIDIOutage minutes per customer
5%
2nd Quartile
2019-2020
4%
2ND Quartile
2019-2020
SAIFIOutage frequency per customer
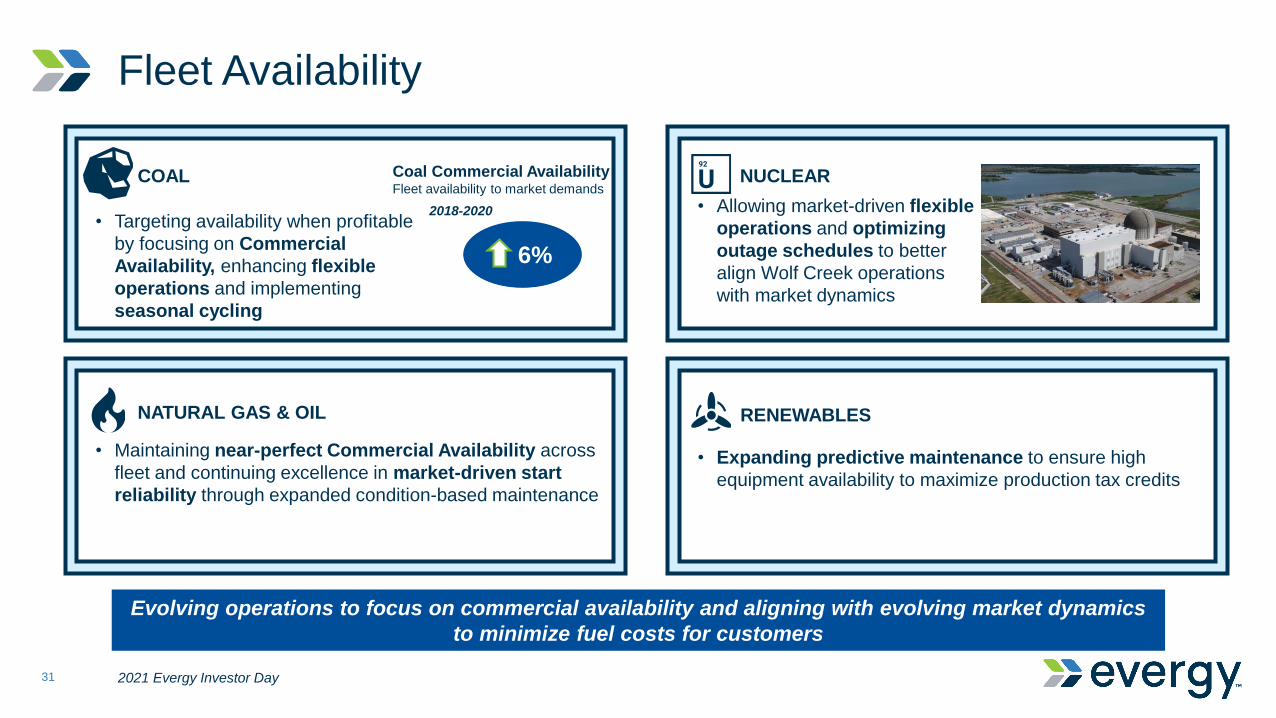
Fleet Availability
2021 Evergy Investor Day31
Evolving operations to focus on commercial availability and aligning with evolving market dynamics
to minimize fuel costs for customers
COAL
• Targeting availability when profitable
by focusing on Commercial
Availability, enhancing flexible
operations and implementing
seasonal cycling
• Allowing market-driven flexible
operations and optimizing
outage schedules to better
align Wolf Creek operations
with market dynamics
NUCLEAR
NATURAL GAS & OIL
• Maintaining near-perfect Commercial Availability across
fleet and continuing excellence in market-driven start
reliability through expanded condition-based maintenance
RENEWABLES
• Expanding predictive maintenance to ensure high
equipment availability to maximize production tax credits
Coal Commercial AvailabilityFleet availability to market demands
6%
2018-2020
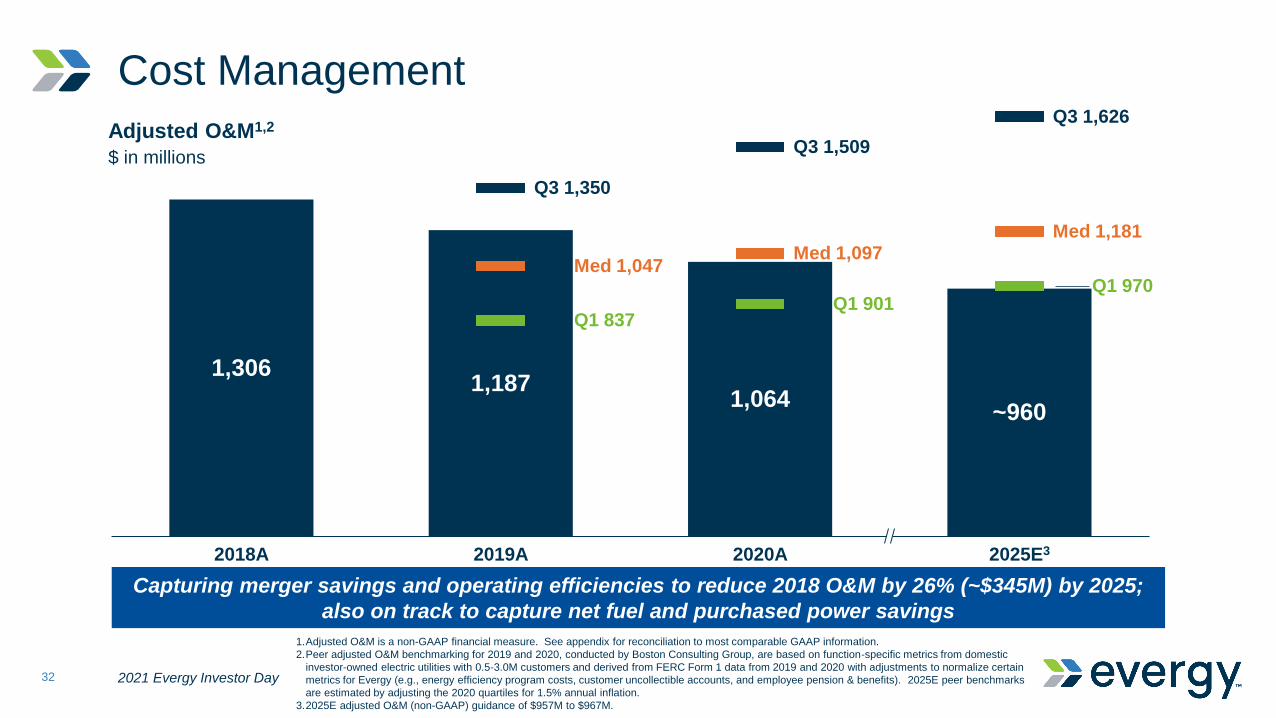
2021 Evergy Investor Day32
1.Adjusted O&M is a non-GAAP financial measure. See appendix for reconciliation to most comparable GAAP information.
2.Peer adjusted O&M benchmarking for 2019 and 2020, conducted by Boston Consulting Group, are based on function-specific metrics from domestic
investor-owned electric utilities with 0.5-3.0M customers and derived from FERC Form 1 data from 2019 and 2020 with adjustments to normalize certain
metrics for Evergy (e.g., energy efficiency program costs, customer uncollectible accounts, and employee pension & benefits). 2025E peer benchmarks
are estimated by adjusting the 2020 quartiles for 1.5% annual inflation.
3.2025E adjusted O&M (non-GAAP) guidance of $957M to $967M.
Adjusted O&M1,2
$ in millions
Cost Management
Capturing merger savings and operating efficiencies to reduce 2018 O&M by 26% (~$345M) by 2025;
also on track to capture net fuel and purchased power savings
1,3061,187
1,064
Q1 901
Med 1,047
Q3 1,626
~960
Q1 837
2018A
Q3 1,350
2019A
Med 1,097
Q3 1,509
2020A
Q1 970
Med 1,181
2025E3
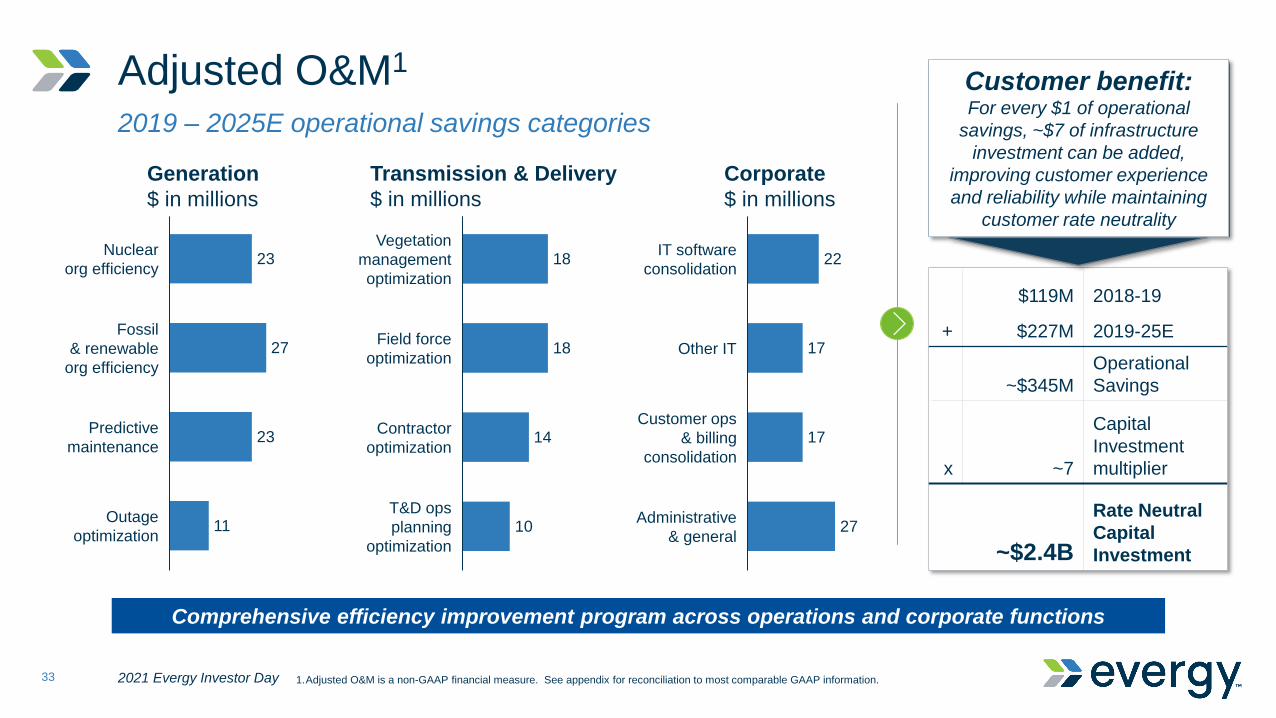
Adjusted O&M1
2021 Evergy Investor Day33
2019 – 2025E operational savings categories
Customer benefit:For every $1 of operational
savings, ~$7 of infrastructure
investment can be added,
improving customer experience
and reliability while maintaining
customer rate neutrality
$119M 2018-19
+ $227M 2019-25E
~$345M
Operational
Savings
x ~7
Capital
Investment
multiplier
~$2.4B
Rate Neutral
Capital
Investment
23
27
23
11Outage
optimization
Fossil
& renewable
org efficiency
Nuclear
org efficiency
Predictive
maintenance
18
18
14
10
Contractor
optimization
Vegetation
management
optimization
Field force
optimization
T&D ops
planning
optimization
22
17
17
27
IT software
consolidation
Other IT
Customer ops
& billing
consolidation
Administrative
& general
Transmission & Delivery
$ in millions
Generation
$ in millions
Corporate
$ in millions
Comprehensive efficiency improvement program across operations and corporate functions
1.Adjusted O&M is a non-GAAP financial measure. See appendix for reconciliation to most comparable GAAP information.
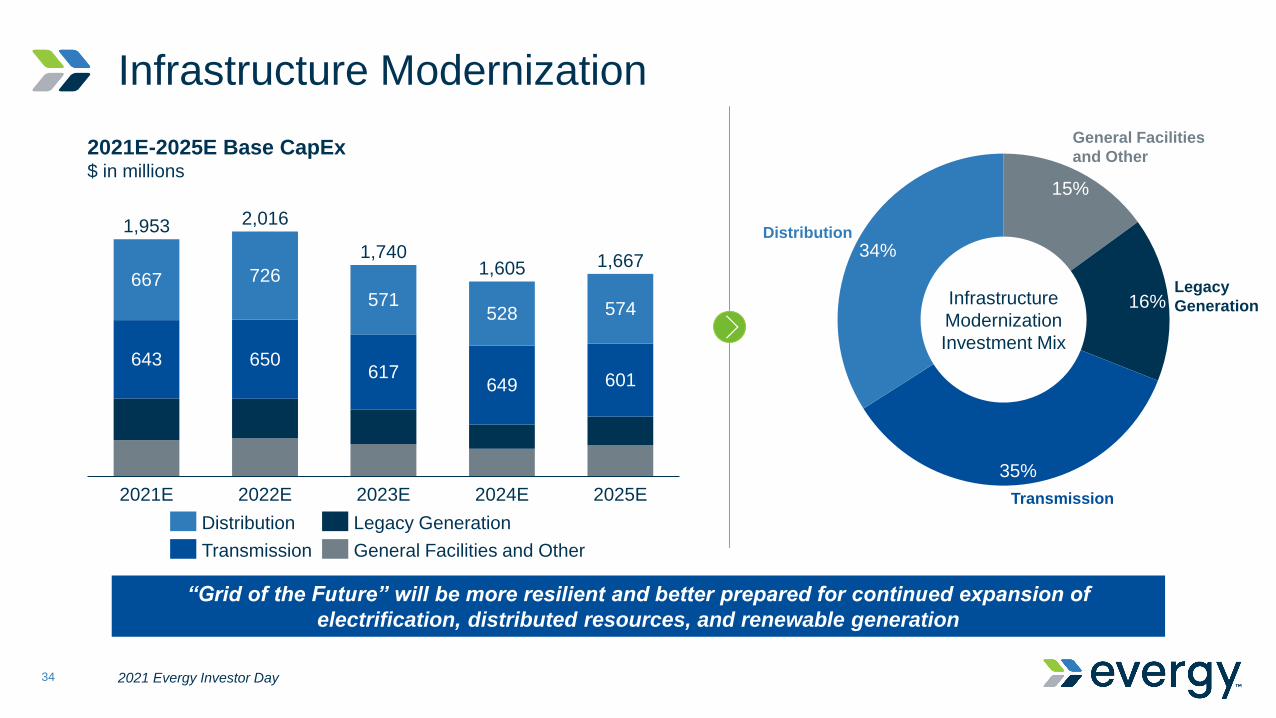
Infrastructure Modernization
2021 Evergy Investor Day34
“Grid of the Future” will be more resilient and better prepared for continued expansion of
electrification, distributed resources, and renewable generation
643 650617
649 601
667 726
571528 574
2,016
2021E-2025E Base CapEx$ in millions
2021E 2025E2023E 2024E2022E
1,953
1,7401,605 1,667
15%
16%
35%
34%
General Facilities
and Other
Legacy
Generation
Transmission
Distribution
Infrastructure
Modernization
Investment Mix
Distribution
Transmission General Facilities and Other
Legacy Generation

Transmission Resiliency
2021 Evergy Investor Day35
Replacing aged transmission lines to increase resiliency
against severe weather and prevent equipment failures
Targeting high impact, with high-risk
transmission asset replacements
Investing in transmission infrastructure to create a resilient backbone and support the grid through
the ongoing energy transition
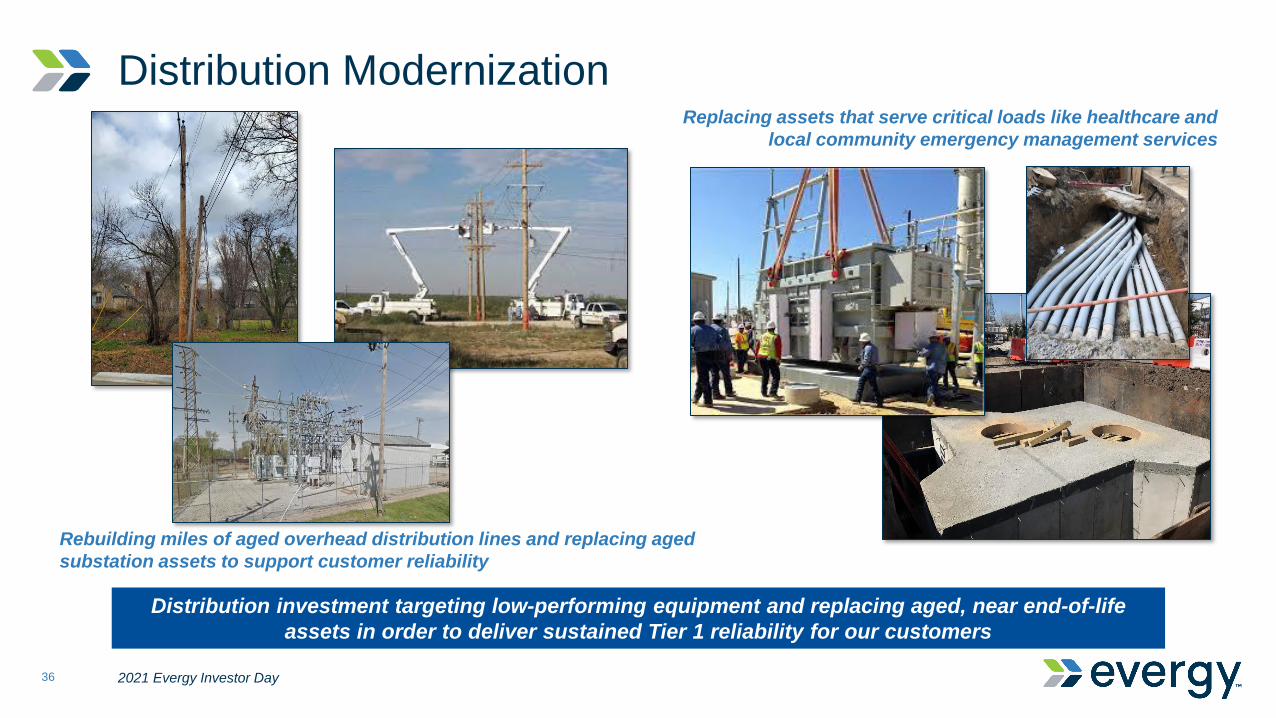
Distribution Modernization
2021 Evergy Investor Day36
Rebuilding miles of aged overhead distribution lines and replacing aged
substation assets to support customer reliability
Replacing assets that serve critical loads like healthcare and
local community emergency management services
Distribution investment targeting low-performing equipment and replacing aged, near end-of-life
assets in order to deliver sustained Tier 1 reliability for our customers
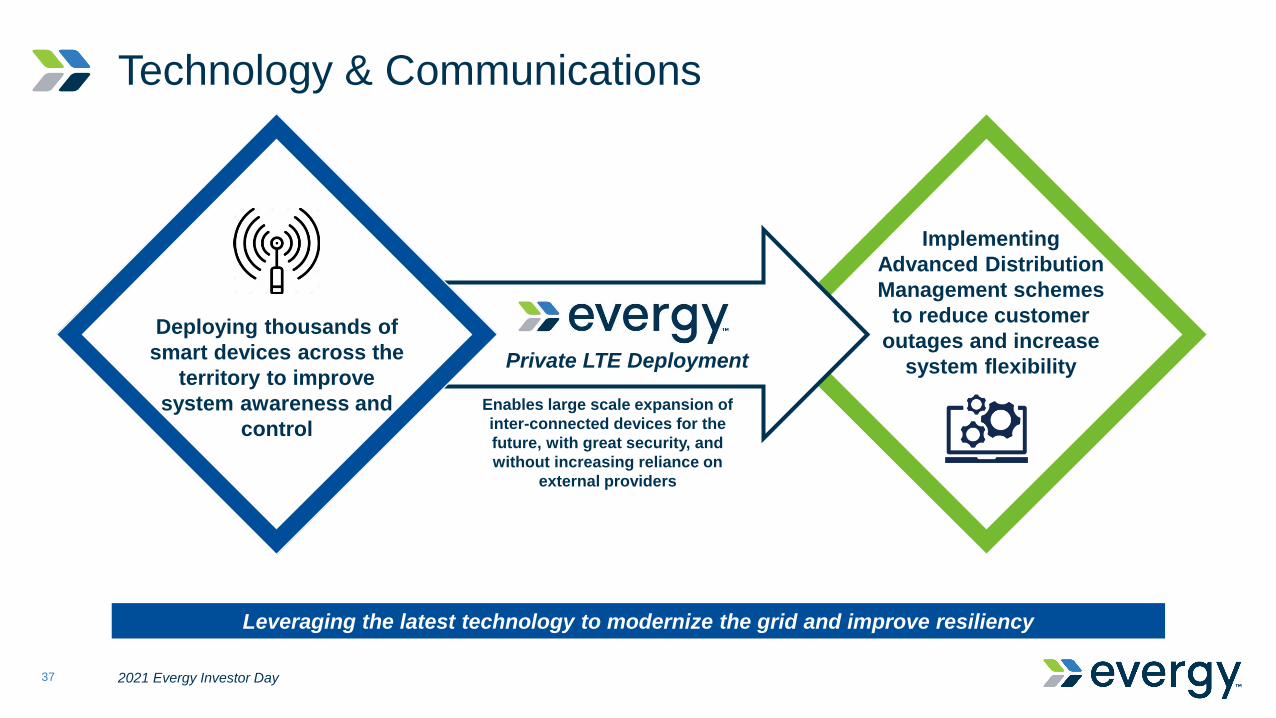
Technology & Communications
2021 Evergy Investor Day37
Leveraging the latest technology to modernize the grid and improve resiliency
Private LTE Deployment
Deploying thousands of
smart devices across the
territory to improve
system awareness and
control
Implementing
Advanced Distribution
Management schemes
to reduce customer
outages and increase
system flexibility
Enables large scale expansion of
inter-connected devices for the
future, with great security, and
without increasing reliance on
external providers
Agenda
2021 Evergy Investor Day38
• Customer Experience & Retail Rates
Chuck Caisley
SVP Public Affairs & CCO
• Regulatory Priorities
• Generation Transition & Renewable Strategy
• Financial Overview
• Long-Term Drivers & Key Takeaways
• Q&A Session
• Introduction
• Environmental, Social & Governance
• Operational Excellence

Leading Electric Utility In Kansas & Missouri
2021 Evergy Investor Day39
Evergy Customer Profile1
• ~1,422,000 residential customers; 38% of sales
• ~192,000 commercial customers; 42% of sales
• ~7,000 industrial customers; 20% of sales
• 55% rate base Kansas; 33% Missouri; 12% FERC
Largest utility in Kansas and one of the largest in Missouri, serving over 1.6 million customers
Regional Highlights
• 1.8% average annual GMP2 growth 2015-2019
• 41 consecutive quarters of growth in Evergy
customers
• Kansas has 4th largest installed wind generation in
the United States (7,016 MW)3
• New Kansas City airport under construction; set to
open in 2023
2
4
6
8
10
12
14
16
2009 2010 2011 2012 2013 2014 2015 2016 2017 2018 2019 2020 2021
Per
cen
t
Unemployment Rate4
U.S.
KC, Topeka, Wichita Composite
1.Statistics as of 12/31/20.
2.Source: Moody’s Analytics Gross Metro Product Composite average of Kansas City, Topeka, and Wichita 2015 – 2019.
3.US Department of Energy, Wind Exchange, Total Installed Capacity as of end of Q4 2020.
4.US Bureau of Labor Statistics.
Focus On The Customer Following The GPE-Westar Merger
2021 Evergy Investor Day40
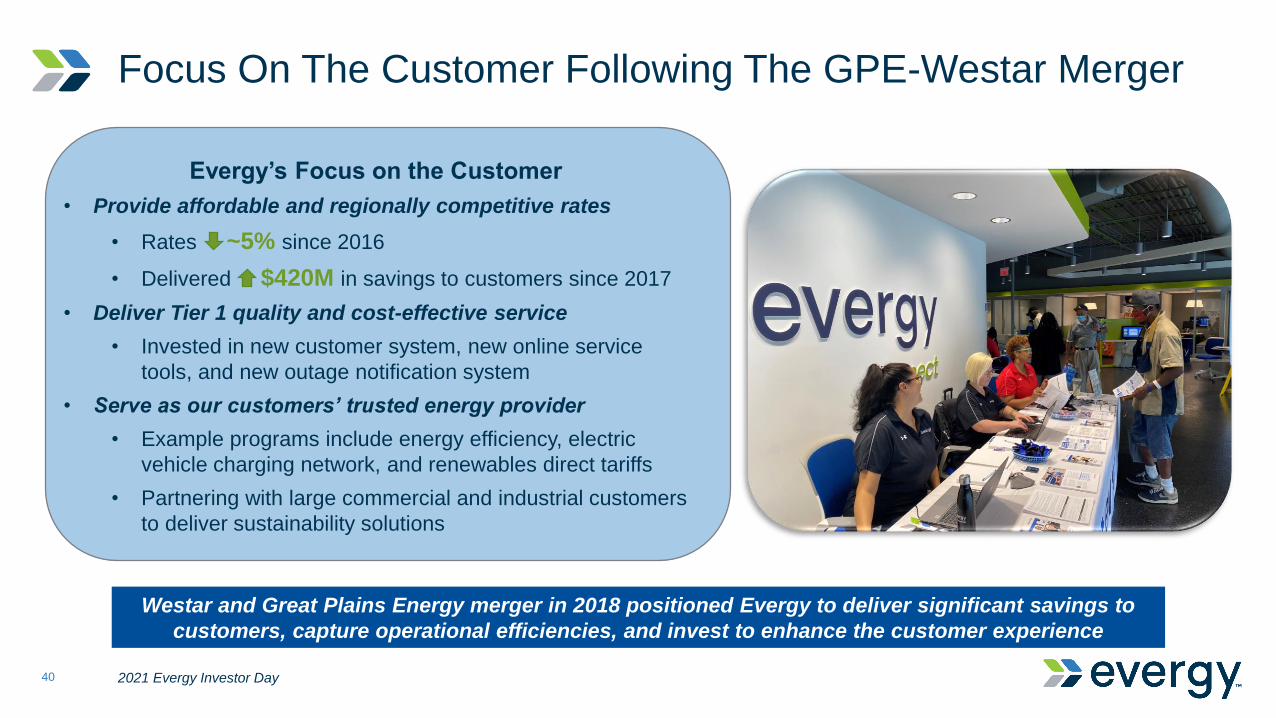
Westar and Great Plains Energy merger in 2018 positioned Evergy to deliver significant savings to
customers, capture operational efficiencies, and invest to enhance the customer experience
Evergy’s Focus on the Customer
• Provide affordable and regionally competitive rates
• Rates ~5% since 2016
• Delivered $420M in savings to customers since 2017
• Deliver Tier 1 quality and cost-effective service
• Invested in new customer system, new online service
tools, and new outage notification system
• Serve as our customers’ trusted energy provider
• Example programs include energy efficiency, electric
vehicle charging network, and renewables direct tariffs
• Partnering with large commercial and industrial customers
to deliver sustainability solutions

Customer Affordability & Bill Trajectory
2021 Evergy Investor Day41
20202016 2017 2018 2019 2021ending 7/31
-5.1%
+9.1%Change in rates
-0.7%
Evergy Regional1 CPI Inflated Prices (2016 Base)
Annual Change (CAGR, %)
Evergy, 2016-21
Evergy, 2016-24E2
CPI Inflation, 2016-24E3
-1.0%
+0.5%
+1.8%
1.Regional Price is sourced from EIA and is comprised of revenues and sales for all sectors based for the following states: Iowa, Kansas, Missouri, Nebraska, North Dakota, South Dakota, Arkansas, Oklahoma, Texas, Colorado. Regional Price 2020 data will not be finalized by EIA until October 2021
2.Excludes 2021 winter weather event impacts.3.Source: US Bureau of Labor Statistics for historic CPI; 2022-2024 estimated annualized CPI equal to 2016-2021 actual annualized rate.
Reflecting focus on affordability, rate increases well below inflation and
improving regional rate competitiveness
• After the expected impacts of
Evergy’s rate cases in Missouri
(2022) and Kansas (2023),
annualized impacts will remain
well below inflation
• Operating and fuel cost efficiencies
minimize rate impacts and enable
beneficial infrastructure
investments
Enhancing The Customer Experience
2021 Evergy Investor Day42
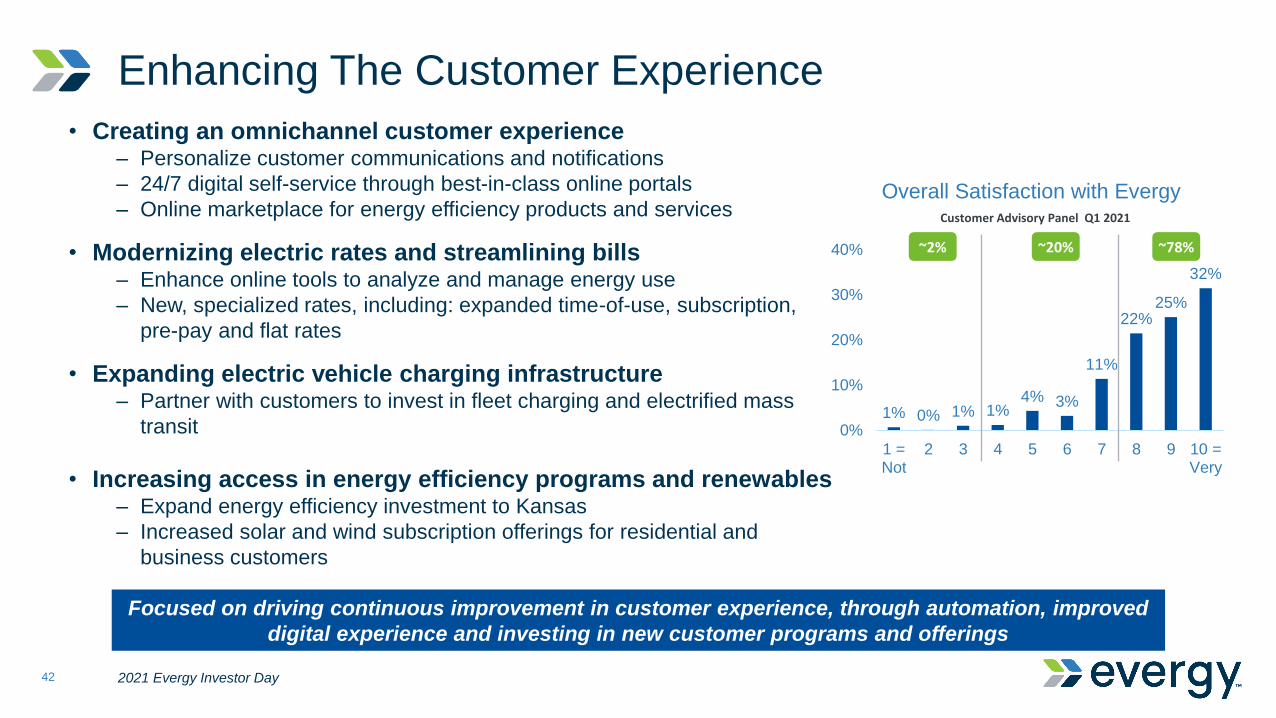
Focused on driving continuous improvement in customer experience, through automation, improved
digital experience and investing in new customer programs and offerings
1% 0% 1% 1%4% 3%
11%
22%25%
32%
0%
10%
20%
30%
40%
1 =Not
2 3 4 5 6 7 8 9 10 =Very
Overall Satisfaction with EvergyCustomer Advisory Panel Q1 2021
~20% ~78% ~2%
• Creating an omnichannel customer experience– Personalize customer communications and notifications
– 24/7 digital self-service through best-in-class online portals
– Online marketplace for energy efficiency products and services
• Modernizing electric rates and streamlining bills– Enhance online tools to analyze and manage energy use
– New, specialized rates, including: expanded time-of-use, subscription,
pre-pay and flat rates
• Expanding electric vehicle charging infrastructure– Partner with customers to invest in fleet charging and electrified mass
transit
• Increasing access in energy efficiency programs and renewables– Expand energy efficiency investment to Kansas
– Increased solar and wind subscription offerings for residential and
business customers
Innovative Customer Programs | Missouri Energy Efficiency Initiatives
2021 Evergy Investor Day43
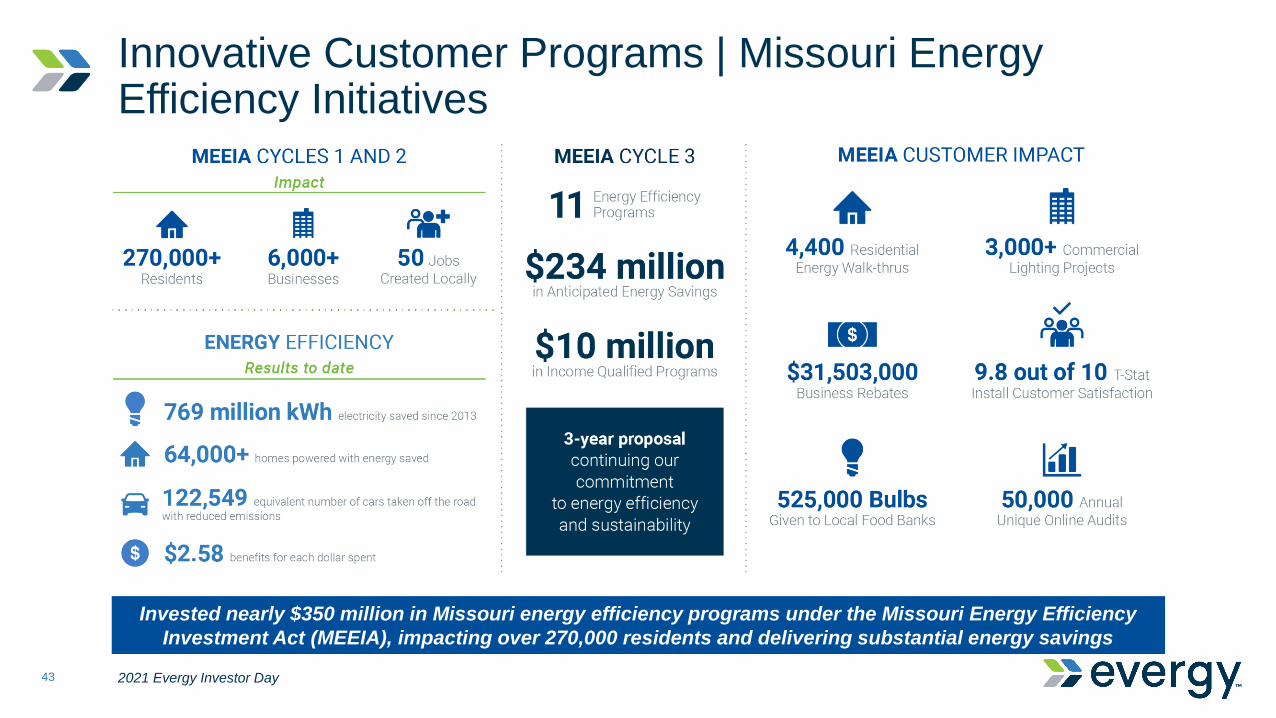
Invested nearly $350 million in Missouri energy efficiency programs under the Missouri Energy Efficiency
Investment Act (MEEIA), impacting over 270,000 residents and delivering substantial energy savings
Innovative Customer Solutions | Leading Electric Vehicle Charging Network
2021 Evergy Investor Day44
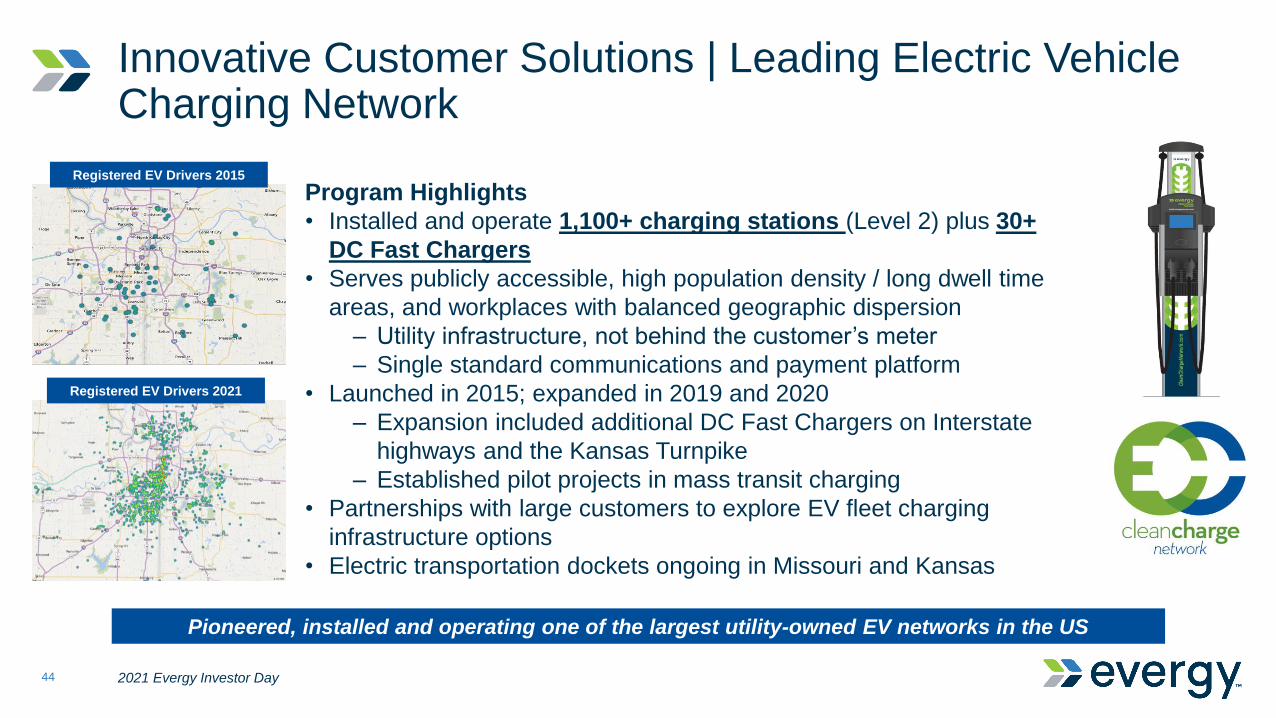
Pioneered, installed and operating one of the largest utility-owned EV networks in the US
Program Highlights
• Installed and operate 1,100+ charging stations (Level 2) plus 30+
DC Fast Chargers
• Serves publicly accessible, high population density / long dwell time
areas, and workplaces with balanced geographic dispersion
– Utility infrastructure, not behind the customer’s meter
– Single standard communications and payment platform
• Launched in 2015; expanded in 2019 and 2020
– Expansion included additional DC Fast Chargers on Interstate
highways and the Kansas Turnpike
– Established pilot projects in mass transit charging
• Partnerships with large customers to explore EV fleet charging
infrastructure options
• Electric transportation dockets ongoing in Missouri and Kansas
Registered EV Drivers 2015
Registered EV Drivers 2021
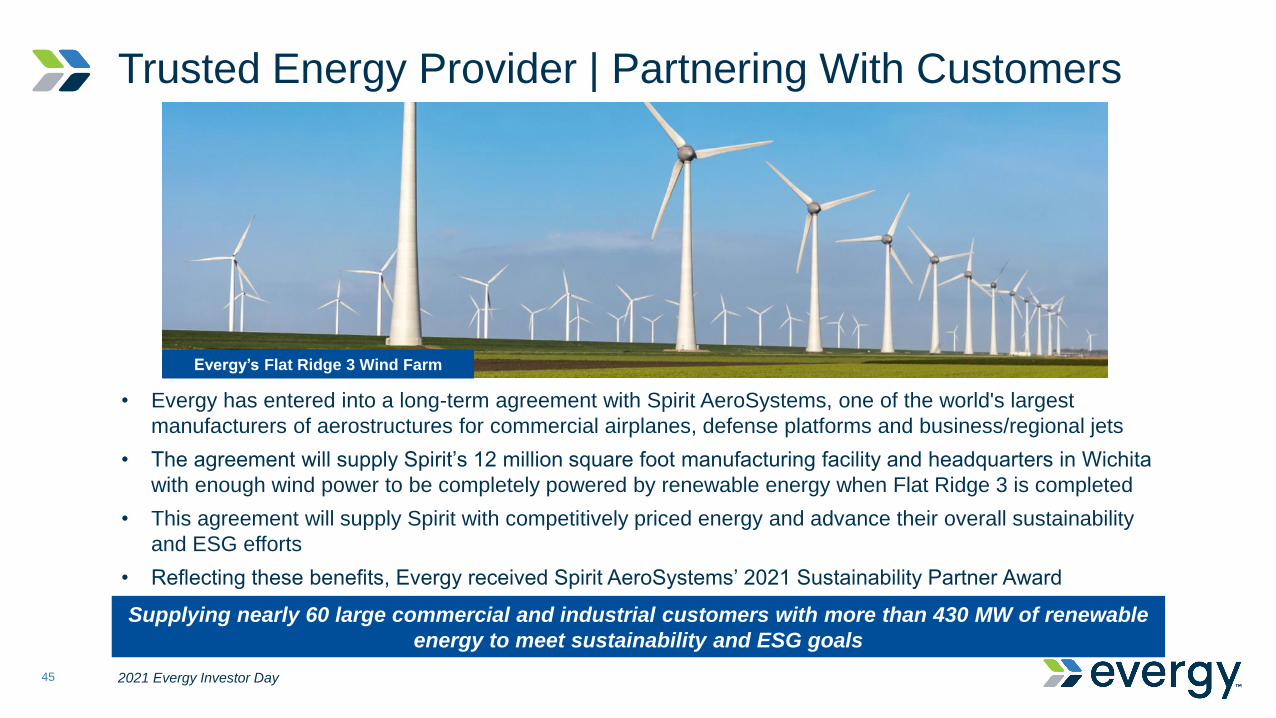
Trusted Energy Provider | Partnering With Customers
2021 Evergy Investor Day45
Supplying nearly 60 large commercial and industrial customers with more than 430 MW of renewable
energy to meet sustainability and ESG goals
Evergy’s Flat Ridge 3 Wind Farm
• Evergy has entered into a long-term agreement with Spirit AeroSystems, one of the world's largest
manufacturers of aerostructures for commercial airplanes, defense platforms and business/regional jets
• The agreement will supply Spirit’s 12 million square foot manufacturing facility and headquarters in Wichita
with enough wind power to be completely powered by renewable energy when Flat Ridge 3 is completed
• This agreement will supply Spirit with competitively priced energy and advance their overall sustainability
and ESG efforts
• Reflecting these benefits, Evergy received Spirit AeroSystems’ 2021 Sustainability Partner Award
Agenda
2021 Evergy Investor Day46
• Regulatory Priorities
Chuck Caisley
SVP Public Affairs & CCO
• Generation Transition & Renewable Strategy
• Financial Overview
• Long-Term Drivers & Key Takeaways
• Q&A Session
• Introduction
• Environmental, Social & Governance
• Operational Excellence
• Customer Experience & Retail Rates
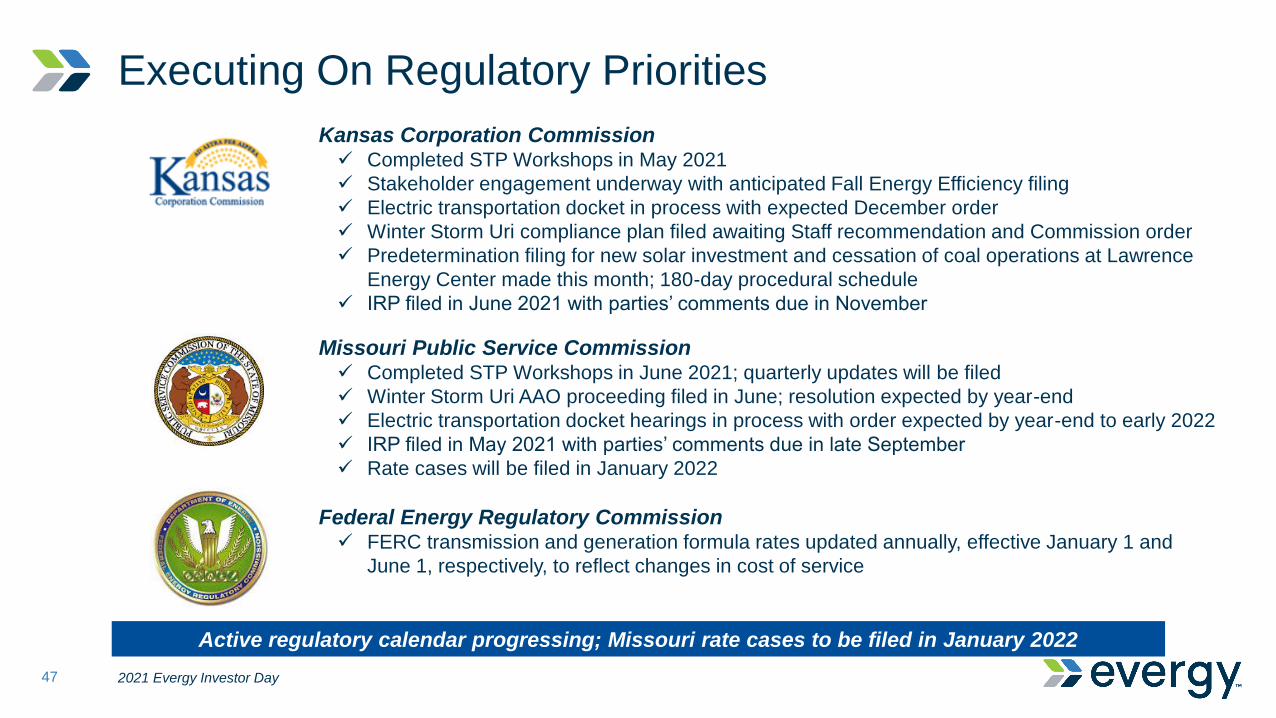
Executing On Regulatory Priorities
47
Kansas Corporation Commission✓ Completed STP Workshops in May 2021
✓ Stakeholder engagement underway with anticipated Fall Energy Efficiency filing
✓ Electric transportation docket in process with expected December order
✓ Winter Storm Uri compliance plan filed awaiting Staff recommendation and Commission order
✓ Predetermination filing for new solar investment and cessation of coal operations at Lawrence
Energy Center made this month; 180-day procedural schedule
✓ IRP filed in June 2021 with parties’ comments due in November
Missouri Public Service Commission✓ Completed STP Workshops in June 2021; quarterly updates will be filed
✓ Winter Storm Uri AAO proceeding filed in June; resolution expected by year-end
✓ Electric transportation docket hearings in process with order expected by year-end to early 2022
✓ IRP filed in May 2021 with parties’ comments due in late September
✓ Rate cases will be filed in January 2022
Federal Energy Regulatory Commission✓ FERC transmission and generation formula rates updated annually, effective January 1 and
June 1, respectively, to reflect changes in cost of service
Active regulatory calendar progressing; Missouri rate cases to be filed in January 2022
2021 Evergy Investor Day

Constructive Ratemaking | Kansas
2021 Evergy Investor Day48
Cost Recovery
MechanismsDescription
Energy Cost
Adjustment
Fuel Adjustment Clause Rider projects annual amount of fuel &
purchased power costs, with true-up mechanism
Pension TrackerPension and OPEB allows company to accumulate pension and other
post-employment expenses in excess of amounts built into rates and
recover over a period not to exceed five-years
Property Tax RiderProperty Tax Surcharge Rider recovers annual incremental increase in
property tax above what is built into base rates
Energy Efficiency RiderEnergy Efficiency Cost Recovery Rider recovers deferred costs
associated with Commission approved programs
Transmission RiderTransmission Delivery Charge Rider (TDC) recovers transmission related
costs associated with electric service to Kansas retail customers
Critical
Infrastructure/Cyber
Tracker
Recovery of non-labor O&M costs specific to CIP/Cybersecurity efforts
Abbreviated Rate CaseAllows for traditional rate recovery outside of base rate cases for select
items approved and filed within one year of traditional case
Constructive regulatory mechanisms addressing major expenses between general rate cases

Constructive Ratemaking | Missouri
2021 Evergy Investor Day49
Cost Recovery
MechanismsDescription
Fuel Adjustment ClauseBase rates include base level of fuel & purchased power costs,
adjustment clause addresses fuel expense changes between base
rate cases
Pension TrackerPension and OPEB tracker allows company to accumulate pension
and other post-employment expense differences from amounts
built into rates and recover over five-year period
Missouri Plant in Service
Accounting (PISA)
Allows for deferral and recovery of 85% of financing costs and
depreciation expense for PISA qualified plant investments
Energy EfficiencyMissouri Energy Efficiency Investment Act Program Rider (MEEIA)
allows company to value and recover demand-side investments
equivalent to traditional infrastructure investment
Renewable Energy
Standard Rate Adjustment
Mechanism Rider1
Enables recovery of costs including carrying costs to comply with
Missouri renewable energy standard (Missouri West only)
1.Renewable Energy Standard Rate Adjustment Mechanism Rider available in Evergy Missouri West; not available in Evergy Missouri Metro. Missouri Metro has similar mechanism: Missouri Renewables Energy Standard Tracker.
Constructive regulatory mechanisms addressing major expenses between general rate cases

Stakeholder-Focused Legislation | Securitization In Kansas & Missouri
2021 Evergy Investor Day50
Reducing Customer Costs
• Missouri West intends to seek to securitize
extraordinary costs resulting from Uri with
15-year recovery period from customers
• Securitization would reduce the estimated
customer impacts by 40% relative to
traditional regulatory recovery over the
same time period
Plant Retirements Extraordinary Costs
Recently passed securitization legislation creates ability to reduce customer impacts from generation
facility retirements and extraordinary events like Winter Storm Uri
• Minimizes costs by allowing for
securitization of remaining book value of
generation to be retired
• Both Kansas and Missouri laws establish
predetermination processes for the
retirement of generation plants, enabling
greater certainty

• Two separate rate cases
1) Evergy Kansas Central
2) Evergy Metro Kansas
• Test year ending September 30, 2022
• Expected filing: April 2023
• True-up date: June 30, 2023
• Rates effective: December 2023
• Two separate rate cases
1) Evergy Metro Missouri
2) Evergy Missouri West
• Test year ending June 30, 2021
• Expected filing: January 2022
• True-up date: May 31, 2022
• Rates effective: December 2022
Upcoming Rate Cases In Missouri & Kansas
2021 Evergy Investor Day51
Missouri - 2022 Kansas - 2023
First rate cases reflecting Evergy combined operations will align rates with current operations

Agenda
2021 Evergy Investor Day52
• Generation Transition & Renewable Strategy
Kirk Andrews
EVP & CFO
• Financial Overview
• Long-Term Drivers & Key Takeaways
• Q&A Session
• Introduction
• Environmental, Social & Governance
• Operational Excellence
• Customer Experience & Retail Rates
• Regulatory Priorities
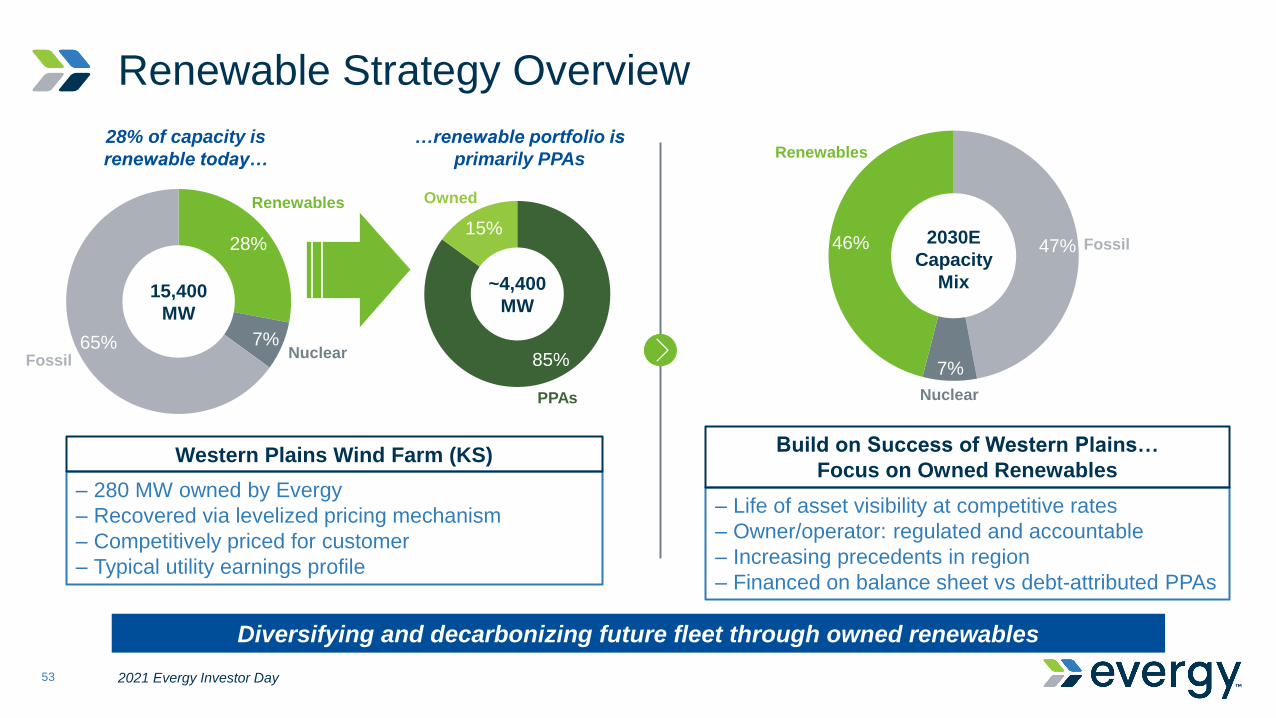
Renewable Strategy Overview
2021 Evergy Investor Day53
28%
7%65%
Renewables
NuclearFossil
28% of capacity is
renewable today…
85%
15%
PPAs
Owned
– Life of asset visibility at competitive rates
– Owner/operator: regulated and accountable
– Increasing precedents in region
– Financed on balance sheet vs debt-attributed PPAs
Build on Success of Western Plains…
Focus on Owned Renewables
15,400
MW
…renewable portfolio is
primarily PPAs
~4,400
MW
Diversifying and decarbonizing future fleet through owned renewables
– 280 MW owned by Evergy
– Recovered via levelized pricing mechanism
– Competitively priced for customer
– Typical utility earnings profile
Western Plains Wind Farm (KS)
47%
7%
46%
Renewables
Fossil
Nuclear
2030E
Capacity
Mix
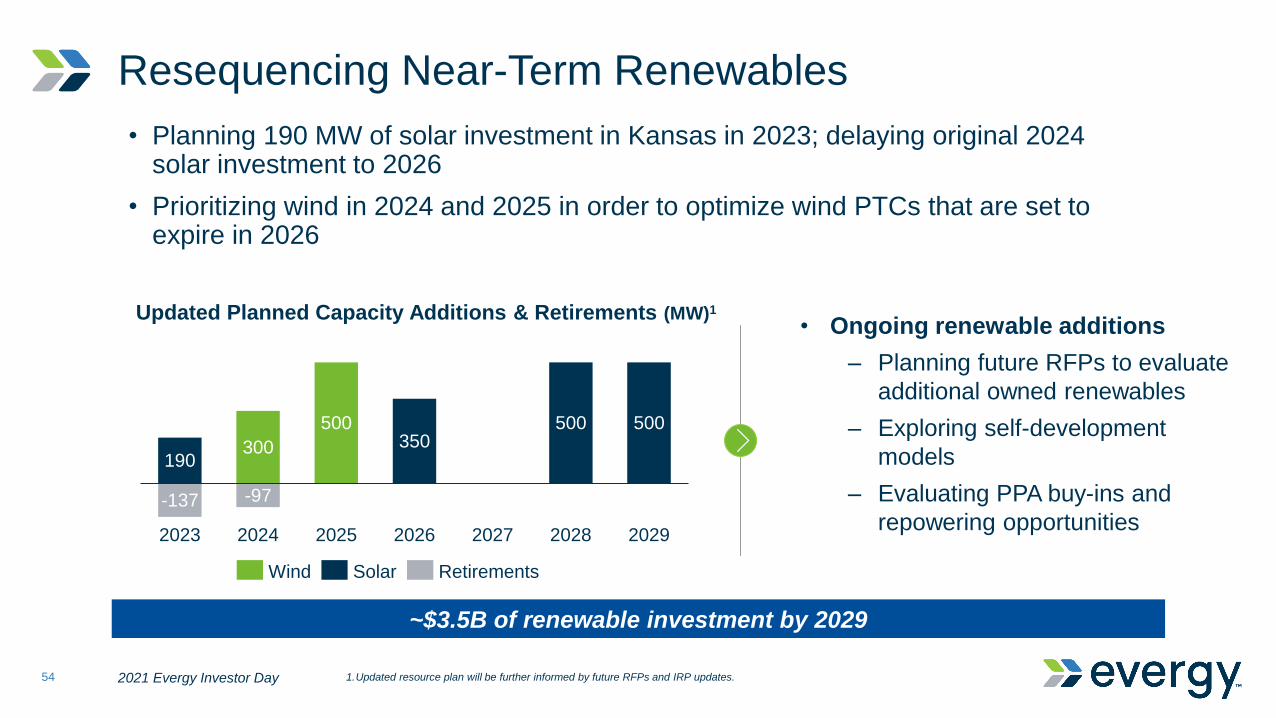
Resequencing Near-Term Renewables
2021 Evergy Investor Day54
• Planning 190 MW of solar investment in Kansas in 2023; delaying original 2024 solar investment to 2026
• Prioritizing wind in 2024 and 2025 in order to optimize wind PTCs that are set to expire in 2026
Updated Planned Capacity Additions & Retirements (MW)1
190300
500350
500 500
-137 -97
202820242023 20292025 2026 2027
SolarWind Retirements
~$3.5B of renewable investment by 2029
• Ongoing renewable additions
– Planning future RFPs to evaluate
additional owned renewables
– Exploring self-development
models
– Evaluating PPA buy-ins and
repowering opportunities
1.Updated resource plan will be further informed by future RFPs and IRP updates.

Annual
Impacts
Solar Facility Addition $21M
LEC 4 retirement &
LEC 5 gas(40)
LEC 4 net fuel costs (5)
LEC 4 securitization 17
Total
Customer
(Benefit)~($7M)
Updated Plan For KS Solar & Coal Retirement In 2023
2021 Evergy Investor Day55
LEC 4 coal retirement (-137 MW)~$160M expected securitization
KS solar addition (+190 MW)~$250M of investment
LEC 5 coal retirement, retaining gas
operations (350 MW)~$120M remaining rate base
• Filed for pre-
determination
earlier this
month
• Expect the
KCC’s 180-day
procedural
schedule to
conclude in
March 2022
~$7M annual benefit to customers while ensuring reliability and shrinking coal MW;
neutral to earnings vs. STP
Process Additions & Retirements Customer Benefit
487
MW of
coal to
retire
1.LEC: Lawrence Energy Center located in Lawrence, KS.

Potential Wind PPA Buy-Ins & Repowerings
2021 Evergy Investor Day56
The expiration of PTCs and contracts for wind PPA portfolio create potential for buy-in and/or
repowering growth opportunities that beneficially impact customers through lower fuel costs
Wind Power Purchase Agreements – Year of PTC ExpirationMW capacity of PPAs
• Buy-ins and repowerings
represent potential future capital
investment opportunities
• Buy-ins allow Evergy to invest &
manage assets to provide best
customer value
• Repowering can enable access
to the PTC (if available),
reducing customer costs
• Potential for additional tailwinds
to come out of federal budget
reconciliation bill
3,753
1,257
1,484
916
Total2026 - 2029
96
2021
or earlier
2022 - 2025 2030 - 2032
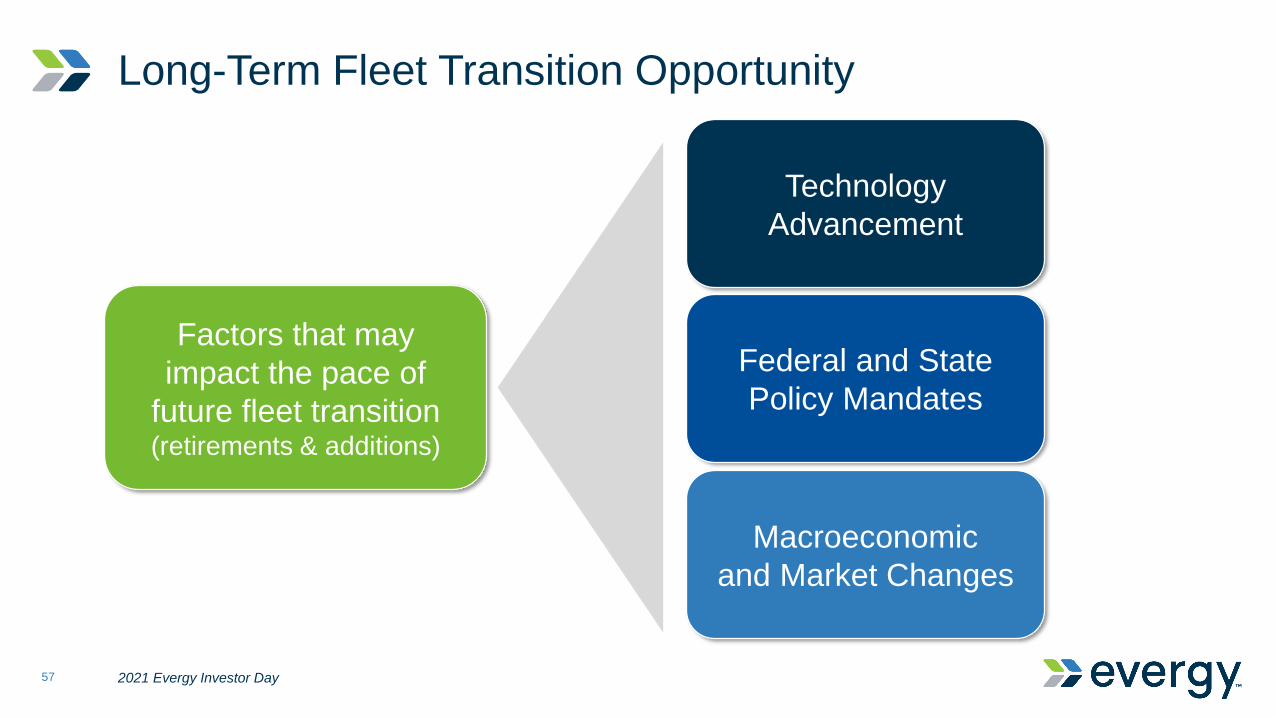
Long-Term Fleet Transition Opportunity
2021 Evergy Investor Day57
Technology
Advancement
Federal and State
Policy Mandates
Macroeconomic
and Market Changes
Factors that may
impact the pace of
future fleet transition(retirements & additions)

Agenda
2021 Evergy Investor Day58
• Financial Overview
Kirk Andrews
EVP & CFO
• Long-Term Drivers & Key Takeaways
• Q&A Session
• Introduction
• Environmental, Social & Governance
• Operational Excellence
• Customer Experience & Retail Rates
• Regulatory Priorities
• Generation Transition & Renewable Strategy

Financial Overview | Key Messages
2021 Evergy Investor Day59
✓ Initiating 2022 adjusted EPS1 guidance of $3.43 to $3.63 – another year of ~7% growth
✓ Extending and rebasing targeted adjusted EPS growth of 6% to 8% for 2021-2025
✓ $2.4B (~30% renewables) of investment opportunities in 2025: ~6% rate base growth
✓ Robust operating cash flow, minimal cash taxes – no new equity planned
✓ Key balance sheet metrics in line with rating agency targets
✓ Shifting to owned renewables
– 190 MW of new solar targeted end of 2023
– 800 MW new wind planned 2024-2025
1. Adjusted EPS is a non-GAAP financial measure. See appendix for reconciliation to most comparable GAAP information.

2022 EPS Guidance & Drivers
2021 Evergy Investor Day60
1.Adjusted EPS is a non-GAAP financial measure. See appendix for reconciliation to most comparable GAAP information.
2.2021E is $3.30/sh. mid-point of 2021 adjusted EPS (non-GAAP) guidance range of $3.20 to $3.40.
3.2022E is $3.53/sh. mid-point of 2022 adjusted EPS (non-GAAP) guidance range of $3.43 to $3.63.
$3.30
$3.53
$0.12
$0.09
$0.10
Interest/
AFUDC
O&M
Savings
Midpoint Adjusted EPS Growth1
2022E32021E2 Merger
Bill Credit
Expiration
Retail
Demand
Transmission
$0.02$0.05
D&A
$0.01
Other
$0.04
7%
Initiating 2022 adjusted EPS guidance of $3.43 – $3.63
Initiating
Guidance
$3.43 - $3.63

2019 – 2024E Earnings Growth Profile
2021 Evergy Investor Day61
Targeted Adjusted EPS Growth1
$2.89$3.10
$3.30
240
227
230 230
2019A 2020A 2022E2021E2 2023E 2024E
$3.87 - $4.25
6% – 8% CAGR
1.Adjusted EPS is a non-GAAP financial measure. See appendix for reconciliation to most comparable GAAP information.
2.2021E uses $3.30/sh. mid-point of 2021 adjusted EPS (non-GAAP) guidance range of $3.20 to $3.40.
6%-8% adjusted EPS growth target on track 2019-2024E
Avg. Share Count (EPS denominator)

Extending Earnings Growth 2021E – 2025E
2021 Evergy Investor Day62
Targeted Adjusted EPS Growth1
$2.89$3.10
$3.30$3.53
240
227
230 230
2019A 2021E22020A 2023E2022E3 2025E2024E
$4.17 - $4.496% – 8% CAGR6% – 8% CAGR
1.Adjusted EPS is a non-GAAP financial measure.
2.2021E uses $3.30/sh. mid-point of 2021 adjusted EPS (non-GAAP) guidance range of $3.20 to $3.40.
3.2022E uses $3.53/sh. mid-point of 2021 adjusted EPS (non-GAAP) guidance range of $3.43 to $3.63.
Rebasing and extending 6%-8% adjusted EPS growth target 2021E-2025E
Avg. Share Count (EPS denominator)

Five-Year Capital Expenditure Plan
2021 Evergy Investor Day63
Base investment to drive reliability and renewable investment to reduce emissions and lower costs
2,417
1,953
2022E
2021E – 2025E CapEx
$ in millions
2021E 2023E 2025E2024E
2,016 1,993 2,055
New Renewables Legacy GenerationDistribution
General Facilities
and Other
Transmission
15.3
2020A
Rate Base Growth
$ in billions
2025E
19.5 – 20.5
5%-6%
1,7401,605
1,667

2021E – 2025E Financing Plan
2021 Evergy Investor Day64
Cash flow, higher rate base, and debt expected to fund capital and dividends;
maintaining strong balance sheet with no additional equity
9,503
10,434
3,202
Equity2
Sources & Uses$ in millions
113
Securitization12021E-2025E
Cash From
Operations
466
(2,850)
Dividends Incremental
Debt
2021E-2025E
Capex Plan
1.Includes securitization proceeds projections for both plant retirements and winter storm costs.
2.Bluescape equity issued in April 2021.
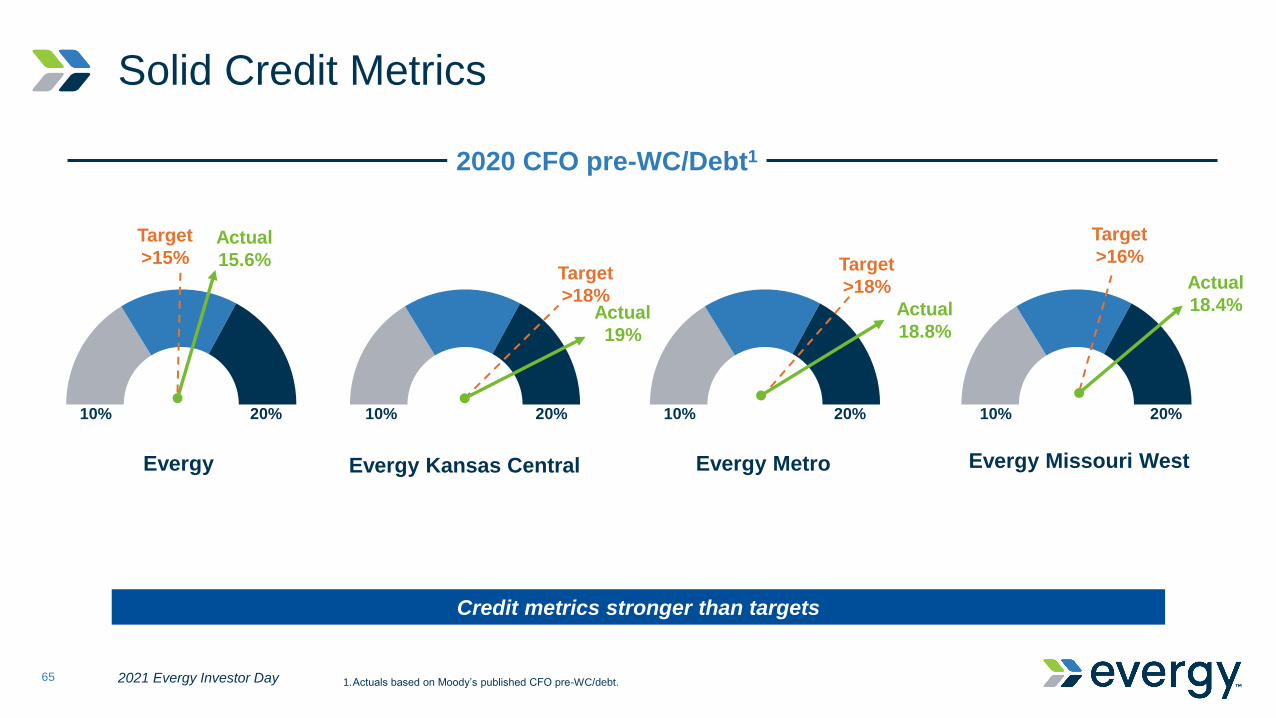
Solid Credit Metrics
2021 Evergy Investor Day65
Credit metrics stronger than targets
Actual
19%
Actual
15.6%
10% 20%10% 20%
Evergy Evergy Kansas Central
Target
>15%
10% 20%
Evergy Metro
10% 20%
Evergy Missouri West
Target
>18%Actual
18.8%
Target
>18% Actual
18.4%
Target
>16%
2020 CFO pre-WC/Debt1
1.Actuals based on Moody’s published CFO pre-WC/debt.
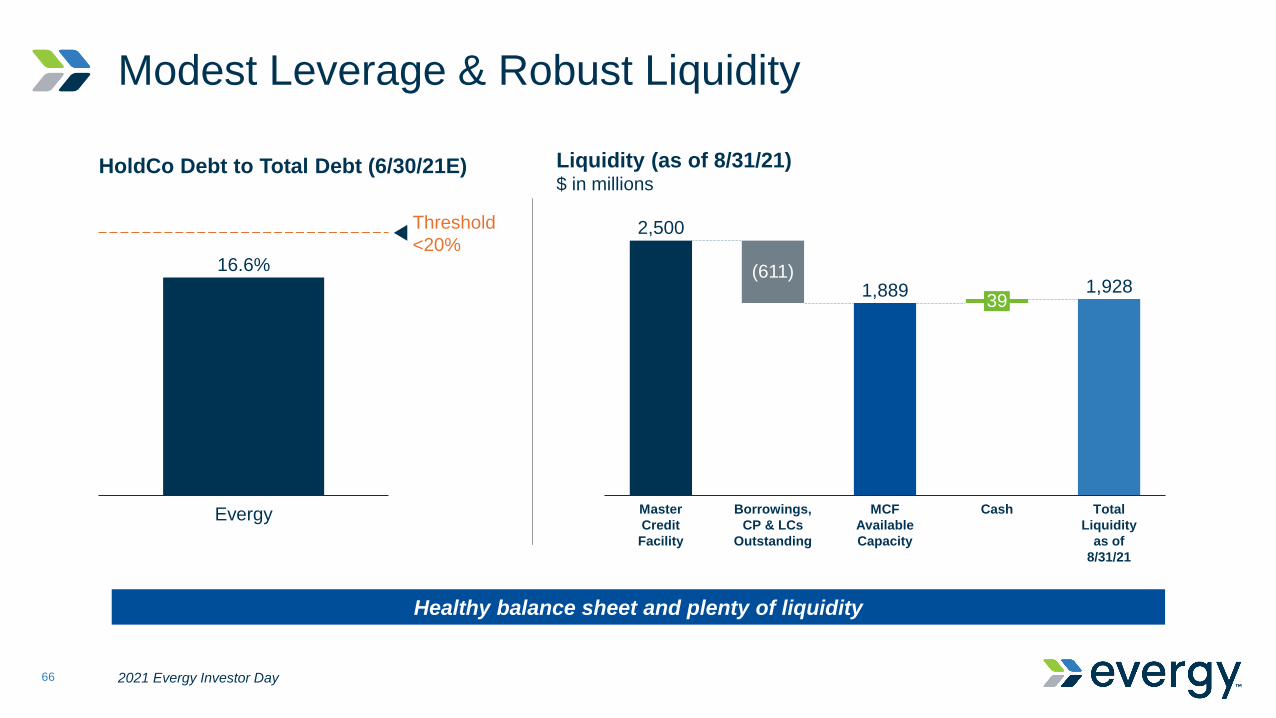
Modest Leverage & Robust Liquidity
2021 Evergy Investor Day66
Healthy balance sheet and plenty of liquidity
2,500
1,889 1,928
Borrowings,
CP & LCs
Outstanding
Liquidity (as of 8/31/21)$ in millions
Master
Credit
Facility
Cash
(611)
MCF
Available
Capacity
Total
Liquidity
as of
8/31/21
39
16.6%
Evergy
HoldCo Debt to Total Debt (6/30/21E)
Threshold
<20%

Steady, Predictable Dividend Growth
2021 Evergy Investor Day67
$2.89
$3.10
$3.30
$1.90$2.02
$2.14
2020A
Adjusted EPS1 and Dividends Per Share
2019A 2021E2
Annualized Dividend
Adjusted EPS
70% Payout
60% Payout
Targeting dividend growth in line with earnings growth;
while maintaining payout ratio between 60% to 70%
1.Adjusted EPS is a non-GAAP financial measure. See appendix for reconciliation to most comparable GAAP information.
2.2021E uses $3.30/sh. mid-point of 2021 adjusted EPS (non-GAAP) guidance range of $3.20 to $3.40.

Delivering On Our Financial Objectives
2021 Evergy Investor Day68
Agenda
2021 Evergy Investor Day69
• Long-Term Drivers & Key Takeaways
David Campbell
President & CEO
• Q&A Session
• Introduction
• Environmental, Social & Governance
• Operational Excellence
• Customer Experience & Retail Rates
• Regulatory Priorities
• Generation Transition & Renewable Strategy
• Financial Overview
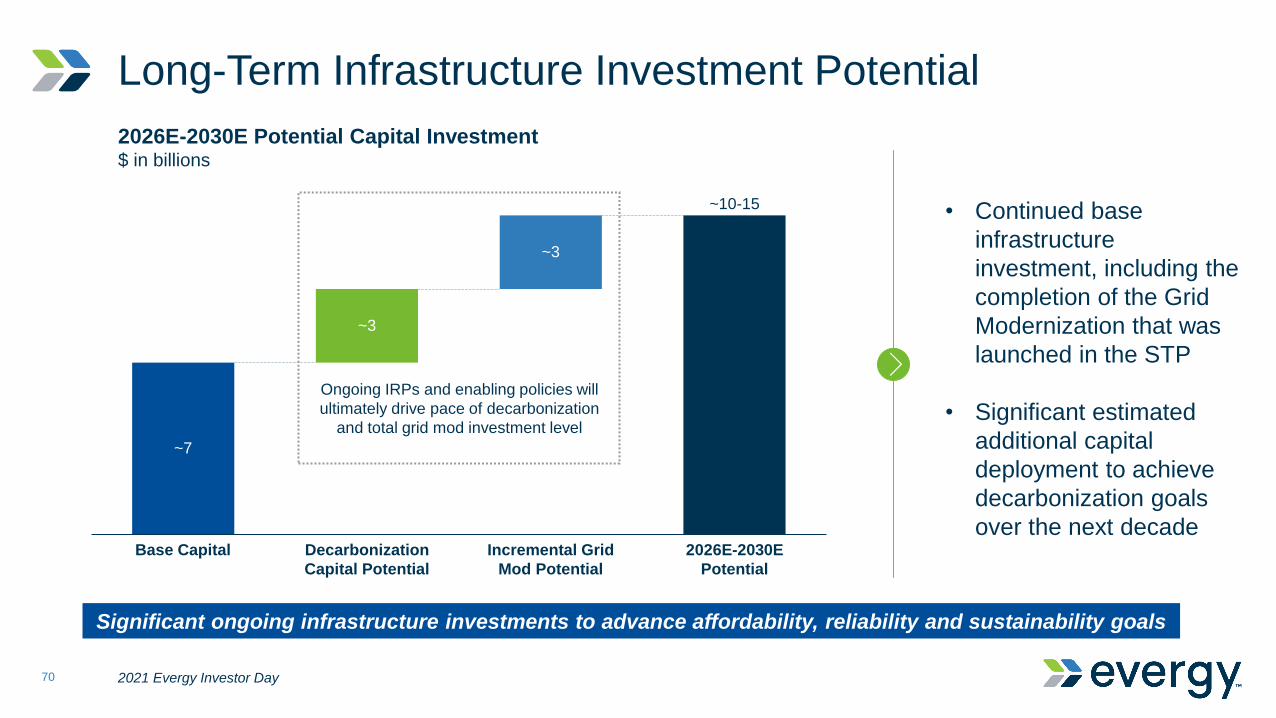
Long-Term Infrastructure Investment Potential
2021 Evergy Investor Day70
Base Capital Decarbonization
Capital Potential
2026E-2030E
Potential
Incremental Grid
Mod Potential
~10-15
~7
~3
~3
Ongoing IRPs and enabling policies will
ultimately drive pace of decarbonization
and total grid mod investment level
2026E-2030E Potential Capital Investment $ in billions
• Continued base
infrastructure
investment, including the
completion of the Grid
Modernization that was
launched in the STP
• Significant estimated
additional capital
deployment to achieve
decarbonization goals
over the next decade
Significant ongoing infrastructure investments to advance affordability, reliability and sustainability goals

Geographically Advantaged Service Territory |World-Class Wind Resource Potential
2021 Evergy Investor Day71
Kansas Missouri
Kansas is one of the best wind resource corridors in the US;
robust long-term runway for regional infrastructure investment
Evergy
Service
Territory
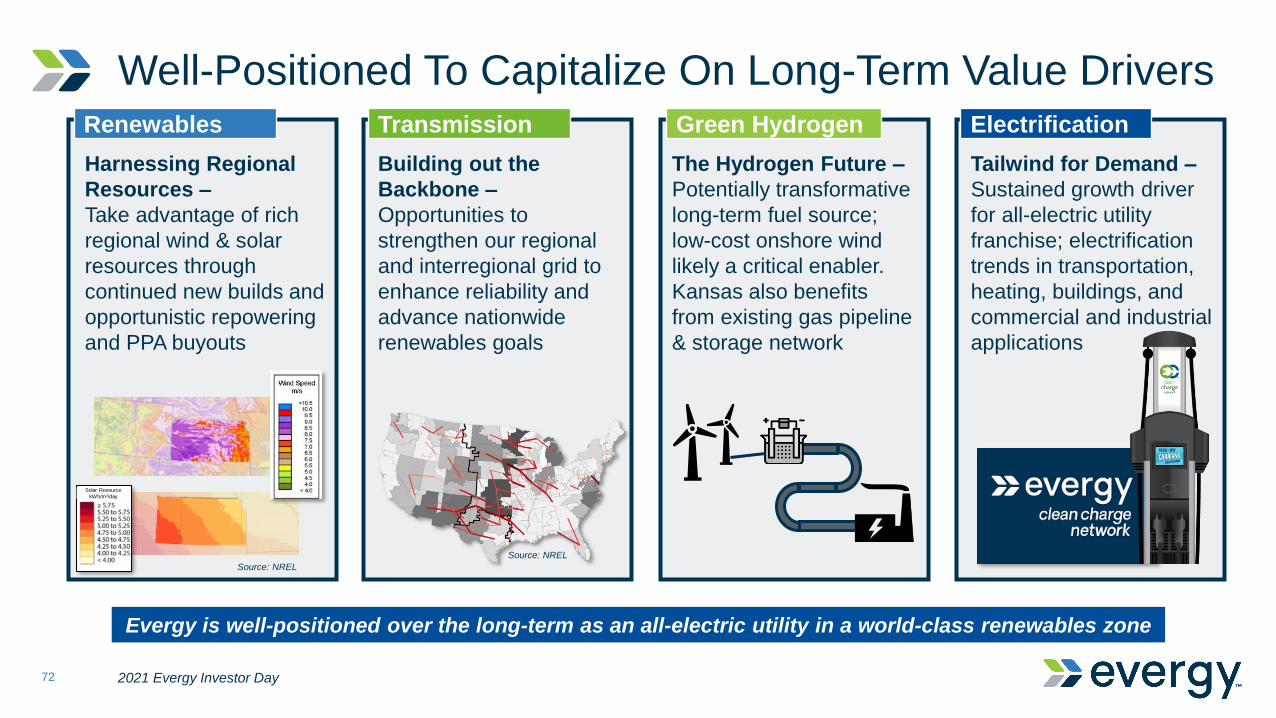
Well-Positioned To Capitalize On Long-Term Value Drivers
2021 Evergy Investor Day72
Evergy is well-positioned over the long-term as an all-electric utility in a world-class renewables zone
TransmissionRenewables Green Hydrogen
Building out the
Backbone –
Opportunities to
strengthen our regional
and interregional grid to
enhance reliability and
advance nationwide
renewables goals
Source: NREL
Harnessing Regional
Resources –
Take advantage of rich
regional wind & solar
resources through
continued new builds and
opportunistic repowering
and PPA buyouts
Source: NREL
The Hydrogen Future –
Potentially transformative
long-term fuel source;
low-cost onshore wind
likely a critical enabler.
Kansas also benefits
from existing gas pipeline
& storage network
Solar Resource
kWh/m2/day
Electrification
Tailwind for Demand –
Sustained growth driver
for all-electric utility
franchise; electrification
trends in transportation,
heating, buildings, and
commercial and industrial
applications
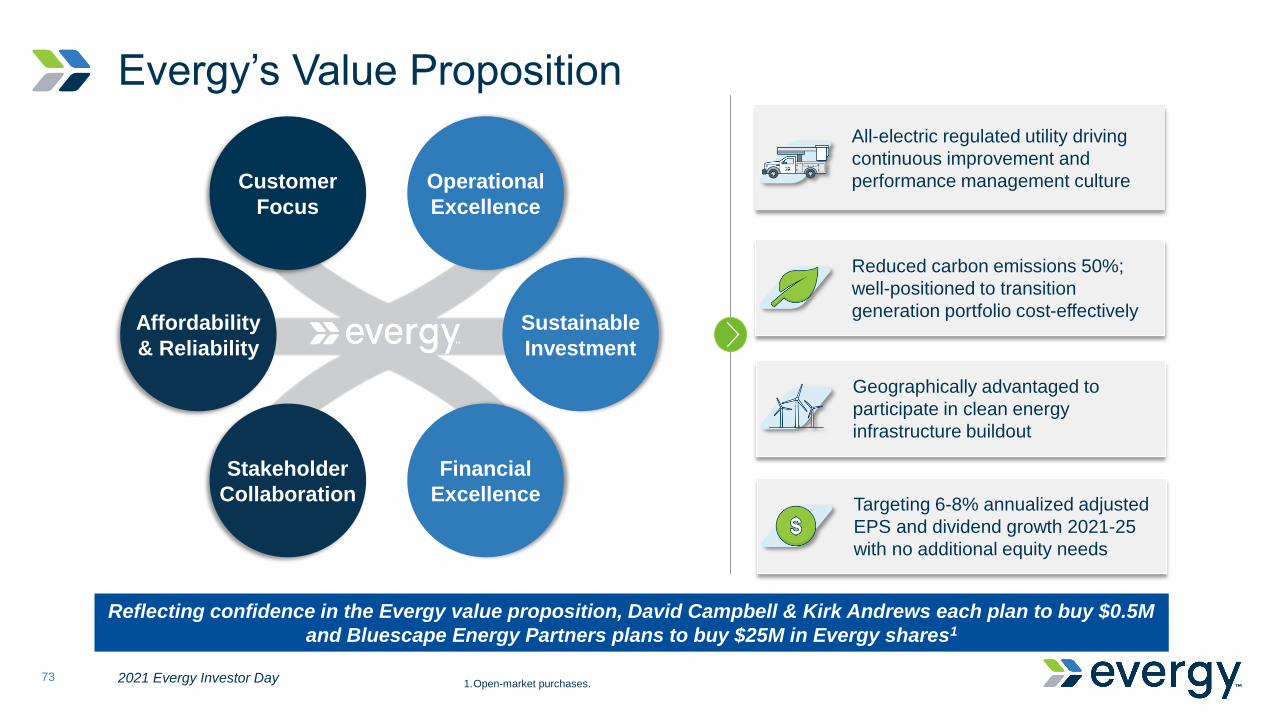
Targeting 6-8% annualized adjusted
EPS and dividend growth 2021-25
with no additional equity needs
Evergy’s Value Proposition
2021 Evergy Investor Day73
Customer
Focus
Stakeholder
Collaboration
Operational
Excellence
Sustainable
Investment
Financial
Excellence
Affordability
& Reliability
Reflecting confidence in the Evergy value proposition, David Campbell & Kirk Andrews each plan to buy $0.5M
and Bluescape Energy Partners plans to buy $25M in Evergy shares1
All-electric regulated utility driving
continuous improvement and
performance management culture
Reduced carbon emissions 50%;
well-positioned to transition
generation portfolio cost-effectively
Geographically advantaged to
participate in clean energy
infrastructure buildout
1.Open-market purchases.
2021 Evergy Investor Day
Analyst Q&A Dial In:
Phone: (888) 353-7071
ID: 9269637
*Please close or mute webcast
prior to dialing in.

Appendix

2021E – 2025E Capital Investment
2021 Evergy Investor Day76
$ in millions 2021E 2022E 2023E 2024E 2025E Total
Generation 346 326 285 200 236 1,393
Transmission 643 650 617 649 601 3,160
Distribution 667 726 571 528 574 3,066
General Facilities and Other1 297 314 267 228 256 1,362
Subtotal Base CapEx 1,953 2,016 1,740 1,605 1,667 8,981
New Renewables -- -- 253 450 750 1,453
Total 1,953 2,016 1,993 2,055 2,417 10,434
20%
44%
36%
FERC
Kansas
Missouri
50%
13%
17%
20%
KS Central
KS Metro
MO Metro
MO West
2021E – 2025E Capital Investment
by Jurisdiction
2021E – 2025E Capital Investment
by State
1. Includes Information Technology, Safety & Operations Planning, Customer Operations, and Other
GAAP to Non-GAAP EPS Reconciliation1
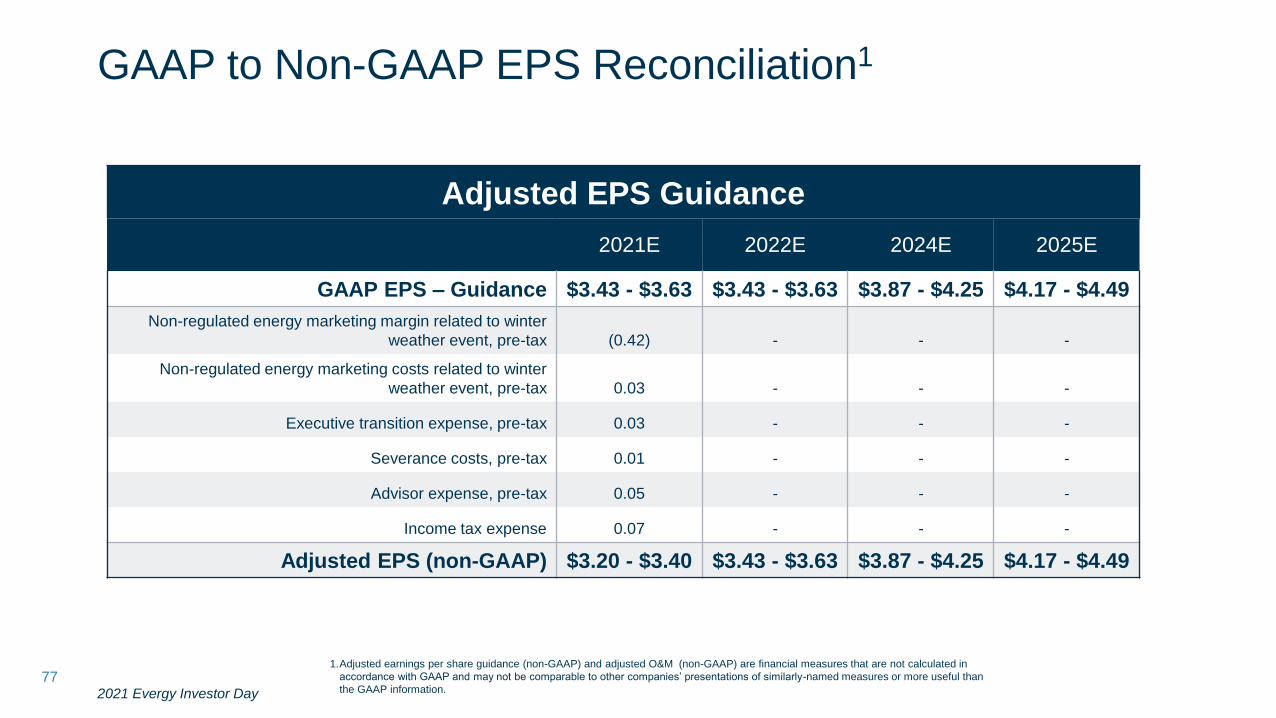
771.Adjusted earnings per share guidance (non-GAAP) and adjusted O&M (non-GAAP) are financial measures that are not calculated in
accordance with GAAP and may not be comparable to other companies’ presentations of similarly-named measures or more useful than
the GAAP information.2021 Evergy Investor Day
Adjusted EPS Guidance
2021E 2022E 2024E 2025E
GAAP EPS – Guidance $3.43 - $3.63 $3.43 - $3.63 $3.87 - $4.25 $4.17 - $4.49
Non-regulated energy marketing margin related to winter
weather event, pre-tax (0.42) - - -
Non-regulated energy marketing costs related to winter
weather event, pre-tax 0.03 - - -
Executive transition expense, pre-tax 0.03 - - -
Severance costs, pre-tax 0.01 - - -
Advisor expense, pre-tax 0.05 - - -
Income tax expense 0.07 - - -
Adjusted EPS (non-GAAP) $3.20 - $3.40 $3.43 - $3.63 $3.87 - $4.25 $4.17 - $4.49
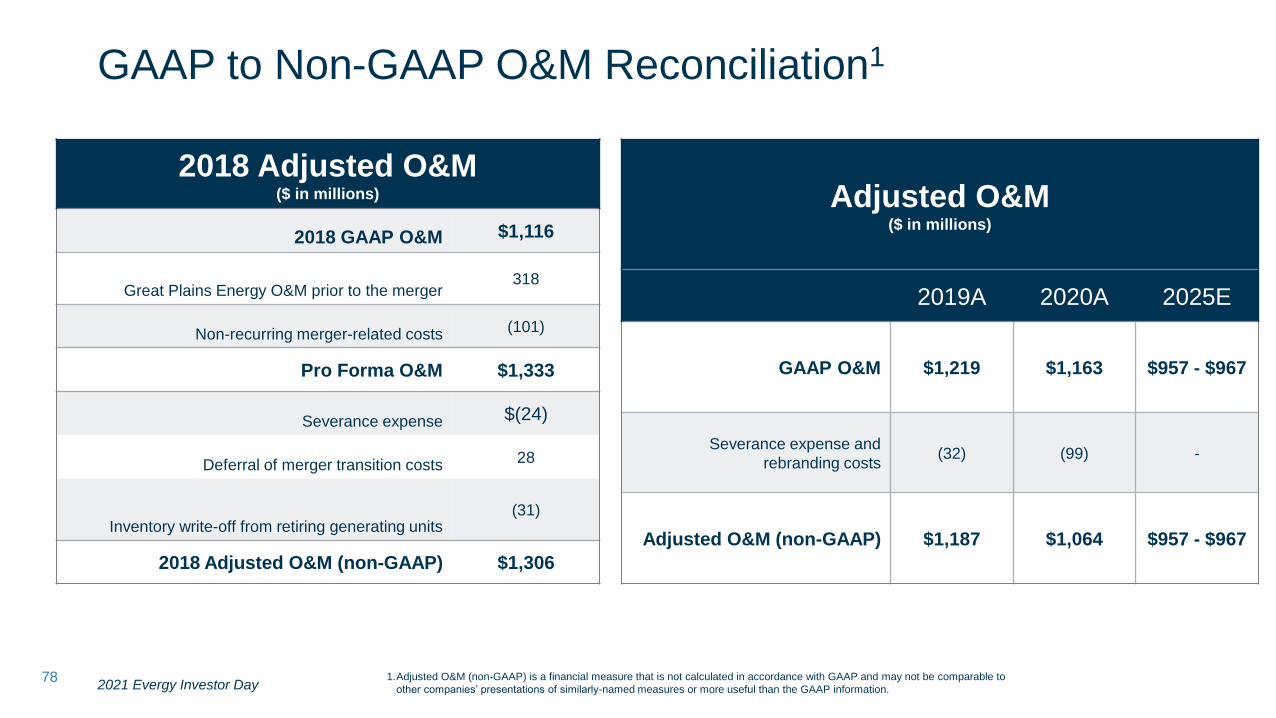
GAAP to Non-GAAP O&M Reconciliation1
78 1.Adjusted O&M (non-GAAP) is a financial measure that is not calculated in accordance with GAAP and may not be comparable to
other companies’ presentations of similarly-named measures or more useful than the GAAP information.
Adjusted O&M($ in millions)
2019A 2020A 2025E
GAAP O&M $1,219 $1,163 $957 - $967
Severance expense and
rebranding costs(32) (99) -
Adjusted O&M (non-GAAP) $1,187 $1,064 $957 - $967
2021 Evergy Investor Day
2018 Adjusted O&M ($ in millions)
2018 GAAP O&M $1,116
Great Plains Energy O&M prior to the merger318
Non-recurring merger-related costs (101)
Pro Forma O&M $1,333
Severance expense $(24)
Deferral of merger transition costs 28
Inventory write-off from retiring generating units(31)
2018 Adjusted O&M (non-GAAP) $1,306
792021 Evergy Investor Day
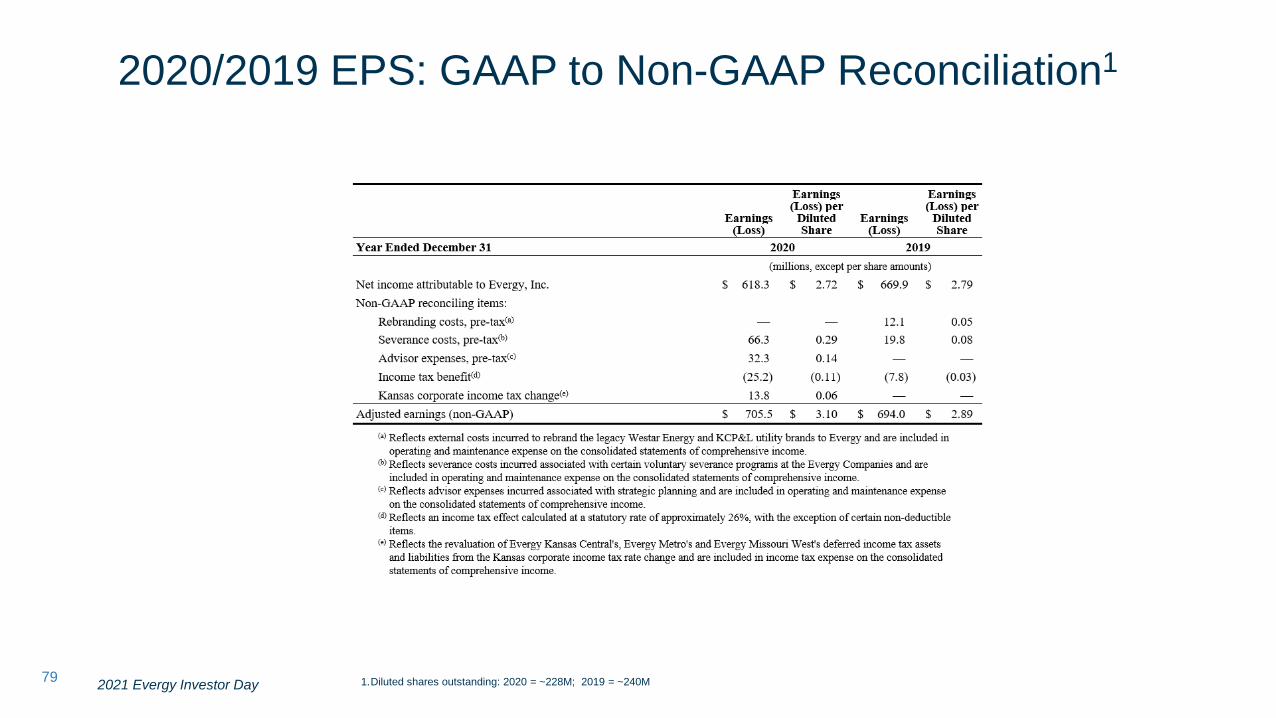
2020/2019 EPS: GAAP to Non-GAAP Reconciliation1
1.Diluted shares outstanding: 2020 = ~228M; 2019 = ~240M

2018/2019 EPS: GAAP to Non-GAAP Reconciliation
80 1.GAAP diluted shares outstanding: YTD 4Q19 = ~240M; YTD 4Q18 = ~214M
2.Pro forma and Adjusted diluted shares outstanding: YTD 4Q19 = ~240M; YTD 4Q18 = ~268M
2021 Evergy Investor Day
(a) Reflects pro forma adjustments made in accordance with Article 11 of Regulation S-X and ASC 805 - Business Combinations. See Note 2 to the consolidated financial statements in the Evergy Companies' combined 2018 annual report
on Form 10-K for further information regarding these adjustments.
(b) Reflects external costs incurred to rebrand the legacy Westar Energy and KCP&L utility brands to Evergy and are included in operating and maintenance expense on the consolidated statements of comprehensive income.
(c) Reflects severance costs incurred associated with certain voluntary severance programs at the Evergy Companies and are included in operating and maintenance expense on the consolidated statements of comprehensive income.
(d) Reflects the revaluation of Evergy Kansas Central's deferred income tax assets and liabilities based on the Evergy composite tax rate as a result of the merger in June 2018 and are included in income tax expense on the consolidated
statements of comprehensive income.
(e) Reflects the portion of the $47.8 million deferral of merger transition costs to a regulatory asset in June 2018 that related to costs incurred prior to 2018. The remaining merger transition costs included within the $47.8 million deferral
were both incurred and deferred in 2018 and did not impact earnings. This item is included in operating and maintenance expense on the consolidated statements of comprehensive income.
(f) Reflects obsolete inventory write-offs for Evergy Kansas Central's Unit 7 at Tecumseh Energy Center, Units 3 and 4 at Murray Gill Energy Center, Units 1 and 2 at Gordon Evans Energy Center, Evergy Metro's Montrose Station and
Evergy Missouri West's Sibley Station and are included in operating and maintenance expense on the consolidated statements of comprehensive income.
(g) Reflects an income tax effect calculated at a 26.1% statutory rate, with the exception of certain non-deductible items.
Earnings
(Loss)
Earnings
(Loss) per
Diluted
Share
Earnings
(Loss)
Earnings
(Loss) per
Diluted
Share
Year Ended December 31 2019 2018
(millions, except per share amounts)
Net income attributable to Evergy, Inc. $ 669.9 $ 2.79 $ 535.8 $ 2.50
Pro forma adjustments(a):
Great Plains Energy earnings prior to merger — — 94.4 0.35
Great Plains Energy shares prior to merger n/a — n/a (0.50)
Non-recurring merger costs and other — — 84.1 0.32
Pro forma net income attributable to Evergy, Inc. $ 669.9 $ 2.79 $ 714.3 $ 2.67
Non-GAAP reconciling items:
Rebranding costs, pre-tax(b) 12.1 0.05 — —
Voluntary severance costs, pre-tax(c) 19.8 0.08 23.5 0.09
Composite tax rate change(d) — — (52.6) (0.20)
Deferral of merger transition costs, pre-tax(e) — — (28.5) (0.11)
Inventory write-off at retiring generating units, pre-tax(f) — — 31.0 0.12
Income tax benefit(g) (7.8) (0.03) (6.8) (0.03)
Adjusted earnings (non-GAAP) $ 694.0 $ 2.89 $ 680.9 $ 2.54

Glossary of Acronyms & Abbreviations
2021 Evergy Investor Day81
• A&G: Administrative and General
• AAO: Accounting Authority Order
• CAGR: Compound Annual Growth Rate
• CapEx:Capital Expenditure
• CIP: Critical Infrastructure Protection
• CPI: Consumer Price Inflation
• EE: Energy Efficiency
• EV: Electric Vehicles
• EPS: Earnings Per Share
• ESG: Environmental, Social and Governance
• F&PP: Fuel and Purchased Power
• FERC: Federal Energy Regulatory Commission
• GAAP: Generally Accepted Accounting Principles
• GMP: Gross Metro Product
• IOU: Investor-Owned Utility
• IRP: Integrated Resource Plan
• KCC: Kansas Corporation Commission
• LEC: Lawrence Energy Center
• MPSC: Missouri Public Service Commission
• O&M: Operations and Maintenance
• PISA: Plant In Service Accounting
• PPA: Purchase Power Agreement
• PTC: Production Tax Credit
• RFP: Request For Proposal
• STP: Sustainability Transformation Plan
• T&D: Transmission and Delivery
• TCFD: Task Force on Climate-Related Financial Disclosures
• TDC: Transmission Delivery Charge