Embed Size (px)
Citation preview
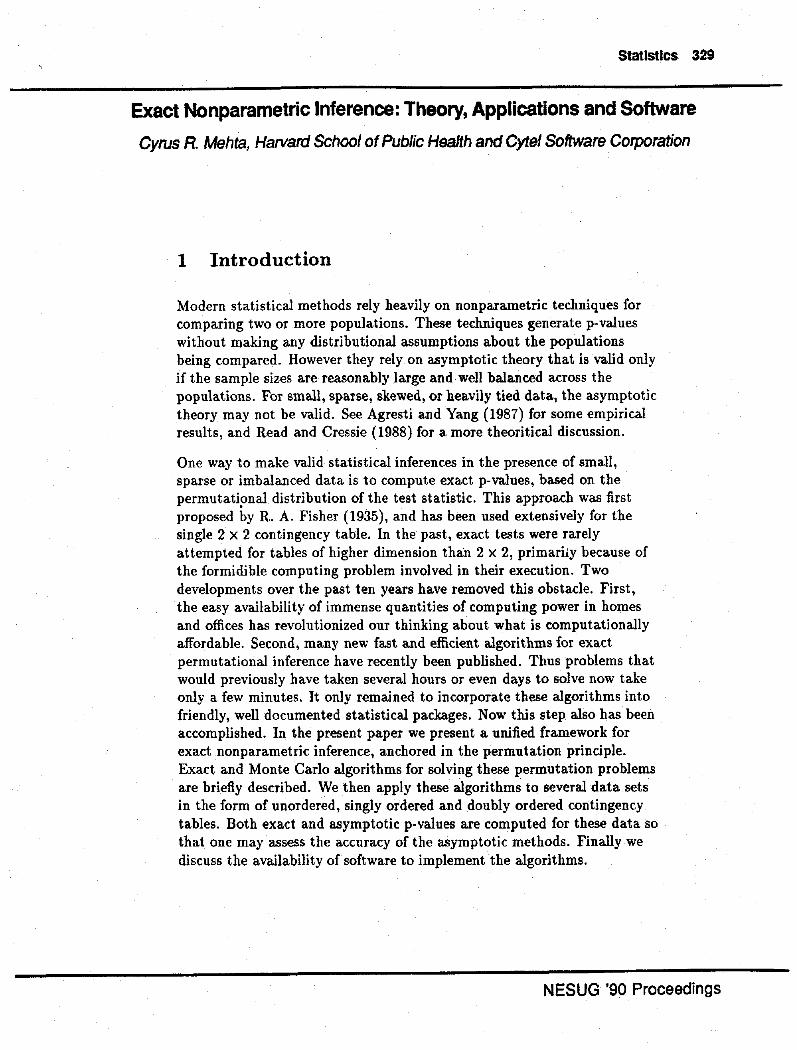
Statistics 329
Exact Nonparametric Inference: Theory, Applications and Software
Cyrus R. Mehta, Harvard School of Public Health and Cytel Software Corporation
1 Introduction
Modern statistical methods rely heavily on nonparametric techniques for comparing two or more populations. These techniques generate p-values without making any distributional assumptions about the populations being compared. However they rely on asymptotic theory that is valid only if the sample sizes are reasonably large and well balanced across the populations. For small, sparse, skewed, or heavily tied data, the asymptotic theory may not be valid. See Agresti and Yang (1987) for some empirical results, and Read and Cressie (1988) for a more theoritical discussion.
One way to make valid statistical inferences in the presence of small, sparse or imbalanced data is to compute exact p-values, based on the permutational distribution of the test statistic. This approach was first proposed by R. A. Fisher (1935), and has been used extensively for the single 2 x 2 contingency table. In the past, exact tests were rarely attempted for tables of higher dimension than 2 x 2, primariiy because of the formidible computing problem involved in their execution. Two developments over the past ten years have removed this obstacle. First, the easy availability of immense quantities of computing power in homes and offices has revolutionized our thinking about what is computationally affordable. Second, many new fast and efficient algorithms for exact permutational inference have recently been published. Thus problems that would previously have taken several hours or even days to solve now take only a few minutes. It only remained to incorporate these algorithms into friendly, well documented statistical packages. Now this step also has been accomplished. In the present paper we present a unified framework for exact nonparametric inference, anchored in the permutation principle. Exact and Monte Carlo algorithms for solving these permutation problems are briefly described. We then apply these algorithms to several data sets in the form of unordered, singly ordered and doubly ordered contingency tables. Both exact and asymptotic p-values are computed for these data so that one may assess the accuracy of the asymptotic methods. Finally we discuss the availability of software to implement the algorithms.
NESUG '90 Proceedings
330 Statistics
2 N onparametrics and the Permutation Principle
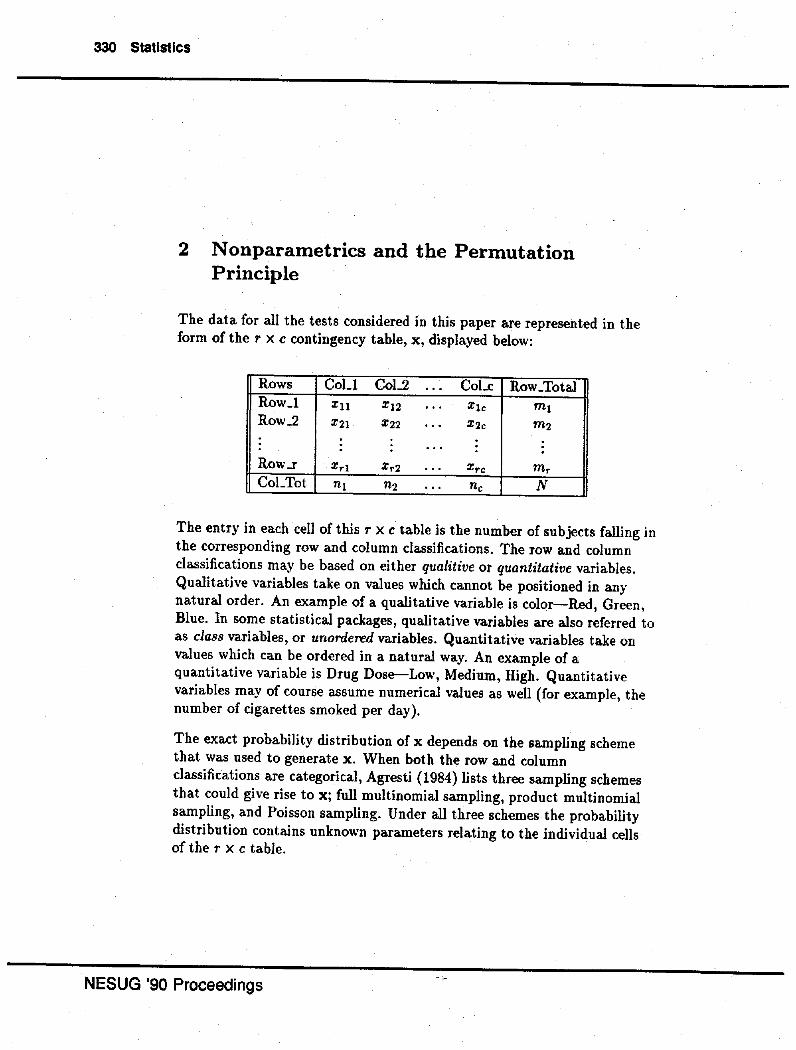
The data for all the tests considered in this paper are represented in the form of the r X c contingency table, x, displayed below:
Rows CoLl CoL2 ... CoLe Row_Total Row_l xu X12 ... Xtc m1 Row..2 X21 X22 ... X2c ffl2
: . ... . Row..r Xrl Xr2 ... Xrc fflr
CoL Tot n1 n2 ... nc N
The entry in each cell of this r x c table is the number of subjects falling in the corresponding row and column classifications. The row and column classifications may be based on either qualitive or quantitative variables. Qualitative variables take on values which cannot be positioned in any natural order. An example of a qualitative variable is color-Red, Green, Blue. In some statistical packages, qualitative variables are also referred to as class variables, or unordered variables. Quantitative variables take on values which can be ordered in a natural way. An example of a quantitative variable is Drug Dose-Low, Medium, High. Quantitative variables may of course assume numerical values as well (for example, the number of cigarettes smoked per day).
The exact probability distribution of x depends on the sampling scheme that was used to generate x. When both the row and column classifications are categorical, Agresti {1984) lists three sampling schemes that could give rise to x; full multinomial sampling, product multinomial sampling, and Poisson sampling. Under all three schemes the probability distribution contains unknown parameters relating to the individual cells of the r X c table.
NESUG '90 Proceedings
Statistics 331
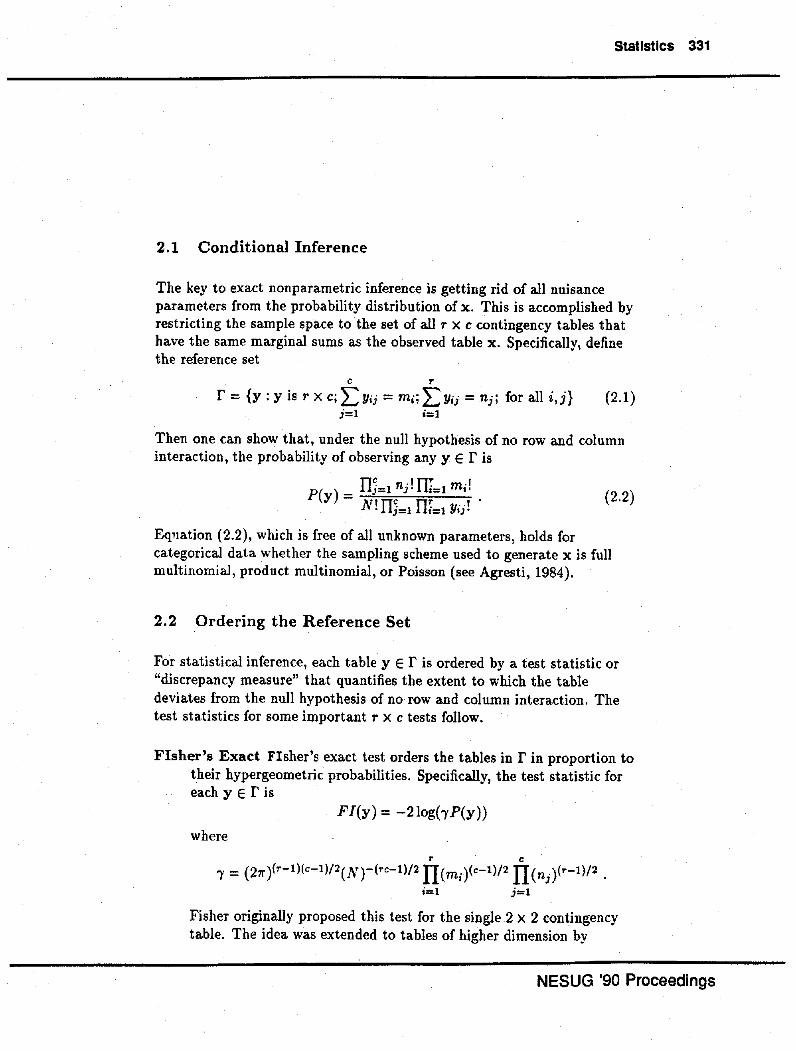
2.1 Conditional Inference
The key to exact non parametric inference is getting rid of all nuisance parameters from the probability distribution of x. This is accomplished by restricting the sample space to the set of all r x c contingency tables that have the same marginal sums as the observed table x. Specifically, define the reference set
c r
r = {y: y is T X Cj L: Yij = m;; LYij = njj for all i,j} (2.1) i=l i=I
Then one can show that, under the null hypothesis of no row and column interaction, the probability of observing any y E f is
Il c .1nr .1 P(y) = N~JrJ· Il;=t m,; .
· i=t i=t Y•J • (2.2)
Eqnation (2.2), which is free of all unknown parameters, holds for categorical data whether the sampling scheme used to generate x is full multinomial, product multinomial, or Poisson (see Agresti, 1984).
2.2 Ordering the Reference Set
For statistical inference, each table y E r is ordered by a test statistic or "discrepancy measure" that quantifies the extent to which the table deviates from the null hypothesis of no row and column interaction. The test statistics for some important r x c tests follow.
Fisher's Exact Fisher's exact test orders the tables in r in proportion to their hypergeometric probabilities. Specifically, the test statistic for each y E f is
F/(y) = -2log(i'P(y))
where
r c I = {211" )fr-l)(c-I)/2(N)-(rc-l)/2 IT ( m; )<c-1)/2 IT ( nj )fr-1)/2 .
i=l j=l
Fisher originally proposed this test for the single 2 X 2 contingency table. The idea was extended to tables of higher dimension by
NESUG '90 Proceedings
332 Statistics
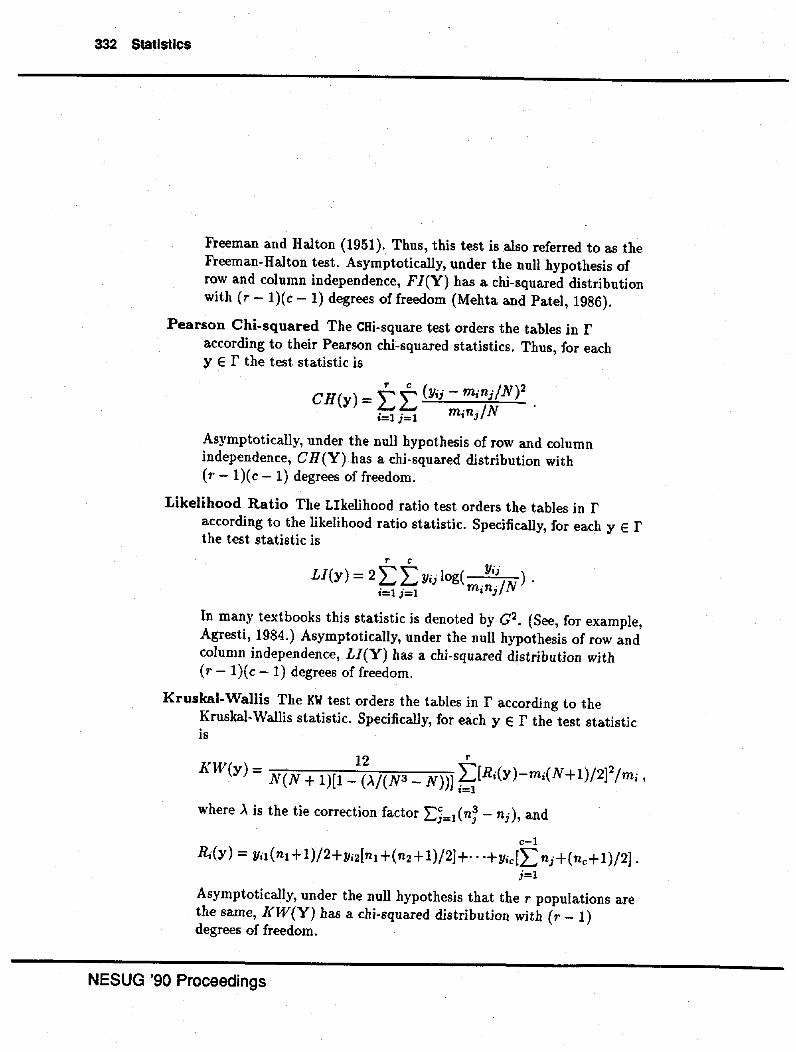
Freeman and Halton (1951). Thus, this test is also referred to as the Freeman-Halton test. Asymptotically, under the null hypothesis of row and column independence, FI(Y) has a chi-squared distribution with ( r - 1 )( c- 1) degrees of freedom (Mehta and Patel, 1986).
Pearson Chi-squared The CHi-square test orders the tables in f according to their Pearson chi-squared statistics. Thus, for each y E f the test statistic is
CH(y) = tt (Yii- m;ni/N)2 i=I j=l m;nj/N
Asymptotically, under the null hypothesis of row and column independence, C H(Y) has a chi-squared distribution with (r- 1)(c- 1) degrees offreedom.
Likelihood Ratio The Likelihood ratio test orders the tables in f according to the likelihood ratio statistic. Specifically, for each y E r the test statistic is
In many textbooks this statistic is denoted by G2• (See, for example, Agresti, 1984.) Asymptotically, under the null hypothesis of row and column independence, LI(Y) has a chi-squared distribution with (r- 1)(c- 1) degrees of freedom.
Kruskal-Wallis The KW test orders the tables in f according to the Kruskal-Wallis statistic. Specifically, for each y E r the test statistic is
KW(y) = N(N + 1)[1-1~>../(NJ- N))J ~[R;(y)-m;(N+1)j2]2jm;, where>. is the tie correction factor L:;j= 1 (n~- ni), and
c-1 R;(y) = 1/il ( n1 +1)/2+Yi2[nJ +(n2+ 1)/2]+· · +Yic[L nj+(nc+l)/2].
i=l
Asymptotically, under the null hypothesis that the r populations are the same, J(W(Y) has a chi-squared distribution with (r- 1) degrees of freedom.
NESUG '90 Proceedings
Statistics 333
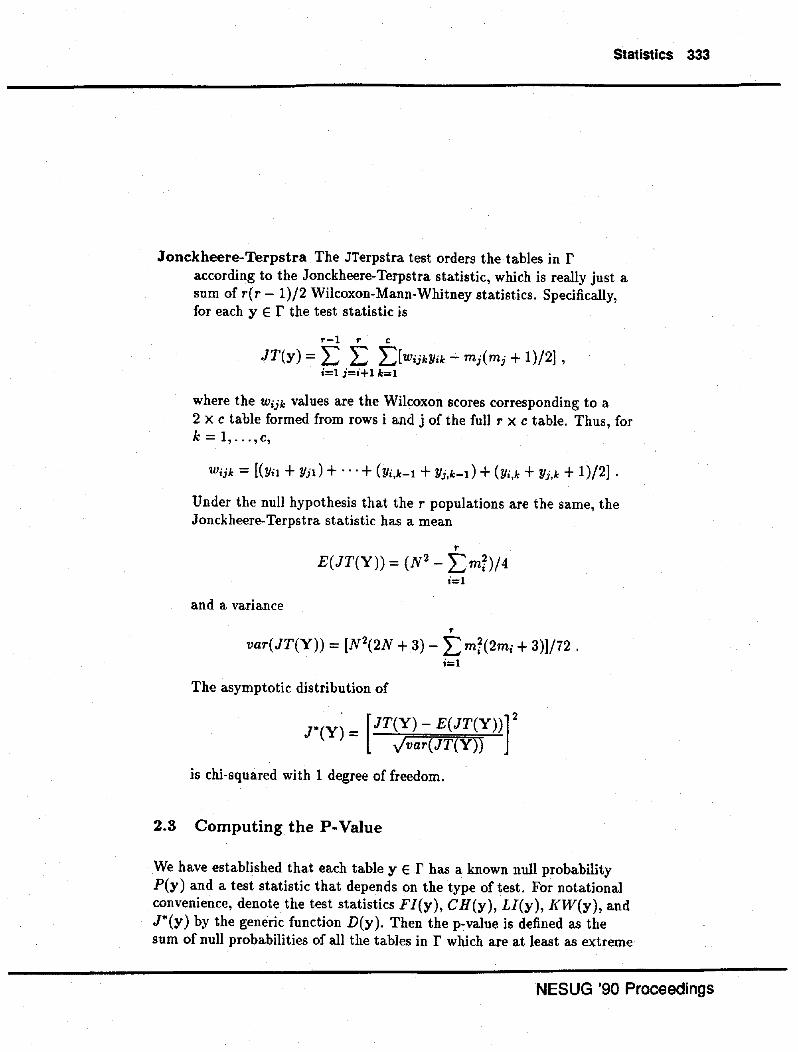
Jonckheere-Terpstra The JTerpstra test orders the tables in f according to the Jonckheere-Terpstra statistic, which is really just a sum of r(r- 1)/2 Wilcoxon-Mann-Whitney statistics. Specifically, for each y E f the test statistic is
r-1 r c
JT(y) = L L L[WijkYik- mj(mj + 1)/2], i=1 j=i+1 k=1
where the Wijk values are the Wilcoxon scores corresponding to a 2 x c table formed from rows i and j of the full r x c table. Thus, for k=1, ... ,c,
Wijk = [(Yi1 + Yii) + · · · + (Yi,k-1 + Yj,k-1) + (Yi,k + Yi,k + 1 )/2] ·
Under the null hypothesis that the r populations are the same, the Jonckheere-Terpstra statistic has a mean
r
E(JT(Y)) = (N 2- L mt}/4
i=1
and a variance
r
var(JT(Y)) = [N2(2N + 3)- L m~(2m; + 3)]/72 . i=1
The asymptotic distribution of
J"(Y) = [JT(Y)- E(JT(Y))]2
Jvar(JT(Y))
is chi-squared with 1 degree of freedom.
2.3 Computing the P-Value
We have established that each table y E f has a known null probability P(y) and a test statistic that depends on the type of test. For notational convenience, denote the test statistics F/(y), CH(y), LI(y), KW(y), and J*(y) by the generic function D(y). Then the p-value is defined as the sum of null probabilities of all the tables in r which are at least as extreme
NESUG '90 Proceedings
334 Statistics
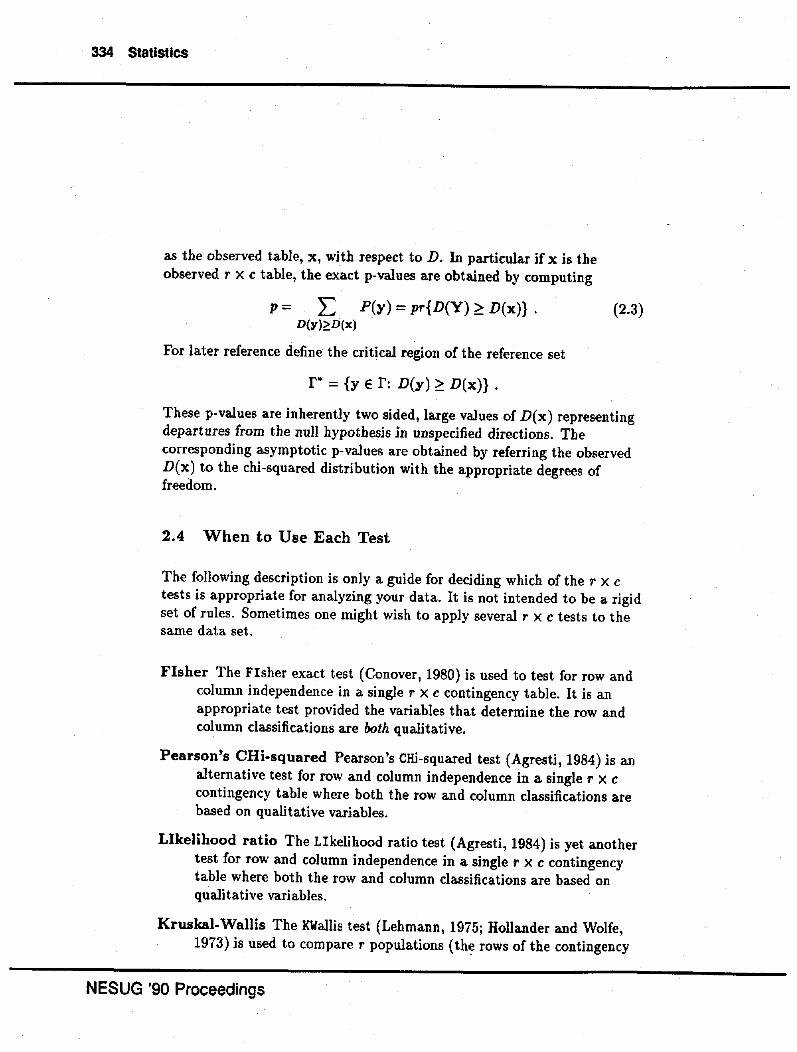
as the observed table, x, with respect to D. In particular if xis the observed r x c table, the exact p-values are obtained by computing
p = L P(y) = pr{D(Y) ~ D(x)} . D(y)~D(x)
For later reference define the critical region of the reference set
r· = {y e r: D(y) ~ D(x)} .
(2.3)
These p-values are inherently two sided, large values of D(x) representing departures from the null hypothesis in unspecified directions. The corresponding asymptotic p-values are obtained by referring the observed D(x) to the chi-squared distribution with the appropriate degrees of freedom.
2.4 When to Use Each Test
The following description is only a guide for deciding which of the r x c tests is appropriate for analyzing your data. It is not intended to be a rigid set of rules. Sometimes one might wish to apply several r x c tests to the same data set.
Fisher The Fisher exact test (Conover, 1980) is used to test for row and column independence in a single r x c contingency table. It is an appropriate test provided the variables that determine the row and column classifications are both qualitative.
Pearson's CHi-squared Pearson's CHi-squared test (Agresti, 1984) is an alternative test for row and column independence in a single r x c contingency table where both the row and column classifications are based on qualitative variables.
Likelihood ratio The Likelihood ratio test (Agresti, 1984) is yet another test for row and column independence in a single r x c contingency table where both the row and column classifications are based on qualitative variables.
Kruskal-Wallis The KWallis test (Lehmann, 1975; Hollander and Wolfe, 1973) is used to compare r populations (the rows of the contingency
NESUG '90 Proceedings
StatistiCS 335
table}, each containing subjects whose responses are measured on a quantitative scale that can be classified into c distinct response levels (the columns of the contingency table). When there are only two rows, KWallis specializes to the two sided Wilcoxon rank sum test.
Jonckheere-Terpstra The JTerpstra test (Hollander and Wolfe, 1973}, like the KWallis test, is used to compare r populations (the rows of the contingency table), each containing subjects whose responses are measured on a quantitative scale which can be classified into c distinct response levels {the columns of the contingency table}. This test usually has more power than the KWallis test when the r populations have a natural ordering; i.e, when they are defined by the different levels of a quantitative variable. For example, if you are comparing r progressively increasing dose levels of some new drug in a clinical trial, the JTerpstra test would be preferred. However, if the r populations represent r qualitatively different drugs (instead of the same drug at r dose levels) then the KWallis test would be preferred. For the special case of two rows, JTerpstra specializes to the Wilcoxon
rank sum test.
As a general rule, if both the row and column classifications are unordered, one would use either the Fisher, Pearson or likelihood ratio tests. If the row classification is unordered and the column classification is ordered, one would use the Kruskal-Wallis test. If both the row and the column classifications are ordered, one would use the Jonckheere-Terpstra test.
Computational Issues
Computing equation (2.3) is a nontrivial task. The size of the reference set
grows exponentially so that explicit enumeration of all the tables in r soon becomes computationally infeasible. For example, the reference set of all
5 X 6 tables with row sums of (7, 7, 12, 4, 4} and column sums of {4, 5, 6, 5, 7, 7) contains 1.6 billion tables. Yet, the tables in this reference set are all rather sparse and unlikely to yield accurate p-values based on large sample theory. Network algorithms have been developed by Mehta and Patel ( 1983, 1984, 1985, 1986a, and 1986b) to enumerate the tables in r implicitly. This makes it feasible to compute exact p-values for tables with
the above margins. A different approach to implicit enumeration is
NESUG '90 Proceedings
336 Statistics
provided by Pagano and Halvorsen (1981). Sometimes a data set is too large even for implicit enumeration, yet it is sufficiently sparse that the asymptotic results are suspect. For such situations a Monte Carlo estimate and associated 99% confidence interval for the exact p-value may be obtained. In the Monte Carlo method, tables are sampled from r in proportion to their hypergeometric probabilities (2.2), and a count is kept of all the sampled tables that belong to r•. For details, refer to Agresti and Wackerly (1977), Patefield {1981), and Mehta, Patel and Senchaudhuri (1988).
3 Analysis of Data Sets
3.1 Unordered Contingency Tables
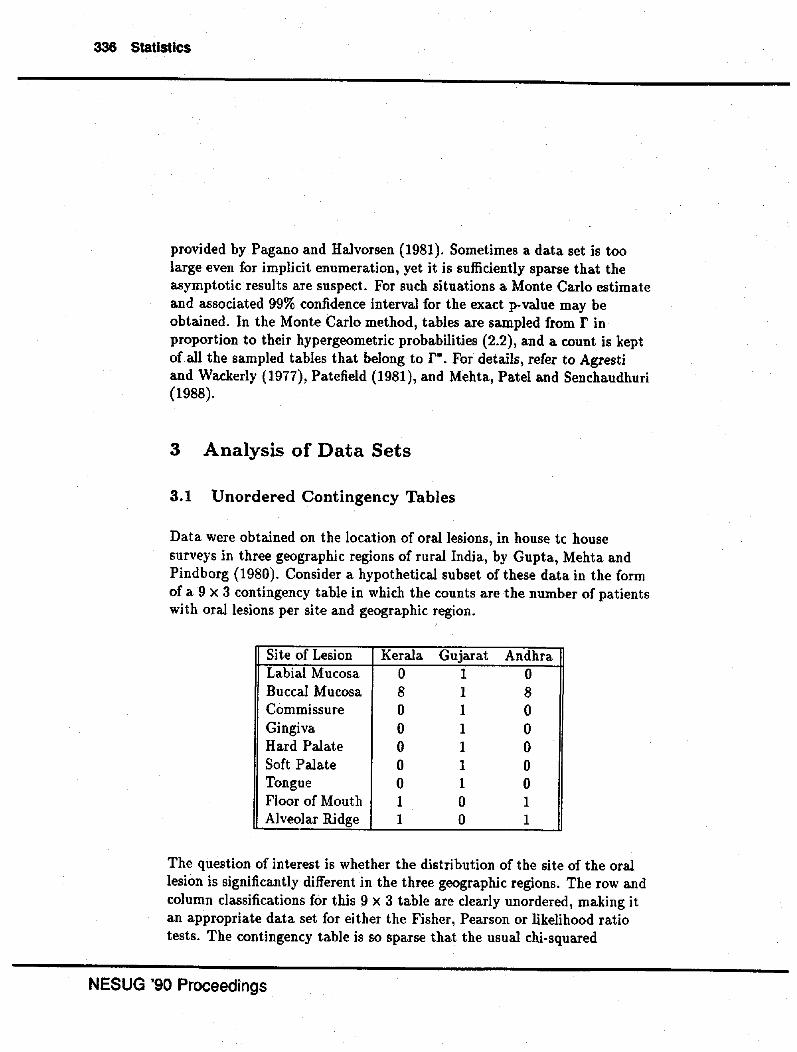
Data were obtained on the location of oral lesions, in house tc house surveys in three geographic regions of rural India, by Gupta, Mehta and Pindborg {1980). Consider a hypothetical subset of these data in the form of a 9 X 3 contingency table in which the counts are the number of patients with oral lesions per site and geographic region.
Site of Lesion Kerala Gujarat Andhra Labial Mucosa 0 1 0 Buccal Mucosa 8 1 8 Commissure 0 1 0 Gingiva 0 1 0 Hard Palate 0 1 0 Soft Palate 0 1 0 Tongue 0 1 0 Floor of Mouth 1 0 1 Alveolar Ridge 1 0 1
The question of interest is whether the distribution of the site of the oral lesion is significantly different in the three geographic regions. The row and column classifications for this 9 x 3 table are clearly unordered, making it an appropriate data set for either the Fisher, Pearson or likelihood ratio tests. The contingency table is so sparse that the usual chi-squared
NESUG '90 Proceedings
StatistiCS 337
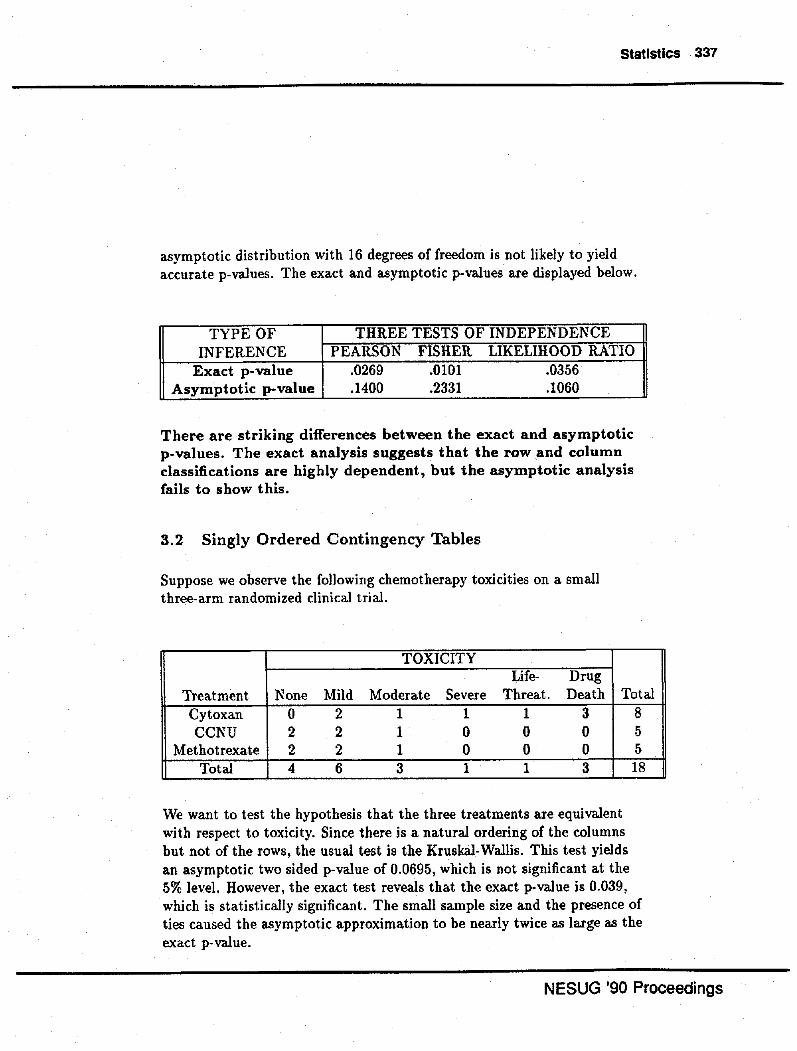
asymptotic distribution with 16 degrees of freedom is not likely to yield accurate p-values. The exact and asymptotic p-values are displayed below.
TYPE OF THREE TESTS OF INDEPENDENCE INFERENCE PEARSON FISHER LIKELIHOOD RATIO
Exact p-value .0269 .0101 .0356 Asymptotic p-value .1400 .2331 .1060
There are striking differences between the exact and asymptotic p-values. The exact analysis suggests that the row and column classifications are highly dependent, but the asymptotic analysis fails to show this.
3.2 Singly Ordered Contingency Tables
Suppose we observe the following chemotherapy toxicities on a small three-arm randomized clinical trial.
TOXICITY Life- Drug
Treatment None Mild Moderate Severe Threat. Death Cytoxan 0 2 1 1 1 3 CCNU 2 2 1 0 0 0
Methotrexate 2 2 1 0 0 0 Total 4 6 3 1 1 3
Total 8 5 5 18
We want to test the hypothesis that the three treatments are equivalent with respect to toxicity. Since there is a natural ordering of the columns but not of the rows, the usual test is the Kruskal-Wallis. This test yields an asymptotic two sided p-value of 0.0695, which is not significant at the 5% level. However, the exact test reveals that the exact p-value is 0.039, which is statistically significant. The small sample size and the presence of ties caused the asymptotic approximation to be nearly twice as large as the exact p-value.
NESUG '90 Proceedings
338 Statistics
3.3 Doubly Ordered Contingency Table
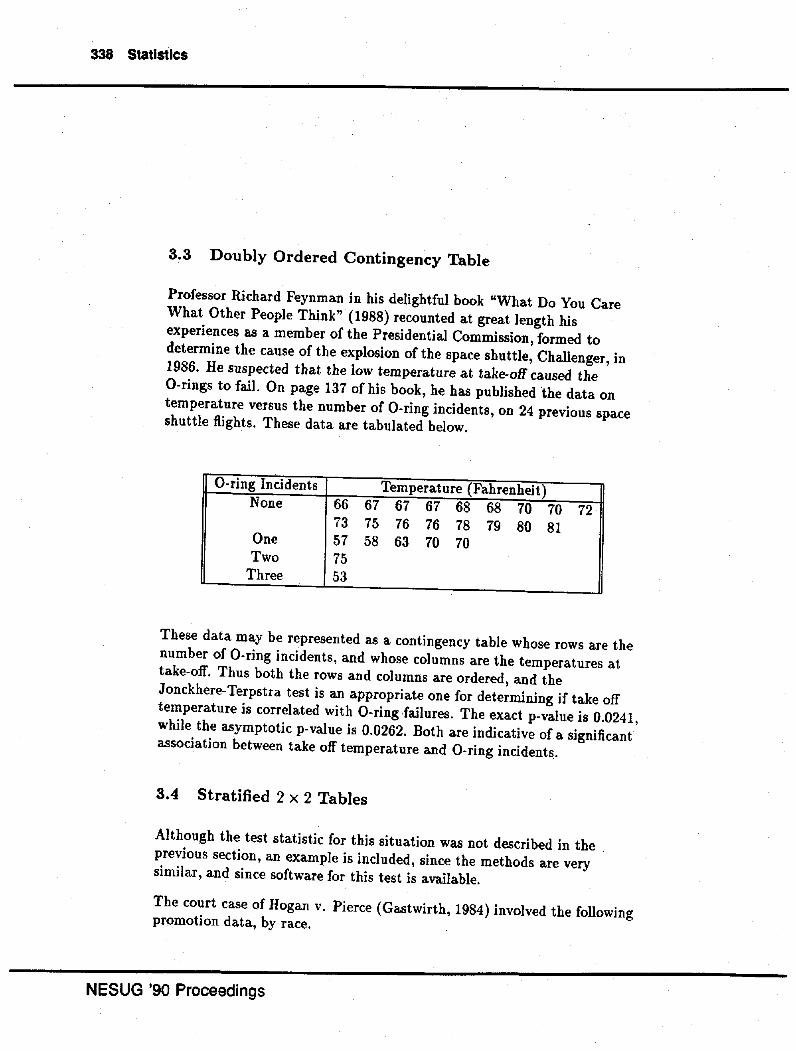
Professor Richard Feynman in his delightful book "What Do You Care What Other People Think" (1988) recounted at great length his experiences as a member of the Presidential Commission, formed to determine the cause of the explosion of the space shuttle, Challenger, in 1986. He suspected that the low temperature at take-off caused the 0-rings to fail. On page 137 of his book, he has published the data on temperature versus the number of 0-ring incidents, on 24 previous space shuttle flights. These data are tabulated below.
0-ring Incidents Temperature (Fahrenheit) None 66 67 6i 67 68 68 70 70 72
73 75 76 76 78 79 80 81 One 57 58 63 70 70 Two 75
Three 53
These data may be represented as a contingency table whose rows are the number of 0-ring incidents, and whose columns are the temperatures at take-off. Thus both the rows and columns are ordered, and the Jonckhere-Terpstra test is an appropriate one for determining if take off temperature is correlated with 0-ring Jailures. The exact p-value is 0.0241, while the asymptotic p-value is 0.0262. Both are indicative of a significant association between take off temperature and 0-ring incidents.
3.4 Stratified 2 x 2 Tables
Although the test statistic for this situation was not described in the previous section, an example is included, since the methods are very similar, and since software for this test is available.
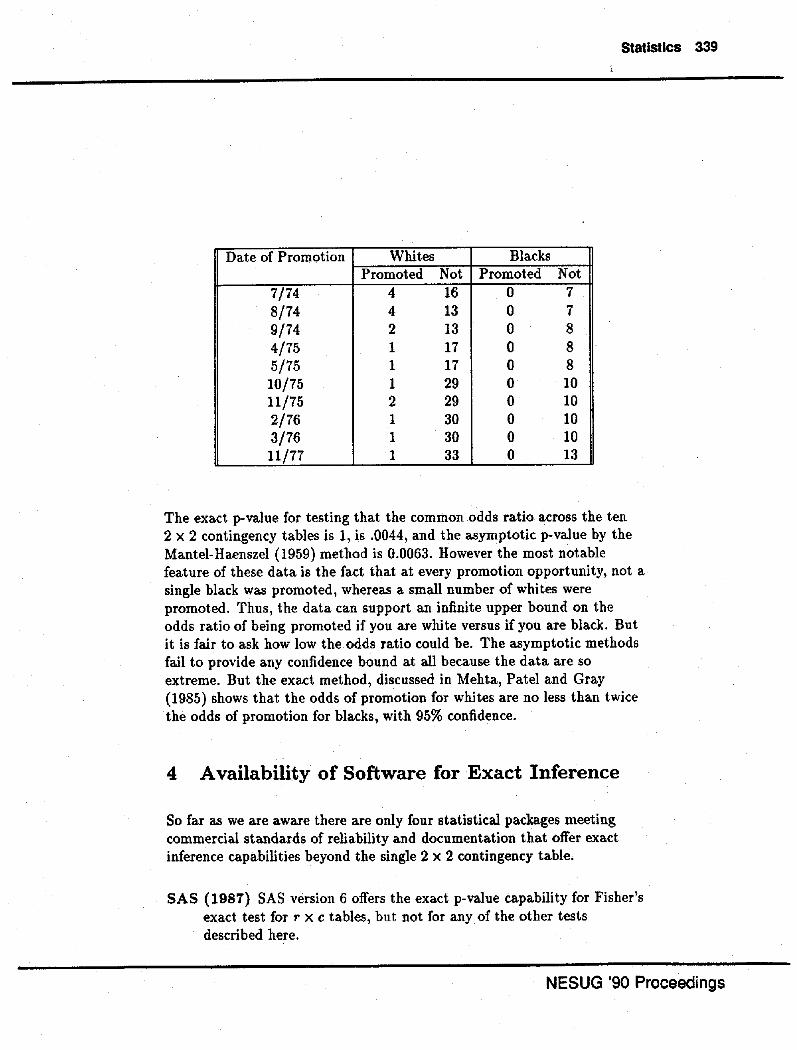
The court case of Hogan v. Pierce (Gastwirth, 1984) involved the following promotion data, by race.
NESUG '90 Proceedings
Statistics 339
Date of Promotion Whites Blacks Promoted Not Promoted Not
7/74 4 16 0 7 8/74 4 13 0 7 9/74 2 13 0 8 4/75 1 17 0 8 5/75 1 17 0 8 10/75 1 29 0 10 11/75 2 29 0 10 2/76 1 30 0 10 3/76 1 30 0 10 11/77 1 33 0 13
The exact p-value for testing that the common odds ratio across the ten 2 X 2 contingency tables is 1, is .0044, and the asymptotic p-value by the Mantel-Haenszel (1959) method is 0.0063. However the most notable feature of these data is the fact that at every promotion opportunity, not a single black was promoted, whereas a small number of whites were promoted. Thus, the data can support an infinite upper bound on the odds ratio of being promoted if you are white versus if you are black. But it is fair to ask how low the odds ratio could be. The asymptotic methods fail to provide any confidence bound at all because the data are so extreme. But the exact method, discussed in Mehta, Patel and Gray (1985) shows that the odds of promotion for whites are no less than twice the odds of promotion for blacks, with 95% confidence.
4 Availability of Software for Exact Inference
So far as we are aware there are only four statistical packages meeting commercial standards of reliability and documentation that offer exact inference capabilities beyond the single 2 X 2 contingency table.
SAS (1987) SAS version 6 offers the exact p-value capability for Fisher's exact test for r x c tables, but not for any of the other tests described here.
NESUG '90 Proceedings
340 Statistics
EGRET {1989) The EGRET package is available from Statistical and Epidemiology Research Corporation, 1107 NE 45, Suite 520, Seattle, WA 98105. It offers exact inference for stratifiied 2 X 2 contingency tables and for the Pearson test for a 2 X c contingency table. Exact inference for the general r x c problem is not provided.
Epi Info {1989) Epi Info is a series of programs used to create and analyse questionnaires and perform other common epidemiological tasks. One of the statistical capabilities provided by Epi Info is exact inference for the common odds ratio in stratified 2 x 2 contingency tables. It is available from the Division of Surveillance and Epidemiologic Studies, Epidemiology Program Office, Centers for Disease Control, Atlanta, GA 30333.
StatXact (1989) The StatXact package is available from Cytel Software Corporation, 137 Erie Street, Cambridge, MA 02139. It is currently the most complete package for exact nonparametric inference. It offers all the tests listed here md in addition, several specialized applications for the 2 X c contingency table including the Cochran-Armitage trend test, the normal scores test, the logrank test, and an arbitrary scores two-sample test. StatXact was developed by the author of this paper and his colleagues, to serve as a vehicle for converting their research on network and Monte Carlo algorithms into user friendly software. Its development was funded by the National Institutes of Health.
5 Concluding Remarks
We have presented the essential idea behind exact nonparametric inference, referenced numerical algorithms and software for its implementation, and shown through several examples that exact inference is a valuable supplement to corresponding asymptotic methods.
The methods described here extend naturally to continuous data. In principle, such data can also be represented as contingency tables but the colums of these tables will sum to 1.
Although we defined only a few discrepency measures for ordering the
NESUG '90 Proceedings
Statistics 341
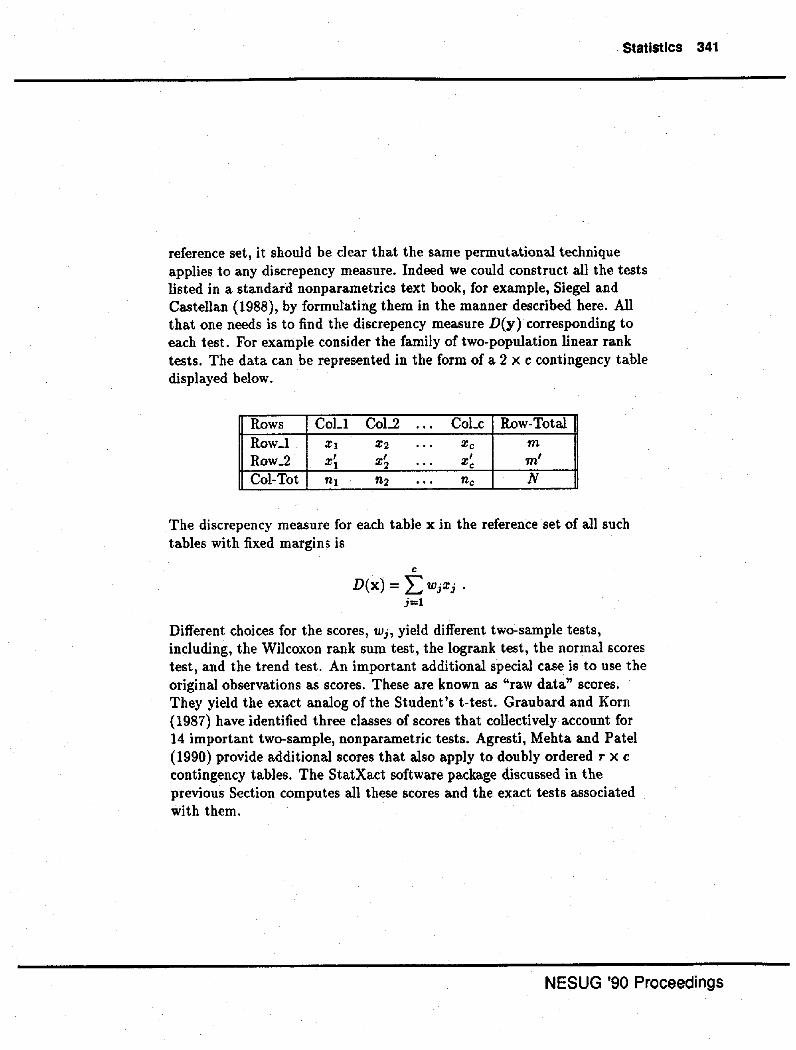
reference set, it should be clear that the same permutational technique applies to any discrepency measure. Indeed we could construct all the tests listed in a standard nonparametrics text book, for example, Siegel and Castellan (1988), by formulating them in the manner described here. All that one needs is to find the discrepency measure D(y) corresponding to each test. For example consider the family of two-population linear rank tests. The data can be represented in the form of a 2 x c contingency table displayed below.
Rows CoLl Col..2 ... CoLe Row-Total Row_1 X1 X2 ... Xc m Row..2 x' 1 x' 2 ... x' c m' Col-Tot n1 n2 ... nc N
The discrepency measure for each table x in the reference set of all such tables with fixed margins is
c
D(x) = 2:: WjXj •
i=l
Different choices for the scores, w;, yield different two-sample tests, including, the Wilcoxon rank sum test, the logrank test, the normal scores test, and the trend test. An important additional special case is to use the original observations as scores. These are known as "raw data" scores. They yield the exact analog of the Student's t-test. Graubard and Korn {1987) have identified three classes of scores that collectively account for 14 important two-sample, nonparametric tests. Agresti, Mehta and Patel (1990) provide additional scores that also apply to doubly ordered r x c contingency tables. The StatXact software package discussed in the previous Section computes all these scores and the exact tests associated with them.
NESUG '90 Proceedings
342 Statistics
References
Agresti A, Wackerly D (1977). Some exact conditional tests of independence for r x c cross-classification tables. Psychometrika, 42:111-125.
Agresti A (1984). Analysis of ordinal categorical data. John Wiley, New York.
Agresti A, Yang M (1987). An empirical investigation of some effects of sparseness in contingency tables. Comm. Stat., 5:9-21.
Agresti A, Mehta CR, Patel NR. Exact Inference for Contingency Tables with Ordered Categories. JASA, 1990, 85, 410, 453- 458.
Conover WJ (1980). Practical Nonparametric Statistics, 2nd edition. John Wiley, New York.
EGRET User Manual (1989). Statistics and Epidemiology Research Corporation, Seattle, WA.
Epi Info Manual (1989). Centers for Disease Control, Atlanta, GA.
Feynman RP (1988). What Do You Care What Other People Think? W.W. Norton, New York.
Fisher RA (1935). The logic of inductive inference. J. Royal Stat. Soc. 98:39-82.
Gastwirth JL (1984). Combined tests of Significance in EEO cases. Industrial and Labor Relations Review 38(1).
Graubard BI, Korn EL (1987). Choice of column scores for testing independence in ordered 2 x K contingency tables. Biometrics 43:471-476.
Gupta PC, Mehta FR, Pindborg J (1980). Comm. Dent. and Oral Epid., 8:287-333.
Hollander M, Wolfe DA (1973). Nonparametric Statistical Methods. John Wiley, New York.
Lehmann EL (1975). Nonparametrics: Statistical Methods Based on Ranks.
NESUG '90 Proceedings
Statistics 343
Holden-Day, San Francisco.
Mantel N, Haenszel W (1959). Statistical aspects of the analysis of data from retrospective studies of disease. J Nat/ Cancer Inst 22:719-748.
Mehta CR, Patel NR (1983). A network algorithm for performing Fisher's exact test in r x c contingency tables. J. Amer. Stat. Assoc. 78(382):427-434.
Mehta CR, Patel NR, Tsiatis AA {1984). Exact significance testing to establish treatment equivalence for ordered categorical data. Biometrics
40:819-825.
Mehta CR, Patel NR, Gray R (1985). On computing an exact confidence interval for the common odds ratio in several 2 X 2 contingency tables. J. A mer. Stat. Assoc 80(392):969-973.
Mehta CR, Patel NR (1986). A hybrid algorithm for Fisher's exact test on unordered r x c contingency tables. Comm. Stat. 15(2):387-403.
Mehta CR, Patel NR (1986). FEXACT: A Fortran subroutine for Fisher's exact test on unordered r x c contingency tables. ACM Transactions on Mathematical Software 12(2):154-161.
Mehta CR, Patel NR, Senchaudhuri P (1988). Importance sampling for estimating exact probabilities in permutational inference. J. Amer. Stat. Assoc 83( 404):999-1005.
Pagano M, Halvorsen K (1981). An algorithm for finding exact significance levels of r X c contingency tables. J. A mer. Stat. Assoc., 76:931-934.
Patefield WM (1981). An efficient method of generating r x c tables with given row and column totals.( Algorithm AS 159). Applied Statistics 30:91-97.
Read RC, Cressie NA (1988). Goodness of fit statistics for discrete multivariate data. Springer-Verlag, New York.
SAS/Stat Guide for Personal Computers (1987). Version 6 edition. The SAS Institute, Cary, NC.
Siegel S, Castellan NJ (1988). Nonpammetric Statistics for the Behavioml
NESUG '90 Proceedings
344 Statistics
Sciences. Second edition, McGraw Hill, New York.
StatXact User Manual (1989). Cytel Software Corporation, Cambridge, MA.
Author Contact: Cytel Software Corporation
137 Erie Stteet
Cambridge MA 02139
(617) 661-2011
NESUG '90 Proceedings