Embed Size (px)
Citation preview

[ 121 ]
[ A N N E X I I I ] F I N A N C I A L A N A L Y S I S S U M M A R Y
EXALCO FINANCE P.L.C.FINANCIAL ANALYSIS SUMMARY
Prepared by
Rizzo, Farrugia & Co (Stockbrokers) Ltd31 July 2018

[ 122 ]
The Board of Directors Exalco Finance p.l.c.Cornerstone Business Centre,Level 4, 16th September Square, Mosta, MST 1180Malta
31 July 2018
Dear Sirs,
Exalco Finance p.l.c. – Financial Analysis Summary (the “FAS”)
In accordance with your instructions and in line with the requirements of the Listing Authority Policies, we have compiled the FAS set out on the following pages and which is being forwarded to you together with this letter. The purpose of the Analysis is that of summarising key information appertaining to Exalco Finance p.l.c. (the “Company” or “Issuer”) and Exalco Properties Limited (the “Guarantor”). The data is derived from various sources or is based on our own computations as follows:
a. Historical financial information sourced from the consolidated audited financial statements of Exalco Properties Limited for the years ended 31 December 2015 and 2016 (restated);
b. Historical financial information sourced from the audited financial statements of Exalco Properties Limited for the year ended 31 December 2017;
c. Projected data for financial years ending 31 December 2018 and 2019 as provided and approved by management of the Issuer and the Guarantor;
d. Commentary on the historical financial information and forecasts based on explanations from management and the financial due diligence report (FDDR) prepared by the reporting accountants of the Issuer (PricewaterhouseCoopers);
e. Ratios presented in the FAS have been computed by us applying the definitions as set out and defined within the FAS; and
f. Financial data in respect of the comparable set of bond issuers as analysed in section 12 has been extracted from public sources such as the web sites of the companies concerned or financial statements filed with the Registry of Companies.
The FAS is meant to assist potential investors by summarising the more important financial data of the Issuer and the Guarantor. The FAS does not contain all data that is relevant to potential investors and is meant to complement, and not replace, the contents of the full Prospectus. The FAS does not constitute an endorsement by our firm of the securities of the Issuer and should not be interpreted as a recommendation to invest. We shall not accept any liability for any loss or damage arising out of the use of the FAS and no representation or warranty is provided in respect of the reliability of the information contained in the FAS and/or the Prospectus. As with all investments, potential investors are encouraged to seek professional advice before investing.
Yours sincerely,
Vincent E RizzoDirector

[ 123 ]
T A B L E O F C O N T E N T S
1. Introduction 124
2. Governance & Management 124
3. History of the Guarantor 125
4. Group Structure 125
5. Major Assets 126
6. Recent Development 132
7. Future Developments 132
8. Material Agreements 132
9. Market Overview 133
10. Review of Financial Information - The Issuer 136
11. Review of Financial Information - The Guarantor 138
12. Comparables 147
Glossary & Definitions 149

[ 124 ]
1 INTRODUCTION
Exalco Finance plc (the “Issuer” or “Exalco Finance”) is a newly set-up company, incorporated on 17 July 2018 with company registration number C 87384, which acts as the financing vehicle of the Exalco Group (Exalco Holdings Limited (C 86836) and subsidiaries), the principal constituent of which is the Issuer’s sister company, Exalco Properties Limited (C 11273) (the “Guarantor” or “Exalco Properties”). Both Issuer and Guarantor share common ownership, through the said holding company Exalco Holdings Limited [as explained further in section 4 of this financial analysis summary (“FAS”)].
The FAS is being drawn up in terms of the Listing Policies issued by the Malta Financial Services Authority (“MFSA”) and in connection with a €15 million 4% secured bond issue 2028 (the “Bond Issue”).
2 GOVERNANCE & MANAGEMENT
2.1 THE ISSUER
The Issuer was set up on 17 July 2018 as a public limited liability company
ISSUER’S DIRECTORS & SENIOR MANAGEMENT
Being a public limited liability company listing securities on the Official List of the Malta Stock Exchange, Exalco Finance is bound by the Code of Corporate Governance (the “Code”). As such, its board of directors is composed of a mix of executive and non-executive directors in terms of the Code. The board is currently composed as follows:
Mr Alexander Montanaro Chairman of the Board, Executive Director
Mr Jean Marc Montanaro Executive Director
Mr Michael Montanaro Executive Director
Mr Mario Galea Non-Executive Director
Mr Lawrence Zammit Non-Executive Director
Mr Kevin Valenzia Non-Executive Director
The Issuer is a finance company and does not have employees of its own.
2.2 THE GUARANTOR
Set up in 1990, Exalco Properties was formerly known as Exalco Group Limited. It is the main operating company, whose activities comprise the acquisition, development, management and leasing of property in Malta. The current property portfolio of the Guarantor includes five properties, on lease to corporate clients on both short- and long-term leases. Further information on each of these properties is found in section 5 of this FAS.
GUARANTOR’S DIRECTORS & SENIOR MANAGEMENT
Mr Alexander Montanaro Chairman of the Board, Executive Director
Mr Jean Marc Montanaro Executive Director
Mr Michael Montanaro Executive Director

[ 125 ]
3 HISTORY OF THE GUARANTOR
Exalco Properties was established on 11 January 1990 and was previously known as Exalco Group Limited.
During its earlier years, the main business of the Exalco group was the international trade in non-ferrous metals through a related company of the Guarantor, Exalco (Metals and Steel) Limited (C 10397 – the company was struck off following the merger with the Guarantor), which started its operations back in 1987. This business, consisting of the supply of aluminium billets and other base metal products such as copper and steel commodities, was eventually transferred out into a separate company - Exalco Metals Limited (C 67788).
Exalco Group Limited branched into real estate in the 1990s through the acquisition of Parklane Business Centre in Hamrun, which was completed in 1999. Following that, the company undertook the development of the Mayfair Business Centre in St Julian’s (1999) and the Cornerstone Business Centre in Mosta (2006). Each property was owned in separate companies which were eventually amalgamated within either of Exalco Group Limited or Exalco (Property Leasing) Limited.
In 2005, Exalco (Property Leasing) Limited and Exalco (Metals and Steel) Limited were merged into the Guarantor. The next property acquired was the Marina Business Centre in Ta’ Xbiex in 2011. The latest development is the Golden Mile Business Centre in St Julian’s, which was completed in 2017.
Exalco Properties' business interest is now exclusively real estate, particularly business centres with lettable office space. Further information on the major (and non-major) assets of the Guarantor may be found in section 5 of this FAS.
4 GROUP STRUCTURE
EXALCO HOLDINGS LIMITED
EXALCO FINANCE PLC(The Issuer)
EXALCO PROPERTIES LIMITED(The Guarantor)
The Issuer and the Guarantor are sister companies, owned by Exalco Holdings Limited. The Issuer is a financing vehicle and its purpose is the raising of finance for the use and benefit of the Exalco group, of which the main operating entity is presently Guarantor. The majority of bond proceeds are to be on-lent to the Guarantor and as such the Issuer is dependent on the Guarantor.

[ 126 ]
5 MAJOR ASSETS
As at the date of this FAS, the Issuer has no major assets. Going forward, it is expected that the assets of the Issuer will comprise of receivables from the Guarantor, as the proceeds from the bond issue are on-lent to the Guarantor.
The property portfolio of the Guarantor comprises, primarily, of five business centres. Below is a summary of the key information pertaining to these and additional, smaller, properties.
Business Centre Location Title / Tenure Year of Acquisition/ Completion
No of Levels
NLA: Offices
NLA: Commercial
No. of Parking Spaces
Valuation€'000
Golden Mile Business
Centre
St Julian's Wholly owned 2017 7 2,880 0 25 19,433
Marina Business Centre Ta' Xbiex Wholly owned 2011 6 3,532 64 78 17,126
Mayfair Business Centre St Julian's Wholly owned 1999 7 836 1,620 12 8,345
Cornerstone Business
Centre
Mosta Wholly owned 2006 5 1,880 372 32 6,782
Parklane Business
Centre
Guardamangia,
Hamrun
Wholly owned 1999 4 695 250 6 1,769
Borton House Mosta Wholly owned 1990 3 200 0 2 355
Ibragg Maisonette Ibragg Wholly owned 2013 1 n/a n/a 1 435
Tilbury Garage Balzan Wholly owned 1997 n/a n/a n/a 1 12
Source: Management information

[ 127 ]
5.1 THE MAYFAIR BUSINESS CENTRE
Source: Management
Location: Triq Santu Wistin, St Julian’s
The Mayfair Business Centre (“Mayfair BC”) was completed in 1999 – the second business centre of the group. It hosts 836 square metres (“sqm”) of net lettable area of office space and 1,620 sqm of commercial lettable space spread across six levels above ground and two semi/basement floors. The property has 12 parking spaces. Mayfair BC is wholly owned by the Guarantor.
According to the latest valuation report prepared by Perit Stephen A. Mangion A&CE dated 15 June 2018 (the “Valuation Report”), the value of the property based on discounted future cash flows is of €8.3 million.
Mayfair BC is fully tenanted, with the anchor tenant being an English language school and a number of smaller tenants renting office space within the centre. The property is freehold.
[ 128 ]
5.2 THE MARINA BUSINESS CENTRE
Source: Management information
Location: Triq Abate Rigord, Ta’ Xbiex
The development of the Marina Business Centre (“Marina BC”) was completed in 2011. It lies on a corner site between two streets in Ta’ Xbiex and has net lettable area of 3,532 sqm. The property has six floors and hosts 78 parking spaces and is built on a footprint of 800sqm. The business centre is occupied by seven lessees, some of which occupy whole floors of the property.
According to the Valuation Report, the value of the property is of €17.1 million.
The property is freehold and is wholly owned by the Guarantor, except for the ground floor.

[ 129 ]
5.3 THE PARKLANE BUSINESS CENTRE
Source: Management
Location: Triq Mountbatten, Guardamangia, Hamrun
The Parklane Business Centre (“Parklane BC”) was constructed in 1992 and lies on a trapezoidal corner site between two streets. The footprint of the property is 290sqm. Parklane BC has five floors above ground and one semi-basement floor – the latter serves as a parking lot which can hold up to seven cars. The ground floor (250 sqm) is let to a retail outlet, while the remaining floors serve as office space for four tenants across total area of 695 sqm of lettable office space.
The value attributed to Parklane BC in the Valuation Report is that of €1.8 million.
The property is freehold.

[ 130 ]
5.4 THE CORNERSTONE BUSINESS CENTRE
Source: Management information
Location: Constitution Street, Mosta
The Cornerstone Business Centre (“Cornerstone BC”) sits on a rectangular corner plot having an area of 610sqm. The building has five floors above ground and two basement floors. The ground floor hosts a number of retail units, while the basement floors provide car parking facilities. The net lettable space for office space on the other floors within Cornerstone BC is 1,880sqm, which is leased out to a number of tenants, including the offices of the Exalco group companies.
The value attributed to the Cornerstone BC in the Valuation Report is €6.8 million. The property is freehold.

[ 131 ]
5.5 THE GOLDEN MILE BUSINESS CENTRE
Source: Management
Location: Dragonara Road, St. George’s Bay, St Julian’s
The Golden Mile Business Centre (“Golden Mile BC”) is the latest addition to the property portfolio of the Guarantor. The plot on which the building sits is of 750sqm. Lettable office space in the building is of 2,880sqm spread over seven floors. The building has one semi-basement floor which serves as a parking for up to 25 cars. The Golden Mile BC is leased out to one tenant who has renamed the building to reflect its commercial name. The property is freehold. The tenant has entered into a naming rights agreement with the Guarantor, giving the former the right to name the property ‘@GIG Beach’.
The Valuation Report attributes a value of €19.4 million to the Golden Mile BC.

[ 132 ]
5.6 OTHER PROPERTY ASSETS
The Guarantor has three other properties, two of which are for residential use. Borton House, MostaBorton House is a three-storey terraced premises in Mosta. Since its completion in 1990, the 200sqm building has been leased out for environmental studies and monitoring. The Borton House has an underlying garage at ground level with an area of 80sqm. The value of the Borton House is €0.36 million.The other two residential premises comprise a maisonette and an underlying garage in Ibragg and a garage in Balzan (known as Tilbury Garage). It is the intention of the Guarantor to transfer out these two properties (to ECTS Limited, a related company) and retain a property portfolio consisting solely of commercial properties. The value of these two properties is €0.45 million.
6 RECENT DEVELOPMENT
In pursuit of the objective to continue growing the Exalco brand and the respective commercial property portfolio, a related party of the Issuer and the Guarantor, ALMO Properties Limited (C 69554), entered into a promise of sale agreement dated 22 June 2018 for the acquisition of a six-floor complex bordered on three streets namely Triq il-Ferrovija, Triq Regjonali and Triq Blata l-Kahla, in Santa Venera (the “New Property”), for the price of €6.2 million. The acquisition is subject to the successful conclusion of the final deed of sale. Pursuant to the terms of the promise of sale agreement, the related party is vested with a right of assignment in favour of, inter alia, the Guarantor. The Board of Directors of the Issuer understands that such right of assignment is due to be exercised with a view to the Guarantor appearing on the final deed of sale for the acquisition of the New Property.
7 FUTURE DEVELOPMENTS
The growth of Exalco Properties over the years has been achieved through the acquisition and development of properties which contributed an adequate rate of return on the investment. In pursuit of this objective, management is constantly screening potential new projects / properties which would complement the existing property portfolio.
8 MATERIAL AGREEMENTS
The Issuer is a financing vehicle for the Group and the contracts it is expected to enter into are in respect of its lending function to the Group’s main operating company, that is the Guarantor. A loan agreement has been entered into by and between the Issuer (as lender) and the Guarantor (as borrower) on 20 July 2018 pursuant to which the Issuer will advance the net proceeds from the Bond Issue, amounting to approximately €14,700,000, to the Guarantor for the purposes of the latter deploying same in the manner specified in section 4.1 of the Securities Note, entitled “Reasons for the Bond Issue and Use of Proceeds”. Such loan agreement is conditional upon the issue and allotment of the Bonds, which in turn is conditional upon: the Bonds being admitted to the Official List; and the Collateral being constituted in favour of the Security Trustee in accordance with the provisions of the Security Trust Deed.
The Guarantor is party to a number of contracts which are considered to be material in the context of its operations, particularly those with tenants of the business centres. Furthermore, as described in section 6 of this FAS, the Guarantor may in the near future become party, by assignment, to a promise of sale agreement to acquire the New Property.

[ 133 ]
9 MARKET OVERVIEW
Note: The analysis below has been conducted by Rizzo, Farrugia & Co (Stockbrokers) Ltd. on information from publicly-available sources, including data from the National Statistics Office (NSO), Jobs Plus, the Eurostat and other information obtained from real estate agent websites which advertise commercial properties for rent.
The market for the rental of office and commercial space in Malta has grown substantially over the past couple of years. This was largely driven by the increase in employment levels1 , most notably, that of foreign workers. In the period between 2002 and 2005, employment levels remained relatively stable. Afterwards, employment levels grew steadily except for a marginal decline in 2009 because of the global financial crisis after which the growth rate in employment levels accelerated considerably.
The sound growth in employment levels can be attributed to two main factors, primarily, the solid growth rate of the local economy which in 2017 amounted to €11,109 million, an increase of €917 million or 9% when compared to 2016. In real terms, GDP went up by 6.6%2 . For the same period, the eurozone GDP increased by 2.5%3 , the highest growth rate since a 3% rise in 2007. Furthermore, the level of foreign direct investment over recent years lead to in an inflow of foreign workers. This is in general because Malta offers a number of business-friendly incentives and a favourable tax system, attracting substantial foreign direct investment to the island. By 2016, foreign workers exceeded 30,000 representing approximately 16.5% of total employed workers in Malta.
!
!
9 MARKET OVERVIEW
Note: The analysis below has been conducted by Rizzo, Farrugia & Co (Stockbrokers) Ltd. on information from publicly-available sources, including data from the National Statistics Office (NSO), Jobs Plus, the Eurostat and other information obtained from real estate agent websites which advertise commercial properties for rent.
The market for the rental of office and commercial space in Malta has grown substantially over the past couple of years. This
was largely driven by the increase in employment levels1, most notably, that of foreign workers. In the period between 2002
and 2005, employment levels remained relatively stable. Afterwards, employment levels grew steadily except for a marginal
decline in 2009 because of the global financial crisis after which the growth rate in employment levels accelerated
considerably.
The sound growth in employment levels can be attributed to two main factors, primarily, the solid growth rate of the local
economy which in 2017 amounted to €11,109 million, an increase of €917 million or 9% when compared to 2016. In real terms,
GDP went up by 6.6%2. For the same period, the eurozone GDP increased by 2.5%3, the highest growth rate since a 3% rise
in 2007. Furthermore, the level of foreign direct investment over recent years lead to in an inflow of foreign workers. This is
in general because Malta offers a number of business-friendly incentives and a favourable tax system, attracting substantial
foreign direct investment to the island. By 2016, foreign workers exceeded 30,000 representing approximately 16.5% of total
employed workers in Malta.
Source: Jobs Plus
The principal driver for demand of office and commercial space is associated to the number of individuals engaged in desk-
based employment. Over the period between 2014 and 2017, desk-based employment has grown from 33,312 to 46,763,
representing a CAGR of nearly 12%. Consequently, this lead to total desk-based workforce to account approximately 24.4%
of total workforce in 2017, a noteworthy increase over the 2014 figure of 20.3%. Moreover, this indicates that desk-based
employment is growing at a rate higher than other type of employments. Going forward, it is clear that Malta’s economy is
reliant on the growth and sustainability of desk-based sectors.
!!!!!!!!!!!!!!!!!!!!!!!!!!!!!!!!!!!!!!!!!!!!!!!!!!!!!!!!!!!!!1"All"figures"are"stated"for"full0time"employment"2"Source:"NSO"3"Source:"Eurostat"
3,514
3,350
3,617
4,726
6,132
7,484
9,262
8,712
9,529 10
,708
12,637
15,61
419,519
23,754
30,677
134,210
133,821
134,171133,959
134,330135,829
136,788
136,166138,285
140,101
141,409
143,658146,849
151,213
154,697
2 0 0 2 2 0 0 3 2 0 0 4 2 0 0 5 2 0 0 6 2 0 0 7 2 0 0 8 2 0 0 9 2 0 1 0 2 0 1 1 2 0 1 2 2 0 1 3 2 0 1 4 2 0 1 5 2 0 1 6
EMPLOYMENT!DATA! " MALTA
Total!Employed!Foreign!Nationals!" Full!Time Total!Maltese!Workers!" Full!Time
Source: Jobs Plus
1All figures are stated for full-time employment
2Source: NSO
3Source: Eurostat
[ 134 ]
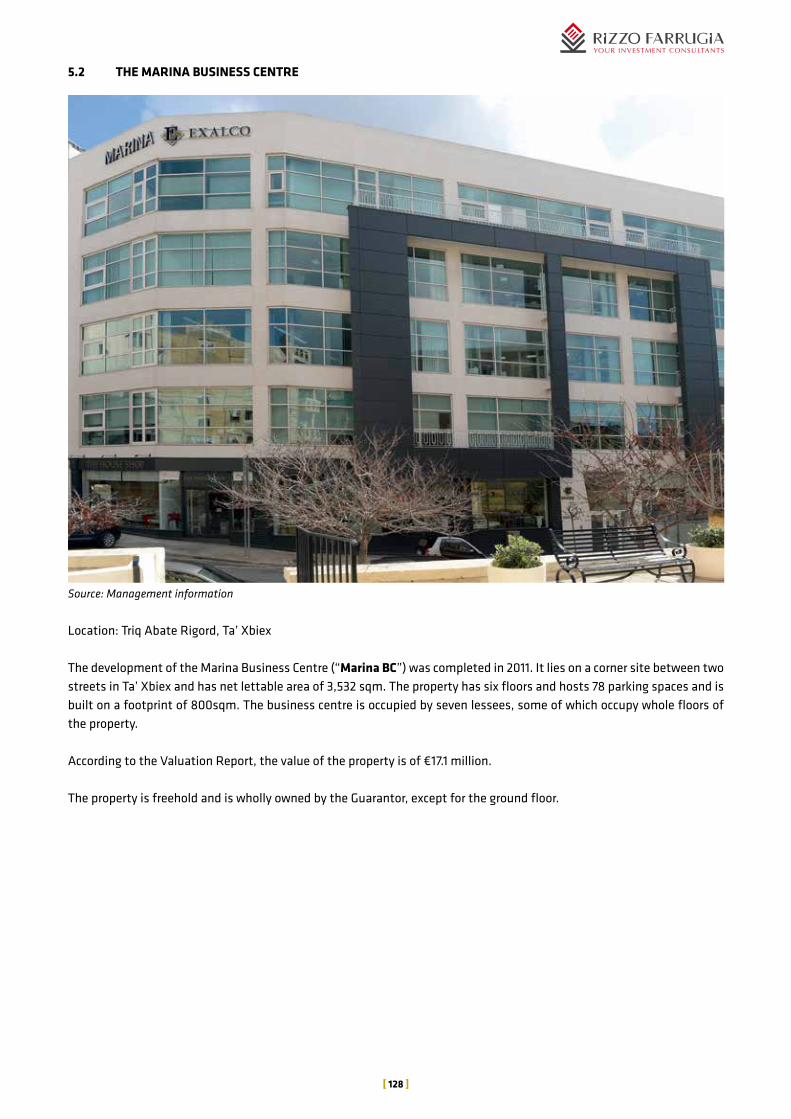
The principal driver for demand of office and commercial space is associated to the number of individuals engaged in desk-based employment. Over the period between 2014 and 2017, desk-based employment has grown from 33,312 to 46,763, representing a CAGR of nearly 12%. Consequently, this lead to total desk-based workforce to account approximately 24.4% of total workforce in 2017, a noteworthy increase over the 2014 figure of 20.3%. Moreover, this indicates that desk-based employment is growing at a rate higher than other type of employments. Going forward, it is clear that Malta’s economy is reliant on the growth and sustainability of desk-based sectors.
!
!
Source: NSO – Gainfully Occupied Population
As indicated overleaf, most of the employees working within desk-based industries are concentrated in financial services
activities, gaming and betting activities, employment activities, legal and accounting services, computer programming and
consultancy services, as well as office administration. Together, these account for nearly 68% of all desk-based employment
in Malta. The largest growth was reported in the gaming and betting activities sector as employment levels doubled from
3,192 in 2014 to 6,398 in 2017. Subsequently, in nominal terms, the employment activities sector, the management
consultancy activities and legal and accounting activities were the key contributors in growth adding 1,642, 1,292 and 1,070
respectively.
20 3
22 1
23 4
24 4
79 7
77 9
76 6
75 6
2 0 1 4
2 0 1 5
2 0 1 6
2 0 1 7
2014! " 2017 ! " DE " A ED WO FO E A A !OF TOTALWO FO E, ! E L !P L ADM N T AT ON
Desk! ased! ork ori e!as!a! !o !total! ork or e est!o ! ork or e!as!a! !o !total! ork or e
Source: NSO – Gainfully Occupied Population
As indicated overleaf, most of the employees working within desk-based industries are concentrated in financial services activities, gaming and betting activities, employment activities, legal and accounting services, computer programming and consultancy services, as well as office administration. Together, these account for nearly 68% of all desk-based employment in Malta. The largest growth was reported in the gaming and betting activities sector as employment levels doubled from 3,192 in 2014 to 6,398 in 2017. Subsequently, in nominal terms, the employment activities sector, the management consultancy activities and legal and accounting activities were the key contributors in growth adding 1,642, 1,292 and 1,070 respectively.
Source: NSO – Gainfully Occupied Population
!
!
Source: NSO – Gainfully Occupied Population
0.1%
1.6%
1.7%
1.9%
1.9%
2.6%
2.8%
3.5%
3.6%
3.9%
4.0%
4.6%
7.2%
7.3%
7.9%
8.3%
8.9%
13.7%
14.5%
Scientific!research!and!development
Other!professional,!scientific!and!technical!activities
Information!service!activities
Civil!engineering
Insurance,!reinsurance!and!pension!funding,!except!compulsory!social!security
Travel!agency,!tour!operator!and!other!reservation!service!and!related!activities
Rental!and!leasing!activities
Real!estate!activities
Telecommunications
Advertising!and!market!research
Activities!!auxiliary!to!financial!services!and!insurance!activities
Architectural!and!engineering!activities;!technical!testing!and!analysis
Office!administrative,!office!support!and!other!business!support!activities
Activities!of!head!offices;!management!consultancy!activities
Computer!programming,!consultancy!and!related!activities
Legal!and!accounting!activities
Employment!activities
Gambling!and!betting!activities
Financial!service!activities,!except!insurance!and!pension!funding
W O R K F O R C E ! W I T H I N ! D E S KV B A S E D ! E M P LOY M E N T, ! E XC L . ! P U B L I C ! A D M I N I S T R AT I O N ! ( 2 0 1 7 )

[ 135 ]
To accommodate the growing demand, there has been an increase in the supply of office and commercial space in Malta. In fact, several business centres have recently been complete and are currently fully operational. A few of these include The Centre at Tigné Point, Aragon House in St. Julians, The Golden Mile BC in St. Julians, and SkyParks in Luqa. Other major developments that will feature substantial office and commercial space currently in progress include Pendergardens in St. Julians, Mercury House in Paceville, and The Quad and Trident Park both in Mriehel.
The supply for office space is highest in four main areas around Malta. The table below presents the range of pricing in € per sqm yearly for each segment. Data for pricing of office space available has been obtained from various real estate agents websites as at mid-2018.
Area € per sqm yearlyCentral areas such as Birkirkara, Mriehel & Naxxar 120 - 200North East such as Ta Xbiex, Sliema & St Julians 220 - 500Harbour Area such as Valletta, Msida & Floriana 175 - 400West & South such as Qormi, Luqa & Gudja 120 - 150
As outlined above, the higher rentals are generally found in the North East Area, which rates vary from €220/sqm up to €500/sqm. On the other hand, office rents tend to be lowest in the West & South Areas, which rates vary between €120/sqm to €150/sqm. The variance in pricing is attributable to the characteristics of the building primarily location but also functional efficiency, technology, size and proximity and surrounding infrastructure.

[ 136 ]
10. REVIEW OF FINANCIAL INFORMATION - THE ISSUER
The Issuer was registered on 17 July 2018, and as such, does not have any historic audited financial information. Furthermore, the Issuer is not intended to undertake any trading activities itself apart from the raising of capital and the advancing thereof to the Guarantor and is therefore economically dependent on the financial and operational performance of the business of the Guarantor.
The financial statements presented for the Issuer in this section reflect the projections for the years ended 31 December 2018 and 31 December 2019 (“FY2018” and “FY2019”).
10.1 INCOME STATEMENT
as at 31 December
Projected
2018
€000's
Projected
2019
€000's
Interest on loans to fellow companies 251 602
Facility fee 63 127
Finance Income 314 729
Finance cost (250) (600)
Net Finance Cost 64 129
Amortisation of bond issuance costs (15) (30)
Directors' fees (23) (46)
Listing and related fees (17) (34)
Other (5) (10)
Profit before tax 4 9
Taxation (1) (3)
Profit for the Year 3 6
Source: Management information
Income streams are expected to be interest income and the facility fee chargeable to the Guarantor, as the ultimate beneficiary of the funds raised by the Issuer. A margin over the coupon of the Bond Issue and the facility fee charged are intended to cover the Issuer’s fees, which include directors’ fees, listing fees, bond amortisation costs and other administrative expenses. By the end of FY2018 and FY2019, the Issuer is expected to register a profit for the year of approximately €3,000 and €6,000 respectively.

[ 137 ]
10.2 STATEMENT OF FINANCIAL POSITION
as at 31 December
Projected
2018
€000's
Projected
2019
€000's
Assets
Non-Current Assets
Loans & receivables 14,700 14,700
Current Assets
Cash & cash equivalents 519 557
Total Assets 15,219 15,257
Equity & Liabilities
Equity
Share Capital 250 250
Retained Earnings 3 9
Total Equity 253 259
Non-Current Liabilities
Amortised bond issue 14,715 14,745
Current Liabilities
Accrued bond interest 250 250
Current tax 1 3
Total Liabilities 14,966 14,998
Total Equity & Liabilities 15,219 15,257
Source: Management information
The balance sheet structure of the Issuer will be reflective of its objectives as a financing arm for the Guarantor. By the end of FY2018, the Issuer’s total assets are expected to amount to €15.2 million, comprising of the loan to Exalco Properties of €14.7 million and a €0.5 million cash balance. Liabilities include the amortised bond issue of €14.7 million and accrued interest on the bond of €0.25 million, while equity consists of €0.25 million in share capital and retained earnings for the year.
The company does not expect any material changes in the balance sheet for FY2019.
10.3 CASH FLOW STATEMENT
as at 31 December
Projected
2018
€000's
Projected
2019
€000's
Cash flows from operating activities 269 38
Cash flows used in investing activities (14,700) -
Cash flow from financing activities 14,950 -
Net movements in cash & cash equivalents
519 38
Opening cash & cash equivalents - 519
Closing cash & cash equivalents 519 557
Source: Management information
The cash flow from operating activities of the Issuer will comprise facility fees and interest received from the Guarantor, which for FY2018 is expected to be in the region of €0.27 million and €0.04 million in FY2019, reflecting the full year coupon payable. Cash flows used in investing activities reflect the loan advanced to the Guarantor, while the cash flow from financing activities represent the share capital upon incorporation and the bond issue proceeds, net of bond issue costs.

[ 138 ]
11 REVIEW OF FINANCIAL INFORMATION - THE GUARANTOR
The Guarantor has been in existence since 1990. The property segment has not always been the sole trading activity of the Guarantor, and as such, ahead of the Bond Issue, restructuring processes have taken place to extract any non-property related business out of the Guarantor. To this effect, the financial statements of the Guarantor are being presented hereunder in a manner that makes the financial statements of previous years comparable to those of FY2017 (and beyond) by presenting items related to other business interests as extraordinary items or discontinued operations, where and as necessary.
The historical financial figures for the years ended 31 December 2015, 2016 and 2017 have been sourced as follows: i. The consolidated financial statements of the Guarantor for the years ended 31 December 2015 and 2016 (restated -
The 2016 financial statements of Exalco Properties were restated to include accumulated depreciation of €0.5 million on the buildings of the properties held by the Guarantor, which was not being accounted for in prior years, and €0.4 million relating to revaluation gains, previously credited to retained earnings instead of the revaluation reserve);
ii. The audited financial statements of the Guarantor for the year ended 31 December 2017; andiii. The Guarantor reports under GAPSME, which is an accounting standard applicable for small-and-medium sized entities
in Malta, which standard does not require the publication of a cash flow statement. As such, for the purposes of the prospectus and this FAS, cash flows statements for FY2016 and FY2017 have been produced accordingly by management.
Whereas, items (i) to (iii) will hereinafter collectively be referred to as “Historical Financial Information”.
Projections for the years ended 31 December 2018 and 2019 (the “Management Projections”) have been provided by management. Given it is the objective of the Guarantor to continue expanding its property portfolio, a new project is assumed to be undertaken during FY2019 (the “Assumed Project”). The Assumed Project is a proxy to the various investment proposals that the Guarantor is frequently being presented with and in line with the parameters that management feel would complement and work in terms of yield on the investment.
Financial information presented hereunder may be subject to rounding differences.
11.1 THE INCOME STATEMENT
for the year ended 31 December Audited
2015€000's
Audited (restated)
2016€000's
Audited 2017
€000's
Projected 2018
€000's
ProjectedFY2019€000's
Property Leasing 1,674 1,769 2,174 3,070 3,542
Net property management income 96 94 149 177 198
Net revenue from property leasing activities
1,770 1,863 2,323 3,247 3,740
Other net (costs)/income from property leasing activities
(32) (27) 18 12 12
Selling, general and administrative costs
(218) (210) (292) (307) (304)
Normalised EBITDA 1,520 1,626 2,049 2,952 3,448
Depreciation (50) (83) (204) (190) (235)
Normalised EBIT 1,470 1,543 1,845 2,762 3,213
Net finance expenses (542) (509) (538) (646) (960)
Normalised profit before tax 928 1,034 1,307 2,116 2,253
Extraordinary expenses (182) (131) (102) - -
Profits attributable to legacy metals business
36 24 - - -
Profits attributable to ECTS operations 33 33 - - -
Income attributable to property held by ECTS
42 42 46 - -
Profit before tax 857 1,002 1,251 2,116 2,253
Current taxation (268) (295) (333) (471) (542)
Profit for the year 589 707 918 1,645 1,711
Source: Historical Financial Information and Management Projections

[ 139 ]
The results for the period between FY2015 and FY2017 were adjusted to single-out the results relating to discontinued operations in connection with the legacy metals business, ECTS Limited (as this was transferred from the Guarantor in 2017) and income from property owned by ECTS.
REVENUE ANALYSISThe Group’s revenue generating segments are two:• Property leasing• Property management
The Group’s total revenue reached €2.32 million in FY2017, up from €1.86 million and €1.77 million in FY2016 and FY2015, respectively. The property leasing segment is the largest contributor to the Group’s revenue exceeding 90% of total revenue. In the last financial year, the Group registered growth across both principal business segments. The property management segment grew by 59% to €149,000 while the property leasing segment grew by 23% to €2.17 million, as the revenue streams from the Golden Mile BC started being recognised.
PROPERTY LEASING
!
!
Revenue Analysis
The Group’s revenue generating segments are two:
•! Property leasing
•! Property management
The Group’s total revenue reached €2.32 million in FY2017, up from €1.86 million and €1.77 million in FY2016 and FY2015,
respectively. The property leasing segment is the largest contributor to the Group’s revenue exceeding 90% of total revenue.
In the last financial year, the Group registered growth across both principal business segments. The property management
segment grew by 59% to €149,000 while the property leasing segment grew by 23% to €2.17 million, as the revenue streams
from the Golden Mile BC started being recognised.
Property Leasing
Source: Historic Financial Information and Management Projections
This segment is represented by the leasing of the five business centres in Malta entirely owned by the Group. A detailed
description of the property portfolio of the Guarantor can be found in section 5. The latest addition in the property portfolio of
the Group is the Golden Mile Business Centre which started operating in the last quarter of 2017. Therefore, the income
generated in 2017 includes only four months of income generated from the Golden Mile Business Centre.
The business centres provide a total net lettable area of circa 12,300 sqm, of which circa 2,300 sqm is commercial space. The
business centres are leased out to corporate clients on both short and long-term leases. The lease agreements in place between
the Guarantor and its tenants provide an initial definite term of rent and are subject for annual increments ranging between
2% and 3% of the rent payable in the previous year. Certain lease agreements also cater for the automatic renewal of the lease,
for a period ranging from one to three years. Additionally, all the rental agreements provide the option for the termination of
the lease agreement by the lessee by giving a written notice a few months before the expiration of the lease term (between 3
to 12 months), either during the original or the renewed term.
€1,674 €1,769€2,174
€3,070€3,542
€96€94
€149
€177
€198
.
500!
1,000!
1,500!
2,000!
2,500!
3,000!
3,500!
4,000!
2015!(A) 2016!(A) 2017!(A) 2018!(P) 2019!(P)!
REVENUE!GENERATION!BY!SEGMENT
Property!Leasing! Property!management!
Source: Historical Financial Information and Management Projections
This segment is represented by the leasing of the five business centres in Malta entirely owned by the Group. A detailed description of the property portfolio of the Guarantor can be found in section 5. The latest addition in the property portfolio of the Group is the Golden Mile Business Centre which started operating in the last quarter of 2017. Therefore, the income generated in 2017 includes only four months of income generated from the Golden Mile Business Centre.
The business centres provide a total net lettable area of circa 12,300 sqm, of which circa 2,300 sqm is commercial space. The business centres are leased out to corporate clients on both short and long-term leases. The lease agreements in place between the Guarantor and its tenants provide an initial definite term of rent and are subject for annual increments ranging between 2% and 3% of the rent payable in the previous year. Certain lease agreements also cater for the automatic renewal of the lease, for a period ranging from one to three years. Additionally, all the rental agreements provide the option for the termination of the lease agreement by the lessee by giving a written notice a few months before the expiration of the lease term (between 3 to 12 months), either during the original or the renewed term.
€'00
0

[ 140 ]
!
!
Source: Management Information
Adjusting the Golden Mile rental income to a full year equivalent, the contribution from Golden Mile is expected to reach 37%,
followed by Marina Business Centre at 31% in FY2018.
The Guarantor’s tenants are various, however, there is a noticeable concentration on the gaming industry (approximately 56%
of total income forecast in FY2018), which is reflective of the current demand for office space in Malta. Furthermore, as the
Golden Mile BC is currently fully occupied by one large gaming company and given also that this business centre represents
nearly 37% of total revenue (based on FY2018 forecast), such concentration is understandable.
Property Management
This segment complements the rental property segment, as it maintains the business centres on behalf of its tenants. Services
provided by Exalco include common area management, general repairs and maintenance, and in-house maid services. The
company generated revenue of €149,000 from these services in 2017.
Other Components of the Income Statement
EBITDA, being the operating profit adjusted for depreciation, amortisation and before charging tax and interest expenses,
amounted to €2.05 million in FY2017, an increase of 26% over the previous year and an improvement of 34.8% over that of
FY2015. This mainly reflects the contribution of the newly operating Golden Mile Business Centre during the last quarter of
FY2017, as well as, the annual increase in lease payments of the other business centres. EBITDA margin stood at 88.2% in
FY2017 reflecting the business model of the Group which necessitates very little human capital and working capital to sustain
the business.
Depreciation increased from €50,000 in FY2015, to €83,000 in FY2016 to €204,000 in FY2017 mainly due to a substantial
investment in the Golden Mile Business Centre during the year. Accordingly, operating profit amounted to €1.85 million in
FY2017, from €1.54 million the previous year (FY2015: €1.47 million).
15 91
40 51
19 59
16 92 6 021 06
ontri tion!o !renta !In ome!in! !terms!per!B siness! entre!. 2017
Go en!Mi e!B siness! entre!
Marina!B siness! entre!
May air!B siness! entre!
ornerstone!B siness! entre!
Par ane!B siness! entre!
Borton! o se!
Source: Management Information
Adjusting the Golden Mile rental income to a full year equivalent, the contribution from Golden Mile is expected to reach 37%, followed by Marina Business Centre at 31% in FY2018.
The Guarantor’s tenants are various, however, there is a noticeable concentration on the gaming industry (approximately 56% of total income forecast in FY2018), which is reflective of the current demand for office space in Malta. Furthermore, as the Golden Mile BC is currently fully occupied by one large gaming company and given also that this business centre represents nearly 37% of total revenue (based on FY2018 forecast), such concentration is all the more visible.
PROPERTY MANAGEMENTThis segment complements the rental property segment, as it maintains the business centres on behalf of its tenants. Services provided by Exalco include common area management, general repairs and maintenance, and in-house maid services. The company generated revenue of €149,000 from these services in 2017.
OTHER COMPONENTS OF THE INCOME STATEMENT
EBITDA, being the operating profit adjusted for depreciation, amortisation and before charging tax and interest expenses, amounted to €2.05 million in FY2017, an increase of 26% over the previous year and an improvement of 34.8% over that of FY2015. This mainly reflects the contribution of the newly operating Golden Mile Business Centre during the last quarter of FY2017, as well as, the annual increase in lease payments of the other business centres. EBITDA margin stood at 88.2% in FY2017 reflecting the business model of the Group which necessitates very little human capital and working capital to sustain the business.
Depreciation increased from €50,000 in FY2015, to €83,000 in FY2016 to €204,000 in FY2017 mainly due to a substantial investment in the Golden Mile Business Centre during the year. Accordingly, operating profit amounted to €1.85 million in FY2017, from €1.54 million the previous year (FY2015: €1.47 million).
Net finance costs remained relatively stable throughout the last three-year period averaging €0.5 million per annum. However, because of the improvement in operating income, interest coverage increased from 2.7x in FY2015 to 3.4x in FY2017.
The company incurred extraordinary expenses during each of the years presented:• In FY2015, the €182,000 relate to a one-off repair and maintenance expense incurred on the various business centres
operated by Exalco Properties at that time.• In FY2016, the €131,000 expense is associated with professional expenses incurred in the development of the Golden
Mile Business Centre which were not capitalised.• In FY2017, the €102,000 is a result of a one-off expense related to a number of works on the public alley adjacent to the
Golden Mile Business Centre.

[ 141 ]
The main expenses of the Guarantor consist of payroll charges which increased over the period covered herein to reflect the time and effort of management and its staff in relation to the management of the property portfolio.
DISCONTINUED OPERATIONSThe metals operation of Exalco Properties was transferred from the company to Exalco Metals in January 2016. Accordingly, the FY2016 results include the income generated from the sale of leftover stock. The Guarantor registered a profit before tax of €23,000 during FY2016, primarily because of foreign exchange differences recognised during the year.
The ECTS operations generated profit before tax of €33,000 in both FY2016 and FY2015. Additionally, over the last three years the Guarantor received rental income in relation to a property located in Attard which amounted to approximately €42,000 per annum, which property is owned by ECTS Limited. In FY2018, the lease agreement will be amended to reflect a change in lessor (that from Exalco Properties to ECTS). Thus, ECTS will receive any future income associated to the property.
PROJECTIONS - FY2018The projections for FY2018 show that the company is anticipating an increase in profitability as profit for the year is expected to reach €1.65 million, representing an increase of 80% over FY2017. As intimated earlier in this section, such increase mainly reflects the contribution of the newly operating Golden Mile Business Centre for the whole year (unlike FY2017 which was only reflective of the last quarter contribution), as well as, the annual increase in lease payments. Revenue is expected to reach €3.25 million, of which, 94.6% is attributable to the property rental segment. The remaining 5.4% of revenue is related with the property management segment.
As described in section 5.6 of this FAS, the New Property to be acquired during FY2018 is expected to contribute additional EBITDA of €59,000, reflecting the fact that the Guarantor is expected to take over the property in October of this year.
Other components of the Group’s income statement of FY2018 are not expected to be materially different from FY2017, save for finance costs which are expected to be higher (+20%) as they reflect the additional borrowings of the Bond Issue and the new borrowings necessary for the New Property.
PROJECTIONS - FY2019The forecasts of FY2019 assume that the Guarantor will develop and finish the New Property, with revenue streams from the additional lettable area within the New Property expected to come on board as from the second quarter of 2019.
With this in mind, and taking into account the full occupancy of the other business centres, revenue in FY2019 is expected to reach €3.74 million, an increase of 15.2% over FY2018 reflecting the full year rental income on the New Property in addition to the increase in lease payments. Consequently, EBITDA is expected to also increase to €3.5 million, representing an improvement in the EBITDA margin to 92.2% from 90.9% assumed in FY2018.
Net finance costs are expected to increase to €0.96 million in FY2019 from €0.65 million in FY2018, reflecting the full year interest on the €15 million bond, the additional bank borrowings of €6.4 million for the New Property and new bank borrowings for the Assumed Project. After deducting tax, profit for the year is expected to be marginally higher at €1.7 million.

[ 142 ]
for the year ended 31 December Audited
2015€000's
Audited (restated)
2016€000's
Audited 2017
€000's
Projected 2018
€000's
Projected2019
€000's
Assets
Non-Current Assets
Property, plant and equipment 135 128 456 448 445
Investment property 32,768 32,834 53,716 60,752 65,144
investment property (ECTS) 1,978 1,978 - - -
Total Non-Current Assets 34,881 34,940 54,172 61,200 65,589
Current Assets
Inventories (Exalco Metals) 85 - - - -
Trade and other receivables 616 315 1,000 847 886
Cash and cash equivalents (continuing operations) 599 682 213 3,442 3,029
Cash and cash equivalents (ECTS) 306 15 - - -
Total Current Assets 1,606 1,012 1,213 4,288 3,915
Total Assets 36,487 35,952 55,385 65,489 69,504
Equity & Liabilities
Equity
Share Capital 2,400 2,840 2,840 2,840 2,840
Revaluation & other Reserves 14,968 15,352 30,270 30,270 30,270
Retained Earnings 3,985 3,778 2,358 3,754 5,465
Total Equity 21,353 21,970 35,468 36,864 38,575
Non-Current Liabilities
Deferred tax liabilities 1,918 1,534 4,651 4,651 4,651
Non-current trade and other payables 40 14 - - -
Shareholders' loan 204 168 583 - -
Security Deposits - - 552 618 719
Borrowings for continuing operations 9,509 8,415 10,026 6,308 7,930
Amounts due to fellow subsidiaries - - - 14,700 14,700
Borrowings for discontinued operations 294 295 - - -
Total Non-current liabilities 11,965 10,426 15,812 26,277 28,000
Current Liabilities
Trade and other payables 866 1,395 2,032 1,646 1,855
Net Trade payables (ECTS) 284 - - - -
Deposits received from clients 341 420 114 139 155
Borrowings 1,068 1,457 1,398 92 378
Bank overdraft (Exalco Metals) 511 34 263 - -
Current tax liabilities 99 250 298 471 542
Total Current Liabilities 3,169 3,556 4,105 2,348 2,930
Total Liabilities 15,134 13,982 19,917 28,625 30,929
Total Equity & Liabilities 36,487 35,952 55,385 65,489 69,504
Source: Historical Financial Information and Management Projections
[ 143 ]
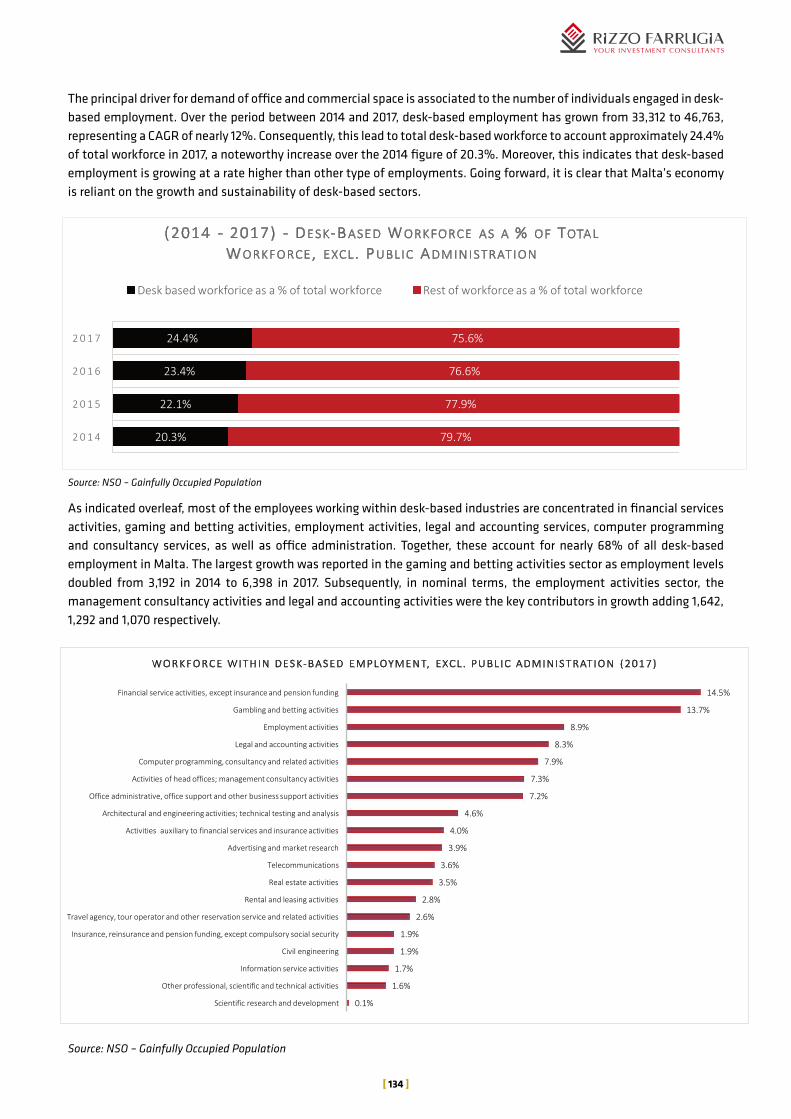
REVIEW OF FY2015 – FY2017The Guarantor’s asset base as of the end of FY2017 was mostly composed of Investment property, which accounts to nearly 97% of total assets. A breakdown of the portfolio of investment property is presented in a previous section of this FAS. On the liabilities side, the major components are bank debt and deferred taxes which account to 58.7% and 23.4% of total liabilities respectively.
The Statement of Financial Position as at 31 December 2017 compared to the figures as at 31 December 2016 and 2015, reveals that total assets increased by 51.8% to €55.4 million since the end of FY2015 (FY2015: €36.5 million; FY2016: €36.0 million) largely reflecting the increase in value of investment property. The increase of €20.9 million in the carrying amount of investment property from FY2016 to FY2017 mainly reflects a fair value gain of €18.0 million, the capitalisation of €2.5 million of expenditure with respect to development of Golden Mile and an increase of €0.4 million as a result of the reclassification of property, plant and equipment to investment property.
Meanwhile, the Guarantor’s total liabilities increased by 31.6% to €19.9 million over the years (FY2015: €15.1 million; FY2016: €14.0 million). The notable increase between FY2016 and FY2017 (+€5.9 million) reflects in the main the increase of €3.1 million in deferred tax liabilities as a result of the fair value gains in investment property arising during the year, and €1.5 million in additional borrowings.
Borrowing Analysisas at 31 December
Audited 2015
€000's
Audited (restated)
2016€000's
Audited 2017
€000's
Projected 2018
€000's
Projected2019
€000's
Borrowings for continuing operations 10,577 9,872 11,424 21,100 23,008
Less: Net Cash and cash equivalents 599 682 213 3,442 3,029
Net Funding - Continuing operations 9,978 9,190 11,211 17,658 19,979
Borrowings for discontinued operations 805 329 263 - -
Less: Cash and cash equivalents (ECTS) 306 15 - - -
Net Funding - Discontinued operations 499 314 263 - -
Total net borrowings 10,477 9,504 11,474 17,658 19,979
Source: Historical Financial Information and Management Projections
PROJECTIONS - FY2018As at the end of FY2018, the Guarantor’s total asset base is expected to increase to €65.5 million, reflecting the carrying value of the New Property and positive cash balances. The New Property is expected to be financed through the application of funds from the Bond Issue (to the tune of €1 million) and new bank borrowings. The Bond Issue and the additional bank borrowings will result in total borrowings of €21.1 million. The increase in total equity expected in FY2018 reflects the retained earnings for the year net of the repayment of a shareholders’ loan.
PROJECTIONS - FY2019The projections for FY2019 assume that the Guarantor will undertake the Assumed Project. As such, in FY2019, investment property is expected to increase by €4.4 million reflecting its value. The development of the Assumed Project is expected to be financed by an additional €2 million bank borrowings and cash generated from operations. Consequently, total borrowing is expected to increase to €23 million in FY2019.

[ 144 ]
11.3 STATEMENT OF CASH FLOWS
as at 31 December Audited
2015€000's
Mgmt. Info.2016
€000's
Mgmt. Info. 2017
€000's
Projected 2018
€000's
Projected2019
€000's
Net Cash flow from operating activities 211 1,622 1,322 2,235 3,231
Net cash flow used in investing activities (869) (614) (3,407) (7,573) (4,525)
Net cash flow from / (used in) financing activities 1,882 (1,216) 1,601 8,567 881
Net movement in cash & cash equivalents 1,224 (208) (484) 3,229 (413)
Opening cash & cash equivalents (319) 905 697 213 3,442
Closing cash & cash equivalents 905 697 213 3,442 3,029
Bank overdraft balance (1,074) (618) (734) - -
Net cash & cash equivalents at end of year (169) 79 (521) 3,442 3,029
Source: Historical Financial Information and Management Projections
REVIEW OF FY2015 – FY2017Over the three-year period to 31 December 2017, the Guarantor generated cash flows of €0.5 million. Net of the bank overdraft facilities, the company closed FY2017 with a negative cash balance of €0.52 million. This was the result of the substantial cash flows used by the Guarantor in its investing activities related in the main to the works of the Golden Mile project. Such cash flows were supported by increased bank borrowings throughout the years.
PROJECTIONS - FY2018The projected cash flow statement for FY2018 will feature an increase in cash flow from operating activities which is expected to increase to €2.2 million, reflecting primarily the full year contribution of the Golden Mile Business Centre rental income; a net cash outflow of €7.6 million, which in the main relates to the New Property being acquired and the supporting cash inflow of €8.6 million, which is the net effect of the cash from the bond issue less repayments of bank borrowings, and the new additional borrowings in relation to the New Property.
PROJECTIONS - FY2019Net operating cash flows in FY2019 are expected to be €1 million over those generated during the previous year, mainly reflecting the full year contribution of the New Property and the yearly rental rate increments. Moreover, cash used in investing activities in FY2019 is expected to be €4.5 million and is in relation to the additional financing for the works to complete the New Property and funds used for the purchase of the Assumed Project. Net cash flows from financing activities are expected to amount to €0.9 million reflecting the additional bank borrowings for the year.

[ 145 ]
11.4 RATIO ANALYSIS
PROFITABILITY RATIOSThe below is a set of ratios prepared to assist in measuring the company’s earnings potential from its property portfolio.
Audited FY2015
Audited (restated)
FY2016Audited FY2017
Projected FY2018
ProjectedFY2019
EBITDA Margin 85.9% 87.3% 88.2% 90.9% 92.2%
(EBITDA / Revenue)
Operating profit Margin (EBIT Margin) 83.1% 82.8% 79.4% 85.1% 85.9%
(Operating Profit / Revenue)
Net Profit Margin 48.4% 53.8% 53.9% 65.2% 60.2%
(Net Profit / Revenue)
Return on Average Equity 2.8% 3.3% 3.2% 4.6% 4.5%
(Net Profit / Average Equity)
Return on Average Assets 1.6% 2.00% 2.00% 2.7% 2.5%
(Net Profit / Average Assets)
Source: Calculations based on Historical Financial Information and Management Projections
The Guarantor’s margins reflect the lean cost structure of its business model. Margins have generally improved over the years between FY2015 to FY2017 and are expected to continue to improve further through improved cost efficiencies and the full-year recognition of income from the Golden Mile and Phoenix Building in FY2018 and FY2019 respectively.
LIQUIDITY RATIOSThe below is a set of ratios prepared to assist in measuring a Company’s ability to meet its short-term obligations.
Audited FY2015€000's
Audited (restated)
FY2016€000's
Audited FY2017€000's
Projected FY2018€000's
ProjectedFY2019€000's
Current Ratio 0.51x 0.28x 0.30x 1.83x 1.34x
(Current Assets / Current Liabilities)
Cash Ratio 0.19x 0.19x 0.05x 1.47x 1.03x
(Cash & Equivalents* / Current Liabilities)
* For comparative reasons, the cash and equivalents taken for this ratio exclude the cash attributable to the discontinued operations of ECTS.
Source: Calculations based on Historical Financial Information and Management Projections
The Guarantor’s liquidity ratios are reflective of the fact that the Guarantor receives rental income in advance from its tenants, which inflates its current liabilities. Furthermore, as the existing bank loans are extinguished through the Bond Issue and income from the Golden Mile Business Centre and the New Property is received, the Guarantor’s cash management is expected to improve. Furthermore, the extent of the Guarantor’s debt servicing commitments will also help in improving the cash ratio, as the company will no longer need to service capital repayments of the existing bank borrowings which will be replaced by the servicing of the interest on the Bond Issue.

[ 146 ]
SOLVENCY RATIOSThe below is a set of ratios prepared to assist in measuring a Company’s ability to meet its debt obligations.
Audited FY2015€000's
Audited (restated)
FY2016€000's
Audited FY2017€000's
Projected FY2018€000's
ProjectedFY2019€000's
Interest Coverage Ratio 2.71x 3.03x 3.43x 4.28x 3.35x
(EBIT / Net Finance Costs)
Gearing Ratio (1) 0.49x 0.43x 0.32x 0.48x 0.52x
(Net Borrowings / Equity)
Gearing Ratio (2) 34.8% 31.7% 24.8% 36.4% 37.4%
(Total Borrowings / [Total Borrowings + Equity])
Gearing Ratio (3) 32.9% 30.2% 24.4% 32.4% 34.1%
(Net Borrowings / [Net Borrowings + Equity])
Source: Calculations based on Historical Financial Information and Management Projections
The Guarantor had a healthy interest cover over the years, reflective of the strong income margins as discussed earlier on in this FAS. Going forward, this is expected to remain stable as net finance costs are expected to increase in line with EBITDA in percentage terms, however, in nominal terms, the increase in EBITDA is greater than the increase in net finance costs.
Leverage is below 50% at Guarantor level. Gearing is expected to remain manageable despite additional borrowings that are expected to be availed of later this year.

[ 147 ]
12 COMPARABLESThe table below compares the Issuer and its proposed bond issue to other listed debt on the local market having broadly similar maturities. The list excludes issues by financial institutions. The comparative set includes local groups whose assets, strategy and level of operations may vary significantly from those of the Issuer and are therefore not directly comparable. Nevertheless, the table below provides a sample of some comparatives:
Bond Details Outstanding Amount
Total Assets
Total Equity
Gearing Ratio*
Net Debt to EBITDA**
Interest Cover***
YTM^
(€) (€'000) (€'000) (%) (times) (times) (%)
5.00% Dizz Finance plc 2026 8,000,000 19,262 4,754 66.1 5.16 3.16 4.41
4.80% Med. Maritime Hub Finance plc 2026 15,000,000 29,276 4,784 73.9 8.63 2.13 4.07
4.50% Medserv plc 2026 (EUR) 21,982,400 153,273 28,251 63.5 11.36 1.10 4.37
4.25% Corinthia Finance plc 2026 40,000,000 1,765,072 901,595 42.1 9.55 2.23 3.58
4.00% MIDI plc 2026 50,000,000 235,302 86,621 43.3 25.30 -0.98 3.45
4.00% IHI plc 2026 (Secured) 55,000,000 1,602,317 884,632 36.4 7.91 2.64 3.42
4.00% IHI plc 2026 (Unsecured) 40,000,000 1,602,317 884,632 36.4 7.91 2.64 3.44
3.90% Plaza Centres plc 2026 8,500,000 44,882 27,625 30.2 4.46 6.10 3.82
3.75% Premier Capital plc 2026 65,000,000 161,128 47,607 67.3 1.82 10.15 3.40
4.50% GHM plc 2027 15,000,000 21,050 2,876 70.7 4.57 1.81 3.90
4.35% SD Finance plc 2027 65,000,000 217,599 65,698 47.7 3.21 5.46 3.75
4.00% Eden Finance plc 2027 40,000,000 169,936 90,161 36.5 4.97 4.46 3.44
3.75% Tumas Investments plc 2027 25,000,000 198,819 89,238 25.8 2.10 10.13 3.22
3.50% Simonds Farsons Cisk plc 2027 20,000,000 163,528 96,632 28.8 1.81 17.86 2.87
3.75% Virtu Finance plc 2027 25,000,000 161,959 79,465 40.6 3.82 11.30 3.28
3.85% Hili Finance plc 2028 (YTM as at date of issue)
40,000,000 408,204 82,870 73.1 5.69 3.27 3.85
4.00% Exalco Finance plc 15,000,000 54,912 36,051 24.1 5.60 3.43 4.00
Source: Yield to Maturity from rizzofarrugia.com, based on bond prices of 28 June 2018. Ratio workings and financial information quoted have been based on the issuer’s and their guarantors where applicable, from published financial data for the year ended 2017.
*Gearing Ratio: This refers to the fundamental analysis ratio of a company's level of long-term debt compared to its equity capital. In the above table this is computed as follows: Net Debt / (Net Debt + Equity).
**Net Debt to EBITDA: This is the measurement of leverage calculated by dividing a company's interest-bearing borrowings net of any cash or cash equivalents by its EBITDA.
***Interest Cover: The interest coverage ratio is calculated by dividing a company’s EBITDA of one period by the company’s net finance costs of the same period.
^Yield to Maturity (YTM) from rizzofarrugia.com, based on bond prices of 28 June 2018. YTM is the rate of return expected on a bond
[ 148 ]
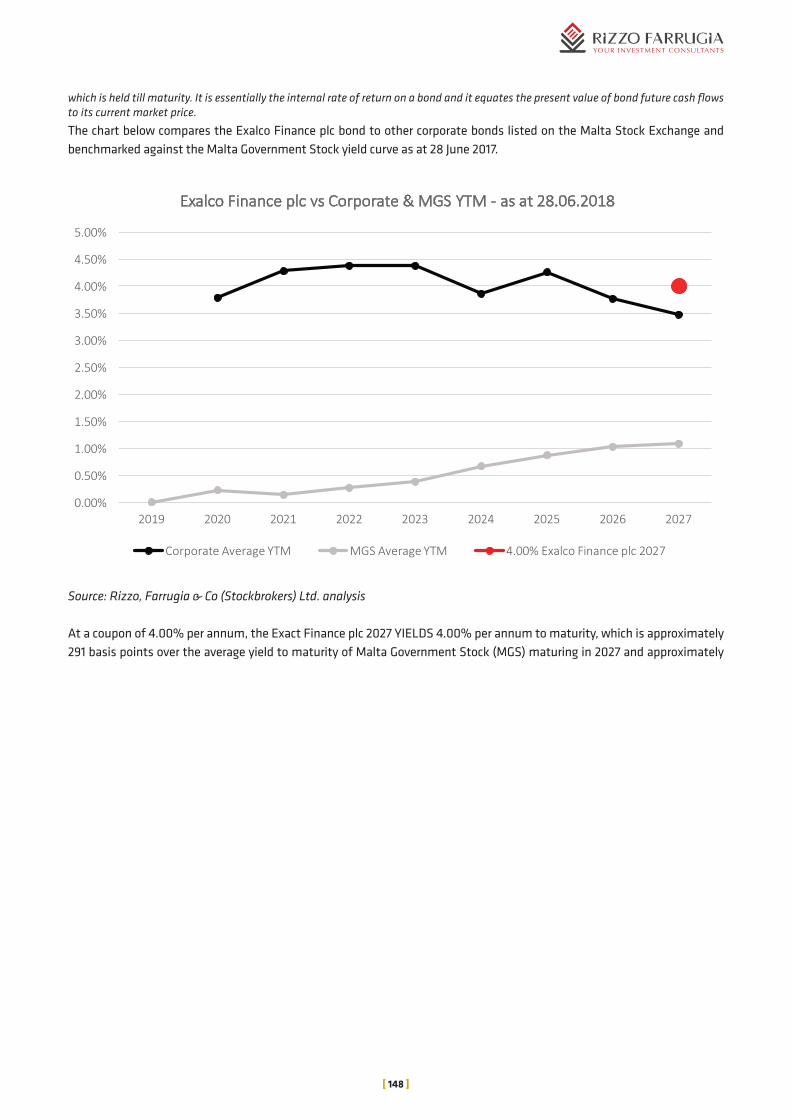
which is held till maturity. It is essentially the internal rate of return on a bond and it equates the present value of bond future cash flows to its current market price.
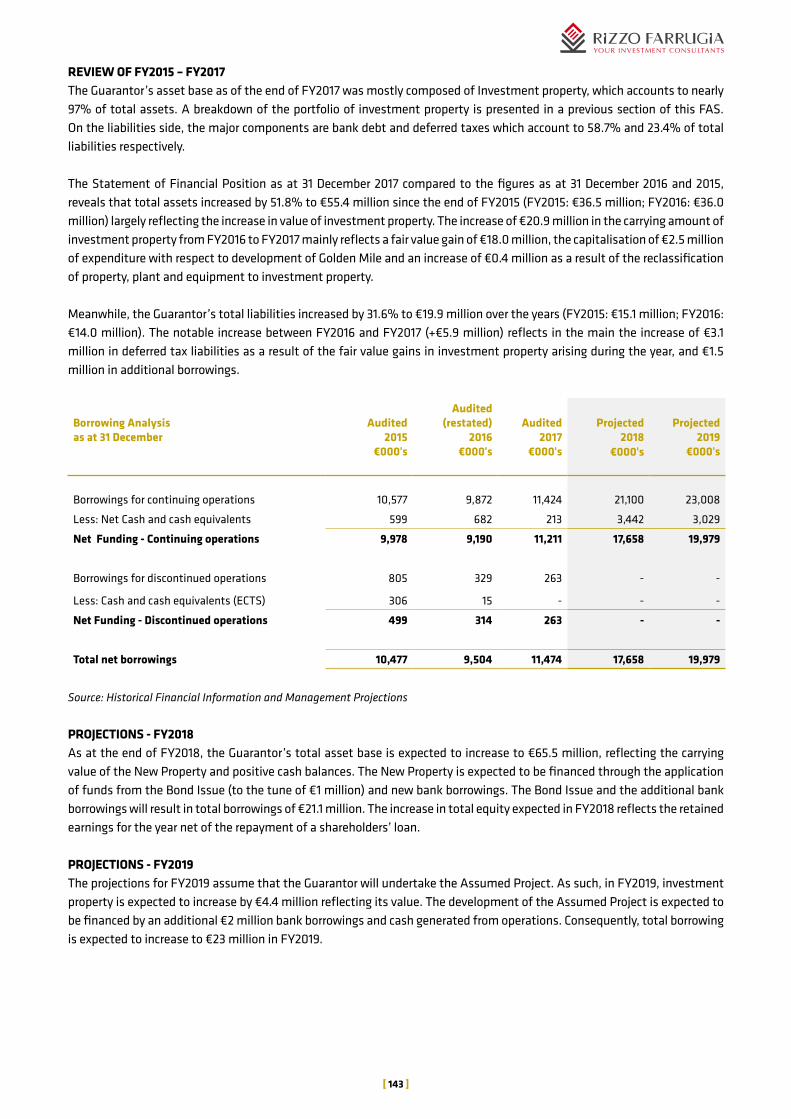
The chart below compares the Exalco Finance plc bond to other corporate bonds listed on the Malta Stock Exchange and benchmarked against the Malta Government Stock yield curve as at 28 June 2017.
!
!
The chart below compares the Exalco Finance plc bond to other corporate bonds listed on the Malta Stock Exchange and
benchmarked against the Malta Government Stock yield curve as at 28 June 2017.
Source: Rizzo, Farrugia & Co (Stockbrokers) Ltd analysis
At a coupon of 4.00% per annum, the Exact Finance plc 2027 YIELDS 4.00% per annum to maturity, which is approximately
291 basis points over the average yield to maturity of Malta Government Stock (MGS) maturing in 2027 and approximately 52 basis points above the average yield to maturity of corporate bonds maturing in 2027 (data correct as at 28 June 2018).
0.00%
0.50%
1.00%
1.50%
2.00%
2.50%
3.00%
3.50%
4.00%
4.50%
5.00%
2019 2020 2021 2022 2023 2024 2025 2026 2027
Exalco!Finance!plc!vs!Corporate!&!MGS!YTM!. as!at!28.06.2018
Corporate!Average!YTM MGS!Average!YTM 4.00%!Exalco!Finance!plc!2027
*Gearing Ratio: This refers to the fundamental analysis ratio of a company's level of long-term debt compared to its equity capital. In the above table this is computed as follows: Net Debt / (Net Debt + Equity).
**Net Debt to EBITDA: This is the measurement of leverage calculated by dividing a company's interest-bearing borrowings net of any cash or cash equivalents by its EBITDA.
***Interest Cover: The interest coverage ratio is calculated by dividing a company’s EBITDA of one period by the company’s net finance costs of the same period. ^Yield to Maturity (YTM) from rizzofarrugia.com, based on bond prices of 28 June 2018. YTM is the rate of return expected on a bond which is held till maturity. It is essentially the internal rate of return on a bond and it equates the present value of bond future cash flows to its current market price.
Source: Rizzo, Farrugia & Co (Stockbrokers) Ltd. analysis
At a coupon of 4.00% per annum, the Exact Finance plc 2027 YIELDS 4.00% per annum to maturity, which is approximately 291 basis points over the average yield to maturity of Malta Government Stock (MGS) maturing in 2027 and approximately
[ 149 ]
52 basis points above the average yield to maturity of corporate bonds maturing in 2027 (data correct as at 28 June 2018). GLOSSARY & DEFINITIONS
Statement of Comprehensive Income Explanatory Definitions
Revenue Total revenue generated by the company from its business activity during the financial year.
EBITDA Earnings before interest, tax, depreciation and amortization, reflecting the company’s earnings purely from operations.
Normalisation Normalisation is the process of removing non-recurring expenses or revenue from a financial metric like EBITDA, EBIT or earnings. Once earnings have been normalised, the resulting number represents the future earnings capacity that a buyer would expect from the business.
EBIT Earnings before interest and tax.
Depreciation and Amortization An accounting charge to compensate for the reduction in the value of assets and the eventual cost to replace the asset when fully depreciated.
Finance Income Interest earned on cash bank balances and from the intra-group companies on loans advanced.
Finance Costs Interest accrued on debt obligations.
Net Profit The profit generated in one financial year.
Cash Flow Statement Explanatory Definitions
Cash Flow from Operating Activities The cash used or generated from the company’s business activities.
Cash Flow from Investing Activities The cash used or generated from the company’s investments in new entities and acquisitions, or from the disposal of fixed assets.
Cash Flow from Financing Activities The cash used or generated from financing activities including new borrowings, interest payments, repayment of borrowings and dividend payments.
Statement of Financial Position Explanatory Definitions
Assets What the company owns which can be further classified in Current and Non-Current Assets.
Non-Current Assets Assets, full value of which will not be realised within the forthcoming accounting year
Current Assets Assets which are realisable within one year from the statement of financial position date.
Liabilities What the company owes, which can be further classified in Current and Non-Current Liabilities.
Current Liabilities Obligations which are due within one financial year.
Non-Current Liabilities Obligations which are due after more than one financial year.
Equity Equity is calculated as assets less liabilities, representing the capital owned by the shareholders, retained earnings, and any reserves.
Profitability Ratios
EBITDA Margin EBITDA as a percentage of total revenue.
Operating Profit Margin Operating profit margin is operating profit achieved during the financial year expressed as a percentage of total revenue.
Net Profit Margin Net profit margin is profit after tax achieved during the financial year expressed as a percentage of total revenue.
Return on Equity Return on equity (ROE) measures the rate of return on the shareholders’ equity of the owners of issued share capital, computed by dividing profit after tax by shareholders’ equity.
Return on Capital Employed Return on capital employed (ROCE) indicates the efficiency and profitability of a company’s capital investments, estimated by dividing operating profit by capital employed.
Return on Assets This is computed by dividing profit after tax by total assets.
Equity Equity is calculated as assets less liabilities, representing the capital owned by the shareholders, retained earnings, and any reserves.

Liquidity Ratios
Current Ratio The current ratio is a financial ratio that measures whether a company has enough resources to pay its debts over the next 12 months. It compares a company’s current assets to its current liabilities.
Cash Ratio Cash ratio is the ratio of cash and cash equivalents of a company to its current liabilities. It measures the ability of a business to repay its current liabilities by only using its cash and cash equivalents and nothing else.
Net Profit Margin Net profit margin is profit after tax achieved during the financial year expressed as a percentage of total revenue.
Return on Equity Return on equity (ROE) measures the rate of return on the shareholders’ equity of the owners of issued share capital, computed by dividing profit after tax by shareholders’ equity.
Return on Capital Employed Return on capital employed (ROCE) indicates the efficiency and profitability of a company’s capital investments, estimated by dividing operating profit by capital employed.
Return on Assets This is computed by dividing profit after tax by total assets.
Equity Equity is calculated as assets less liabilities, representing the capital owned by the shareholders, retained earnings, and any reserves.
Solvency Ratios
Interest Coverage Ratio This is calculated by dividing a company’s EBITDA of one period by the company’s net finance costs of the same period.
Gearing Ratio The gearing ratio indicates the relative proportion of shareholders’ equity and debt used to finance a company’s assets, and is calculated by dividing a company’s net debt by net debt plus shareholders’ equity.
Net Debt to EBITDA This is the measurement of leverage calculated by dividing a company's interest-bearing borrowings net of any cash or cash equivalents by its EBITDA.
Other Definitions
Yield to Maturity YTM is the rate of return expected on a bond which is held till maturity. It is essentially the internal rate of return on a bond and it equates the present value of bond future cash flows to its current market price.
[ 150 ]