Embed Size (px)
Citation preview

Exam II Lectures and Text Pages
• I. Cell Cycles
– Mitosis (218 – 228)
– Meiosis (238 – 249)
• II. Mendelian Genetics
• III. Chromosomal Genetics
• IV. Molecular Genetics
– Replication
– Transcription and Translation
• V. Microbial Models
• VI. DNA Technology

Chromosomal Genetics• Genes are located on chromosomes
• Chromosomes can be visualized using various techniques
Figure 15.1

Chromosomes: The Physical Basis of Mendelian Inheritance
• Several researchers proposed in the early 1900s that genes are located on chromosomes
• The behavior of chromosomes during meiosis was said to account for Mendel’s laws of segregation and independent assortment

CHROMOSOMAL GENETICS• Discoveries in genetics and cytology
– 1860s: Mendel - discrete inherited factors segregate and assort independently during gamete formation
– 1875: Cytologists worked out mitosis
– 1890s: Cytologists worked out meiosis
– 1900: Several scientists independently rediscovered Mendel's principles

Discoveries in Genetics and Cytology
• 1902: Sutton, Boveri, and others noted parallels in the behavior of Mendel's factors (genes) and the behavior of chromosomes
– both are paired in diploid cells
– Both homologous chromosomes and allele pairs segregate during meiosis
– fertilization restores the paired condition for both
• From these observations, biologists deduced the chromosomal basis of Mendel’s Laws

Chromosome Theory of Inheritance
Figure 15.2
Yellow-roundseeds (YYRR)
Green-wrinkledseeds (yyrr)
Meiosis
Fertilization
Gametes
All F1 plants produceyellow-round seeds (YyRr)
P Generation
F1 Generation
Meiosis
Two equallyprobable
arrangementsof chromosomesat metaphase I
LAW OF SEGREGATION LAW OF INDEPENDENT ASSORTMENT
Anaphase I
Metaphase II
Fertilization among the F1 plants
9 : 3 : 3 : 1
14
14
14
14
YR yr yr yR
Gametes
Y
RRY
y
r
r
y
R Y y r
Ry
Y
r
Ry
Y
r
R
Y
r
y
r R
Y y
R
Y
r
y
R
Y
Y
R R
Y
r
y
r
y
R
y
r
Y
r
Y
r
Y
r
Y
R
y
R
y
R
y
r
Y
F2 Generation
Starting with two true-breeding pea plants,we follow two genes through the F1 and F2 generations. The two genes specify seed color (allele Y for yellow and allele y forgreen) and seed shape (allele R for round and allele r for wrinkled). These two genes are on different chromosomes. (Peas have seven chromosome pairs, but only two pairs are illustrated here.)
The R and r alleles segregate at anaphase I, yielding two types of daughter cells for this locus.
1
Each gamete gets one long chromosome with either the R or r allele.
2
Fertilizationrecombines the R and r alleles at random.
3
Alleles at both loci segregatein anaphase I, yielding four types of daughter cells depending on the chromosomearrangement at metaphase I. Compare the arrangement of the R and r alleles in the cellson the left and right
1
Each gamete gets a long and a short chromosome in one of four allele combinations.
2
Fertilization results in the 9:3:3:1 phenotypic ratio in the F2 generation.
3
Genes are found on chromosomes.
It is the chromosomes that segregate and independently assort during gamete formation.

Morgan’s Experiments Support Chromosome Theory
• Thomas Hunt Morgan (early 1900’s)
– Provided convincing evidence that chromosomes are the location of Mendel’s heritable factors
– He traced a gene to a specific chromosome

Morgan’s Choice of Experimental Organism• He chose Drosophila melanogaster because
they:
• a. Are easily cultured in the laboratory
• b. Are prolific breeders
• c. Have a short generation time
• d. Have only four pairs of chromosomes;
– autosomes (II, III, and IV); and sex chromosomes (Females XX , males XY)

Wild Types vs. Mutants and Genetic Symbols
• Morgan first observed and noted wild type, or normal, phenotypes that were common in the fly populations
• Traits alternative to the wild type are called mutant phenotypes
• Morgan’s genetic symbols are now convention.
• A gene’s symbol is based on the first mutant discovered.
– If the mutant is recessive: the first letter is lowercase.
– If the mutant is dominant: the first letter is capitalized.
– Wild-type trait: designated by a superscript +.

Copyright © 2005 Pearson Education, Inc. publishing as Benjamin Cummings
Correlating Behavior of a Gene’s Alleles with Behavior of a Chromosome Pair
• Morgan discovered a single male fly with white eyes. He mated this mutant white-eyed male with a red-eyed (wild-type) female.
Figure 15.3
– The F1 generation all had red eyes (wild-type is dominant)

Figure 15.4
The F2 generation showed a typical Mendelian 3:1 ratio of red eyes to white eyes. However, no females displayed the white-eye trait; they all had red eyes. Half the males had white eyes,and half had red eyes.
Morgan then bred an F1 red-eyed female to an F1 red-eyed male toproduce the F2 generation.
RESULTS
PGeneration
F1
Generation
X
F2
Generation
Morgan mated a wild-type (red-eyed) female with a mutant white-eyed male. The F1 offspring all had red eyes.
EXPERIMENT
Eye Color is Linked to Sex
– The F2 generation showed the 3:1 red:white eye ratio, but only males (1/2) had white eyes
• Morgan deduced
– That the white-eye mutant allele must be located on the X chromosome
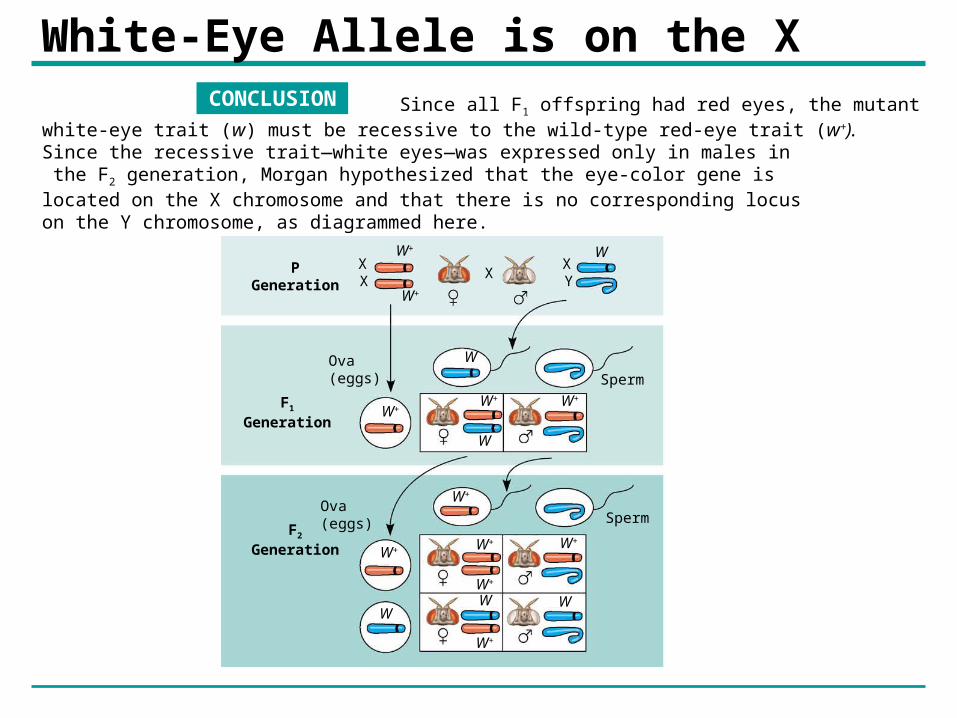
White-Eye Allele is on the XCONCLUSION Since all F1 offspring had red eyes, the mutant
white-eye trait (w) must be recessive to the wild-type red-eye trait (w+). Since the recessive trait—white eyes—was expressed only in males in the F2 generation, Morgan hypothesized that the eye-color gene is located on the X chromosome and that there is no corresponding locus on the Y chromosome, as diagrammed here.
PGeneration
F1
Generation
F2
Generation
Ova(eggs)
Ova(eggs)
Sperm
Sperm
XX X
XY
WW+
W+
W
W+W+ W+
W+
W+
W+
W+
W+
W
W+
W W
W

Discovery of sex-linkage• Females (XX) carry two copies of the gene,
males (XY) have only one.
– A mutant allele recessive, white-eyed female must have that allele on both X chromosomes, impossible for F2 females in the experiment.
– A white-eyed male has a single copy of the mutant allele - confers white eyes.
• Sex-linked genes: Genes on sex chromosomes. - commonly applied only to genes on the X.

White-Eyes: Specific Gene on a Specific Chromosome
• Morgan’s discovery that transmission of the X chromosome in fruit flies correlates with inheritance of the eye-color trait
– Was the first solid evidence indicating that a specific gene is associated with a specific chromosome

Linked Genes• Linked genes tend to be inherited together
because they are located near each other on the same chromosome
• Each chromosome
– Has hundreds or thousands of genes

How Linkage Affects Inheritance
• Morgan did other experiments with fruit flies
– To see how linkage affects the inheritance of two different characters

Two Character (Dihybrid) Crosses• Morgan crossed flies
– That differed in traits of two different characters
Double mutant(black body,vestigial wings)
Double mutant(black body,vestigial wings)
Wild type(gray body,
normal wings)
P Generation(homozygous)
b+ b+ vg+ vg+
x
b b vg vg
F1 dihybrid(wild type)(gray body, normal wings)
b+ b vg+ vgb b vg vg
TESTCROSSx
b+vg+ b vg b+ vg b vg+
b vg
b+ b vg+ vg b b vg vg b+ b vg vgb b vg+ vg
965Wild type
(gray-normal)
944Black-
vestigial
206Gray-
vestigial
185Black-normal
Sperm
Parental-typeoffspring
Recombinant (nonparental-type)offspring
RESULTS
EXPERIMENT Morgan first mated true-breedingwild-type flies with black, vestigial-winged flies to produce heterozygous F1 dihybrids, all of which are wild-type in appearance. He then mated wild-type F1 dihybrid females with black, vestigial-winged males, producing 2,300 F2 offspring, which he “scored” (classified according to phenotype).
CONCLUSION If these two genes were on different chromosomes, the alleles from the F1 dihybrid would sort into gametes independently, and we would expect to see equal numbers of the four types of offspring. If these two genes were on the same chromosome, we would expect each allele combination, B+ vg+ and b vg, to stay together as gametes formed. In this case, onlyoffspring with parental phenotypes would be produced. Since most offspring had a parental phenotype, Morganconcluded that the genes for body color and wing sizeare located on the same chromosome. However, the production of a small number of offspring with recombinant phenotypes indicated that some mechanism occasionally breaks the linkage between genes on the same chromosome.
Figure 15.5
Double mutant(black body,vestigial wings)
Double mutant(black body,vestigial wings)
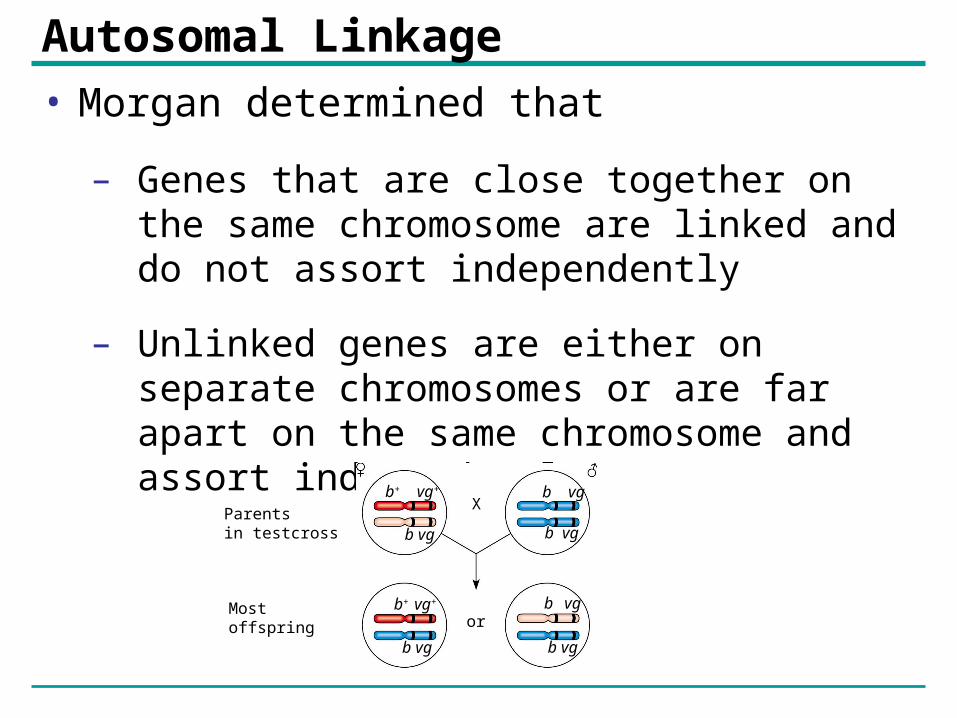
Autosomal Linkage• Morgan determined that
– Genes that are close together on the same chromosome are linked and do not assort independently
– Unlinked genes are either on separate chromosomes or are far apart on the same chromosome and assort independently
Parentsin testcross
b+ vg+
b vg
b+ vg+
b vg
b vg
b vg
b vg
b vg
Mostoffspring
X
or

Copyright © 2005 Pearson Education, Inc. publishing as Benjamin Cummings
Recombination of Unlinked Genes: Independent Assortment of Chromosomes
• When Mendel followed the inheritance of two characters
– He observed that some offspring have combinations of traits that do not match either parent in the P generation
Gametes from green-wrinkled homozygousrecessive parent (yyrr)
Gametes from yellow-roundheterozygous parent (YyRr)
Parental-type offspring
Recombinantoffspring
YyRr yyrr Yyrr yyRr
YR yr Yr yR
yr

Recombinant (non-parental) Offspring• Recombinant offspring
– Are those that show new combinations of the parental traits
• When 50% of all offspring are recombinants
– Geneticists say that there is a 50% frequency of recombination
– This correlates to assortment between unlinked genes

Recombination of Linked Genes: Crossing Over
• Morgan discovered that genes can be linked
– Sometimes the F2 offspring in a dihybrid testcross do NOT occur in the 1:1:1:1 phenotypic ratio expected between unlinked genes
– With complete linkage we expect to see only two phenotypes (the parental types) in the F2 of a dihybrid testcross
– If we see any recombinant phenotypes in a similar cross, then the linkage appears incomplete

Crossing Over Breaks Linkage• Morgan proposed that
– Some process must occasionally break the physical connection between genes on the same chromosome
– Crossing over of homologous chromosomes was the mechanism

Figure 15.6
Testcrossparents
Gray body,normal wings(F1 dihybrid)
b+ vg+
b vgReplication ofchromosomes
b+ vg
b+vg+
b
vg
vgMeiosis I: Crossingover between b and vgloci produces new allelecombinations.
Meiosis II: Segregationof chromatids producesrecombinant gameteswith the new allelecombinations.
Recombinantchromosome
b+vg+ b vg b+ vg b vg+
b vg
Sperm
b vg
b vg
Replication ofchromosomesvg
vg
b
b
bvg
b vg
Meiosis I and II:Even if crossing overoccurs, no new allelecombinations areproduced.
OvaGametes
Testcrossoffspring
Sperm
b+ vg+ b vg b+ vg b vg+
965Wild type
(gray-normal)b+ vg+
b vg b vg b vg b vg
b vg+b+ vg+b vg+
944Black-
vestigial
206Gray-
vestigial
185Black-normal Recombination
frequency =391 recombinants
2,300 total offspring 100 = 17%
Parental-type offspring Recombinant offspring
Ova
b vg
Black body,vestigial wings(double mutant)
b
Linked Genes– Exhibit recombination frequencies less than 50%

Copyright © 2005 Pearson Education, Inc. publishing as Benjamin Cummings
Linkage Mapping: Using Recombination Data
• A genetic map
– Is an ordered list of the genetic loci along a particular chromosome
– Can be developed using recombination frequencies

Some Genes Are Linked More Tightly Than Others.
• Alfred H. Sturtevant, Morgan's student assumed: if crossing over occurs randomly, the probability of crossing over between two genes is directly proportional to the distance between them.
– He used recombination frequencies to assign genes a linear position on a chromosome map
– He defined one map unit (centimorgan) as 1% recombination frequency.
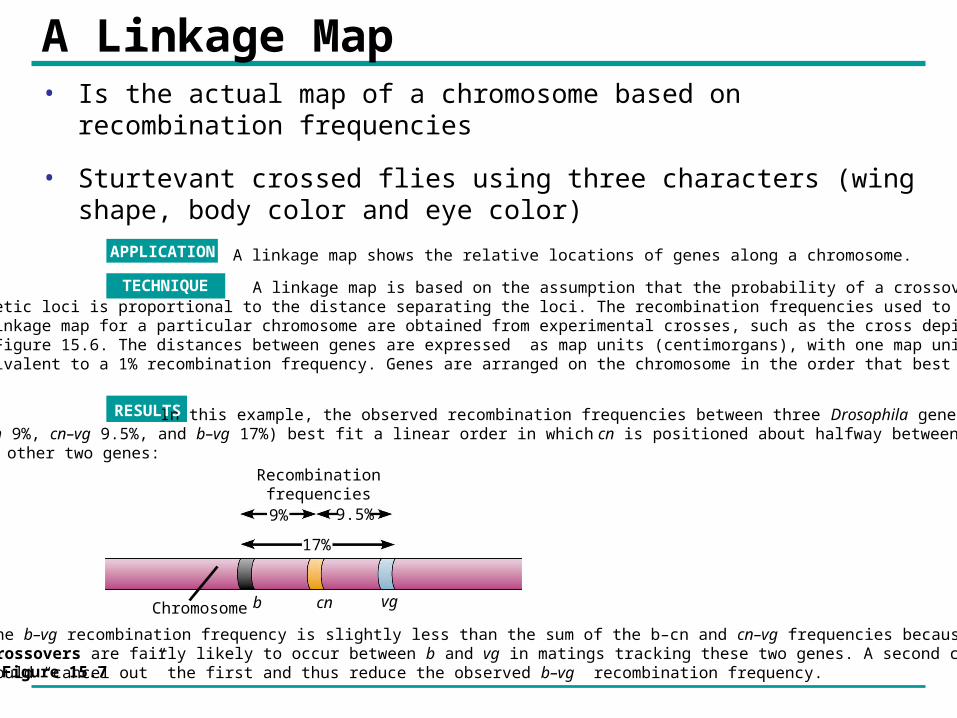
A Linkage Map• Is the actual map of a chromosome based on recombination
frequencies
• Sturtevant crossed flies using three characters (wing shape, body color and eye color)
Recombinationfrequencies
9% 9.5%
17%
b cn vgChromosome
The b–vg recombination frequency is slightly less than the sum of the b–cn and cn–vg frequencies because double crossovers are fairly likely to occur between b and vg in matings tracking these two genes. A second crossoverwould “cancel out” the first and thus reduce the observed b–vg recombination frequency.
In this example, the observed recombination frequencies between three Drosophila gene pairs (b–cn 9%, cn–vg 9.5%, and b–vg 17%) best fit a linear order in which cn is positioned about halfway between the other two genes:
RESULTS
A linkage map shows the relative locations of genes along a chromosome.APPLICATION
TECHNIQUE A linkage map is based on the assumption that the probability of a crossover between twogenetic loci is proportional to the distance separating the loci. The recombination frequencies used to constructa linkage map for a particular chromosome are obtained from experimental crosses, such as the cross depictedin Figure 15.6. The distances between genes are expressed as map units (centimorgans), with one map unitequivalent to a 1% recombination frequency. Genes are arranged on the chromosome in the order that best fits the data.
Figure 15.7

Incomplete Linkage• The farther apart genes are on a chromosome
– The more likely they are to be separated during crossing over
– Linked genes, so far apart on a chromosome that the recombination frequency is 50%, are indistinguishable from unlinked genes that assort independently.
– Linked genes that are far apart can be mapped using intermediate genes

Many Fruit Fly Genes• Were mapped initially using recombination
frequencies
Figure 15.8
Mutant phenotypes
Short aristae
Black body
Cinnabareyes
Vestigialwings
Brown eyes
Long aristae(appendageson head)
Gray body
Redeyes
Normalwings
Redeyes
Wild-type phenotypes
IIY
I
X IVIII
0 48.5 57.5 67.0 104.5

Linkage Groups Correspond to Chromosomes
• Sturtevant and his coworkers mapped other Drosophila genes in linear arrays
– Crossover data clusters known mutations into four major linkage groups.
– Drosophila has four sets of chromosomes, so this clustering is evidence of genes on chromosomes.

Genetic Mapping
• Types of mapping
– Maps based on crossover gives the relative position of linked genes.
– Cytogenetic maps: locate genes with respect to chromosomal features, such as stained bands that can be viewed.
– The ultimate genetic maps are constructed by sequencing DNA; in this case, distances between gene loci can be measured in nucleotides.