Embed Size (px)
Citation preview

1
Examination Analysis 2016

2
Basic Headlines Overview
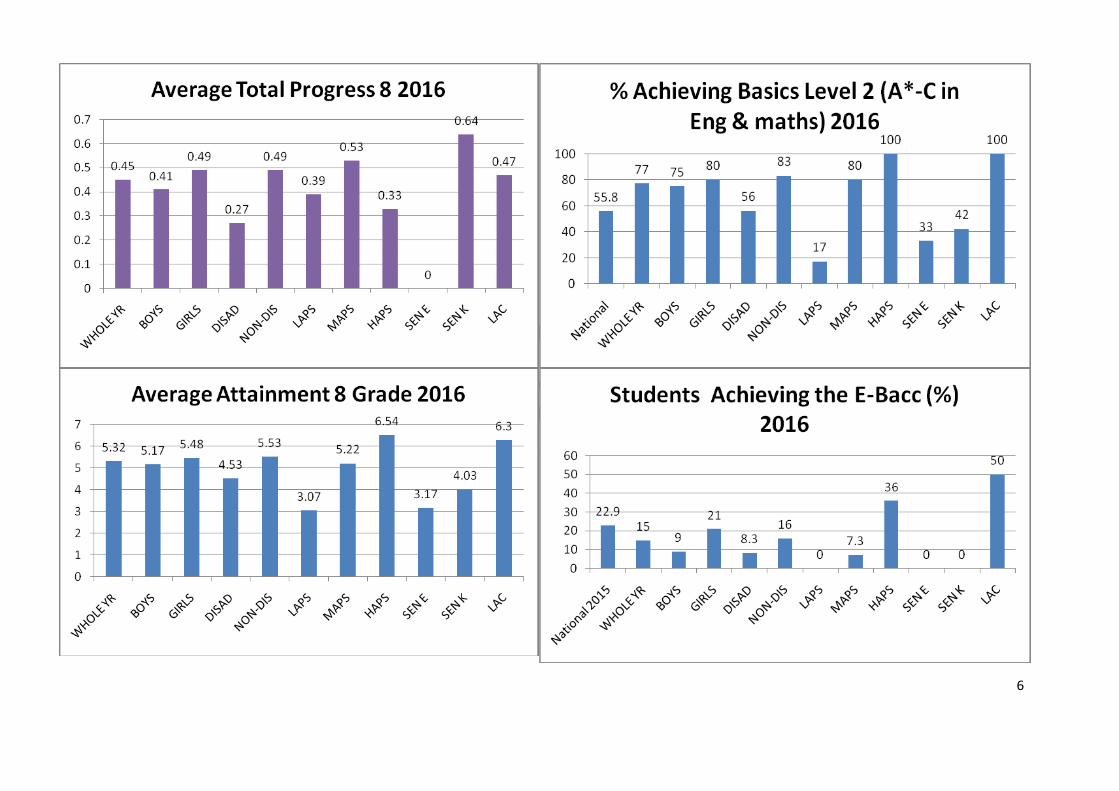
From the table above, with a weaker cohort compared with the previous year (see average KS2 points), SAX have performed significantly better in all measures compared to national and the previous years’ results. The only exception is the EBacc measure, where SAX does not compare favourably with national, although a slight increase from last year can be seen. This is in part due to the Academy’s decision not to “force” all students onto the EBacc pathway. This figure will improve next year as a result of changes made to address this with regards to curriculum pathways for following cohorts.
Measure SAX 2016
SAX 2015
National 2015
% A*- C in English AND maths 77.4 71 55.8 Progress 8 0.26 -0.01 Attainment 8 53.14 48.32 % of cohort entered for EBacc 22.6 27.9 % Ebacc 14.7 13.1 22.9 %3+ LoP English 90.9 69.4 71 %3+ LoP mathematics 85.7 81.3 78 5A* - C inc English and maths 75.1 66 53.8 Average KS2 Points 27.3 27.6

3
Cohort Summary Class of 2016 (177 students)
Count Percentage
Gender Boys: 89 Girls: 88 Boys: 50 Girls: 50
SEN EHCP: 3 K: 19 EHCP: 1.7 K: 11
Disadvantage 36 20
LAC/CIC 2 1
Average Total Points 415.62
Average Total Capped 8 335.82
Average Total Capped 8 inc English and maths
335.62
Average Total Capped 8 GCSE only 323.79
Attainment 8 5.32
Progress 8 0.45
Basics (A*-C in English and maths) 137 77
EBacc 26 15
5A*- C inc English and maths 133 75
Students making 3+ LoP in English 159 91
Students making 4+ LoP in English 106 61
Students making 5+ LoP in English 20 11
Students making 3+ LoP in maths 150 86
Students making 4+ LoP in maths 77 44
Students making 5+ LoP in maths 25 15
Capped 8+ English and maths VA score 1028.27
4
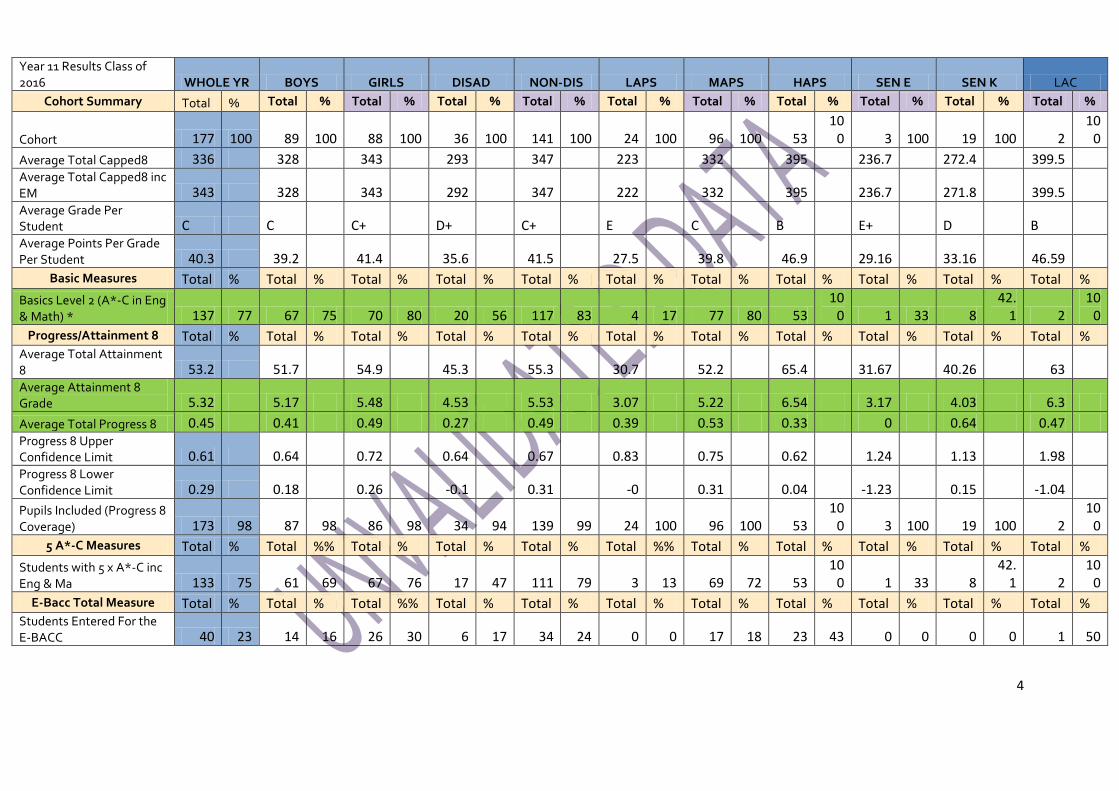
Year 11 Results Class of 2016 WHOLE YR BOYS GIRLS DISAD NON-DIS LAPS MAPS HAPS SEN E SEN K LAC
Cohort Summary Total % Total % Total % Total % Total % Total % Total % Total % Total % Total % Total %
Cohort 177 100 89 100 88 100 36 100 141 100 24 100 96 100 53 10
0 3 100 19 100 2 10
0 Average Total Capped8 336 328 343 293 347 223 332 395 236.7 272.4 399.5 Average Total Capped8 inc EM 343 328 343 292 347 222 332 395 236.7 271.8 399.5 Average Grade Per Student C C C+ D+ C+ E C B E+ D B Average Points Per Grade Per Student 40.3 39.2 41.4 35.6 41.5 27.5 39.8 46.9 29.16 33.16 46.59
Basic Measures Total % Total % Total % Total % Total % Total % Total % Total % Total % Total % Total % Basics Level 2 (A*-C in Eng & Math) * 137 77 67 75 70 80 20 56 117 83 4 17 77 80 53
100 1 33 8
42.1 2
100
Progress/Attainment 8 Total % Total % Total % Total % Total % Total % Total % Total % Total % Total % Total % Average Total Attainment 8 53.2 51.7 54.9 45.3 55.3 30.7 52.2 65.4 31.67 40.26 63 Average Attainment 8 Grade 5.32 5.17 5.48 4.53 5.53 3.07 5.22 6.54 3.17 4.03 6.3 Average Total Progress 8 0.45 0.41 0.49 0.27 0.49 0.39 0.53 0.33 0 0.64 0.47 Progress 8 Upper Confidence Limit 0.61 0.64 0.72 0.64 0.67 0.83 0.75 0.62 1.24 1.13 1.98 Progress 8 Lower Confidence Limit 0.29 0.18 0.26 -0.1 0.31 -0 0.31 0.04 -1.23 0.15 -1.04 Pupils Included (Progress 8 Coverage) 173 98 87 98 86 98 34 94 139 99 24 100 96 100 53
100 3 100 19 100 2
100
5 A*-C Measures Total % Total %% Total % Total % Total % Total %% Total % Total % Total % Total % Total % Students with 5 x A*-C inc Eng & Ma 133 75 61 69 67 76 17 47 111 79 3 13 69 72 53
100 1 33 8
42.1 2
100
E-Bacc Total Measure Total % Total % Total %% Total % Total % Total % Total % Total % Total % Total % Total % Students Entered For the E-BACC 40 23 14 16 26 30 6 17 34 24 0 0 17 18 23 43 0 0 0 0 1 50

5
Students in COHORT Achieving the E-BACC 26 15 8 9 18 21 3 8.3 23 16 0 0 7 7.3 19 36 0 0 0 0 1 50
Progress Measures Total % Total % Total % Total % Total % Total % Total % Total % Total %% Total % Total % Students making 3+ LOP in English 159 91 77 88 82 94 31 89 128 91 19 79 88 92 50 94 2 67 16
84.2 2
100
WHOLE YR BOYS GIRLS DISAD NON-DIS LAPS MAPS HAPS SEN E SEN K LAC
Students making 4+ LOP in English 106 61 40 46 66 76 20 57 86 61 10 42 54 56 40 76 1 33 10
52.6 2
100
Students making 5+ LOP in English 20 11 87 5.5 7 17 34 6.3 140 12 21 0 96 7 53 24 3 0 18 0 2 50 Students included in measure 175 Students making 3+ LOP in maths 150 86 77 87 73 85 21 62 129 92 13 54 83 87 52 98 1 33 13
68.4 2
100
Students making 4+ LOP in maths 75 43 35 39 40 47 11 32 64 45 5 21 36 38 33 62 0 0 3
15.8 1 50
Students making 5+ LOP in maths 25 15 87 13 86 17 34 9 139 16 20 5 96 10 53 26 2 0 17 6 2 50 Students included in measure 175
Value Added Total Measure Total % Total % Total % Total % Total % Total % Total % Total % Total % Total % Total %
Capped8 +EM VA Score 1028 1026 1031 1015 1032 1027 1032 1023 1020 1043 1049
6

7
3 Year Averages
08/09 09/10 10/11 11/12 12/13 13/14 14/15 15/16
% Achieving 5+ A*-C inc En and Ma
All 60.4 68 60.4 63.7 67.9 60 66 75
3 yr ave 55.0 59.0 62.9 64.0 64.0 63.7 64.7 67
% Achieving
5+ A*-C
All 70.9 82.4 81.7 94.8 88 70 70
3 yr ave 69.5 72.0 78.4 86.3 88.2 84.2 76
% Achieving
EBacc
All n/a 6 18.7 13 15
3 yr ave 13 15.6
Progress 8
Value
All n/a 0.33 -0.04 0.45
3 yr ave 0.25
% 3+ LoP English
All 68 72 67 70 92
3 yr ave 69 70 76
% 4+ LoP English
All 29 36 30 18 61
3 yr ave 32 28 36
% 5+ LoP
English
11
% 3 LoP Maths
All 85 80 71 81 86
3 yr ave 79 77 79
% 4 LoP Maths
All 35 36 33 29 43
3 yr ave 35 33 35
% 5+ LoP Maths
All 35 36 33 29 43
3 yr ave 35 33 35
8
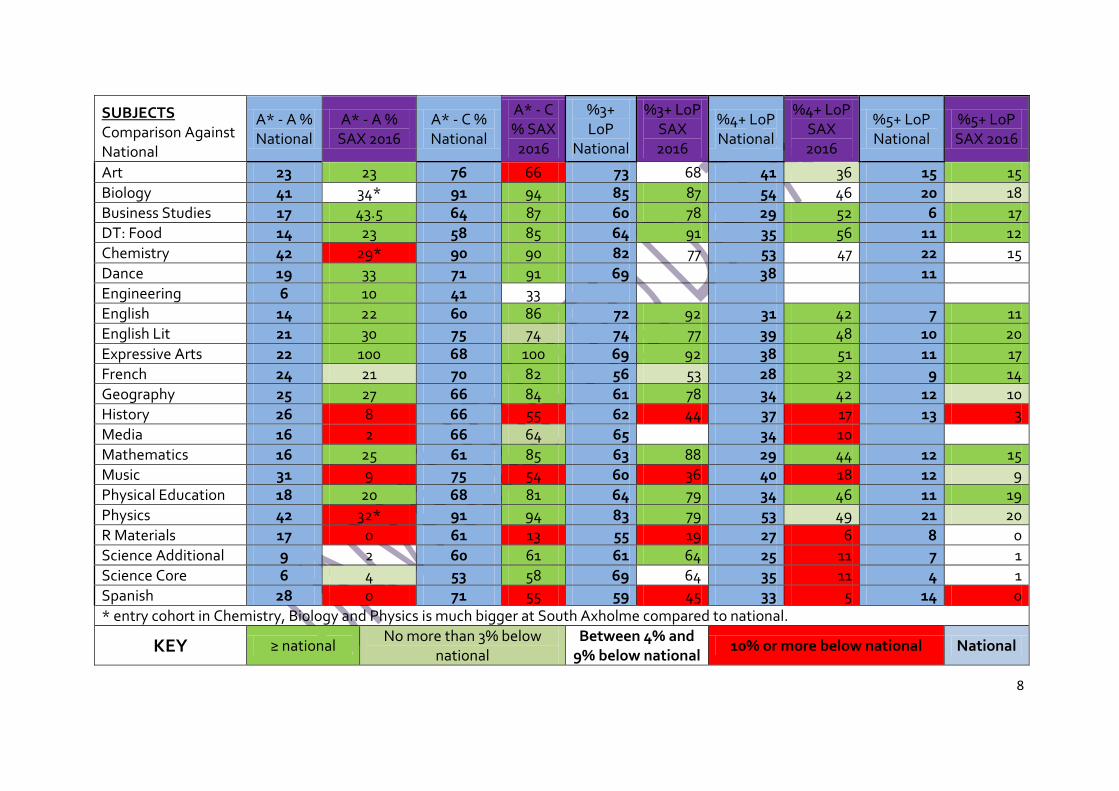
SUBJECTS Comparison Against National
A* - A % National
A* - A % SAX 2016
A* - C % National
A* - C % SAX 2016
%3+ LoP
National
%3+ LoP SAX 2016
%4+ LoP National
%4+ LoP SAX 2016
%5+ LoP National
%5+ LoP SAX 2016
Art 23 23 76 66 73 68 41 36 15 15 Biology 41 34* 91 94 85 87 54 46 20 18 Business Studies 17 43.5 64 87 60 78 29 52 6 17 DT: Food 14 23 58 85 64 91 35 56 11 12 Chemistry 42 29* 90 90 82 77 53 47 22 15 Dance 19 33 71 91 69 38 11 Engineering 6 10 41 33 English 14 22 60 86 72 92 31 42 7 11 English Lit 21 30 75 74 74 77 39 48 10 20 Expressive Arts 22 100 68 100 69 92 38 51 11 17 French 24 21 70 82 56 53 28 32 9 14 Geography 25 27 66 84 61 78 34 42 12 10 History 26 8 66 55 62 44 37 17 13 3 Media 16 2 66 64 65 34 10 Mathematics 16 25 61 85 63 88 29 44 12 15 Music 31 9 75 54 60 36 40 18 12 9 Physical Education 18 20 68 81 64 79 34 46 11 19 Physics 42 32* 91 94 83 79 53 49 21 20 R Materials 17 0 61 13 55 19 27 6 8 0 Science Additional 9 2 60 61 61 64 25 11 7 1 Science Core 6 4 53 58 69 64 35 11 4 1 Spanish 28 0 71 55 59 45 33 5 14 0 * entry cohort in Chemistry, Biology and Physics is much bigger at South Axholme compared to national.
KEY ≥ national No more than 3% below
national Between 4% and
9% below national 10% or more below national National

9
SUBJECTS Full national data not available
A* - A % National
A* - A % SAX 2016
A* - C % National
A* - C % SAX 2016
%3+ LoP
National
%3+ LoP SAX 2016
%4+ LoP National
%4+ LoP SAX 2016
%5+ LoP National
%5+ LoP SAX 2016
Computing 20.7 18.2 60.4 36.4
27.3
18.2
18.2 Textiles
25
66.7 75 83.3 46 50 18 16.7
ECDL
40.7
100
98.1
79.2
34 Expressive Art (animations)
26.3
94.7
100
63.2
21.1
Health and Social 1st Award
0
100
100
0
0
Health and Social 1st Certificate
0
100
0
0
0
Health and Social 1st Extension
0
88.2
81.3
6.3
0
Maths Additional 56.6 60 93.9 90
60
60
60 Maths Further
38.5
76.9
76.9
42.3
26.9
PE Sport/Leisure
0
0
0
0
0 Performing Arts 21.5 16.4 68.3 86.9
91.5
50.8
16.9
Religious Education 29.5 75 71.6 100
100
100
75 Sport 1st Award
5.7
71.3
55.2
18.4
2.3
Use of Mathematics
16.7
100
100
50
5.6
KEY ≥ national
No more than 3% below national
Between 4% and 9% below national
10% or more below national National

10
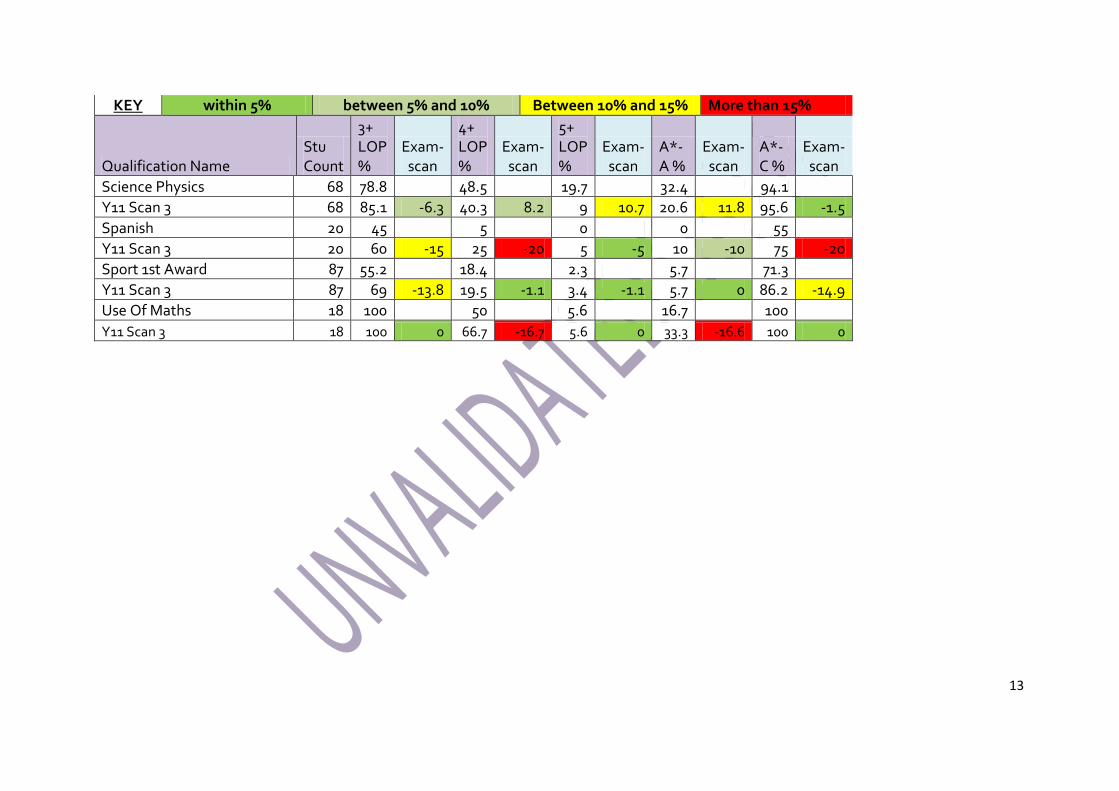
Actual Exam Results Compared to Year 11 Scan 3
KEY within 5% between 5% and 10% Between 10% and 15% More than 15%
Qualification Name
Stu Count
3+ LOP %
Exam-scan
4+ LOP %
Exam-scan
5+ LOP %
Exam-scan
A*-A %
Exam-scan
A*-C %
Exam-scan
Art 47 68.1 36.2 14.9 23.4 66 Y11 Scan 3 47 91.3 -23.2 63 -26.8 10.9 4 25.5 -2.1 83 -17 Business Camnat L2 25 88 56 20 24 88 Y11 Scan 3 25 92 -4 48 8 24 -4 28 -4 92 -4 Business Studies 23 78.3 52.2 17.4 43.5 87 Y11 Scan 3 23 91.3 -13 52.2 0 17.4 0 39.1 4.4 95.7 -8.7 Computing 11 27.3 18.2 18.2 18.2 36.4 Y11 Scan 3 9 44.4 -17.1 22.2 -4 0 18.2 11.1 7.1 55.6 -19.2 Dance 12 83.3 50 33.3 33.3 91.7 Y11 Scan 3 12 66.7 16.6 16.7 33.3 16.7 16.6 16.7 16.6 66.7 25 DT Engineering 39 30.8 10.3 7.7 10.3 33.3 Y11 Scan 3 39 41 -10.2 5.1 5.2 0 7.7 0 10.3 53.8 -20.5 DT Food Tech 34 91.2 55.9 11.8 23.5 85.3 Y11 Scan 3 34 73.5 17.7 20.6 35.3 2.9 8.9 8.8 14.7 67.6 17.7 DT Resistant Mat 16 18.8 6.3 0 0 12.5 Y11 Scan 3 16 25 -6.2 0 6.3 0 0 0 0 12.5 0 DT Textiles 12 83.3 50 16.7 25 66.7 Y11 Scan 3 12 83.3 0 41.7 8.3 8.3 8.4 16.7 8.3 66.7 0 ECDL 54 98.1 79.2 34 40.7 100 Y11 Scan 3 21 95.2 2.9 61.9 17.3 23.8 10.2 47.6 -6.9 100 0 English Language 92 95.6 64.8 22 42.4 98.9 Y11 Scan 3 92 83.7 11.9 55.4 9.4 10.9 11.1 33.7 8.7 97.8 1.1

11
KEY within 5% between 5% and 10% Between 10% and 15% More than 15%
Qualification Name
Stu Count
3+ LOP %
Exam-scan
4+ LOP %
Exam-scan
5+ LOP %
Exam-scan
A*-A %
Exam-scan
A*-C %
Exam-scan
English Literature 174 77.3 48.3 19.8 29.9 74.1 Y11 Scan 3 173 84.2 -6.9 44.4 3.9 8.2 11.6 20.8 9.1 80.3 -6.2 Expressive Arts 4 100 100 100 100 100 Y11 Scan 3 4 100 0 100 0 100 0 100 0 100 0 Exp Arts Animation+A60 19 100 63.2 21.1 26.3 94.7 Y11 Scan 3 19 50 50 16.7 46.5 0 21.1 0 26.3 47.4 47.3 French 28 53.6 32.1 14.3 21.4 82.1 Y11 Scan 3 28 71.4 -17.8 25 7.1 7.1 7.2 21.4 0 92.9 -10.8 Geography 70 78.3 42 10.1 27.1 81.4 Y11 Scan 3 70 58.8 19.5 17.6 24.4 2.9 7.2 12.9 14.2 65.7 15.7 Health and Social Care 1st Aw 1 100 0 0 0 100 Y11 Scan 3 1 100 0 0 0 0 0 0 0 100 0 Health and Social Care 1st Cert 1 0 0 0 0 100 Y11 Scan 3 1 0 0 0 0 0 0 0 0 100 0 Health and Social Care 1st Ext 17 81.3 6.3 0 0 88.2 Y11 Scan 3 17 81.3 0 6.3 0 0 0 0 0 88.2 0 History 60 44.1 16.9 3.4 8.3 55 Y11 Scan 3 60 66.1 -22 28.8 -11.9 3.4 0 13.3 -5 68.3 -13.3 IGCSE English 88 87.2 17.4 0 1.1 71.6 Y11 Scan 3 87 81.2 6 21.2 -3.8 1.2 -1.2 0 1.1 67.8 3.8 Mathematics 173 87.7 43.9 14.6 25.4 85 Y11 Scan 3 172 85.2 2.5 40.8 3.1 14.8 -0.2 22.1 3.3 84.9 0.1 Mathematics Additional 10 60 60 60 60 90 Y11 Scan 3 10 100 -40 100 -40 80 -20 100 -40 100 -10

12
KEY within 5% between 5% and 10% Between 10% and 15% More than 15%
Qualification Name Stu Count
3+ LOP %
Exam-scan
4+ LOP %
Exam-scan
5+ LOP %
Exam-scan
A*-A %
Exam-scan
A*-C %
Exam-scan
Mathematics Further 26 76.9 42.3 26.9 38.5 76.9 Y11 Scan 3 26 96.2 -19.3 73.1 -30.8 34.6 -7.7 69.2 -30.7 96.2 -19.3 Media Studies 45 62.2 20 0 2.2 64.4 Y11 Scan 3 45 68.9 -6.7 28.9 -8.9 0 0 8.9 -6.7 66.7 -2.3 Music 11 36.4 18.2 9.1 9.1 54.5 Y11 Scan 3 11 63.6 -27.2 27.3 -9.1 18.2 -9.1 27.3 -18.2 72.7 -18.2 PE Sport/Leisure 19 0 0 0 0 0 Y11 Scan 3 18 0 0 0 0 0 0 0 0 0 0 Performing Arts 61 91.5 50.8 16.9 16.4 86.9 Y11 Scan 3 61 93.2 -1.7 66.1 -15.3 22 -5.1 29.5 -13.1 85.2 1.7 Physical Education 59 78.9 45.6 19.3 20.3 81.4 Y11 Scan 3 59 73.7 5.2 21.1 24.5 7 12.3 11.9 8.4 71.2 10.2 Religous Studies 4 100 100 75 75 100 Y11 Scan 3 4 100 0 100 0 50 25 75 0 100 0 Science Additional 105 66.3 14.4 1 1.9 61 Y11 Scan 3 105 69.2 -2.9 19.2 -4.8 1.9 -0.9 3.8 -1.9 62.9 -1.9 Science Biology 68 86.6 46.3 17.9 33.8 94.1 Y11 Scan 3 67 91 -4.4 46.3 0 6 11.9 22.4 11.4 100 -5.9 Science Chemistry 68 77.3 47 15.2 29.4 89.7 Y11 Scan 3 68 78.8 -1.5 43.9 3.1 9.1 6.1 29.4 0 94.1 -4.4 Science Core 105 64.4 10.6 1 3.8 58.1 Y11 Scan 3 101 65 -0.6 11 -0.4 0 1 3 0.8 56.4 1.7 Science Furt Addit 17 11.8 0 0 0 23.5 Y11 Scan 3 17 94.1 -82.3 5.9 -5.9 5.9 -5.9 0 0 100 -76.5
13
KEY within 5% between 5% and 10% Between 10% and 15% More than 15%
Qualification Name Stu Count
3+ LOP %
Exam-scan
4+ LOP %
Exam-scan
5+ LOP %
Exam-scan
A*-A %
Exam-scan
A*-C %
Exam-scan
Science Physics 68 78.8 48.5 19.7 32.4 94.1 Y11 Scan 3 68 85.1 -6.3 40.3 8.2 9 10.7 20.6 11.8 95.6 -1.5 Spanish 20 45 5 0 0 55 Y11 Scan 3 20 60 -15 25 -20 5 -5 10 -10 75 -20 Sport 1st Award 87 55.2 18.4 2.3 5.7 71.3 Y11 Scan 3 87 69 -13.8 19.5 -1.1 3.4 -1.1 5.7 0 86.2 -14.9 Use Of Maths 18 100 50 5.6 16.7 100 Y11 Scan 3 18 100 0 66.7 -16.7 5.6 0 33.3 -16.6 100 0

14
Analysis by Gender and Ability Banding – HAPs (High Ability), MAPs (Middle Ability) and LAPs (Low Ability)
HAPs
Ability profile on entry:
Average Core KS2 APS per student All 31.43 (53 students)
Female 31.2 (33 students)
Male 31.8 (20 students)

15
Key points – girls outperforming boys in all areas except mathematics where the gender difference is negligible.

16
MAPs
Ability profile on entry:
Average Core KS2 APS per student All 27.13 (96 students)
Female 27.07 (44 students)
Male 27.17 (52 students)

17

18
Key points – girls outperforming boys in all areas except mathematics. Here the gender difference is negligible and at 3 LoP and 5 LoP boys outperform girls.
LAPs
Ability profile on entry:
Average Core KS2 APS per student All 18.89 (24 students)
Female 18.06 (9 students)
Male 19.39 (15 students)

19

20
Key points – boys outperforming girls in all measures above except 4+ LoP in English and 5+ LoP in maths.
DISADVANTAGE
36 students (20% of the cohort)
Average Core KS2 APS per student Disadvantage 24.97
Non-Disadvantage 27.87

21
Key points – disadvantaged students underperform compared with non-disadvantaged students in all areas, except in English where the gaps are minimal or where disadvantage outperform (3+LoP) non-disadvantage.

22
SEND
3 students have an EHCP (1.7% of the cohort)
19 students have interventions and are known (K) (10.7%)
155 students have no SEND (87.6%)
Average Core KS2 APS per student EHCP 18.25
K 21.78
No SEND 28.18

23

24
Summary of Areas of Focus for 2016/2017
1. Continue to reduce gap in performance between disadvantage and non-disadvantage students
2. Continue to reduce gender performance gap
3. Continue to improve accuracy of internal predictions
4. Improve performance in EBacc to meet national pass rates
Glossary
LoP - Levels of Progress ( This is a measure of the levels of progress made from entry after Key Stage 2 to the end of Key Stage 4 – GCSEs. 3 LoP is the basic expectation of all children and equates to average progress as stipulated by government.)
LAC - Looked After Child
CIC – Children in Care
SEND – Special Educational Needs and Disabilities
EHCP – Education, Health and Care Plan
EBacc – English Baccalaureate
HAP/MAP/LAP – High Ability Pupil/Middle Ability Pupil/Low Ability Pupil based on performance at Key Stage 2