Embed Size (px)
Citation preview
Examination of Dr Palmer’s GRM
Interpretations on Line 00 (or 1000N)
at Mt Bulga
Class tutorial
Prof. Bob Whiteley, Feb. 2012
References & bibliography
Harley, B. F. 1983. A geophysical case history of the Mt. Bulga Prospect: Extended Abstracts, 3rd Biennial
ASEG Conf., Brisbane, 31 Oct.-3 Nov. 1983, 110-115.
Leung, T.M., 2003, Controls of traveltime data and problems with the generalized reciprocal method:
Geophysics, 68, 1626–1632.
Palmer, D., 2006a, Refraction traveltime and amplitude corrections for very near surface
inhomogeneities. Geophysical Prospecting, 54, 589-604.
Palmer, D. 2006b , Integrating amplitudes and traveltimes with high resolution refraction methods.
SAGEEP2006, 1222-1240.
Palmer, D., 2009 Maximising the resolution of near-surface seismic refraction methods, Exploration
Geophysics, 40, 85-90.
Palmer, D. 2010 Characterizing the near surface with detailed refraction attributes in Advances in near-
surface seismology and ground penetrating radar: SEG Development Series, 15, Ch. 14, 233-250.
Palmer, D. 2012 Uncertainty in Near-Surface Refraction. Ext. Abs. 22nd ASEG Int. Geophysical
Conference, Brisbane, Australia, 26-29 Feb. 2012, 1-4.
Palmer D. 2011 Response to comments by Robert J. Whiteley. Exploration Geophysics, 42, 218-226.
Whiteley, R.J., Hawkins, L.V. & Govett, G.J.S. 1984 : The Seismic, Electrical and Electrogeochemical
Character of the Mount Bulga Orebody, NSW Australia, Soc. Explor. Geophys. SEG Expanded Abs, 3,
310, 310-314. Doi:10.1190/1.18403.
Whiteley, R. J., 2004 Shallow seismic refraction interpretation with Visual interactive ray trace (VIRT)
modelling. Exploration Geophysics, 35,116-123.
Whiteley, R. J. & Eccleston, P. J. 2006 Comparison of seismic refraction interpretation methods for
regolith mapping. Exploration Geophysics, 37,340-347.
Whiteley, R. J. 2011 Comments on Palmer, D. 2010. Is visual interactive ray trace an efficious strategy
for refraction inversion, Exploration Geophysics, 41, 260-267. Exploration Geophysics, 42, 207-217.
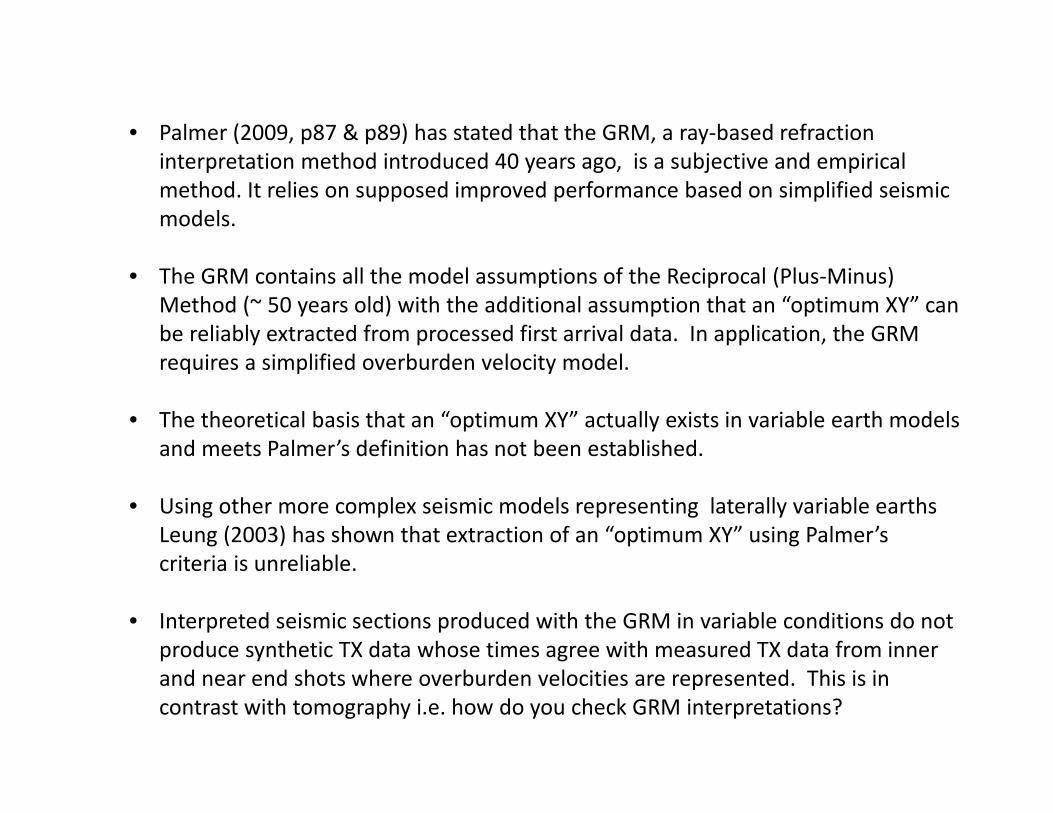
• Palmer (2009, p87 & p89) has stated that the GRM, a ray-based refraction
interpretation method introduced 40 years ago, is a subjective and empirical
method. It relies on supposed improved performance based on simplified seismic
models.
• The GRM contains all the model assumptions of the Reciprocal (Plus-Minus)
Method (~ 50 years old) with the additional assumption that an “optimum XY” can
be reliably extracted from processed first arrival data. In application, the GRM
requires a simplified overburden velocity model.
• The theoretical basis that an “optimum XY” actually exists in variable earth models
and meets Palmer’s definition has not been established.
• Using other more complex seismic models representing laterally variable earths
Leung (2003) has shown that extraction of an “optimum XY” using Palmer’s
criteria is unreliable.
• Interpreted seismic sections produced with the GRM in variable conditions do not
produce synthetic TX data whose times agree with measured TX data from inner
and near end shots where overburden velocities are represented. This is in
contrast with tomography i.e. how do you check GRM interpretations?
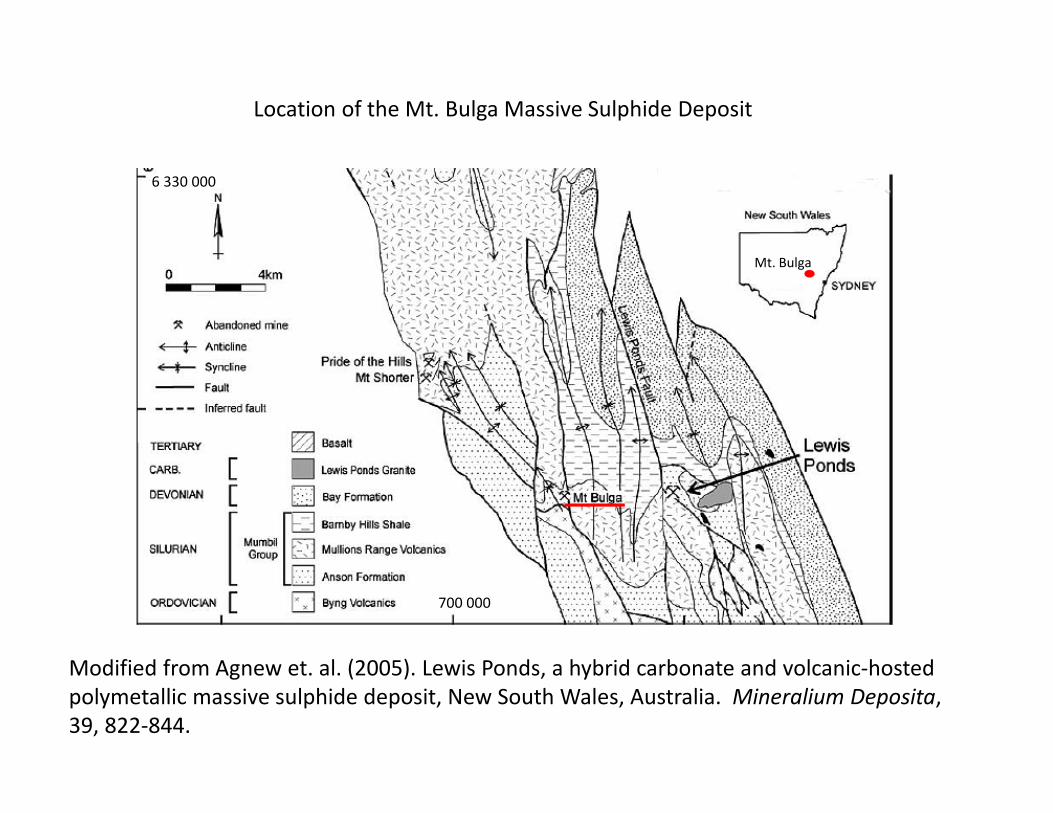
700 000
6 330 000
Modified from Agnew et. al. (2005). Lewis Ponds, a hybrid carbonate and volcanic-hosted
polymetallic massive sulphide deposit, New South Wales, Australia. Mineralium Deposita,
39, 822-844.
Mt. Bulga
Location of the Mt. Bulga Massive Sulphide Deposit
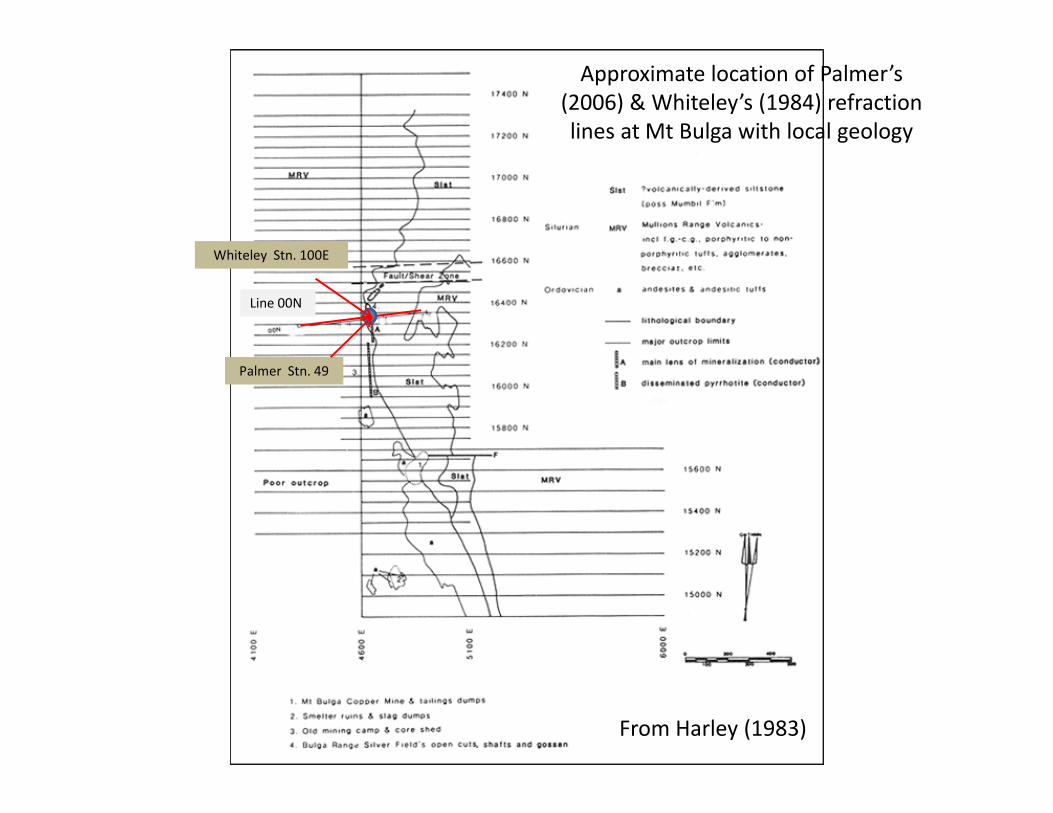
Line 00N
Palmer Stn. 49
Whiteley Stn. 100E
From Harley (1983)
Approximate location of Palmer’s
(2006) & Whiteley’s (1984) refraction
lines at Mt Bulga with local geology
Line 00N
Palmer Stn. 49
Whiteley Stn. 100E
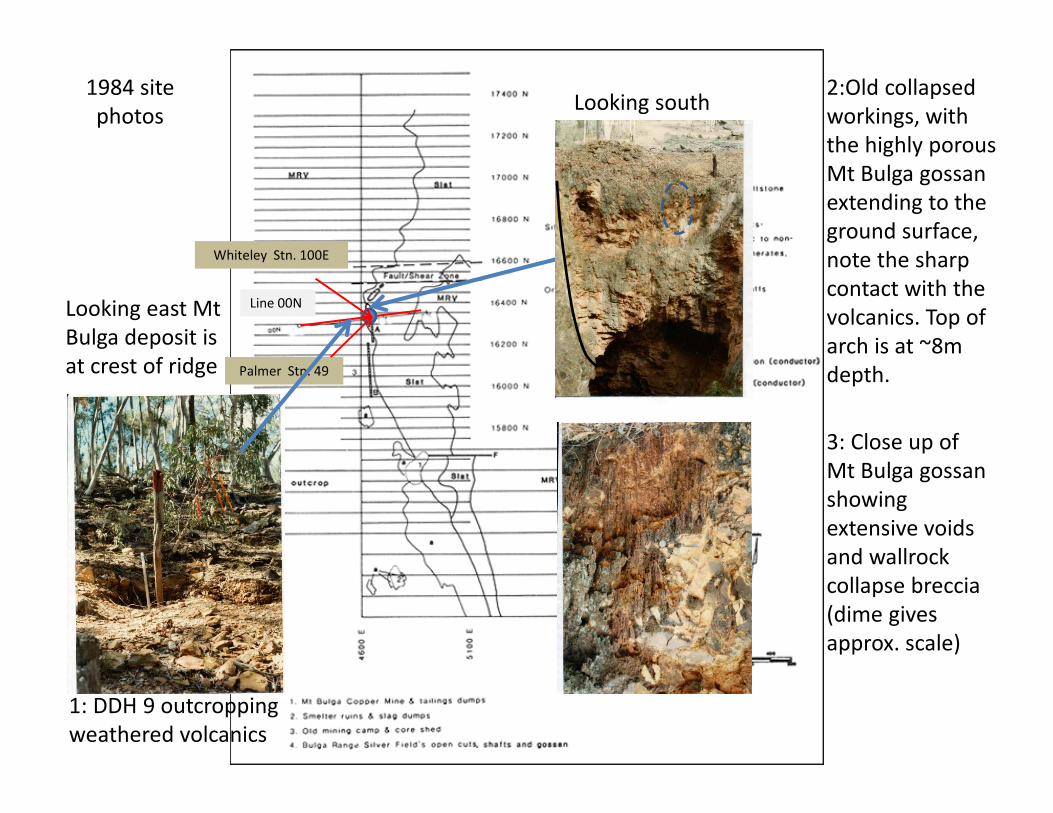
1: DDH 9 outcropping
weathered volcanics
2:Old collapsed
workings, with
the highly porous
Mt Bulga gossan
extending to the
ground surface,
note the sharp
contact with the
volcanics. Top of
arch is at ~8m
depth.
3: Close up of
Mt Bulga gossan
showing
extensive voids
and wallrock
collapse breccia
(dime gives
approx. scale)
1984 site
photos
Looking east Mt
Bulga deposit is
at crest of ridge
Looking south
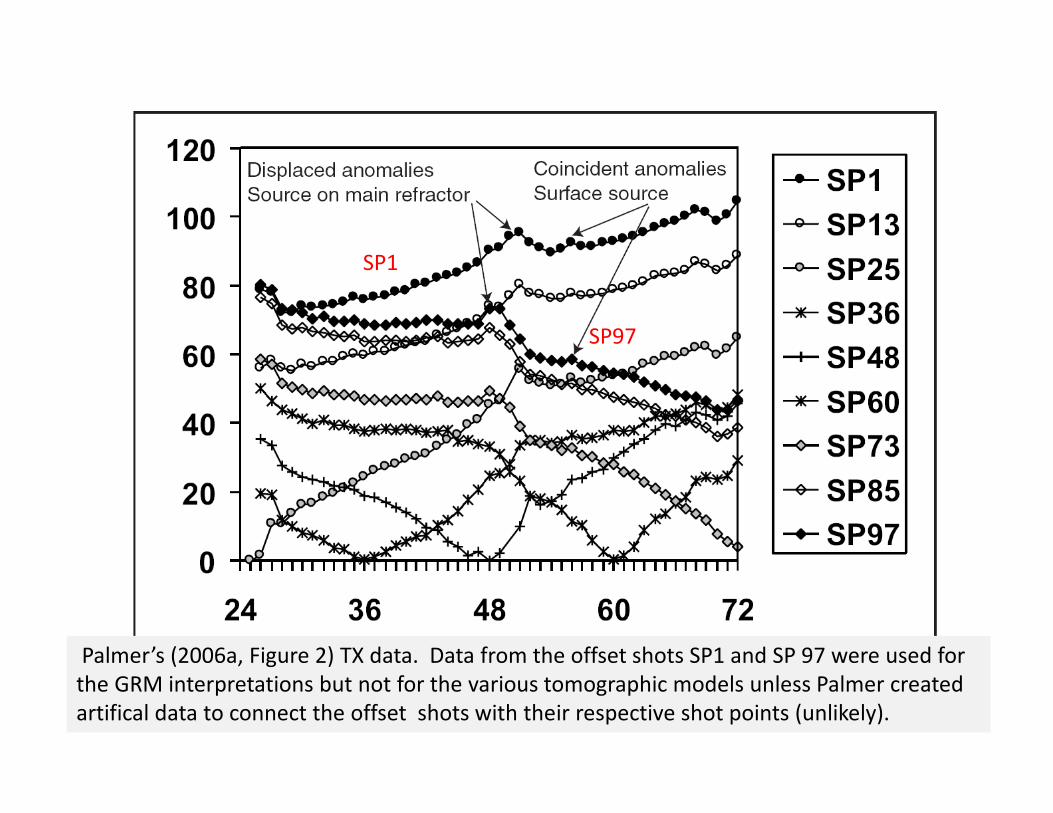
SP1
SP97
Palmer’s (2006a, Figure 2) TX data. Data from the offset shots SP1 and SP 97 were used for
the GRM interpretations but not for the various tomographic models unless Palmer created
artifical data to connect the offset shots with their respective shot points (unlikely).
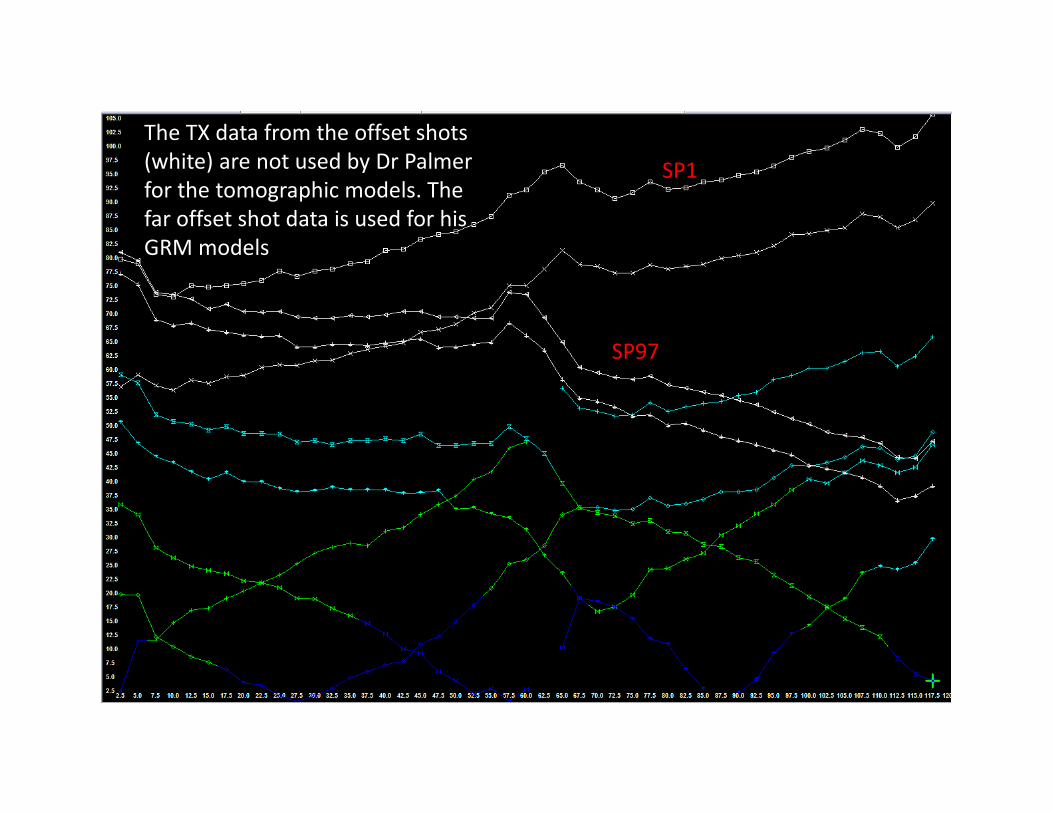
The TX data from the offset shots
(white) are not used by Dr Palmer
for the tomographic models. The
far offset shot data is used for his
GRM models
SP1
SP97
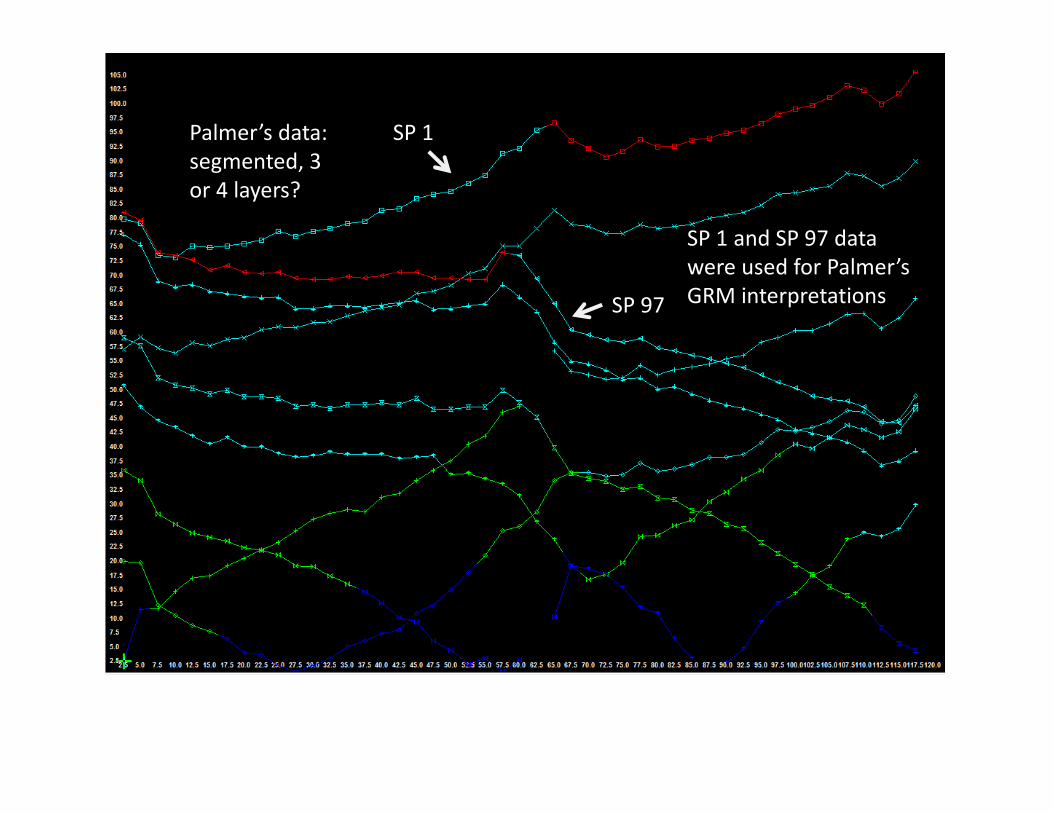
Palmer’s data:
segmented, 3
or 4 layers?
SP 1
SP 97
SP 1 and SP 97 data
were used for Palmer’s
GRM interpretations
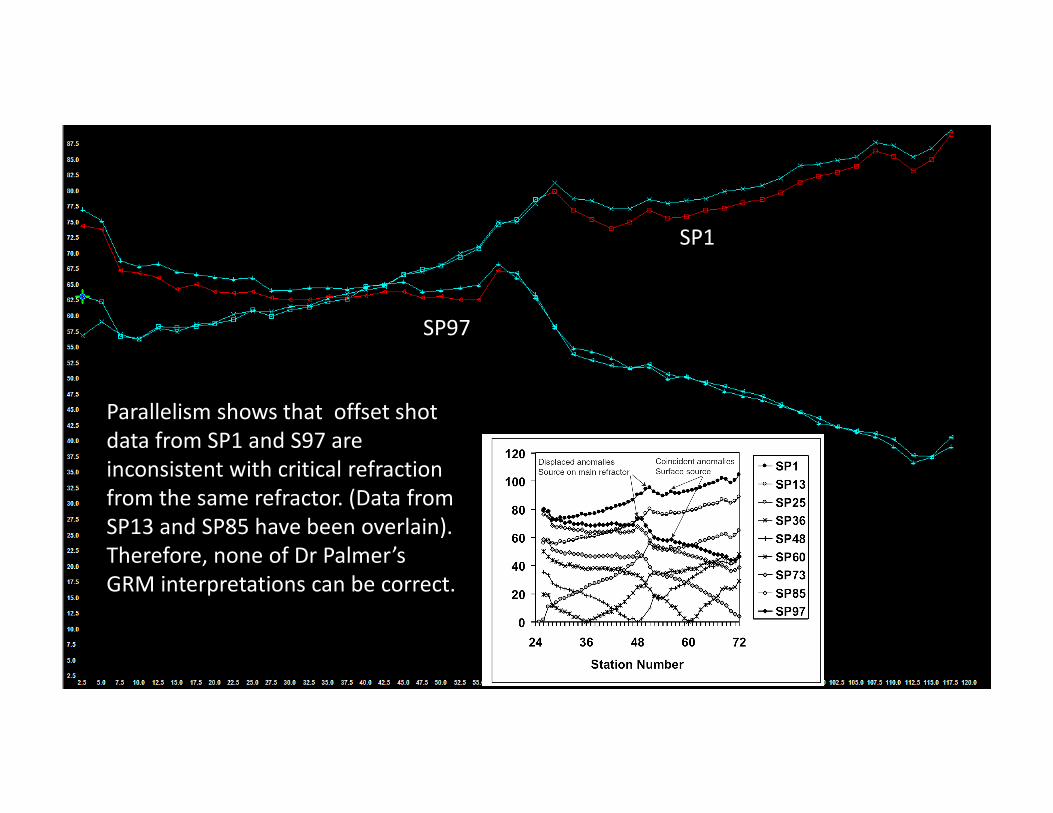
SP1
SP97
Parallelism shows that offset shot
data from SP1 and S97 are
inconsistent with critical refraction
from the same refractor. (Data from
SP13 and SP85 have been overlain).
Therefore, none of Dr Palmer’s
GRM interpretations can be correct.
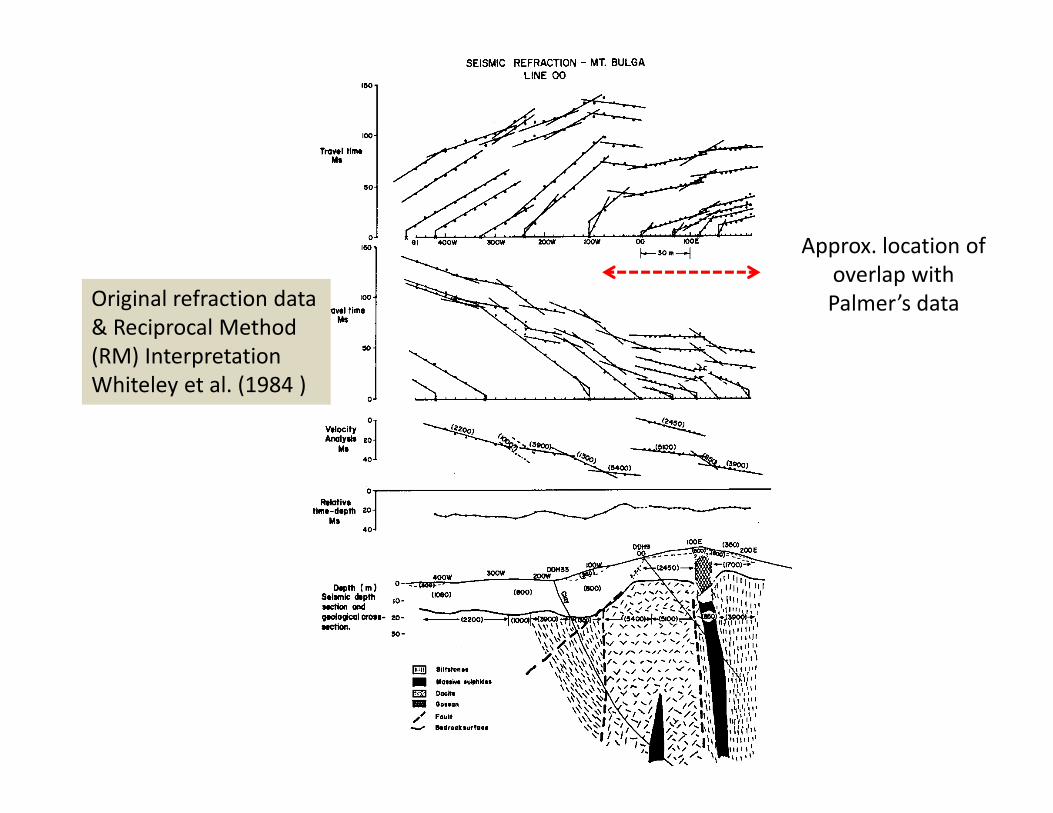
Original refraction data
& Reciprocal Method
(RM) Interpretation
Whiteley et al. (1984 )
Approx. location of
overlap with
Palmer’s data
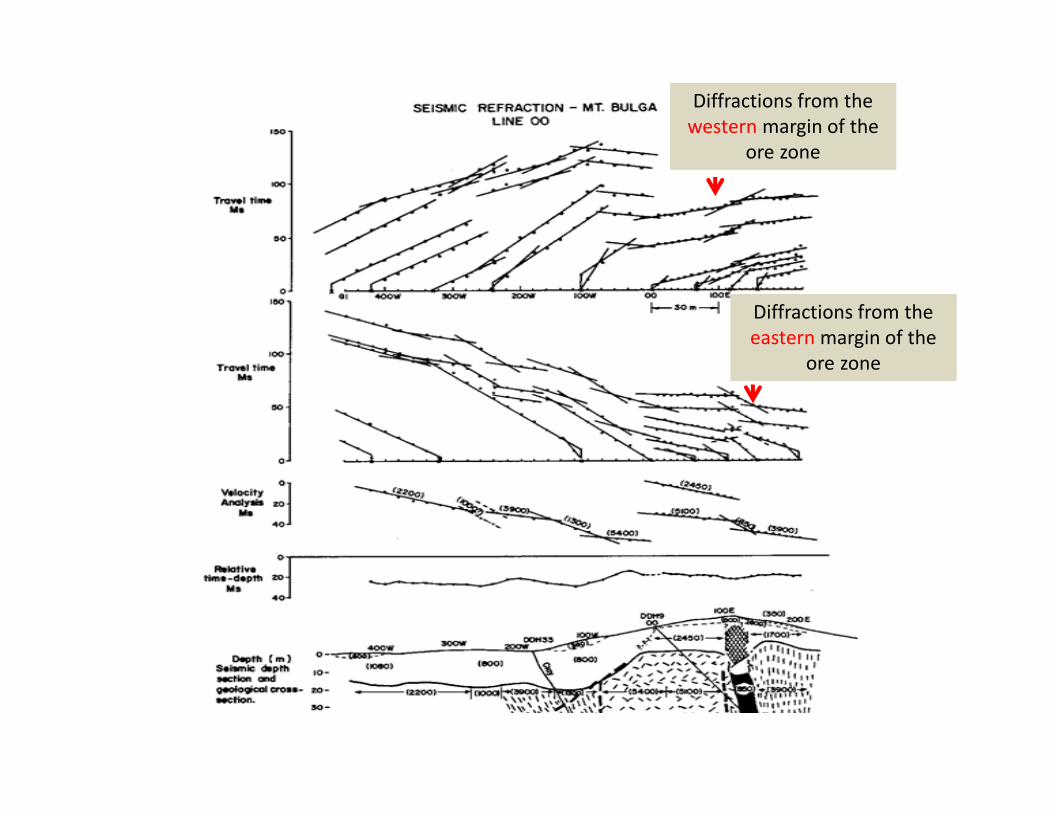
Diffractions from the
western margin of the
ore zone
Diffractions from the
eastern margin of the
ore zone
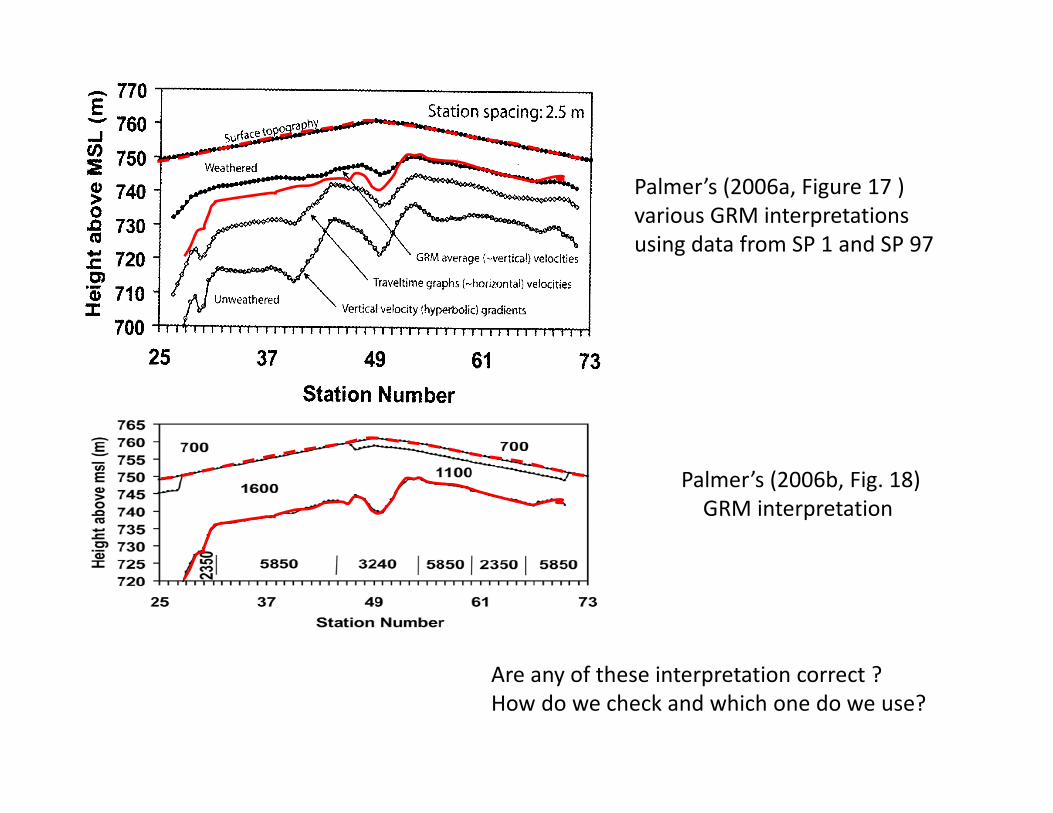
Palmer’s (2006a, Figure 17 )
various GRM interpretations
using data from SP 1 and SP 97
Palmer’s (2006b, Fig. 18)
GRM interpretation
Are any of these interpretation correct ?
How do we check and which one do we use?
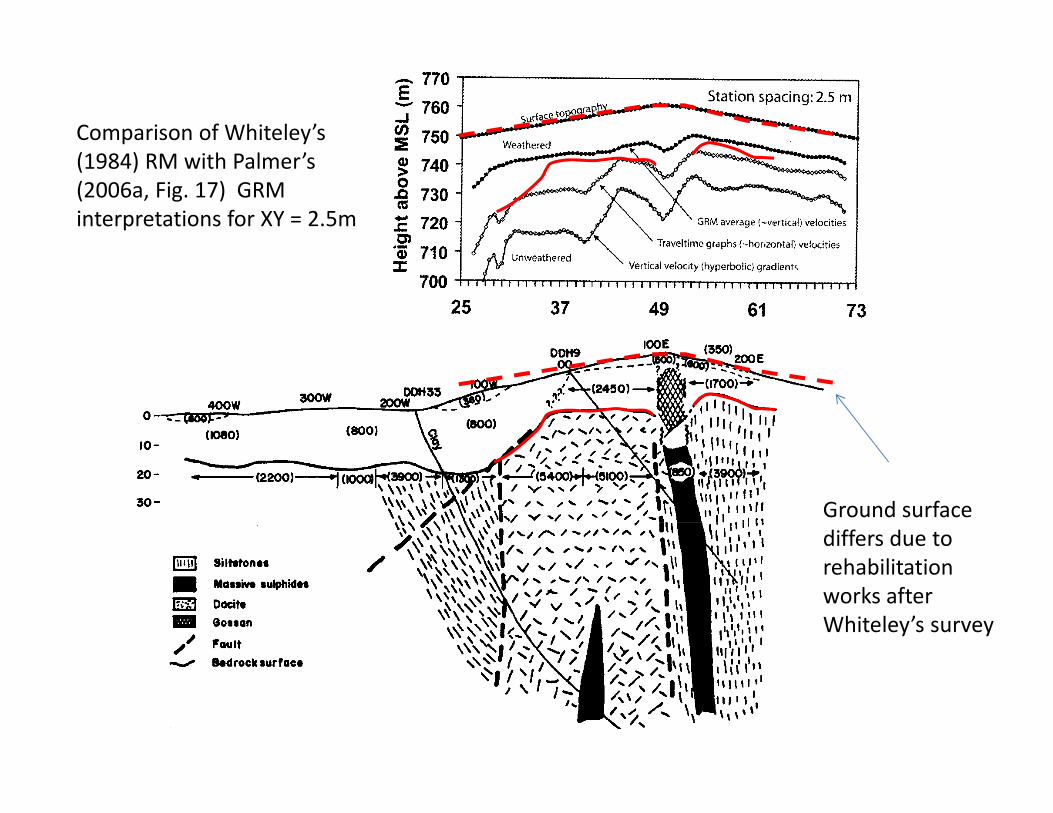
Ground surface
differs due to
rehabilitation
works after
Whiteley’s survey
Comparison of Whiteley’s
(1984) RM with Palmer’s
(2006a, Fig. 17) GRM
interpretations for XY = 2.5m
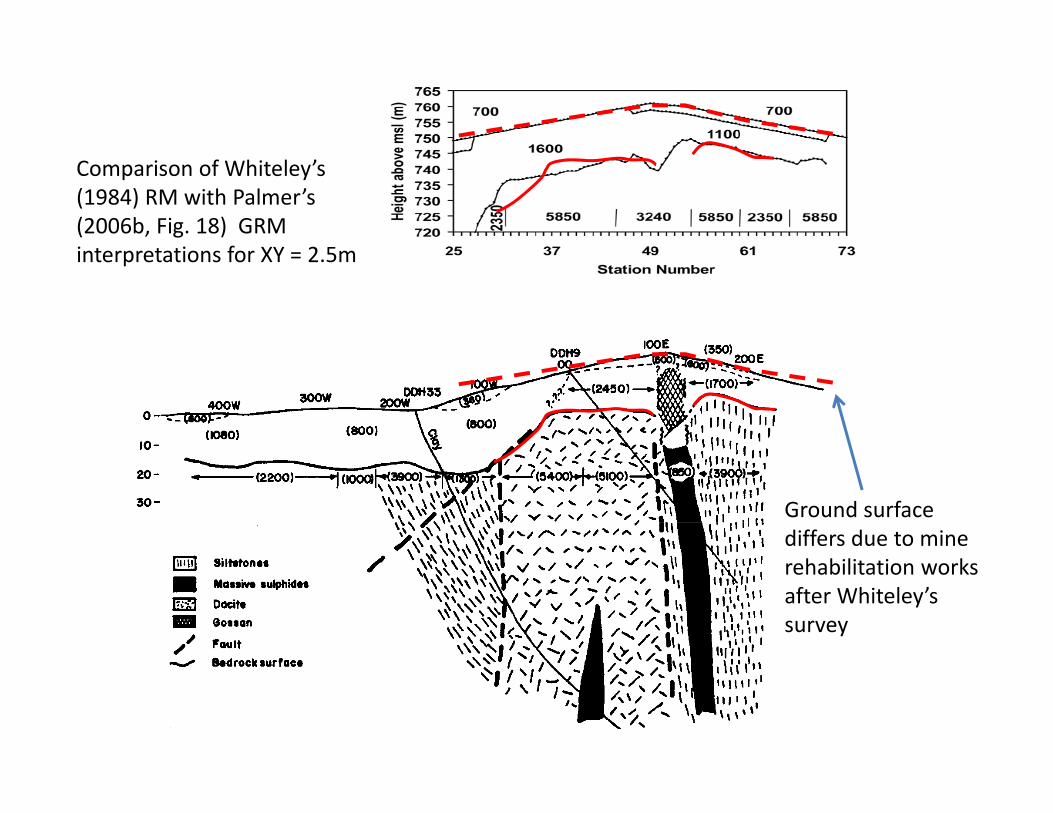
Comparison of Whiteley’s
(1984) RM with Palmer’s
(2006b, Fig. 18) GRM
interpretations for XY = 2.5m
Ground surface
differs due to mine
rehabilitation works
after Whiteley’s
survey
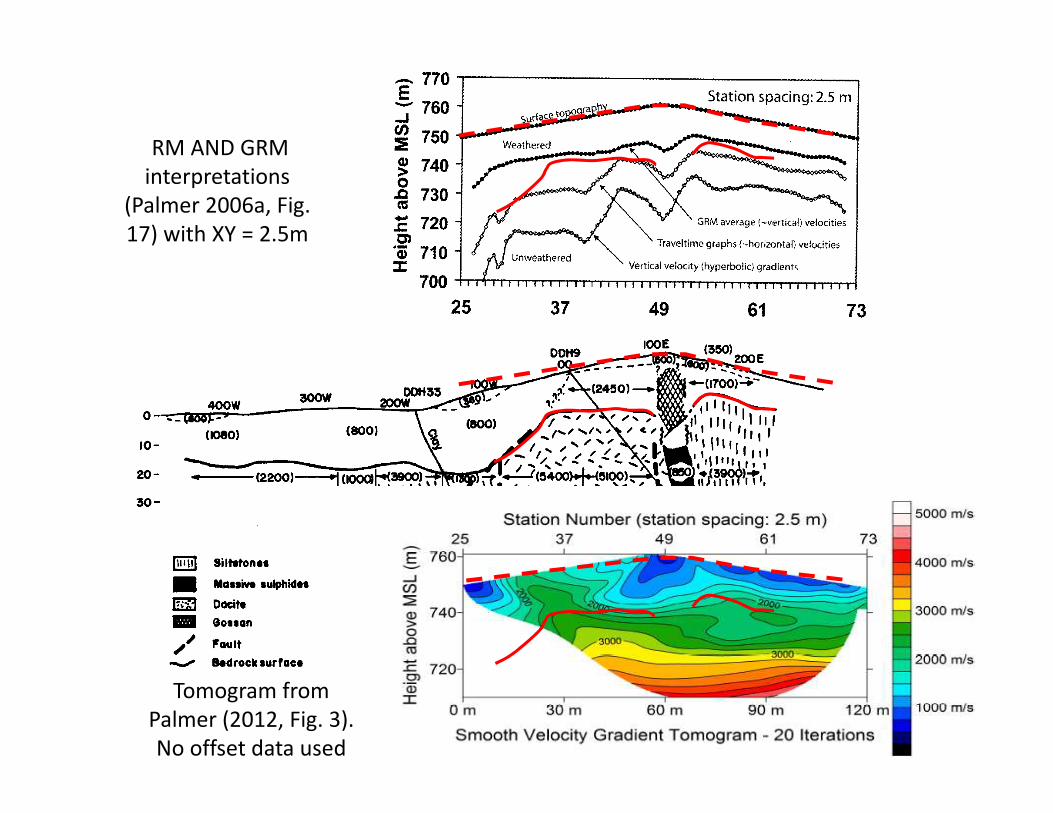
RM AND GRM
interpretations
(Palmer 2006a, Fig.
17) with XY = 2.5m
Tomogram from
Palmer (2012, Fig. 3).
No offset data used
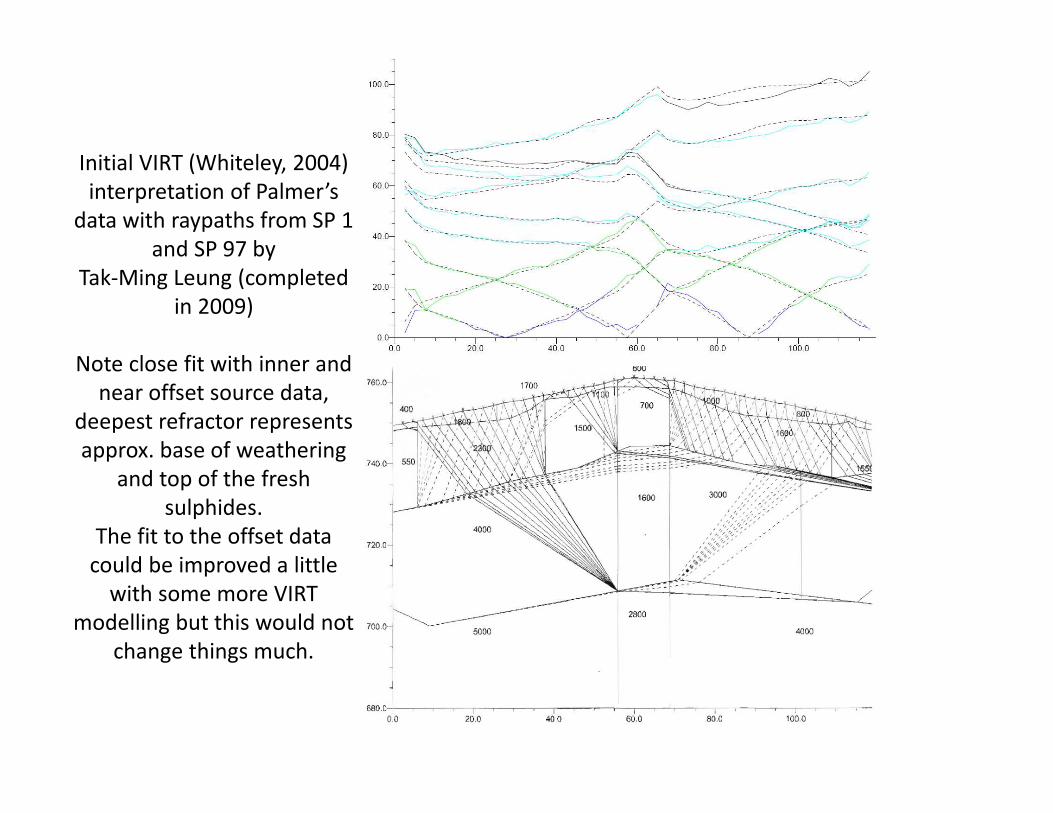
Initial VIRT (Whiteley, 2004)
interpretation of Palmer’s
data with raypaths from SP 1
and SP 97 by
Tak-Ming Leung (completed
in 2009)
Note close fit with inner and
near offset source data,
deepest refractor represents
approx. base of weathering
and top of the fresh
sulphides.
The fit to the offset data
could be improved a little
with some more VIRT
modelling but this would not
change things much.
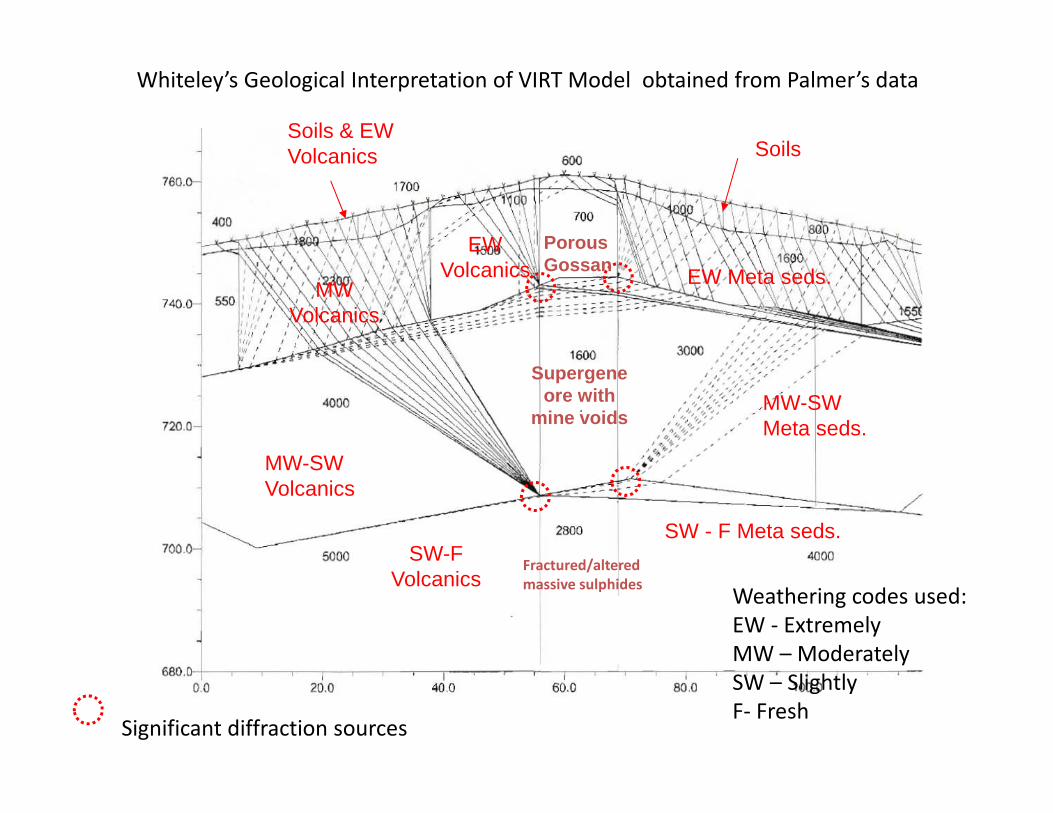
MW-SW Volcanics
SW-F Volcanics
MW Volcanics
EW Volcanics
Soils & EW Volcanics
SW - F Meta seds.
MW-SW Meta seds.
EW Meta seds.
Soils
Porous Gossan
Supergene ore with
mine voids
Fractured/altered
massive sulphides
Whiteley’s Geological Interpretation of VIRT Model obtained from Palmer’s data
Significant diffraction sources
Weathering codes used:
EW - Extremely
MW – Moderately
SW – Slightly
F- Fresh
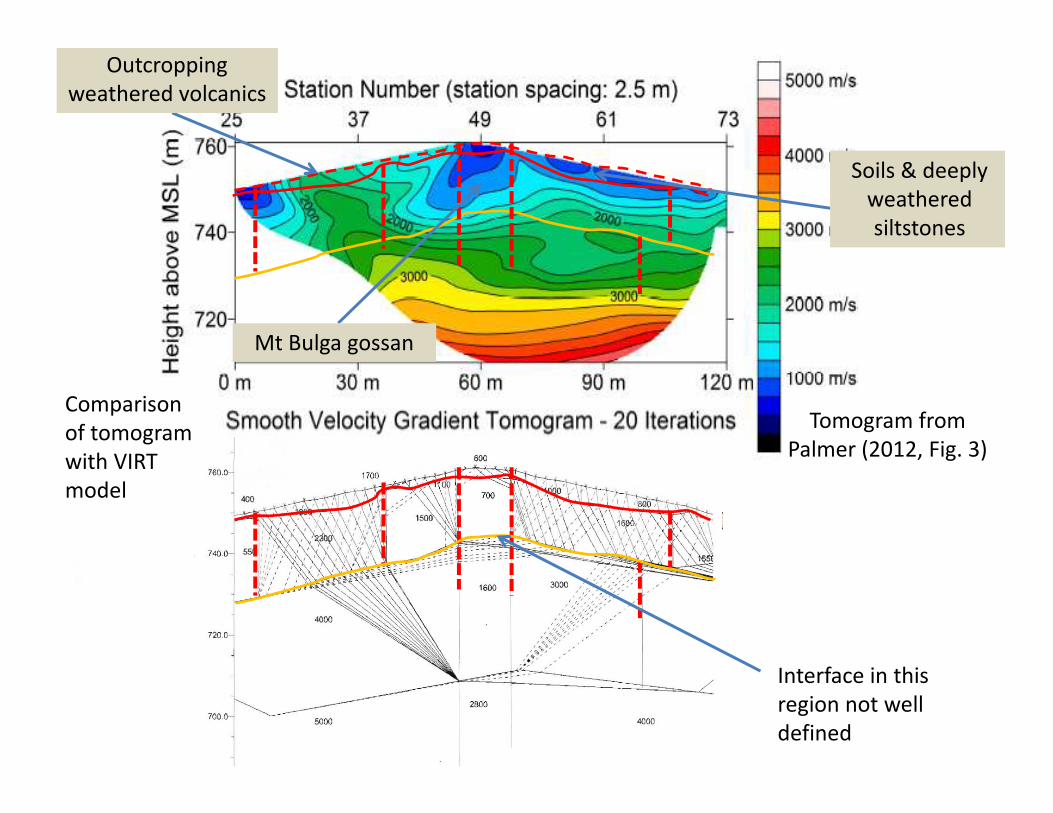
Interface in this
region not well
defined
Tomogram from
Palmer (2012, Fig. 3)
Comparison
of tomogram
with VIRT
model
Outcropping
weathered volcanics
Mt Bulga gossan
Soils & deeply
weathered
siltstones
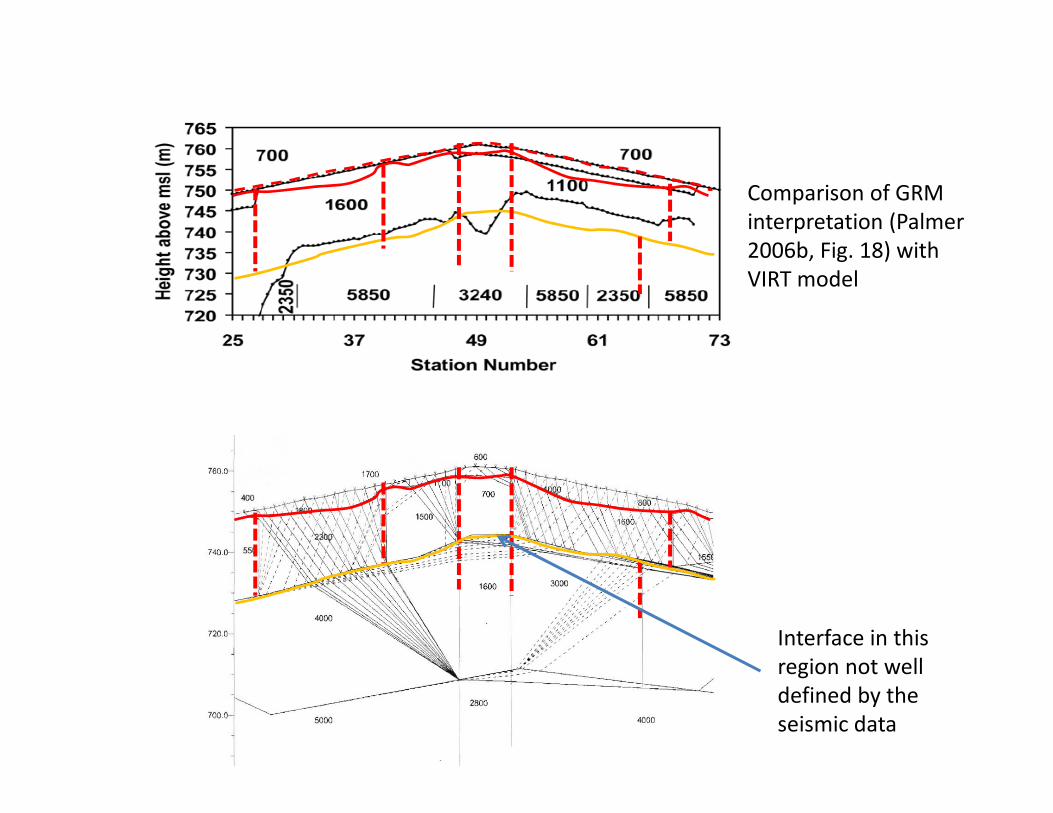
Interface in this
region not well
defined by the
seismic data
Comparison of GRM
interpretation (Palmer
2006b, Fig. 18) with
VIRT model
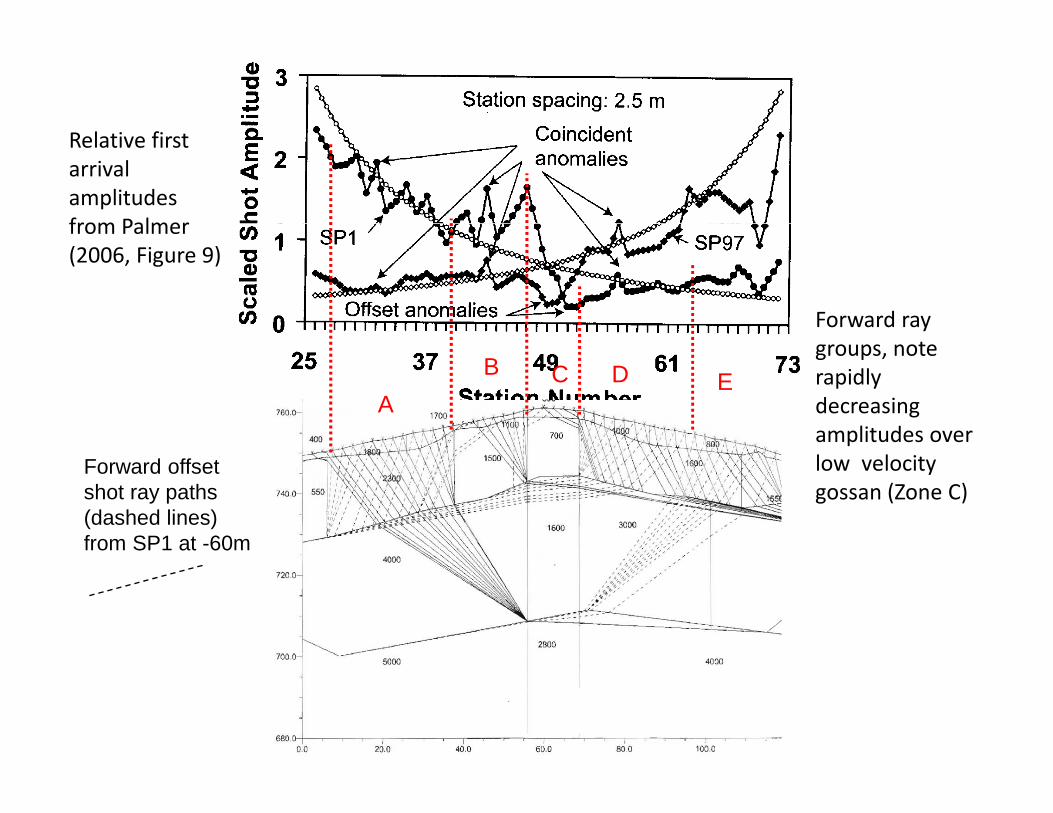
Forward offset shot ray paths (dashed lines) from SP1 at -60m
A
B C D E
Relative first
arrival
amplitudes
from Palmer
(2006, Figure 9)
Forward ray
groups, note
rapidly
decreasing
amplitudes over
low velocity
gossan (Zone C)
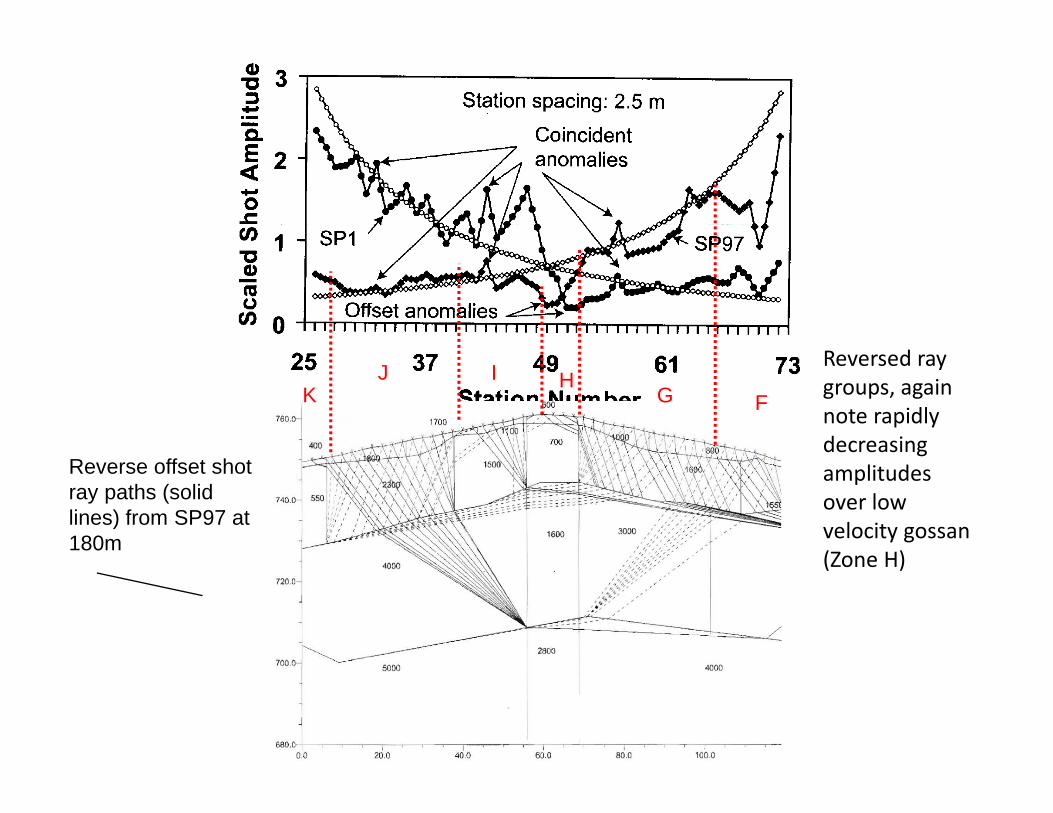
FGHIJ
K
Reverse offset shot ray paths (solid lines) from SP97 at 180m
Reversed ray
groups, again
note rapidly
decreasing
amplitudes
over low
velocity gossan
(Zone H)
Comments:
• Dr Palmer’s GRM interpretations on Line 00 at Mt. Bulga are
inconsistent with the assumptions contained within the GRM
• Comparison between tomographic images from various GRM
starting models in Palmer (2012) is technically questionable as
the inversion process has not used the offset TX data used for
the GRM models. So what is being compared?
• First arrival amplitude behaviour is inconsistent with Palmer’s
GRM interpretations
Prof. Bob Whiteley, Feb. 2012


![Grm p1 Final[1]](https://img.pdfslide.net/doc/110x75/577cdfdb1a28ab9e78b222b6/grm-p1-final1.jpg)