Embed Size (px)
Citation preview
Examination of the Influence of Institutional Context on Time-To-
Degree/Program Graduation Rates at Non-Traditional Distance University
Edward Hans Kofi Acquah, PhD.Senior Institutional Analyst
May 28, 2008: 11:40-12:20amAssociation for Institutional Research2008 Annual Conference, Seattle WA
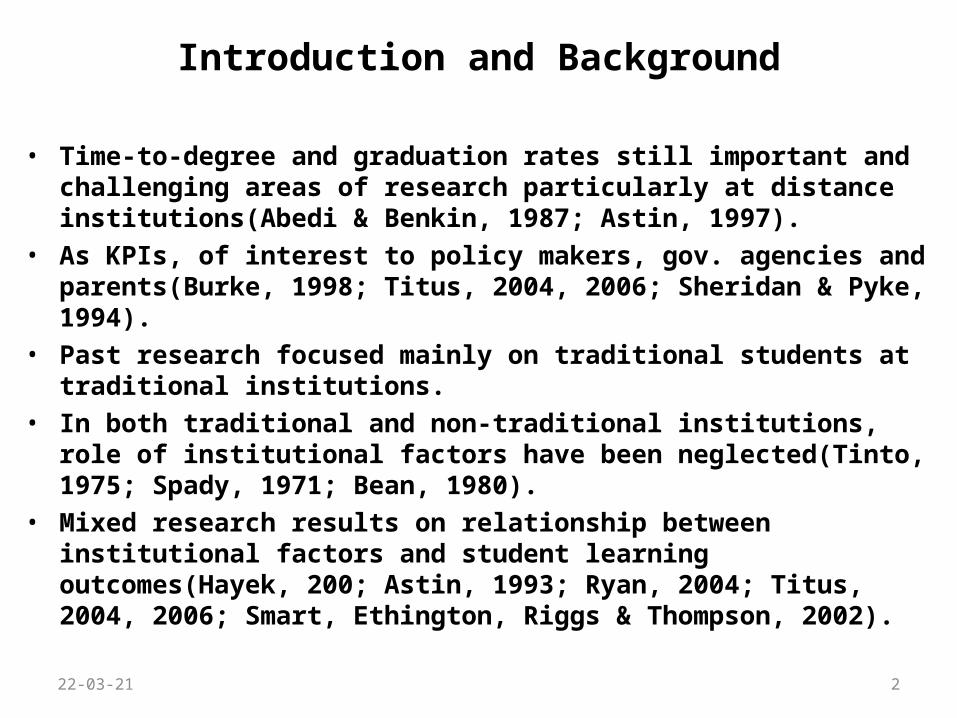
Introduction and Background
• Time-to-degree and graduation rates still important and challenging areas of research particularly at distance institutions(Abedi & Benkin, 1987; Astin, 1997).
• As KPIs, of interest to policy makers, gov. agencies and parents(Burke, 1998; Titus, 2004, 2006; Sheridan & Pyke, 1994).
• Past research focused mainly on traditional students at traditional institutions.
• In both traditional and non-traditional institutions, role of institutional factors have been neglected(Tinto, 1975; Spady, 1971; Bean, 1980).
• Mixed research results on relationship between institutional factors and student learning outcomes(Hayek, 200; Astin, 1993; Ryan, 2004; Titus, 2004, 2006; Smart, Ethington, Riggs & Thompson, 2002).
23-04-18 2
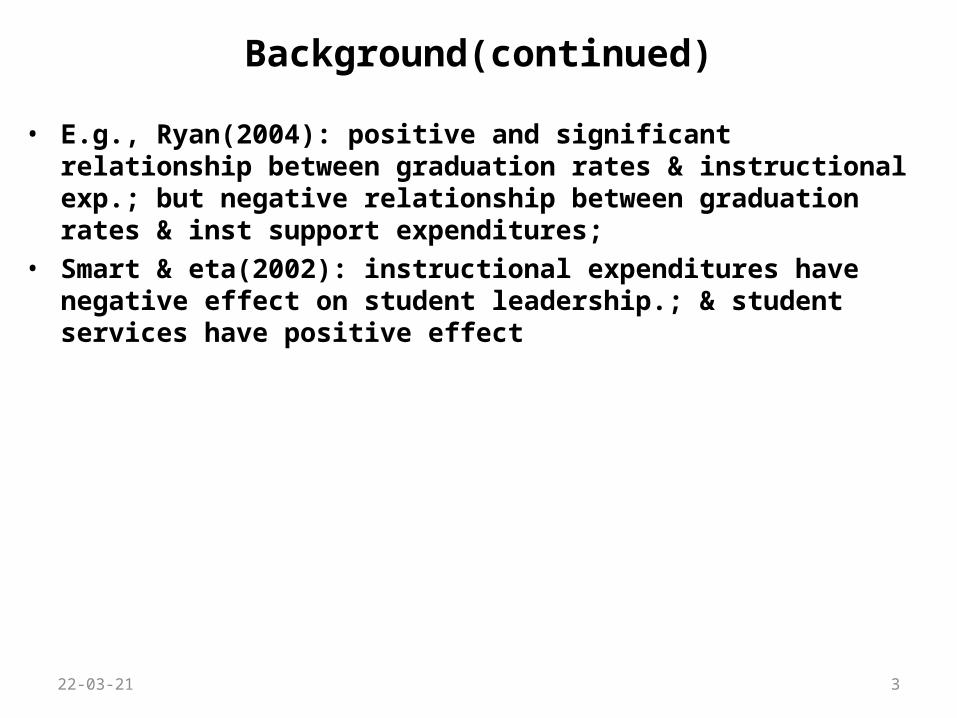
Background(continued)
• E.g., Ryan(2004): positive and significant relationship between graduation rates & instructional exp.; but negative relationship between graduation rates & inst support expenditures;
• Smart & eta(2002): instructional expenditures have negative effect on student leadership.; & student services have positive effect
23-04-18 3
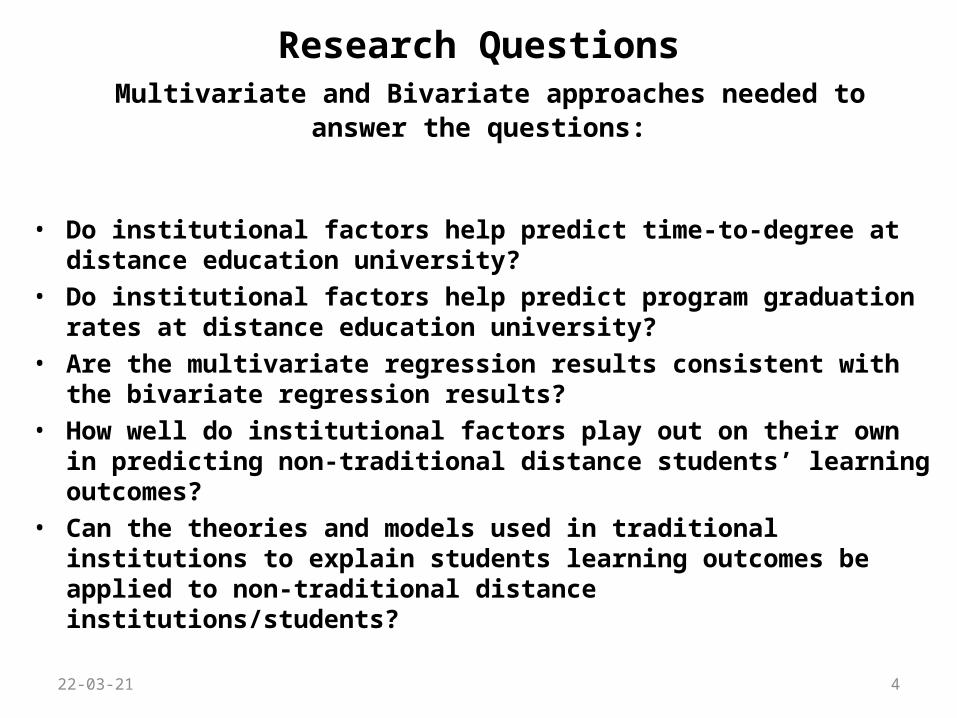
Research Questions Multivariate and Bivariate approaches needed to answer the questions:
• Do institutional factors help predict time-to-degree at distance education university?
• Do institutional factors help predict program graduation rates at distance education university?
• Are the multivariate regression results consistent with the bivariate regression results?
• How well do institutional factors play out on their own in predicting non-traditional distance students’ learning outcomes?
• Can the theories and models used in traditional institutions to explain students learning outcomes be applied to non-traditional distance institutions/students?
23-04-18 4
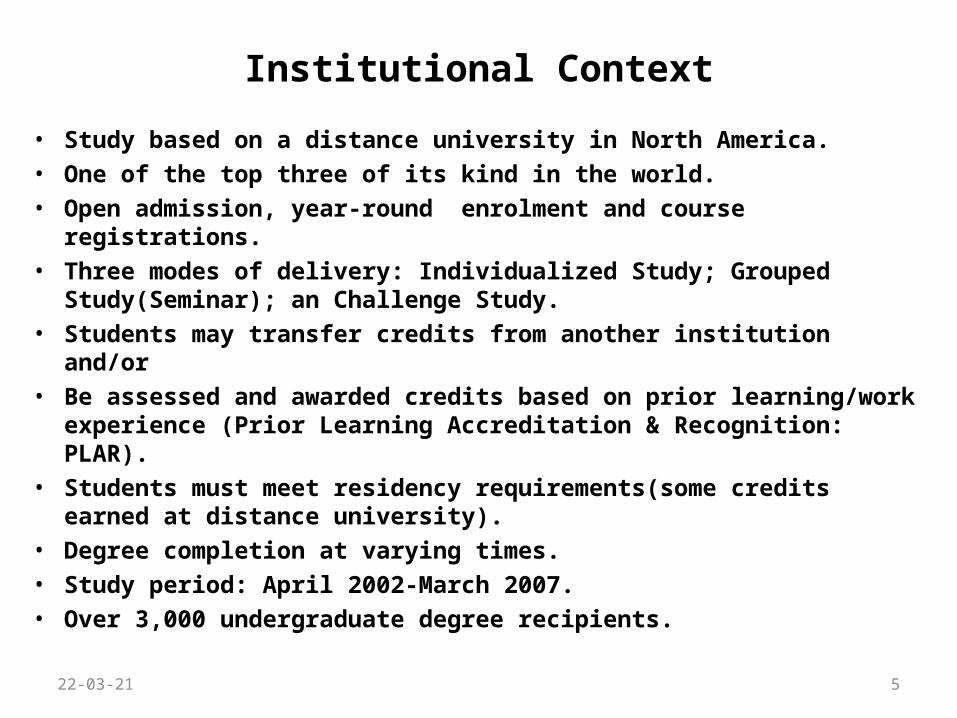
Institutional Context
• Study based on a distance university in North America.
• One of the top three of its kind in the world.
• Open admission, year-round enrolment and course registrations.
• Three modes of delivery: Individualized Study; Grouped Study(Seminar); an Challenge Study.
• Students may transfer credits from another institution and/or
• Be assessed and awarded credits based on prior learning/work experience (Prior Learning Accreditation & Recognition: PLAR).
• Students must meet residency requirements(some credits earned at distance university).
• Degree completion at varying times.
• Study period: April 2002-March 2007.
• Over 3,000 undergraduate degree recipients.
23-04-18 5
DATA AND VARIABLE DESCRIPTIONS
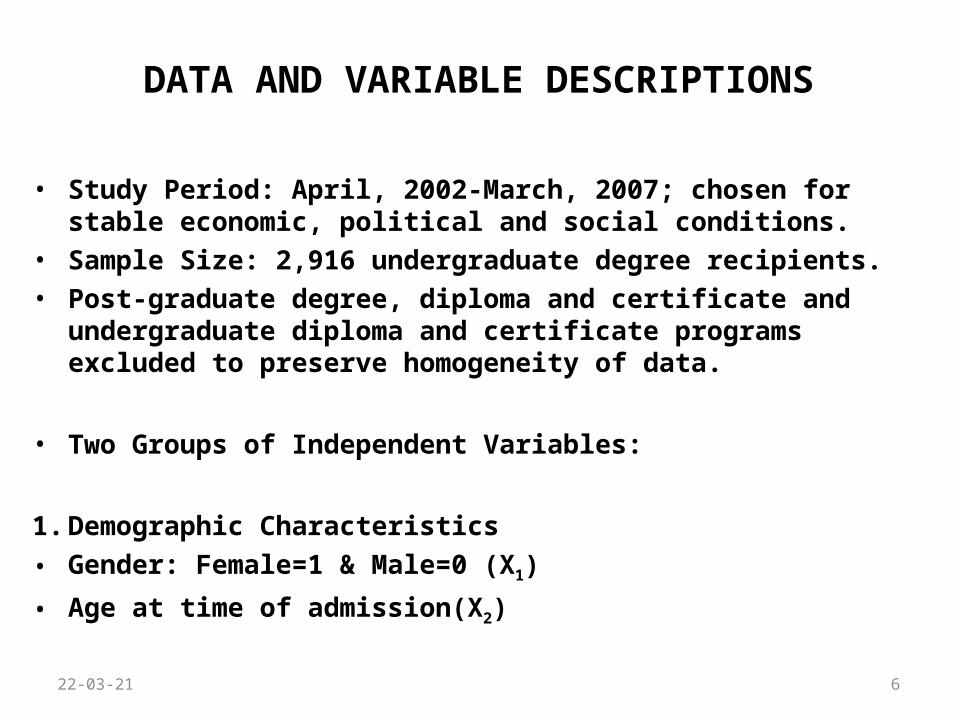
• Study Period: April, 2002-March, 2007; chosen for stable economic, political and social conditions.
• Sample Size: 2,916 undergraduate degree recipients.
• Post-graduate degree, diploma and certificate and undergraduate diploma and certificate programs excluded to preserve homogeneity of data.
• Two Groups of Independent Variables:
1. Demographic Characteristics
• Gender: Female=1 & Male=0 (X1)
• Age at time of admission(X2)
23-04-18 6
DATA AND VARIABLE DESCRIPTION
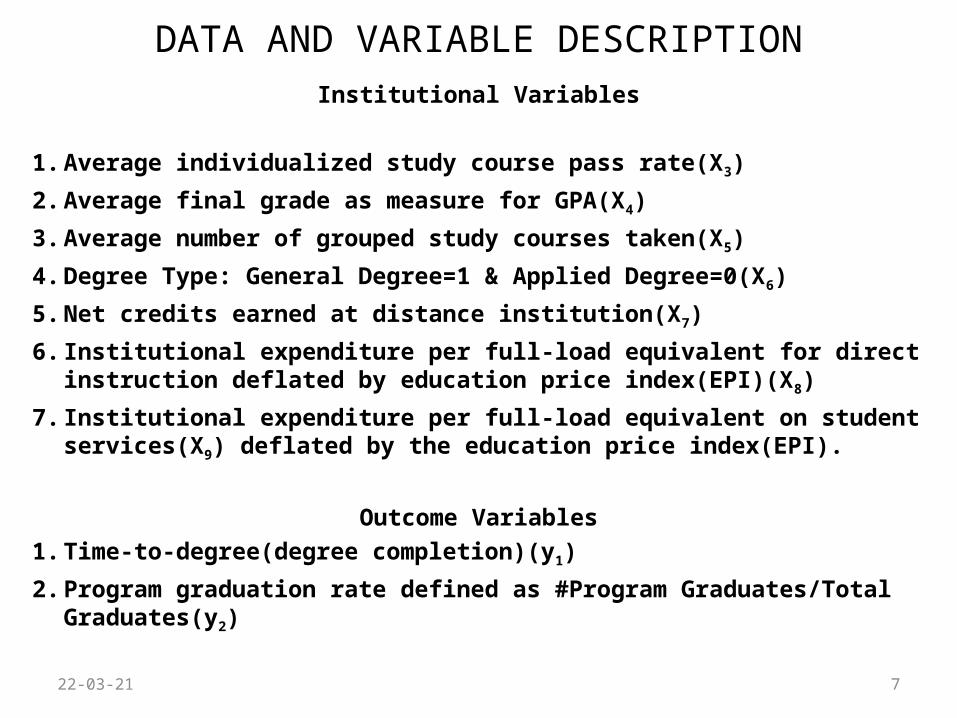
Institutional Variables
1. Average individualized study course pass rate(X3)
2. Average final grade as measure for GPA(X4)
3. Average number of grouped study courses taken(X5)
4. Degree Type: General Degree=1 & Applied Degree=0(X6)
5. Net credits earned at distance institution(X7)
6. Institutional expenditure per full-load equivalent for direct instruction deflated by education price index(EPI)(X8)
7. Institutional expenditure per full-load equivalent on student services(X9) deflated by the education price index(EPI).
Outcome Variables
1. Time-to-degree(degree completion)(y1)
2. Program graduation rate defined as #Program Graduates/Total Graduates(y2)23-04-18 7
REASONS FOR VARIABLE CHOICE
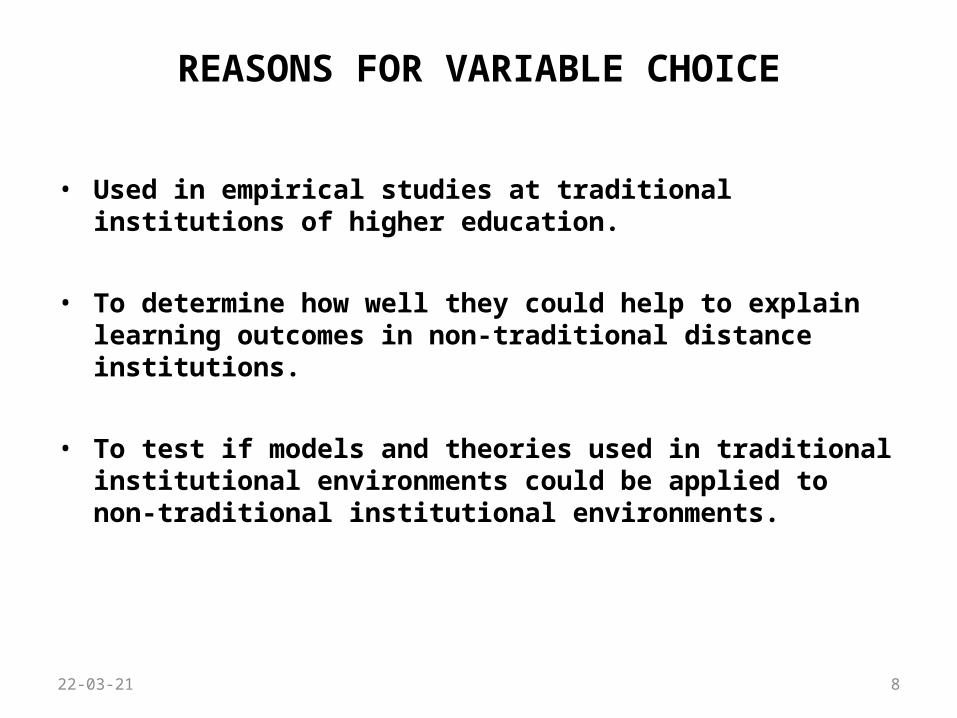
• Used in empirical studies at traditional institutions of higher education.
• To determine how well they could help to explain learning outcomes in non-traditional distance institutions.
• To test if models and theories used in traditional institutional environments could be applied to non-traditional institutional environments.
23-04-18 8
ANALYTICAL FRAMEWORK
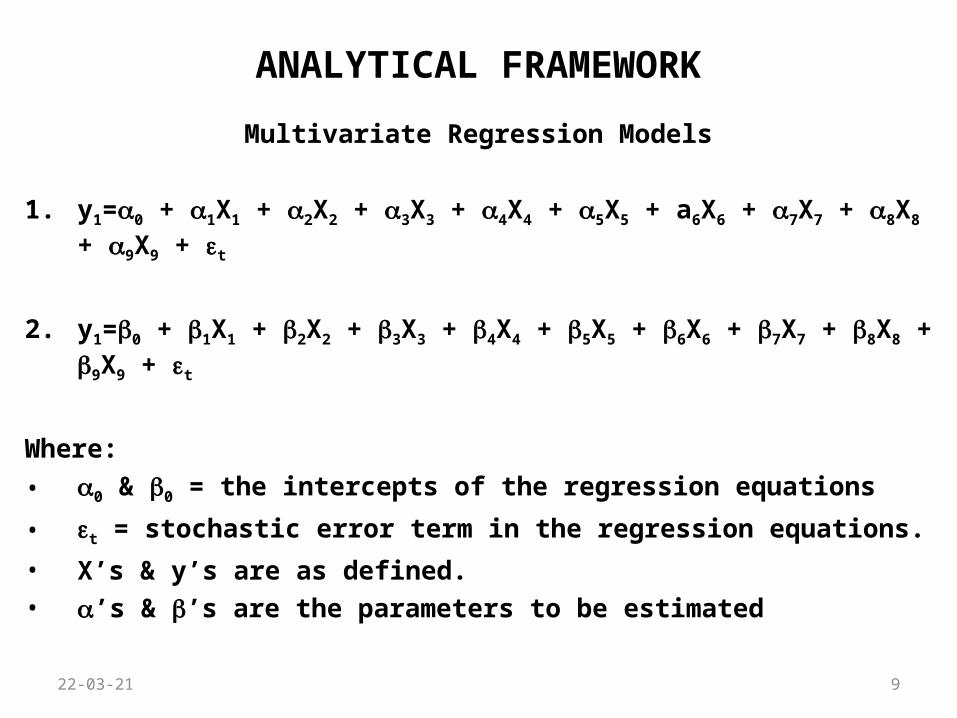
Multivariate Regression Models
1. y1=0 + 1X1 + 2X2 + 3X3 + 4X4 + 5X5 + a6X6 + 7X7 + 8X8 + 9X9 + t
2. y1=0 + 1X1 + 2X2 + 3X3 + 4X4 + 5X5 + 6X6 + 7X7 + 8X8 + 9X9 + t
Where:
• 0 & 0 = the intercepts of the regression equations
• t = stochastic error term in the regression equations.
• X’s & y’s are as defined.
• ’s & ’s are the parameters to be estimated
23-04-18 9
ANALYTICAL FRAMEWORK(continued)
Model Assumptions
1. Assumptions of the Classical Linear Regression :
• Normally distributed residuals;
• Homoscedastic
• Serially uncorrelated , that is,
• t~N [0, 2I]
Predictor Variables:
• No a priori assumptions made regarding nature of their expected influence on dependent variables
23-04-18 10
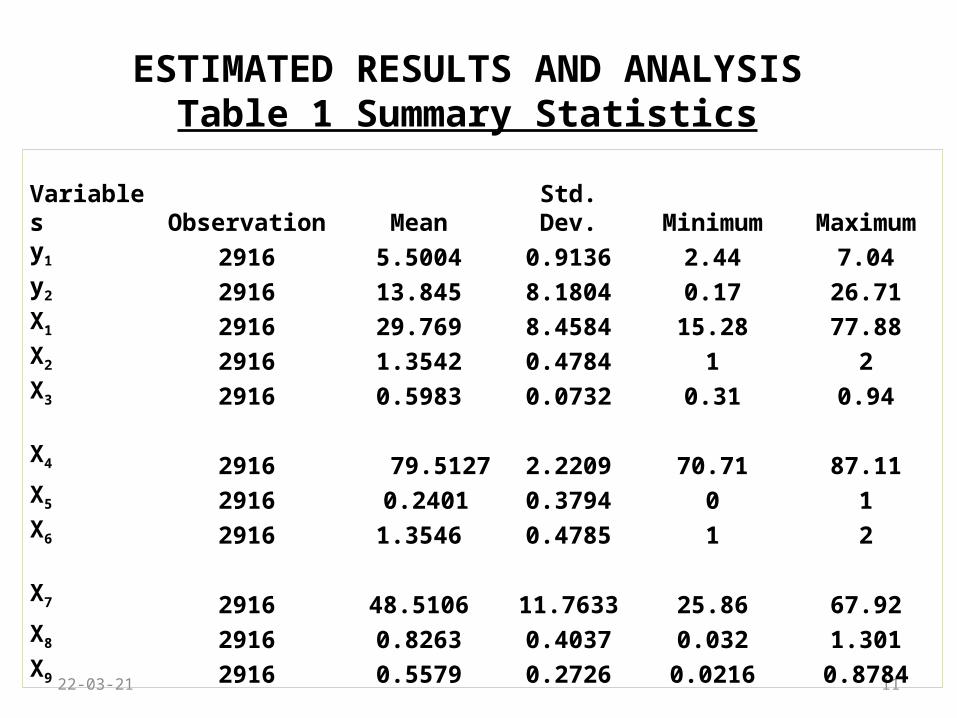
ESTIMATED RESULTS AND ANALYSISTable 1 Summary Statistics
23-04-18 11
Variables Observation Mean Std. Dev. Minimum Maximumy1 2916 5.5004 0.9136 2.44 7.04y2 2916 13.845 8.1804 0.17 26.71X1 2916 29.769 8.4584 15.28 77.88X2 2916 1.3542 0.4784 1 2X3 2916 0.5983 0.0732 0.31 0.94
X4 2916 79.5127 2.2209 70.71 87.11
X5 2916 0.2401 0.3794 0 1X6 2916 1.3546 0.4785 1 2
X7 2916 48.5106 11.7633 25.86 67.92X8 2916 0.8263 0.4037 0.032 1.301X9 2916 0.5579 0.2726 0.0216 0.8784
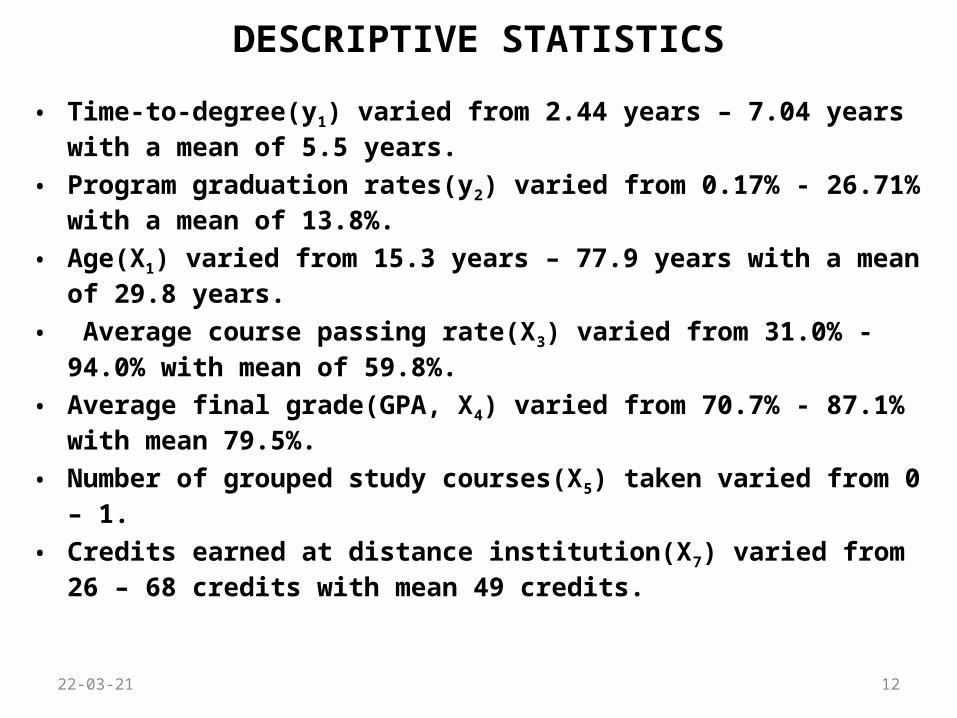
DESCRIPTIVE STATISTICS
• Time-to-degree(y1) varied from 2.44 years – 7.04 years with a mean of 5.5 years.
• Program graduation rates(y2) varied from 0.17% - 26.71% with a mean of 13.8%.
• Age(X1) varied from 15.3 years – 77.9 years with a mean of 29.8 years.
• Average course passing rate(X3) varied from 31.0% - 94.0% with mean of 59.8%.
• Average final grade(GPA, X4) varied from 70.7% - 87.1% with mean 79.5%.
• Number of grouped study courses(X5) taken varied from 0 – 1.
• Credits earned at distance institution(X7) varied from 26 – 68 credits with mean 49 credits.
23-04-18 12
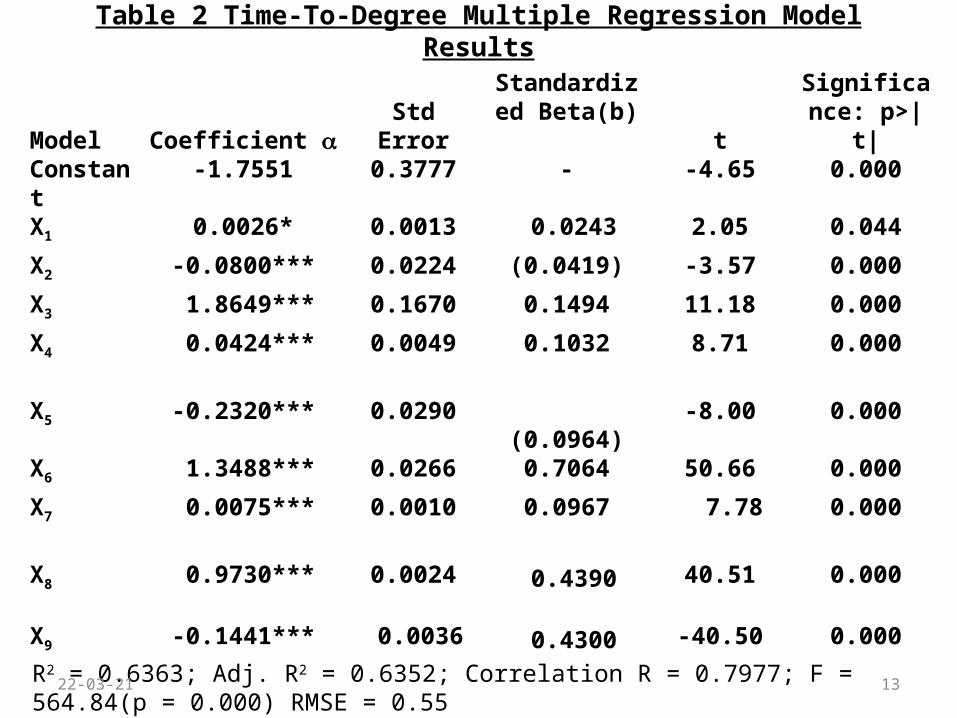
Table 2 Time-To-Degree Multiple Regression Model Results
Model Coefficient Std ErrorStandardized
Beta(b) tSignificance:
p>|t|Constant -1.7551 0.3777 - -4.65 0.000
X1 0.0026* 0.0013 0.0243 2.05 0.044
X2 -0.0800*** 0.0224 (0.0419) -3.57 0.000
X3 1.8649*** 0.1670 0.1494 11.18 0.000
X4 0.0424*** 0.0049 0.1032 8.71 0.000
X5 -0.2320*** 0.0290 (0.0964) -8.00 0.000
X6 1.3488*** 0.0266 0.7064 50.66 0.000
X7 0.0075*** 0.0010 0.0967 7.78 0.000
X8 0.9730***
0.0024 0.4390 40.51 0.000
X9 -0.1441***
0.0036 0.4300 -40.50 0.000
R2 = 0.6363; Adj. R2 = 0.6352; Correlation R = 0.7977; F = 564.84(p = 0.000) RMSE = 0.55*p<0.05; **p<0.01; ***p<0.001
23-04-18 13
Time-to-Degree Multiple Regression Results
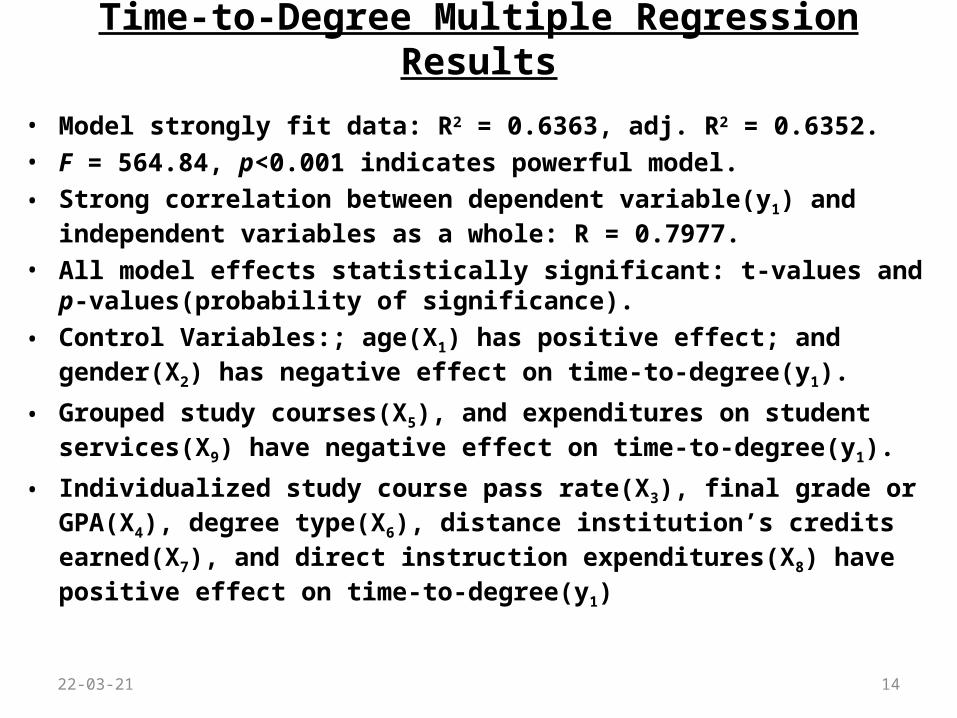
• Model strongly fit data: R2 = 0.6363, adj. R2 = 0.6352.
• F = 564.84, p<0.001 indicates powerful model.
• Strong correlation between dependent variable(y1) and independent variables as a whole: R = 0.7977.
• All model effects statistically significant: t-values and p-values(probability of significance).
• Control Variables:; age(X1) has positive effect; and gender(X2) has negative effect on time-to-degree(y1).
• Grouped study courses(X5), and expenditures on student services(X9) have negative effect on time-to-degree(y1).
• Individualized study course pass rate(X3), final grade or GPA(X4), degree type(X6), distance institution’s credits earned(X7), and direct instruction expenditures(X8) have positive effect on time-to-degree(y1)
23-04-18 14
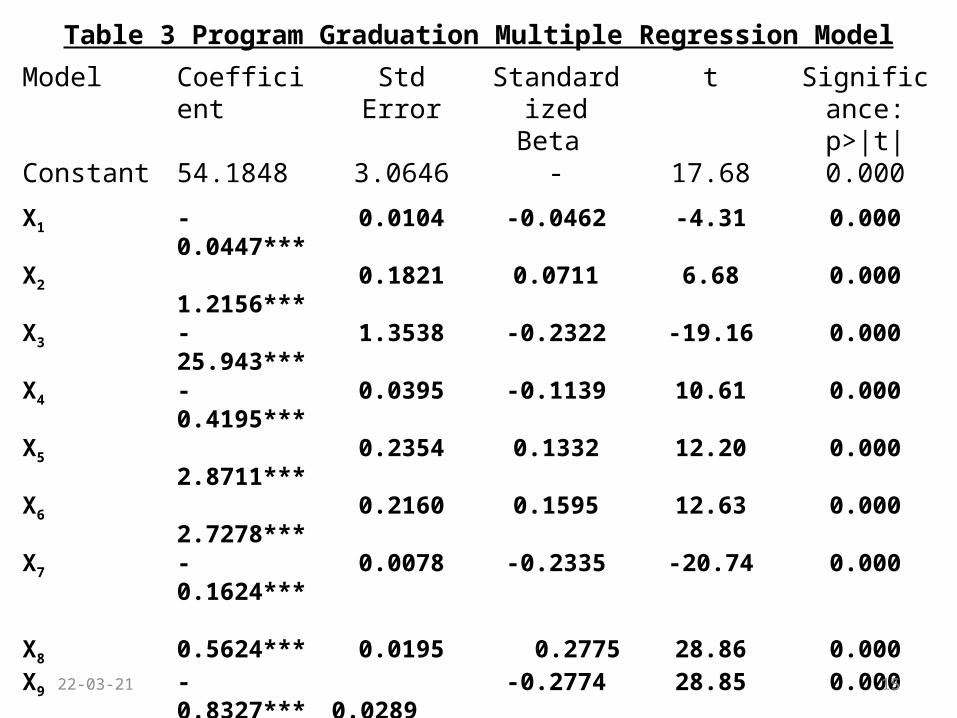
Table 3 Program Graduation Multiple Regression Model
Model Coefficient Std Error Standardized Beta
t Significance: p>|t|
Constant 54.1848 3.0646 - 17.68 0.000
X1 -0.0447*** 0.0104 -0.0462 -4.31 0.000
X2 1.2156*** 0.1821 0.0711 6.68 0.000
X3 -25.943*** 1.3538 -0.2322 -19.16 0.000
X4 -0.4195*** 0.0395 -0.1139 10.61 0.000
X5 2.8711*** 0.2354 0.1332 12.20 0.000
X6 2.7278*** 0.2160 0.1595 12.63 0.000
X7 -0.1624*** 0.0078 -0.2335 -20.74 0.000
X8
0.5624*** 0.0195
0.2775 28.86 0.000
X9 -0.8327*** 0.0289 -0.2774 28.85 0.000
R2 = 0.014; adj R2 = 0.7005; Correlation R = 0.8375; F = 758.41(p = 0.000) RMSE = 4.477*p<0.05; **p<0.01; ***p<0.001
23-04-18 15

Graduation Rates Multiple Regression Results
• Model strongly fit data: R2 = 0.7014, adj. R2 = 0.7005.
• F = 758.41, p<0.001 indicates powerful model.
• Strong correlation between dependent variable(y2) and independent variables as a whole: R = 0.8375.
• All model effects statistically significant: t-values and p-values (probability of significance).
• Control Variables: age(X1) has negative effect; gender(X2) has positive effect on program graduation rates(y2).
• Individualized study course pass rate(X3), GPA(X4), distance university credits(X7), and expenditures on student services(X9) have negative effect on program graduation rates(y2).
• Grouped study course taken (X5), degree type(X6), and direct instructional expenditures(X8) have positive effect on program graduation rates(y2).
23-04-18 16
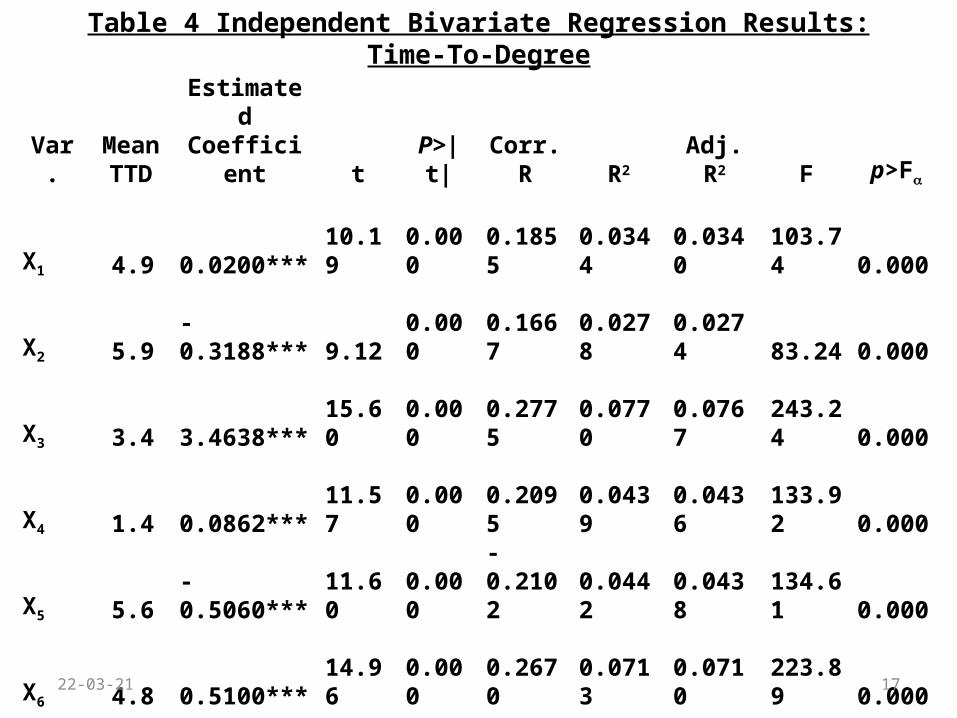
Table 4 Independent Bivariate Regression Results: Time-To-Degree
Var.Mean TTD
EstimatedCoefficient t P>|t|
Corr.R R2 Adj. R2 F p>F
X1 4.9 0.0200*** 10.19 0.000 0.1855 0.0344 0.0340 103.74 0.000
X2 5.9 -0.3188*** 9.12 0.000 0.1667 0.0278 0.0274 83.24 0.000
X3 3.4 3.4638*** 15.60 0.000 0.2775 0.0770 0.0767 243.24 0.000
X4 1.4 0.0862*** 11.57 0.000 0.2095 0.0439 0.0436 133.92 0.000
X5 5.6 -0.5060*** 11.60 0.000 -0.2102 0.0442 0.0438 134.61 0.000
X6 4.8 0.5100*** 14.96 0.000 0.2670 0.0713 0.0710 223.89 0.000
X7 5.2 0.0063*** 4.44 0.000 0.0819 0.0067 0.0064 19.68 0.000
X8 4.8 0.7943*** 20.23 0.000 0.3510 0.1232 0.1229 409.44 0.000
X9 4.8 1.1764*** 20.23 0.000 0.3510 0.1232 0.1229 409.44 0.000
*p<0.05; **p<0.01; ***p<0.001
23-04-18 17
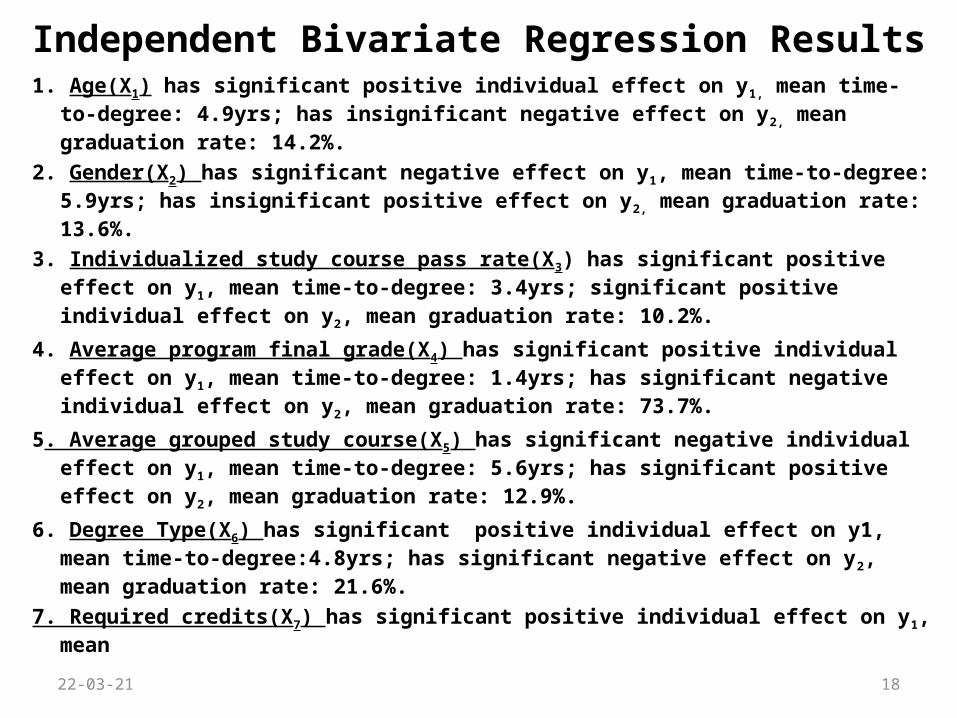
Independent Bivariate Regression Results 1. Age(X1) has significant positive individual effect on y1, mean time-to-degree:
4.9yrs; has insignificant negative effect on y2, mean graduation rate: 14.2%.
2. Gender(X2) has significant negative effect on y1, mean time-to-degree: 5.9yrs; has insignificant positive effect on y2, mean graduation rate: 13.6%.
3. Individualized study course pass rate(X3) has significant positive effect on y1, mean time-to-degree: 3.4yrs; significant positive individual effect on y2, mean graduation rate: 10.2%.
4. Average program final grade(X4) has significant positive individual effect on y1, mean time-to-degree: 1.4yrs; has significant negative individual effect on y2, mean graduation rate: 73.7%.
5. Average grouped study course(X5) has significant negative individual effect on y1, mean time-to-degree: 5.6yrs; has significant positive effect on y2, mean graduation rate: 12.9%.
6. Degree Type(X6) has significant positive individual effect on y1, mean time-to-degree:4.8yrs; has significant negative effect on y2, mean graduation rate: 21.6%.
7. Required credits(X7) has significant positive individual effect on y1, mean 23-04-18 18
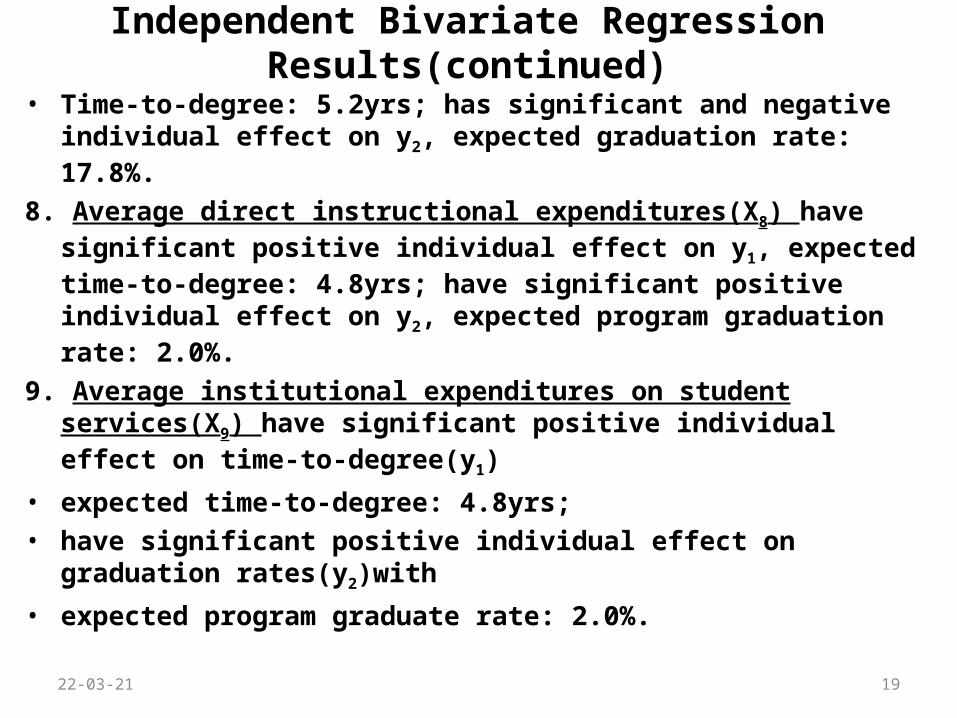
Independent Bivariate Regression Results(continued)
• Time-to-degree: 5.2yrs; has significant and negative individual effect on y2, expected graduation rate: 17.8%.
8. Average direct instructional expenditures(X8) have significant positive individual effect on y1, expected time-to-degree: 4.8yrs; have significant positive individual effect on y2, expected program graduation rate: 2.0%.
9. Average institutional expenditures on student services(X9) have significant positive individual effect on time-to-degree(y1)
• expected time-to-degree: 4.8yrs;
• have significant positive individual effect on graduation rates(y2)with
• expected program graduate rate: 2.0%.
23-04-18 19
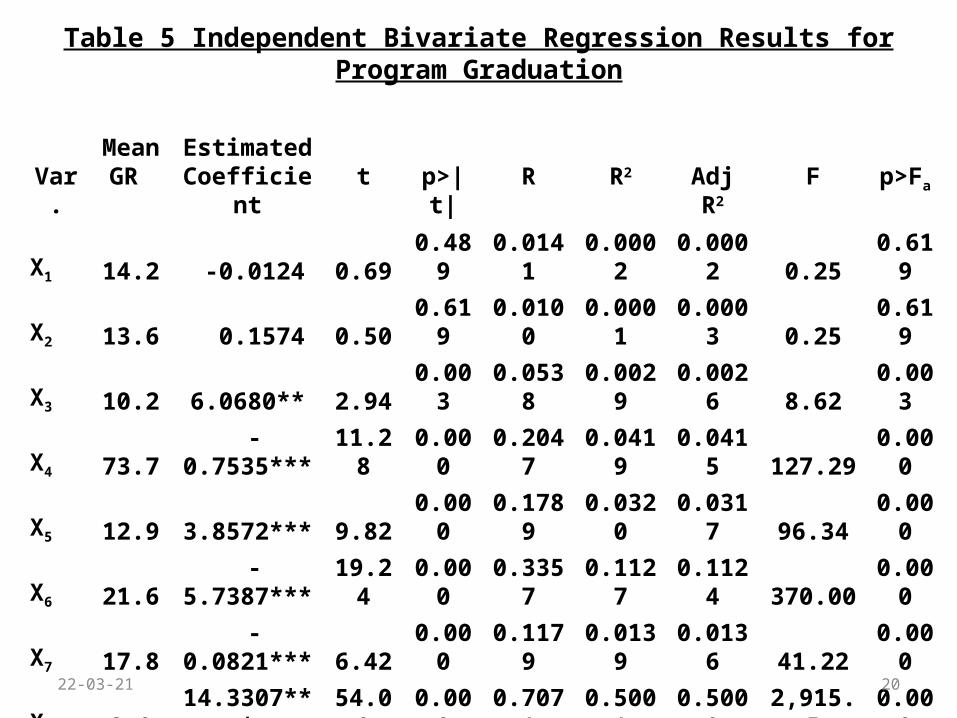
Table 5 Independent Bivariate Regression Results for Program Graduation
Var.MeanGR
EstimatedCoefficient t p>|t| R R2 Adj R2 F p>Fa
X1 14.2 -0.0124 0.69 0.489 0.0141 0.0002 0.0002 0.25 0.619
X2 13.6 0.1574 0.50 0.619 0.0100 0.0001 0.0003 0.25 0.619
X3 10.2 6.0680** 2.94 0.003 0.0538 0.0029 0.0026 8.62 0.003
X4 73.7 -0.7535*** 11.28 0.000 0.2047 0.0419 0.0415 127.29 0.000
X5 12.9 3.8572*** 9.82 0.000 0.1789 0.0320 0.0317 96.34 0.000
X6 21.6 -5.7387*** 19.24 0.000 0.3357 0.1127 0.1124 370.00 0.000
X7 17.8 -0.0821*** 6.42 0.000 0.1179 0.0139 0.0136 41.22 0.000
X8 2.0 14.3307*** 54.00 0.000 0.7071 0.5001 0.5000 2,915.5 0.000
X9 2.0 21.2251*** 53.99 0.000 0.7071 0.5001 0.4999 2,915.0 0.000
*p<0.05 **p<0.01 ***p<0.001
23-04-18 20
DISCUSSION AND IMPLICATIONS
• Results confirm some results found in traditional institutions.
• That institutional factors influence time-to-degree and graduation rates.
1. DIRECT INSTRUCTIONAL EXPENDITURES:
• have positive effect on time-to-degree and program graduation rates.
• consistent with previous results(Ryan, 2004) and partly confirm Astin’s(1993) conclusions regarding effects of institutional expenditures on learning outcomes.
• inconsistent with other results (Belfield and Thomas, 2000): no significant relationship between expenditures and student performance.
• Positive relationship means increases in instructional expenditures will increase time-to-degree(retention) & improve graduation rates.
23-04-18 21
DISCUSSION(continued)2. EXPENDITURES ON STUDENT SERVICES:
• Have significant and negative effect on y1 and y2.
• Consistent with results obtained by Ryan(2004).
• Contradict positive effects hypothesized by Astin(1993) & positive results obtained by Smart et. Al(2002).
• Negative effect means expenditures on students services shortens time-to-degree but leads to decreasing rate of return in terms of graduation rates.
3. CREDITS REQUIRED TO EARN AT DISTANCE INSTITUTION:
• Have significant positive effect on time-to-degree(y1) but significant negative effect on graduation rates(y2).
• Indicates the more the credits the longer the time-to-degree & the lower the graduation rates.
23-04-18 22
DISCUSSION(continued)
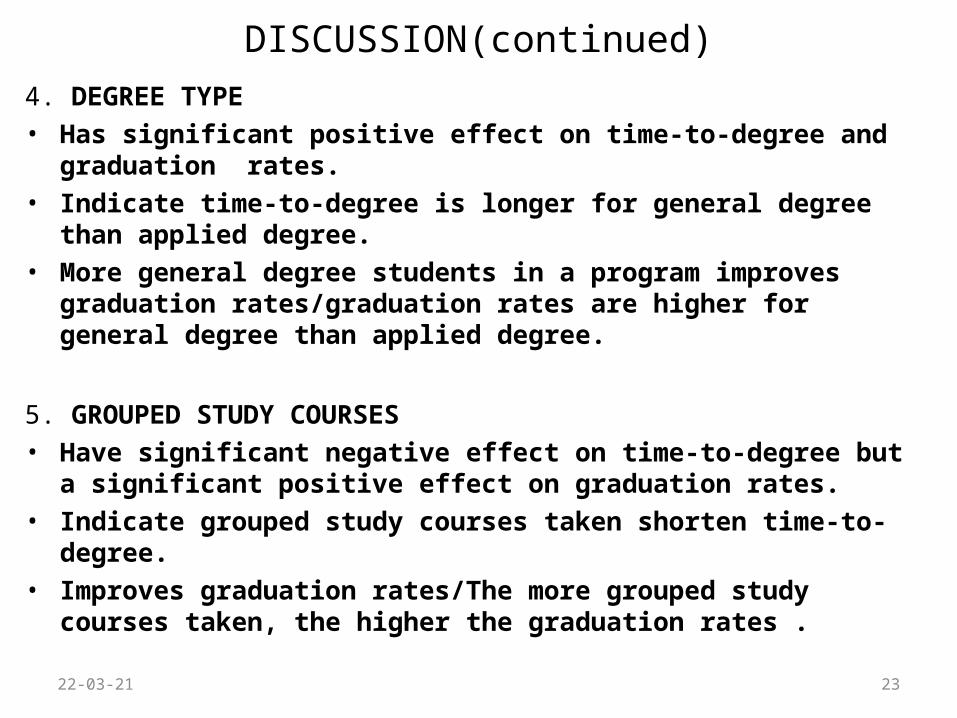
4. DEGREE TYPE
• Has significant positive effect on time-to-degree and graduation rates.
• Indicate time-to-degree is longer for general degree than applied degree.
• More general degree students in a program improves graduation rates/graduation rates are higher for general degree than applied degree.
5. GROUPED STUDY COURSES
• Have significant negative effect on time-to-degree but a significant positive effect on graduation rates.
• Indicate grouped study courses taken shorten time-to-degree.
• Improves graduation rates/The more grouped study courses taken, the higher the graduation rates .
23-04-18 23
DISCUSSION(continued)
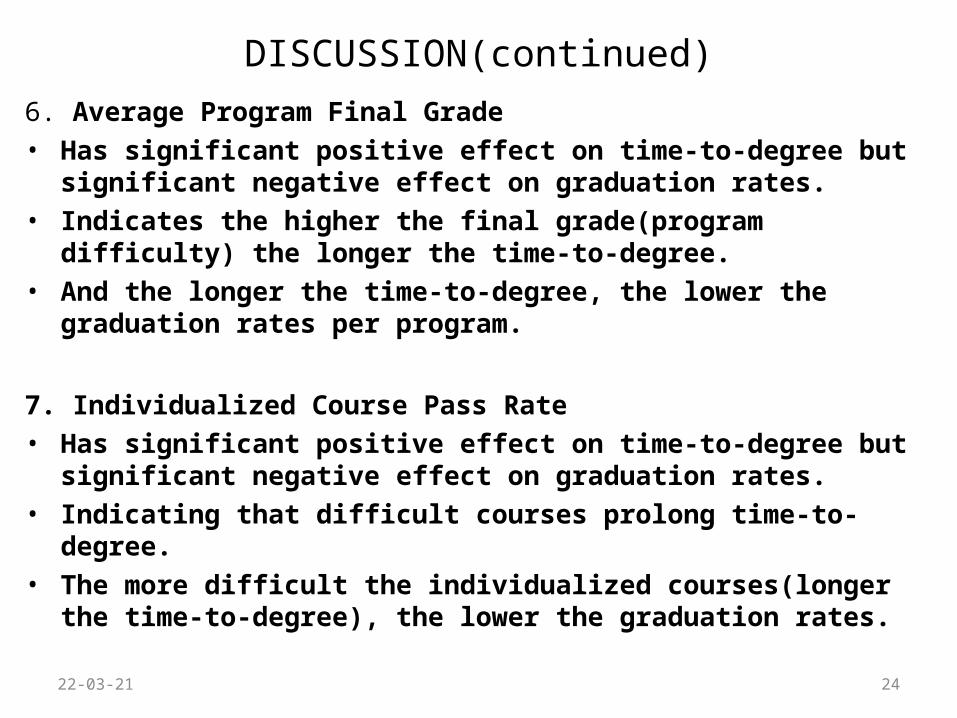
6. Average Program Final Grade
• Has significant positive effect on time-to-degree but significant negative effect on graduation rates.
• Indicates the higher the final grade(program difficulty) the longer the time-to-degree.
• And the longer the time-to-degree, the lower the graduation rates per program.
7. Individualized Course Pass Rate
• Has significant positive effect on time-to-degree but significant negative effect on graduation rates.
• Indicating that difficult courses prolong time-to-degree.
• The more difficult the individualized courses(longer the time-to-degree), the lower the graduation rates.
23-04-18 24
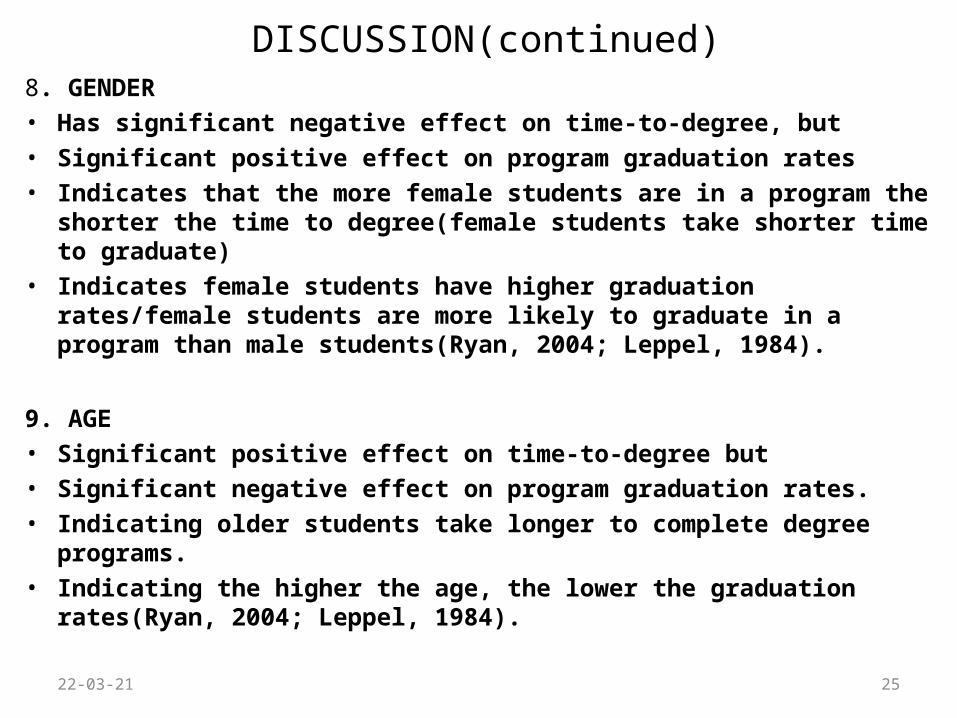
DISCUSSION(continued)8. GENDER
• Has significant negative effect on time-to-degree, but
• Significant positive effect on program graduation rates
• Indicates that the more female students are in a program the shorter the time to degree(female students take shorter time to graduate)
• Indicates female students have higher graduation rates/female students are more likely to graduate in a program than male students(Ryan, 2004; Leppel, 1984).
9. AGE
• Significant positive effect on time-to-degree but
• Significant negative effect on program graduation rates.
• Indicating older students take longer to complete degree programs.
• Indicating the higher the age, the lower the graduation rates(Ryan, 2004; Leppel, 1984).
23-04-18 25
CONCLUSIONS1. Overall results are illuminating
2. Create interesting implications for non-traditional distance student retention and degree attainment models.
3. Policy implications.
4. It is possible to use institutional factors to predict learning outcomes of non-traditional distance students.
5. Institutional expenditures on direct instruction might be used to improve non-traditional distance students’ academic engagement and graduation rates.
6. Transfer expenditures from student services to direct instruction in order to shorten degree completion time and improve graduation rates.
7. Increase grouped study courses offered and to encourage distance students to take more grouped study courses to shorten time-to-degree and improve graduation rates.
23-04-18 26
LIMITATIONS AND FUTURE RESEARCH
1. Since the study applies to only one non-traditional institution, the results are not generalizable to the entire non-traditional distance students in North America.
2. Not all institutional factors were included and results cannot be generalized to all institutional factors.
3. Research needed to study academic engagement and learning outcomes of more non-traditional distance institutions using more advanced models.
4. Study required to focus on how changes in institutional expenditures per program over time affect changes in distribution of students across programs.
23-04-18 27
ANY QUESTIONS OR OBSERVATIONS?
THANK YOU