Embed Size (px)
Citation preview
Examining Digital Differences 18
Family Science Review, Volume 17, Issue 2, 2012
©2011 by the Family Science Association
Examining Digital Differences: Parents’ Online Activities
Jennifer L. Doty, Ph.D, Jodi Dworkin, Ph.D, and Jessica H. Connell, M.A
University of Minnesota
ABSTRACT. In an information-based society, digital inequalities among parents have negative
implications for families, yet not much is understood about how socioeconomic status is related
to parents’ online activities. Based on ecological systems theory and social capital concepts, this
research investigated the differences in 1,518 parents’ online activities by income, age,
education, and comfort. Income was a significant predictor of frequency of information seeking
activities, but not of frequency of parents’ online social activities. However, comfort with
technology emerged as a more salient predictor of both types of online behavior than indicators
of socio-economic status or age. This research highlights the need to study differences in
parent’s digital use in context. Implications for family life educators, researchers, and policy
makers are discussed.
Keywords: social capital, online, parents
Evidence suggests that parents are highly connected to the Internet (Allen & Rainie,
2002). In 2011, 83.6% of married parents and 66% of single parents had broadband Internet
access in comparison to 55% of households without children (National Telecommunications and
Information Administration (NTIA), 2011). Market research of parents’ online behavior
suggests that 86% of expecting parents search for information on the Internet (Plantin &
Daneback, 2009), and Baily (as cited in Hall & Bishop, 2009) reports that 82% of mothers “go
online for fast updates” (p. 185). Also, parents with children under 18 are more likely than other
segments of the population to participate in online social networking sites (Zickuhr & Smith,
2012). In spite of this explosion of online resources for parents, little empirical research has
been conducted on parents’ Internet use.
Although the literature on parents’ online behavior is just emerging, general research on
the Internet and technology has surfaced a concern about differences in digital use. Disparity
between high- and low-income families has been found in Internet access and parents’ online
activities (Martin & Robinson, 2007; Radey & Randolph, 2009). Some evidence suggests that
the digital divide in terms of access to the Internet may be closing (Zickuhr & Smith, 2012), but
other scholars call for a more nuanced look at the complex processes involved in digital use
____________________________________________________________________________
Direct correspondence to Ms. Jennifer Doty at [email protected]
Examining Digital Differences 19
Family Science Review, Volume 17, Issue 2, 2012
©2011 by the Family Science Association
(Hargittai, 2011). Martin and Robinson (2007) argued that the diffusion of technology and
Internet use at all income levels is in the near future. In support of their argument, one study
found that 66% of mothers on a Swedish parenting site were at or below average in income
(Sarkadi & Bremburg, 2005), and another study found 40% of users on a parenting website were
low income (Russell, 2006). Warren, Allen, Okuyemi, Kvasny, and Hecht (2010) reported that
62.5 % of single, African American mothers had access to computers at home and 20% had
access through other locations; on average these mothers used the Internet over four hours a
week. As access to technology grows for families at all income levels, Warschauer and
Matuchniak (2010) have argued that studies of the Internet need to move beyond issues of access
to examine use and outcomes. Understanding differences in parents’ digital use is important, but
to date, empirical investigations of the relationship between income and parents’ online activities
have been infrequent.
In an information economy, not only access to the Internet but also the ability and skill to
obtain online information is crucial to financial opportunities and success. Between 1998 and
2008 the growth of information technology jobs was 26%, a rate four times faster than the rest of
the economy (NTIA, 2011). As a result, lack of access to the Internet is one proposed cause of
impoverishment. Investigation into parents’ Internet use is important in understanding how
differences in digital use may perpetuate inequality by limiting access to information (Hargittai,
2010; Martin & Robinson, 2007; Warschauer, 2008).
In response to these gaps in the literature, the present study explored predictors of
parents’ information seeking and social usage patterns. An ecological perspective and concepts
from social capital theory guided this research.
Theoretical Frameworks
According to Bronfenbrenner’s ecological systems theory (1979), social networks are
“highways” for resource gathering, and channels of information for obtaining needed resources
are multiplied with added connections. The Internet can be conceptualized as an online ecology,
supplying families with needed resources such as information found on parenting websites or
social support found in online forums (Martin & Robinson, 2007; Walker & Greenhow, 2010).
Several descriptive studies have found that discussion boards, parenting websites, and blogs were
useful contexts for parents and provided a virtual space for parents to connect and support one
another (Drentea & Moren-Cross, 2005; Madge & O’Connor, 2006; McDaniel, Coyne &
Holmes, 2011; Miyata, 2002; Scharer et al., 2009). A systems approach also implies that
children will benefit when parents find resources online (Brady & Guerin, 2010).
Cutrona and Russel (1990) identified emotional support and information support as two
main resources found in a social network, and evidence suggests that this finding extends to an
online environment. Radey and Randolph (2009) examined a variety of sources used for
parenting information and found that parents value the Internet as a resource in conjunction with
other media. One qualitative study found three main resources on an Internet discussion board
Examining Digital Differences 20
Family Science Review, Volume 17, Issue 2, 2012
©2011 by the Family Science Association
for mothers: emotional support, instrumental support, and community building (Drentea &
Moren-Cross, 2005). The most common resource was an expression of emotional support where
one mother would express frustration and stress and another would respond with empathy.
Evidence of instrumental informal information sharing such as using other mothers’ experiences
as a frame of reference was found as well as formal information sharing such as posting expert or
professional resources. Another study similarly identified emotional support, tangible aid, and
information as three types of support that parents found online (Scharer et al., 2009). Based on
this evidence, in the current study, parents’ information seeking and social activities on the
Internet will be conceptualized as online resources.
Scholars have recently called for an examination of how online resources may create
social capital in cyberspace by building individuals’ social networks (Lin, 2001; Warschauer,
2008). The concept of social capital was defined by Lin (2001) as “resources embedded in a
social structure that are accessed and/or mobilized in purposive actions” (p. 29). This definition
provides a framework for considering structure of social networks in an online environment.
Personal networks refer to friends, acquaintances, and fellow workers who provide support to
individuals (Wellman & Frank, 2001). Resources garnered from personal networks are referred
to as network capital, a form of social capital. A recent study found that 86% of new mothers
who blogged did so to stay in touch with others (McDaniel et al., 2011). They reported that
blogging predicted feeling connected to their personal network, and feeling connected was
related to perceptions of social support. The resource of online social support was related to
increased maternal well-being. O’Connor and Madge (2004) compared support for mothers of
newborns on a website to support from offline networks and found that online personal networks
did not replace but rather added to support from offline kinship networks. Their research
supported the findings of another study that Internet connections supplemented, rather than
replaced, offline networks (Wellman, Haase, Witte, & Hampton, 2001). Parents may report
benefitting from online connections in part because weak ties on the Internet provided more
diverse opinions and information than face-to-face interactions with close ties (Best & Krueger,
2006; Drentea & Moren-Cross, 2005).
A basic assumption of social capital theory that individuals benefit from social
relationships makes it well suited to consider differences in digital use. Lin (2001) described the
underlying premise of social capital theory as “investment in social relations with expected
returns in the marketplace” (p. 19). Miyata (2002) found that parents who had more social
connections offline also tended to have more connections online, implying a payoff in social
investments. Other research has found that those individuals with higher web-user skills tended
to engage in more capital building activities (Hargittai, 2010; Hargittai & Hinnat, 2008).
Drentea and Moren-Cross (2006) referred to systematic inequalities due to social capital as a
“mechanism for stratification” (p. 923). In other words, those with less social capital may be at a
disadvantage in the digital space.
Examining Digital Differences 21
Family Science Review, Volume 17, Issue 2, 2012
©2011 by the Family Science Association
Literature Review
A review of the literature reveals studies focused on access to technology and the Internet
and more recently focused on the complexity of digital use. Researchers have considered the
association of several demographic variables with online access and activities, including income,
age, education, biological sex, and race. Martin and Robinson (2007) argued that income has the
most potential to influence technology use because it directly affects families’ ability to acquire
technological devices and Internet services. Several studies have found a positive relationship
between parents’ socioeconomic status and Internet use (Allen & Rainie, 2002; Kind, Huang,
Farr & Pomerantz, 2005; Rothbaum, Martland & Jannsen, 2008; Zickuhr & Smith, 2012). In a
marketing segmentation analysis of the United States population, those who were affluent and
who lived in urban areas were more likely to engage in social networking than those who had
average incomes (Nielson, 2009). Nasah, DaCosta, Kinsell, and Seok (20010) also reported
different patterns of use at different income levels. While some studies have found disparities in
technology access by race, others have found differences disappear at higher income levels
(Plantin & Daneback, 2009). In one study, urban families of color tended to have high levels of
access to the Internet (77%) even though 46% of the families were considered low income;
however, only 14% of the families searched the Internet for health information (Cohall, Cohall,
Dye, Dini, & Vaughan, 2004).
Age has also been found to play a role in patterns of digital use. In a PEW report on
generations online, although Internet use had increased for older Americans since 2005, a
negative association between age and Internet use persisted (Jones & Fox, 2009). One study of
parents’ health information seeking found that younger mothers tended to consult the Internet
when the doctor was not available, but older mothers tended to turn to books and the doctor’s
answering service (Bernhardt & Felter, 2004). Others have noted the tendency of young adults to
rely on quick superficial information seeking on search engines such as Google compared to
older adults who tend to conduct more in-depth online searches (Nicholas, Rowlands, Clark, &
Williams, 2011). Enyon and Helsper (2011) distinguished between formal information seeking,
informal information seeking, and fact checking in an online environment. They found that in a
nationally representative sample from Britain, younger participants tended to use each online
information seeking behavior more frequently than older participants. They also found that
having children over 10 years of age and parents’ education were positively related to more
formal learning and fact checking online.
A well-established predictor of digital use is education. Highly educated people tend to
view the Internet as being more useful than those with less education (Zhang, 2005). Studies
have also found that parents’ education was positively associated with Internet access and use
(Kind et al., 2005; Rothbaum et al., 2008). Radey and Randolph (2009) found that high
education levels were positively related to seeking parenting information online. They concluded
that a knowledge gap exists in our society, with limited access and skill perpetuating inequalities.
One study of young adults found SES, operationalized as parental education, was positively
correlated with Internet skills, Internet access, laptop ownership, time spent on the web, and
Examining Digital Differences 22
Family Science Review, Volume 17, Issue 2, 2012
©2011 by the Family Science Association
number of websites visited (Hargittai, 2010). A recent PEW report also found that SES
indicators, income and education, were consistent predictors of Internet access and use (Zickuhr
& Smith, 2012).
Biological sex is another demographic variable that is sometimes controlled when
considering digital use. Some evidence suggesting that women use the Internet less than men
has been found (Hargittai, 2010; Kennedy, Judd, Dalgarno, & Waycott, 2010), but Nasah et al.
(2010) have argued that gender differences have largely disappeared. They found negligible
difference between women’s and men’s tendency to download music or videos, chat online, or
blog. The NTIA (2011) also reports parity between sexes in both Internet access and broadband
access, and PEW reports that no differences exist in the number of men and women who use
social networking sites (Zickuhr & Smith, 2012). Regarding online information seeking, women
have been found to search more for health information than men (Stern, Cotten, & Drentea,
2011).
Despite this evidence of demographic differences, exploring differences in digital use
requires a nuanced approach, considering contextual variables rather than solely examining
demographic differences (Warschauer & Matuchniak, 2010). For example, one study found that
participants who were White, younger, and high income tended to have more online access than
those who were Latino or Armenian, older, and low income (Jung, 2008). However, Jung (2008)
also found that social environment (e.g., being able to get help online and having family or
friends online), technology environment (e.g., experience and having access from multiple
locations), and Internet goals (e.g., viewing the Internet as a means to reach various goals) were
strong predictors of Internet connectedness after controlling for demographics. Comfort may be
another important factor: parents who reported feeling comfortable with technology tended to
use the Internet frequently (Walker, Dworkin, & Connell, 2011). Rather than a lack of interest, it
may be a lack of comfort and familiarity with technology that keeps some parents from engaging
with online resources (Cohall et al., 2004; Linebarger & Chernin, 2003). These findings suggest
that complex processes accompany differences in digital use that go beyond demographic
characteristics such as income and education.
This study focuses on two research questions:
RQ 1: Is income related to parents’ online information seeking and social activities?
H1: The frequency of parents’ online information seeking activities differs by income,
adjusting for age, education, gender, and race.
H2: The frequency of parents’ online social activities differs by income adjusting for age,
education, gender, and race.
RQ2: Is comfort with technology related to parents’ online information seeking and social
activities controlling for income, age, education, gender, and race?
Examining Digital Differences 23
Family Science Review, Volume 17, Issue 2, 2012
©2011 by the Family Science Association
H3: Comfort predicts the frequency of parents’ online information seeking activities
controlling for demographic variables.
H4: Comfort predicts the frequency of parents’ online social activities controlling for
demographic variables.
Methods
Procedures
The Parenting 2.0 study was undertaken to better understand parents’ technology use and
attitudes. From 2010 to 2011, parents were recruited to take a 15-minute online survey using e-
mail list servs that have a nationwide and demographically diverse reach. These included lists
through but not exclusive to Cooperative Extension including eXtension, state Department of
Education early education efforts, USDA initiatives such as CYFAR (Children, Youth and
Families at Risk) projects, National Institute of Food and Agriculture (NIFA) divisions and
initiatives, as well as other statewide and national networks that reach families and professionals
with parenting resources. Recruiting efforts also included links on Facebook and parenting
websites, face-to-face efforts at the state fair, and the distribution of hundreds of postcards with
information about the study. Potential participants were directed to a website to learn more
about the project and complete the online survey. Survey items addressed participants’
demographic information, Internet access, frequency of doing various online activities, attitudes
and comfort using the Internet and computers, frequency of doing various online activities for
parenting, and the functions that online activities for parenting serve. Participants could choose
to be entered into a drawing for one of several Amazon.com gift cards after completing the
survey. In compliance with the Internal Review Board, participant consent was obtained and all
information was kept confidential.
Missing data. The survey was completed by 1,518 parents. Although the sparse matrix
showed only 1.4% of missing values overall, 25% of cases had at least one missing value. While
handling missing data through listwise deletion is the most common practice, this method would
have eliminated one quarter of cases and assumed that data were missing completely at random
(McKnight, McKnight, Sidani & Figueredo, 2007). As a result, expectation maximization (EM),
which only assumes data are missing at random, was a better choice. Though we recognized the
limitation that EM may inflate results, imputation was applied to less than 1.4% of the values.
We implemented EM for all variables except gender and race; missing cases for these two
categorical variables were removed. This resulted in 1,477 cases for the analyses.
Participants
The mean age of participants was 43.2 years (n = 1,477). The breakdown of race that
was reported is as follows: 91% Caucasian, 3% Asian, 2% Black, 2% Hispanic or Latin
American, and 2% mixed race. Just over half of parents (54%) reported living in a suburban
Examining Digital Differences 24
Family Science Review, Volume 17, Issue 2, 2012
©2011 by the Family Science Association
area, 28% reported living in a rural area, and 18% reported living in an urban area. Collectively,
participants reported high levels of education: 77% had a college degree or higher, 20% had
some education past high school, and 3% had a high school education. Eighty-seven percent
were mothers and 85% were married. For 42% of parents, their oldest child was younger than
12; for 20% of parents, their oldest child was an adolescent (ages 12-18); for 31% of parents,
their oldest child was a young adult (ages 19-25); and for 7% of parents, their oldest child was
older than 25. Just under 20% of the parents were low-income and earned less than $50,000/
year, an income level at which most children would receive reduced price school lunches (Food
and Nutrition Service, 2009).
Measures
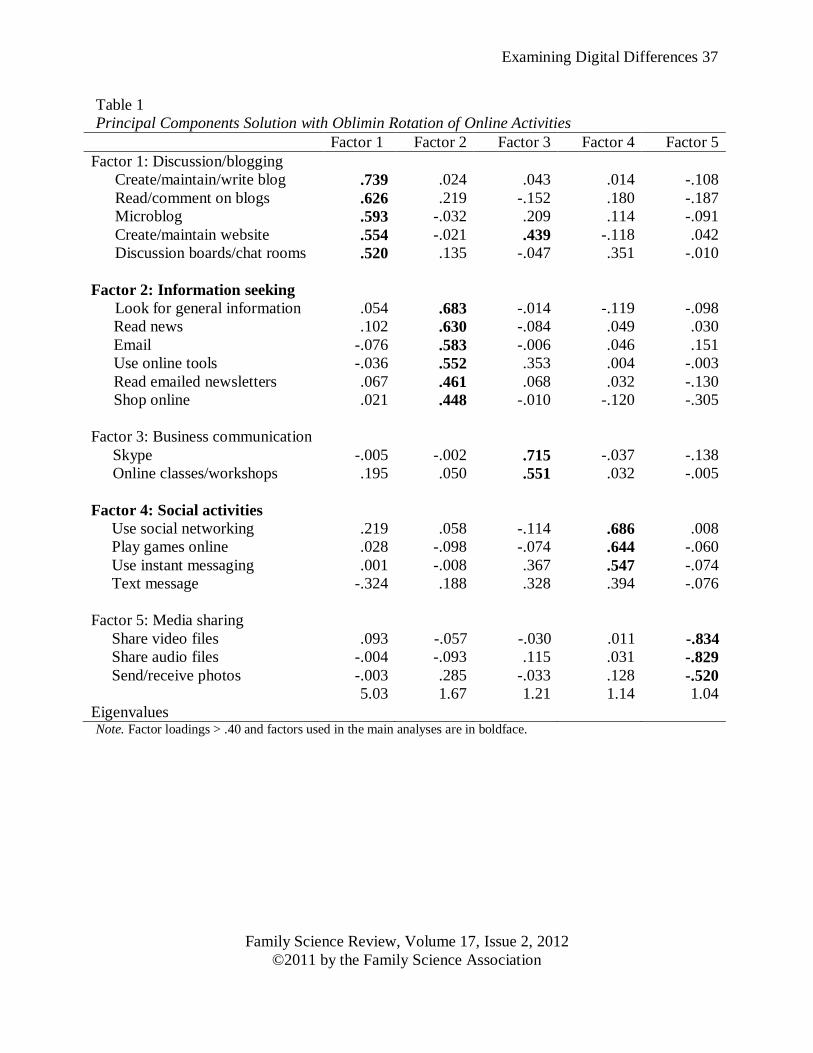
Online activities. Parents were asked how often they do 21 activities when they go
online (Allen & Rainie, 2002; see Table 1). Parents provided frequency of doing each of these
activities online using a six-point Likert scale (1 = Never to 6 = Several times a day).
Exploratory factor analysis using principal component analysis reduced the 21 parent activities to
factors, which were used as dependent variables. Because we expected the factors to be
correlated with one another, oblique rotation (oblimin) was used (Costello & Osborne, 2005).
Following the conservative guideline that smaller loadings are not substantive, factor loadings
less than 0.4 were suppressed (Reinard, 2006). Because of the possible inaccuracy of the default
option to retain factors with eigenvalues greater than 1.0, the scree test was used to explore the
number of factors that produced the greatest stability and made the most sense conceptually
(Costello & Osborne, 2005). Ultimately, the best solution retained Eigenvalues greater than 1
(see Table 1). Since the items “webcam” and “Skype” were highly correlated and produced
instability in the factors, “webcam” was removed from the analysis.
Principal component analysis yielded five components (see Table 1) explaining 51% of
the variance. Correlations between the factors ranged from -.339 to .207, reflecting weak to
moderate relationships between the five factors. Two of these factors, information seeking
activities and social activities, were chosen for the main analyses because they have been found
to be online resources for parents in past research (Drentea & Moren-Cross, 2004; Madge &
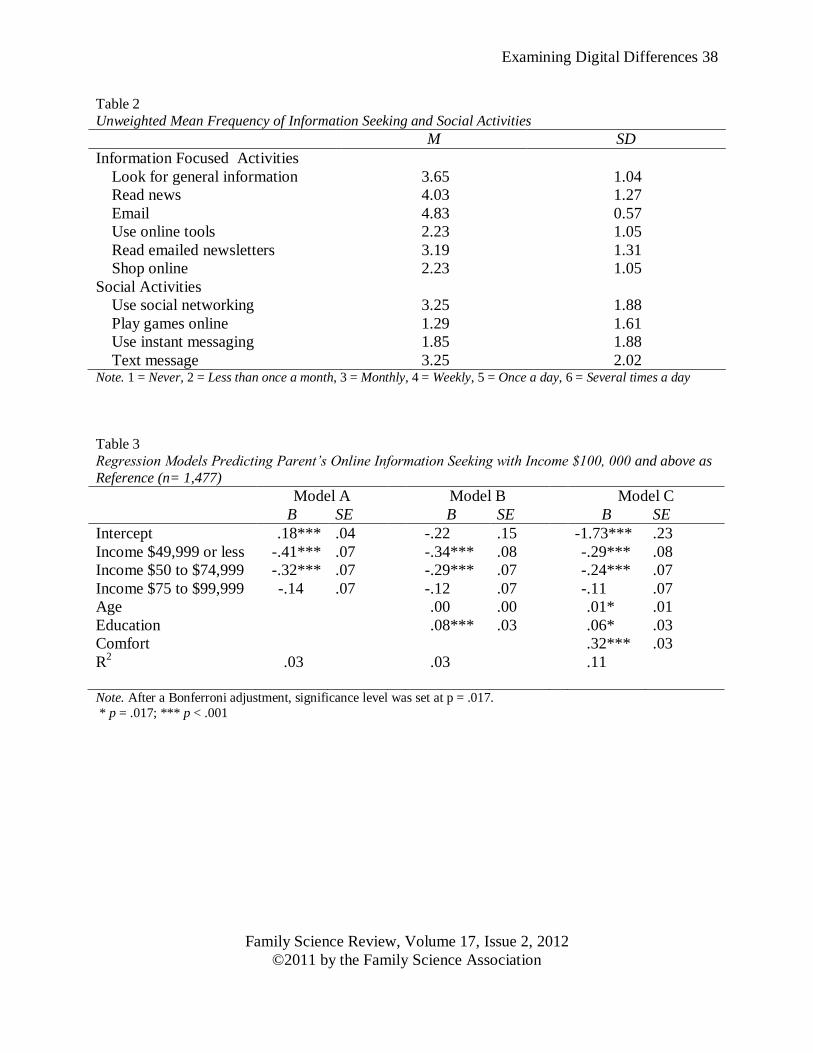
O’Connor, 2006; Radey & Randolph, 2009). The unweighted means of the frequency of
information activities and social activities are found in Table 2. Standardized factor scores of
online information seeking and online social activities were calculated using the regression
method. The factor scores indicated the relative frequency with which parents participated in
these activities and were used as the dependent variables in further analyses.
Demographic variables. Parents answered the following question regarding income:
“Last year what was your total family income from all sources, before taxes?” Possible answers
included “less than 10,000”, “$10,000-under $20,000”, “$20,000-under $30,000”, “$30,000-
under $40,000”, “$40,000-under $50,000”, “50,000-under $75,000”, “$75,000-under $100,000”,
or “Don’t know or Prefer not to answer.” Income levels were collapsed to four groups to reduce
chance of Type 1 error. According to eligibility for reduced school lunch, the lowest income
levels were combined into one level for parents who earned less than $49,999 (n = 276) while
Examining Digital Differences 25
Family Science Review, Volume 17, Issue 2, 2012
©2011 by the Family Science Association
other income levels were kept the same (n = 341, n = 338, n = 522 respectively). Parents were
also asked the question “How old are you?” Because of the strong correlation between parent
age and child age, we focus here on parent age only. For education, parents responded to the
question, “What is the last grade or class you completed in school?” Possible answers included
“Less than high school”, “High school graduate (grade 12 or GED certificate)”, “Business,
technical, or vocational school AFTER high school”, “Some college, no 4 year degree”, “College
graduate (B.S., B.A., or other 4-year degree)”, “Post-graduate training/professional
school/Master's/PhD, M.D., Law degree”, or “Don't know or Prefer not to answer.”
Comfort. A scale was computed by averaging parents’ responses to eight questions
regarding their comfort with technology (α = .83). For example, participants were asked how
comfortable they were with “using the Internet” and “downloading and saving an MP3”
(Livingstone, 2004). Response options were 5 = “very comfortable,” 4 = “comfortable,” 3 =
“neither comfortable nor uncomfortable,” 2 = “uncomfortable,” and 1 = “very uncomfortable.”
The mean comfort score was 3.83 (SD=0.89).
Analysis Plan
First, correlations between the variables were examined. Second, to test our hypotheses
(H1 and H2) that income was related to parents’ online information seeking and social activities
adjusting for age, education, gender, and race, we used hierarchical multiple regression. In the
first step, the main variable of interest, income, was entered as a categorical variable with the
highest income group (annual income $100,000 or above) as the reference group. Third, to
explore the hypotheses (H3 and H4) that comfort with technology would be related to
information seeking and social activities adjusting for the effect of demographic variables, we
added the demographic variables age, education, biological sex, and race to the second step of
the model. We then added comfort with technology in the last step. Finally, we tested for
interactions between income and age, age and comfort, income and comfort, and income and
education. The software package R, version 2.11.1, was used to fit a series of multiple
regression models for both information seeking and social activities using ordinary least squares
regression. The assumptions of linearity and homogeneity of variance were met. Although a few
cases outside two standard deviations were observed, this is expected in a large sample size, and
these were evenly distributed. A probability function in R was used to determine if the
distribution of online information seeking activities and social activities were within the expected
normal curve, and in both cases the assumption of normality was met. To account for multiple
comparisons and avoid Type 1 errors, the significance levels for pairwise contrasts were adjusted
using the Bonferroni method (p = .017).
Results
Preliminary Analyses
First, correlations were examined. Weak but significant correlations between income and
the outcome variables emerged. The correlation between income and online information seeking
Examining Digital Differences 26
Family Science Review, Volume 17, Issue 2, 2012
©2011 by the Family Science Association
was .16 (p < .01) and between income and social activities was .15 (p < .01). Comfort with
technology had a moderate correlation with both types of online activity (respectively, r = .27
and r = .34), p < .001). However, no relationship emerged between comfort with technology
and income or between comfort with technology and education. Significant, negative
correlations were found between age and frequency of parents’ social activities (r = -.23, p <
.01), suggesting younger parents tended to use online social activities more often than older
parents. However, according to Cohen’s (1988) description of correlation strength, this was a
weak correlation.
Testing of Hypotheses
We first addressed the relationship between income and the frequency of parents’ online
information seeking, adjusting for demographic variables (see Table 3, models A and B). Race
and biological sex were not significant and were not included in these models. The first
hypothesis was confirmed: significant differences in parents’ frequency of online information
seeking by income level were found. This finding was robust after adjusting for the unshared
variance of age and education (see Table 3, model B).
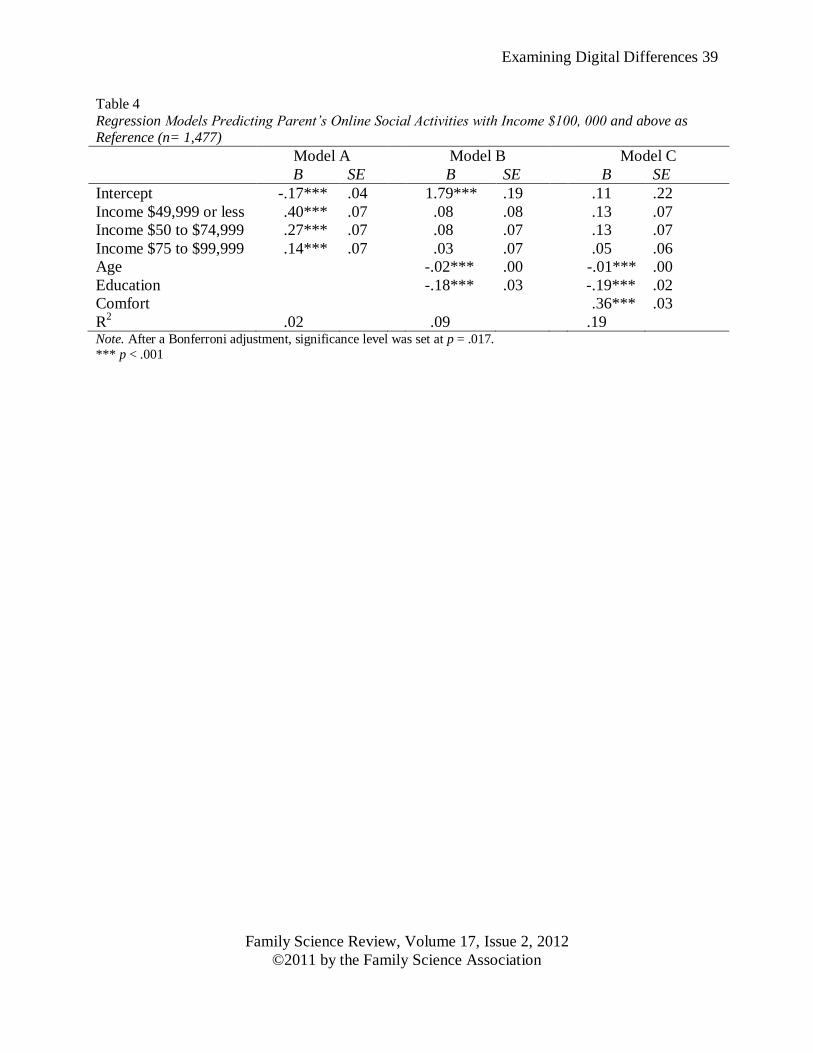
Next, to test the second hypothesis, we examined the relationship between income and
the frequency of parents’ online social activities, adjusting for demographic variables (see Table
4, models A and B). Race and biological sex were not significant in predicting parents’ online
social activities and therefore were not included in these models. The second hypothesis was not
confirmed as income did not predict the frequency of parents’ online social activities once the
unshared variance of age and education were accounted for (see Table 4, model B).
The third hypothesis, that comfort with technology would be a significant predictor of
parents’ online information seeking after controlling for demographic variables, was tested with
a third fitted model (see Table 3, model C). Overall, the fitted model C was statistically
significant explaining approximately 10% of the variance in frequency of parents’ information
seeking (F (6, 1470) = 29.85, p < .001, R2 = .11). Comfort with technology had a moderate,
significant relationship with the frequency of parent’s information seeking controlling for
income and the other predictors (b = 0.32, t (1470) 11.20, p < .001). Comfort with technology
was a more salient predictor of information seeking than income. Further, after controlling for
age, education, and comfort with technology, those with an income higher than $100,000 sought
online information significantly more frequently than those with an income below $50,000 (b =
-0.29, t (1470) -3.78, p < .001) and those with an income between $50,000 and $74,999 (b = -
0.24, t (1470) -3.49, p < .001). No interactions were found between income and age, age and
comfort, income and comfort, or education and comfort. The resulting model was: ̂ = -1.73 - 0.29 (Below $50,000) - 0.24 ($50,000 to $74,999) – 0.11 ($75,000 to
$100,000) + .01 (Age) + 0.07 (Education) + 0.32 (Comfort) (1)
The fourth hypothesis, that comfort with technology would be a significant predictor of
parents’ online social activities after controlling for demographic variables, was tested with a
fourth fitted model (see Table 4, model C). The overall regression was statistically significant
Examining Digital Differences 27
Family Science Review, Volume 17, Issue 2, 2012
©2011 by the Family Science Association
and explained 19% of the variance in frequency of parents’ online social activities, (F (6, 1470)
= 55.89, p < .001, R2 = 0.19). A fairly strong, positive relationship between comfort with
technology and frequency of parents’ online social activities emerged, controlling for age and
education (b = 0.36, t (1,470) 13.01, p < .001). Age and education had a weak, negative
relationship with frequency of parents’ social activities. No interactions were found between
income and age, age and comfort, income and comfort, or education and comfort. The final fitted
model was: ̂ = 0.11 + 0.13 (Below $50,000) + 0.13 ($50,000 to $74,999) + 0.05 ($75,000 to $100,000)
- 0.01 (Age) - 0.19 (Education) + 0.36 (Comfort) (2)
Discussion
To better understand differences in digital use among parents, we investigated the
relationship between income and the frequency of parents’ online activities. Informed by
ecological and social capital theory, we expected that parents’ use of online activities would
differ by income. The results support the hypothesis that parents in the highest income bracket
had significantly more frequent information seeking activities than those with lower incomes,
even after adjusting for age and education. In contrast, no significant differences in parents’
online social activities by income surfaced once age and education were accounted for. Race and
gender, however, were not significant in any of the models. Compared to income, comfort with
technology emerged as a more salient predictor of both parents’ online information seeking and
social activities. Thus, while there were some differences by income, these findings suggest that
comfort with technology is an important aspect of studying digital use and a key to better
understanding how parents access and use online resources.
In line with recent research, comfort with technology emerged as the most salient
predictor of parents’ online activities in the present study. Linebarger and Chernin (2003) found
that parents reported feeling more comfortable using a computer if they owned one and more
strongly agreed that people got left behind if they did not know about computers. However, in
another study, African American and Latino parents who largely had access to the Internet
reported they did not search much for health information online (Cohall et al., 2004). This gap
between access and use may be due to a lack of comfort with technology as many of these
parents expressed a desire to learn more about the Internet. The current study did not find
differences in digital use by race, however, which is consistent with the most recent PEW report
on digital differences (Zickuhr & Smith, 2012). Furthermore, there were no interactions between
comfort and income or comfort and education, suggesting that another variable such as
experience with technology may be at work.
The finding from the current study that comfort with technology was a stronger predictor
than income suggests one way to help parents overcome barriers to using online resources is by
building skills and comfort. Scholars of digital inequality have stressed the importance of
increasing comfort with technology and skill in searching for information, because if differences
are not addressed, information and communication technologies (ICT) may serve to increase
rather than decrease inequalities (Hargittai, 2011). In a complex examination of digital
Examining Digital Differences 28
Family Science Review, Volume 17, Issue 2, 2012
©2011 by the Family Science Association
differences, Warschauer (2008) asserted, “Successful incorporation of ICT inevitably depends on
multifaceted and ongoing reform of social relations and incentives rather than merely on a one-
time infusion of equipment” (p. 144). Thus, overcoming digital inequalities requires more than
access or teaching Internet skills; it requires social integration.
According to social capital theory, the social network of individuals may make a
difference in how individuals use online resources. Attewell (2001) has suggested that online
usage may be influenced by users’ “social envelope” or those who interact daily with the
individual. Some studies have shown that individuals were more likely to access the Internet and
develop skills if people in their social network were also Internet users (Warschaurer &
Matuchniak, 2010). Different patterns of Internet use in individuals’ personal networks are one
possible influence on parents’ comfort levels in the current study. For example, Barron, Martin,
Takeuchi, and Fithian (2009) found that computer mastery was associated with social support
from family members. Occupation may also be related to everyday computer use and comfort
levels. Business or education activities in relation to online comfort could be examined in more
detail in the future. For example, in the current study, “Skype” did not load with social
activities, but rather with “online classes/workshops,” suggesting that for parents this activity
may be more educational than social in nature. Overall, these studies underscore the importance
of the microsystem or personal network in understanding how comfort with technology relates to
digital use.
This study also revealed a significant difference in parent’s online information seeking by
income. Similarly, Radey and Randolph (2009) found evidence of digital inequality and
explained that knowledge is not equally available to all parents because of differences in access
to technology and the Internet, education, and socioeconomic status. Rothbaum and colleagues
(2008) found differences between low- and high-income parents not only in access to the Internet
but also in online information seeking skills. Those with high incomes were more likely to have
refined search skills and were more likely to report finding a variety of online information about
children and families than low-income parents. These findings suggest that differences in digital
use reflect entrenched social challenges that go beyond access to the Internet (Hargittai, 2011).
In the current study, age and education were significant predictors of the frequency of
parents’ online social activities, but the effect of these demographic influences was very small.
Ecological systems theory predicts that the environment has an influence on generational
cohorts, and an argument has been made that young adults are the first generation of digital
natives (Hargittai, 2010). Marketing researchers have claimed that young mothers from the
millennial generation are more socially connected online than older mothers (Hall & Bishop,
2009). For example, the introduction of Google and similar search engines, has changed the way
parents search, leaving them less likely to dig for trusted information (Khoo, Bolt, Babl, Jury, &
Goldman, 2008), and that trend may be more pronounced in younger generations (Nicholas et al.,
2011). It may be that greater differences will be apparent in the future as more digital natives
become parents. Alternatively, age of children may have an influence on parents’ online habits.
One study provided evidence that teens may compensate for parents who do not go online for
information seeking (Zhao, 2009). Parents with low education were more likely to have teens
Examining Digital Differences 29
Family Science Review, Volume 17, Issue 2, 2012
©2011 by the Family Science Association
that go online to search for health information, and parents who did not go online were more
likely to have teens that search for information than parents who did go online. The influence of
child age should be considered in future studies of digital differences among parents.
In regards to parents’ education levels, Sarkadi and Bremberg (2005) found that parents
with low education and income tended to score higher in appraisal support scores than those with
high education and income. In line with social capital theory, our study provides preliminary
evidence that parents with low levels of education may have higher levels of online social
networking and may seek social resources online more than parents with higher levels of
education.
Implications
These findings inform the mission of family life educators, policy-makers, and
researchers. Past research has shown that online education can be as effective as face-to-face
programs (Dillon, Dworkin, Gengler, & Olson, 2008). However, the current study implies that
to make online programs and resources relevant to family life, educators need to understand their
audience, enabling them to gear programs toward particular demographic characteristics or
comfort levels. For example, sites geared toward young users without high levels of education
may benefit from a social interaction component; this may not appeal to other demographic
groups. Similarly, a study of African American single mothers underscores the need for sites
that connect with users’ day-to-day life and are accessible to “marginalized Internet users”
(Warren et al., 2010, p. 409). For parents who are less comfortable with technology, educators
may consider including computer literacy components in family life education to build comfort
with technology. Simple website designs and attention to website conventions may also
facilitate parents’ comfort with family life education websites (Doty, Doty, & Dworkin, 2011).
Family life educators can aid parents in navigating online resources. Ebata and Dennis
(2011) suggest that parents may need guidance in evaluating credibility of online sites, and the
current study implies this may be especially important for low income parents who have little
comfort with online information seeking. They also point out that the Internet may reach many
who traditionally are hard to reach. This may especially be true as mobile devices make
resources more available to those in rural areas and minority populations (Zickuhr & Smith,
2012). Therefore, to reach low income audiences a mobile friendly design is important.
Policy-makers need to be aware that digital inequalities may affect low-income families’
access to technology-based resources. According to NTIA (2011), the goal of the current
presidential administration is for 98% of households to have broadband access within five years.
Looking at Internet access at different points in time, Martin and Robinson (2007) found that the
diffusion rate in the United States was slower for low-income households than for high income
households implying a lag time in access to new digital technology such as broadband. As a
result, state and local policy makers need to remain committed to providing community access
and skill building. In line with an ecological perspective, this may include community
programming at local libraries, churches, or schools. One strategy to help parents build comfort
Examining Digital Differences 30
Family Science Review, Volume 17, Issue 2, 2012
©2011 by the Family Science Association
with the Internet and computers may be to leverage their everyday interests in teaching
information gathering skills (Enyon & Helsper, 2011). In the current economy, parents need
skills that match the information-based jobs that are available (NTIA, 2011). Improving access
to technology, and as this study suggests, comfort with technology, has the potential to increase
parents’ access to information-based jobs.
Evidence of digital inequality also has implications for children (Warschauer, 2008).
Linebarger and Chernin (2003) found that parents thought that access to the Internet could help
their children with their homework. If low-income parents are not comfortable using a computer
for information seeking, they may not be in a position to provide online help to their children.
When parents provided structured learning opportunities with media, co-learning opportunities,
or technical support, children were more likely to feel confident of their computer skills (Barron
et al., 2009). Parents’ comfort levels with technology and motivation for learning computer
skills are important for helping children gain the skills they need for their future. From a social
capital perspective, Coleman (1988) theorized that even when parents do not have a high level of
education, social capital investment could compensate for a lack of human capital. Coleman
gave the example of Asian immigrant families purchasing two copies of a text book so that the
mother might also study the topic and help her child succeed in school. This principle applies to
technology learning: although parents’ experience and comfort may have been low, investment
and motivation in learning technology positively influenced children (Barron et al., 2009).
Schools may also bridge educational gaps and compensate for digitally impoverished home
environments, but unfortunately staff in low SES schools tend to use the Internet less and depend
on less reliable technology equipment than staff in high SES schools (Warshcauer, 2008). These
systemic inequalities that extend beyond the family system need to be addressed if digital
disparities are to be corrected.
Limitations and Future Directions
Although this study provides evidence that differences exist in parents’ digital use related
to online information seeking and social activities, limitations must be acknowledged. The study
is limited in its ability to generalize results to all parents in the United States, as White, high
income, highly educated parents were overrepresented. Our recruitment efforts resulted in a
sample of parents who are active users of online parenting resources and therefore may represent
the population of interest, as these are the parents who are online and being reached by online
family life education. However, future research should seek to have a more representative
sample. With more representation of low-income parents, we may have found greater evidence
of digital differences. More diversity in sampling would have allowed an examination of other
demographic characteristics such as marital status, which lacked variation in this sample. For
example, Radey and Randolph (2009) found that single mothers, who were considered a
vulnerable population, tended to use the Internet for parenting information more than married
parents. These findings suggested that single mothers may tap online social resources to
compensate for social isolation.
Examining Digital Differences 31
Family Science Review, Volume 17, Issue 2, 2012
©2011 by the Family Science Association
In addition, exploratory factor analysis was used in this study to understand how parents’
online activities cluster together. While this is acceptable in early stages of research, in the
future, confirmatory factor analysis should be used to test the social capital theory concept that
parents access various types of social resources in an online environment (Lin, 2001). Finally,
this is a cross-sectional study, but longitudinal research is needed. This design could help
separate a possible cohort effect in parents’ use of technology and the influence of their
children’s age. Furthermore, though longitudinal research in the study of social capital in family
contexts over time has been lacking (Furstenberg, 2005), longitudinal research is needed to
capture the element of time implicit in the theory.
This research undoubtedly adds to the understanding of the complexity of digital
differences and parents’ Internet use. Although parents may differ in their online information
seeking behavior by income and in online social activities by education, comfort with technology
appears to be a more salient predictor of parents’ online activities. An ecological, social capital
lens sensitizes family life educators, policy makers, and researchers to the possibility that
technology provides resources to families, but differences in personal context may offer varying
opportunities and limitations.
______________________________________________________________________________
Jennifer Doty, M.S. is a doctoral student in the Department of Family Social Science at the
University of Minnesota, St Paul, MN 55108.
Jodi Dworkin, Ph.D. is an Associate Professor in the Department of Family Social Science at the
University of Minnesota.
Jessica H. Connell, M.A. is a doctoral student in the Department of Family Social Science at the
University of Minnesota
References
Allen, K., & Rainie, L. (2002). Parents online. Retrieved from Pew Internet and American Life
Project website: http://www.pewinternet.org/Reports/2002/Parents-Online.aspx
Attewell, P. (2001). Comment: The first and second digital divides. Sociology of Education, 74,
252-259.
Barron, B., Martin, C. K., Takeuchi, L., & Fithian, R. (2009). Parents as learning partners in
the development of technological fluency. International Journal of Learning and Media,
1(2), 55-77. doi:10.1162/ijlm.2009.0021
Bernhardt, J. M., & Felter, E. M. (2004). Online pediatric information seeking among mothers of
young children: Results from a qualitative study using focus groups. Journal of Medical
Internet Research, 6(1). doi: 10.2196/jmir.6.1.e7
Examining Digital Differences 32
Family Science Review, Volume 17, Issue 2, 2012
©2011 by the Family Science Association
Best, S. J., & Krueger, B. S. (2006). Online interactions and social capital. Social Science
Computer Review, 24(4), 395-410. doi: 10.1177/0894439306286855
Brady, E., & Guerin, S. (2010). “Not the romantic, all happy, coochy coo experience”: A
qualitative analysis of interactions on an Irish parenting web site. Family Relations, 59(1),
14-27. doi:10.1111/j.1741-3729.2009.00582.x
Bronfenbrenner, U. (1979). The ecology of human development: Experiments by nature and
design. Cambridge, MN: Harvard University Press.
Cohall, A. T., Cohall, R., Dye, B., Dini, S., & Vaughan, R. D. (2004). Parents of urban
adolescents in Harlem, New York, and the internet: A cross-sectional survey on preferred
resources for health information. Journal of Medical Internet Research, 6(4).
doi: 10.2196/jmir.6.4.e43
Cohen, J. (1988). Statistical power analysis for the behavioral sciences (2nd ed.). Hillsdale, NJ:
Lawrence Erlbaum.
Coleman, J. S. (1988). Social capital in the creation of human capital. American Journal of
Sociology, 94, 95-120.
Costello, A. B., & Osborne, J. W. (2005). Best practices in exploratory factor analysis: Four
recommendations for getting the most from your analysis. Practical Assessment, Research
& Evaluation, 10(7), 1-9.
Cutrona, C. E., & Russell, D. W. (1990). Type of social support and specific stress: Toward a
theory of optimal matching. In B. R. Sarason, I. Sarason & G.R. Pierce (Eds.), Social
support: An interactional view (pp. 319-366). Oxford, England: John Wiley & Sons.
Dillon, K., Dworkin, J., Gengler, C., & Olson, K. (2008). Online or face-to-face? A comparison
of two methods of training professionals. Journal of Family & Consumer Sciences, 100(3),
28-33.
Doty, J. L., Doty, M. J., & Dworkin, J. (2011). Web-based family life education: Spotlight
on user experience. Journal of Extension, 49(6). Available
http://www.joe.org/joe/2011december/tt6.php
Drentea, P., & Moren‐Cross, J. L. (2005). Social capital and social support on the web: The case
of an internet mother site. Sociology of Health & Illness, 27(7), 920-943. doi:
10.1111/j.1467-9566.2005.00464.x
Ebata, A., & Dennis, S. (2011). Family life education on the technological frontier. In S. F.
Duncan, & H. W. Goddard (Eds.), Family life education: Principles and practices for
effective outreach. Second Ed. (pp. 236-262). Sage: Thousand Oaks, CA.
Examining Digital Differences 33
Family Science Review, Volume 17, Issue 2, 2012
©2011 by the Family Science Association
Eynon, R., & Helsper, E. (2011). Adults learning online: Digital choice and/or digital exclusion?
New Media & Society, 13(4), 534.
Food and Nutrition Service, USDA. (2009). Child nutrition programs—Income eligibility
guidelines. Federal Register, 74(58), 13410-13412.
Furstenberg, F. F. (2005). Banking on families: How families generate and distribute social
capital. Journal of Marriage and Family, 67(4), 809-821.
Hall, A. C., & Bishop, M. (2009). Mommy angst: Motherhood in American popular culture.
Santa Barbara, CA: Praeger Publishers.
Hargittai, E. (2010). Digital na (t) ives? variation in internet skills and uses among members of
the “net generation.” Sociological Inquiry, 80(1), 92-113.
Hargittai, E. (2011). Minding the gap: Why understanding digital inequality matters. In S.
Papathanassopoulos (Ed.), Media Perspectives for the 21st Century (pp. 231-240). New
York: Routledge.
Hargittai, E., & Hinnant, A. (2008). Digital inequality. Communication Research, 35(5), 602.
Jones, S., & Fox, S. (2009). Generations online in 2009. Retrieved from the Pew Internet and
American Life Project website: http://www.pewinternet.org/Reports/2009/Generations-
Online-in-2009.aspx
Jung, J. Y. (2008). Internet connectedness and its social origins: An ecological approach to post-
access digital divides'. Communication Studies, 59(4), 322–339.
Kennedy, G., Judd, T., Dalgarno, B., & Waycott, J. (2010). Beyond natives and immigrants:
Exploring types of net generation students. Journal of Computer Assisted Learning, 26(5),
332-343.
Khoo, K., Bolt, P., Babl, F. E., Jury, S., & Goldman, R. D. (2008). Health information seeking
by parents in the internet age. Journal of Paediatrics and Child Health, 44(7‐8), 419-423.
Kind, T., Huang, Z. J., Farr, D., & Pomerantz, K. L. (2005). Internet and computer access and
use for health information in an underserved community. Ambulatory Pediatrics, 5(2), 117-
121.
Lin, N. (2001). Social capital: A theory of social structure and action. Cambridge, MA:
Cambridge University Press.
Linebarger, D. L., & Chernin, A. R. (2003). Young children, parents, computers. IT & Society,
1(4), 87-106.
Examining Digital Differences 34
Family Science Review, Volume 17, Issue 2, 2012
©2011 by the Family Science Association
Livingstone, S. (2004). UKCGO (UK children go online) parent questionnaire. Retrieved from
http://eprints.Ise.ac.uk
Madge, C., & OʼConnor, H. (2006). Parenting gone wired: Empowerment of new mothers on the
internet? Social & Cultural Geography, 7(2), 199-220.
Martin, S. P., & Robinson, J. P. (2007). The income digital divide: Trends and predictions for
levels of internet use. Social Problems, 54(1), 1-22. Retrieved from
http://www.jstor.org/stable/4488193 .
McDaniel, B. T., Coyne, S. M., & Holmes, E. K. (2011). New mothers and media use:
Associations between blogging, social networking, and maternal well-being. Maternal and
Child Health Journal. Advance online publication. doi: 10.1007/s10995-011-0918-2
McKnight, P. E., McKnight, K. M., Sidani, S., & Figueredo, A. J. (2007). Missing data: A gentle
introduction. New York: The Guilford Press.
Miyata, K. (2002). Social support for Japanese mothers online and offline. In B. Wellman & C.
Haythornthwaite (Eds.), The Internet in Everyday Life (pp. 520-548). Oxford: Blackwell.
Nasah, A., DaCosta, B., Kinsell, C., & Seok, S. (2010). The digital literacy debate: An
investigation of digital propensity and information and communication technology.
Educational Technology Research and Development, 58(5), 531-555.
National Telecommunications and Information Administration. (2011). Digital nation:
Expanding Internet usage. Washington, DC: Author.
Nicholas, D., Rowlands, I., Clark, D., & Williams, P. (2011). Google generation II: Web
behaviour experiments with the BBC. Paper presented at the Aslib Proceedings, 63(1) 28-
45.
Nielson (2009). The more affluent and more urban are more likely to use social networks.
Retrieved from http://blog.nielsen.com/nielsenwire/online_mobile/the-more-affluent-and-
more-urban-are-more-likely-to-use-social-networks/
O'Connor, H., & Madge, C. (2004). 'My mum's thirty years out of date'. Community, Work &
Family, 7(3), 351-369. doi: 10.1080/1366880042000295754
Plantin, L., & Daneback, K. (2009). Parenthood, information and support on the internet. A
literature review of research on parents and professionals online. BMC Family Practice,
10(1), 34.
Radey, M., & Randolph, K. A. (2009). Parenting sources: How do parents differ in their efforts
to learn about parenting? Family Relations, 58(5), 536-548.
Examining Digital Differences 35
Family Science Review, Volume 17, Issue 2, 2012
©2011 by the Family Science Association
Reinard (2006). Communication research statistics: Exploratory factor analysis. Sage Research
Methods Online. doi: 10.4135/9781412983693
Rothbaum, F., Martland, N., & Jannsen, J. B. (2008). Parents' reliance on the web to find
information about children and families: Socio-economic differences in use, skills and
satisfaction. Journal of Applied Developmental Psychology, 29(2), 118-128.
Russell, S. (2006). Netmums: Online support for parents. Community Practitioner: The Journal
of the Community Practitioners' & Health Visitors' Association, 79(2), 44-45.
Sarkadi, A., & Bremberg, S. (2005). Socially unbiased parenting support on the internet: A
cross-sectional study of users of a large Swedish parenting website. Child: Care, Health and
Development, 31(1), 43-52. doi: 10.1111/j.1365-2214.2005.00475.x
Scharer, K., Colon, E., Moneyham, L., Hussey, J., Tavakoli, A., & Shugart, M. (2009). A
comparison of two types of social support for mothers of mentally ill children. Journal of
Child and Adolescent Psychiatric Nursing, 22(2), 86-98. doi: 10.1111/j.1744-
6171.2009.00177.x
Stern, M. J., Cotten, S. R., & Drentea, P. (2011). The separate spheres of online health: Gender,
parenting, and online health information searching in the information age. Journal of Family
Issues. Advance online publication. doi: 10.1177/0192513X11425459
Walker, S. K., Dworkin, J., & Connell, J. (2011). Variation in parent use of information and
communications technology: Does quantity matter? Family and Consumer Sciences
Research Journal, 40(2), 106-119.
Walker, S. K. & Greenhow, C. M. (2010). The Internet and Human Relationships: Revisiting the
Personal Social Networks of Parents. National Council on Family Relations 72nd
Annual
Conference, Minneapolis, MN.
Warren, J., Allen, M., Okuyemi, K., Kvasny, L., & Hecht, M. (2010). Targeting single parents in
preadolescent substance use prevention: Internet characteristics and information relevance.
Drugs: Education, Prevention, and Policy, 17(4), 400-412.
Warschauer, M. (2008). Whither the digital divide? In D. L. Kleinman, K. A. Cloud-Hansen, C.
Matta, & J. Handelsman (Eds.), Controversies in Science & Technology: From Climate to
Chromosomes (pp.140-151). New Rochelle, NY: Liebert.
Warschauer, M., & Matuchniak, T. (2010). New technology and digital worlds: Analyzing
evidence of equity in access, use, and outcomes. Review of Research in Education, 34(1),
179.
Examining Digital Differences 36
Family Science Review, Volume 17, Issue 2, 2012
©2011 by the Family Science Association
Wellman, B., & Frank, K. (2001). Network capital in a multi-level world: Getting support from
personal communities. In N. Lin & K. S. Cook (Eds.), Social Capital: Theory and Research,
(pp. 233-273). New York: Aldine de Gruyter.
Wellman, B., Haase, A. Q., Witte, J., & Hampton, K. (2001). Does the internet increase,
decrease, or supplement social capital? American Behavioral Scientist, 45(3), 436. doi:
10.1177/00027640121957286
Zickuhr, K., & Smith, A. (2012). Digital Differences. Retrieved from Pew Internet and
American Life http://pewinternet.org/Reports/2012/Digital-differences.aspx
Zhang, Y. (2005). Age, gender, and internet attitudes among employees in the business world.
Computers in Human Behavior, 21(1), 1-10.
Zhao, S. (2009). Parental education and children's online health information seeking: Beyond the
digital divide debate. Social Science & Medicine, 69(10), 1501-1505.
Examining Digital Differences 37
Family Science Review, Volume 17, Issue 2, 2012
©2011 by the Family Science Association
Table 1
Principal Components Solution with Oblimin Rotation of Online Activities
Factor 1 Factor 2 Factor 3 Factor 4 Factor 5
Factor 1: Discussion/blogging
Create/maintain/write blog .739 .024 .043 .014 -.108
Read/comment on blogs .626 .219 -.152 .180 -.187
Microblog .593 -.032 .209 .114 -.091
Create/maintain website .554 -.021 .439 -.118 .042
Discussion boards/chat rooms .520 .135 -.047 .351 -.010
Factor 2: Information seeking
Look for general information .054 .683 -.014 -.119 -.098
Read news .102 .630 -.084 .049 .030
Email -.076 .583 -.006 .046 .151
Use online tools -.036 .552 .353 .004 -.003
Read emailed newsletters .067 .461 .068 .032 -.130
Shop online .021 .448 -.010 -.120 -.305
Factor 3: Business communication
Skype -.005 -.002 .715 -.037 -.138
Online classes/workshops .195 .050 .551 .032 -.005
Factor 4: Social activities
Use social networking .219 .058 -.114 .686 .008
Play games online .028 -.098 -.074 .644 -.060
Use instant messaging .001 -.008 .367 .547 -.074
Text message -.324 .188 .328 .394 -.076
Factor 5: Media sharing
Share video files .093 -.057 -.030 .011 -.834
Share audio files -.004 -.093 .115 .031 -.829
Send/receive photos -.003 .285 -.033 .128 -.520
Eigenvalues
5.03 1.67 1.21 1.14 1.04
Note. Factor loadings > .40 and factors used in the main analyses are in boldface.
Examining Digital Differences 38
Family Science Review, Volume 17, Issue 2, 2012
©2011 by the Family Science Association
Table 2
Unweighted Mean Frequency of Information Seeking and Social Activities
M SD
Information Focused Activities
Look for general information 3.65 1.04
Read news 4.03 1.27
Email 4.83 0.57
Use online tools 2.23 1.05
Read emailed newsletters 3.19 1.31
Shop online 2.23 1.05
Social Activities
Use social networking 3.25 1.88
Play games online 1.29 1.61
Use instant messaging 1.85 1.88
Text message 3.25 2.02 Note. 1 = Never, 2 = Less than once a month, 3 = Monthly, 4 = Weekly, 5 = Once a day, 6 = Several times a day
Table 3
Regression Models Predicting Parent’s Online Information Seeking with Income $100, 000 and above as
Reference (n= 1,477)
Model A Model B Model C
B SE B SE B SE
Intercept .18*** .04 -.22 .15 -1.73*** .23
Income $49,999 or less -.41*** .07 -.34*** .08 -.29*** .08
Income $50 to $74,999 -.32*** .07 -.29*** .07 -.24*** .07
Income $75 to $99,999 -.14 .07 -.12 .07 -.11 .07
Age .00 .00 .01* .01
Education .08*** .03 .06* .03
Comfort .32*** .03
R2 .03 .03 .11
Note. After a Bonferroni adjustment, significance level was set at p = .017.
* p = .017; *** p < .001
Examining Digital Differences 39
Family Science Review, Volume 17, Issue 2, 2012
©2011 by the Family Science Association
Table 4
Regression Models Predicting Parent’s Online Social Activities with Income $100, 000 and above as Reference (n= 1,477)
Model A Model B Model C
B SE B SE B SE
Intercept -.17*** .04 1.79*** .19 .11 .22
Income $49,999 or less .40*** .07 .08 .08 .13 .07
Income $50 to $74,999 .27*** .07 .08 .07 .13 .07
Income $75 to $99,999 .14*** .07 .03 .07 .05 .06
Age -.02*** .00 -.01*** .00
Education -.18*** .03 -.19*** .02
Comfort .36*** .03
R2
.02 .09 .19 Note. After a Bonferroni adjustment, significance level was set at p = .017.
*** p < .001