Embed Size (px)
Citation preview

Examining the Effectiveness of Push-To-Web
Mixed Mode Approaches on Response Rates
in an Emergency Department Setting – A
Randomized Study
Layla Parast, PhD Megan Mathews, MA, Marc Elliott,
PhD, Anagha Tolpadi, MS, Elizabeth Flow-Delwiche,
PhD, William G. Lehrman, PhD, Debra Stark, MBA,
Kirsten Becker, MS
MATERIALS CANNOT BE DISTRIBUTED

Disclosure
The data on which this presentation is based were collected under contract number HHSM-500-2016-00093G, entitled, “Preparation for National Implementation of the Emergency Department Patient Experience of Care Discharged to Community Survey,” funded by the Centers for Medicare & Medicaid Services, Department of Health and Human Services. The content of this publication neither necessarily reflect the views or policies of the Department of Health and Human Services nor does the mention of trade names, commercial products, or organizations imply endorsement by the U.S. Government. The authors assume full responsibility for the accuracy and completeness of the ideas presented.
MATERIALS CANNOT BE DISTRIBUTED
2

Emergency Department Visits Are
Common
Nationwide >130 million ED visits annually
~ 42 visits per 100 persons per year
Most patients walk in
~ 15% arrive by ambulance
Common reasons for visit:
Stomach/abdominal pain, Chest pain, Cough
Fever, Headache, Back symptoms
Shortness of breath, Pain, Vomiting
Throat symptoms
MATERIALS CANNOT BE DISTRIBUTED
3

Majority of ED Patients are
Discharged Home
Other
Left before completing visit
Admitted to Observation
Admitted to Hospital
Discharged to Community
0 10 20 30 40 50 60 70 80 90
Percentage of All Visits
MATERIALS CANNOT BE DISTRIBUTED
4

EDPEC Survey Development
Emergency Department Patient Experience of
Care (EDPEC) Discharged to Community (DTC)
Survey
Under development by the Centers for Medicare
& Medicaid Services (CMS)
Designed to measure the experiences of
patients who visit the emergency room and are
subsequently discharged (as opposed to
admitted to the hospital)
MATERIALS CANNOT BE DISTRIBUTED
5

EDPEC Survey Development (Cont.)
Development began in 2012
Call for Topics, Literature Review, Technical
Expert Panel
Ongoing meetings with the CAHPS® Instrument
Team
Cognitive testing of potential survey items
Current survey instrument has 34 items
Domains: Going to the Emergency Room, During
this Emergency Room Visit, People Who Took
Care of You, Leaving the Emergency Room,
Overall Experience, Your Health Care, About You
MATERIALS CANNOT BE DISTRIBUTED
6

EDPEC Survey History
Field test conducted in 2013-2014 with 12 hospitals
Response rate 19.8%
Contact information for ED DTC patients less accurate and less complete vs. admitted patients
Mode experiment conducted in 2016 with 50 hospitals
Purpose: Examine effect of survey mode on who responds, and how
Response rate 20.3%
MATERIALS CANNOT BE DISTRIBUTED
7

EDPEC Survey History (Cont.)
Feasibility Test I conducted in 2016 with 8
hospitals
Purpose: To explore novel administration modes
Key findings:
Within-ED survey distribution
Logistically infeasible
Response rate 9.3%
Web-only survey administrations
Response rates < 5%
MATERIALS CANNOT BE DISTRIBUTED
8

Feasibility Test II (2018): Objectives
Test novel approaches to improve response rates to the EDPEC Survey
Improve representativeness of respondents
Decrease lag time (time from ED discharge to survey completion)
Examine different push-to-web strategies
Explore challenges associated with collection of contact information needed for a web-first approach
MATERIALS CANNOT BE DISTRIBUTED
9

Feasibility Test II Design
16 participating hospitals
January 1 to March 30, 2018 discharges
Sampled ~ 1,600 DTC patients per hospital
Patients randomized within hospital to 1 of 9
survey arms
MATERIALS CANNOT BE DISTRIBUTED
10

Push-to-Web Strategies
8 of 9 experimental arms involved some form of push-
to-web
Email invitations/reminders
Text message invitations/reminders
Mailed survey invitations containing login URL + PIN
code and scannable QR code
Timing of contact
48 hours to 42 days after ED discharge
Timing of first contact varied depending on mode
(mail, email, text)
Web materials were all 508 compliant
MATERIALS CANNOT BE DISTRIBUTED
11
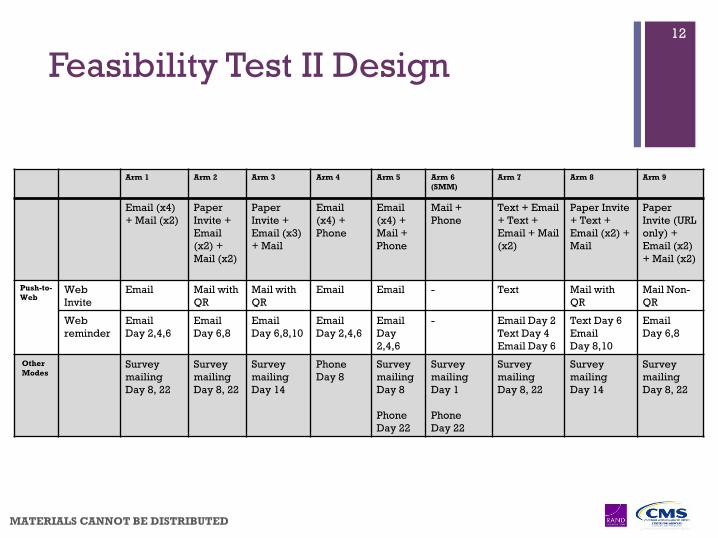
Feasibility Test II Design
MATERIALS CANNOT BE DISTRIBUTED
12
Arm 1 Arm 2 Arm 3 Arm 4 Arm 5 Arm 6
(SMM)
Arm 7 Arm 8 Arm 9
Email (x4)
+ Mail (x2)
Paper
Invite +
(x2) +
Mail (x2)
Paper
Invite +
Email (x3)
(x4) +
Phone
(x4) +
Mail +
Phone
Mail +
Phone
Text + Email
+ Text +
Email + Mail
(x2)
Paper Invite
+ Text +
Email (x2) +
Paper
Invite (URL
only) +
Email (x2)
+ Mail (x2)
Push-to-
WebWeb
Invite
Email Mail with
QR
Mail with
QR
Email Email - Text Mail with
QR
Mail Non-
QR
Web
reminder
Day 2,4,6
Day 6,8
Day 6,8,10
Day 2,4,6
Day
2,4,6
- Email Day 2
Text Day 4
Email Day 6
Text Day 6
Day 8,10
Day 6,8
Other
ModesSurvey
mailing
Day 8, 22
Survey
mailing
Day 8, 22
Survey
mailing
Day 14
Phone
Day 8
Survey
mailing
Day 8
Phone
Day 22
Survey
mailing
Day 1
Phone
Day 22
Survey
mailing
Day 8, 22
Survey
mailing
Day 14
Survey
mailing
Day 8, 22
Feasibility Test II Results:
Response Rates
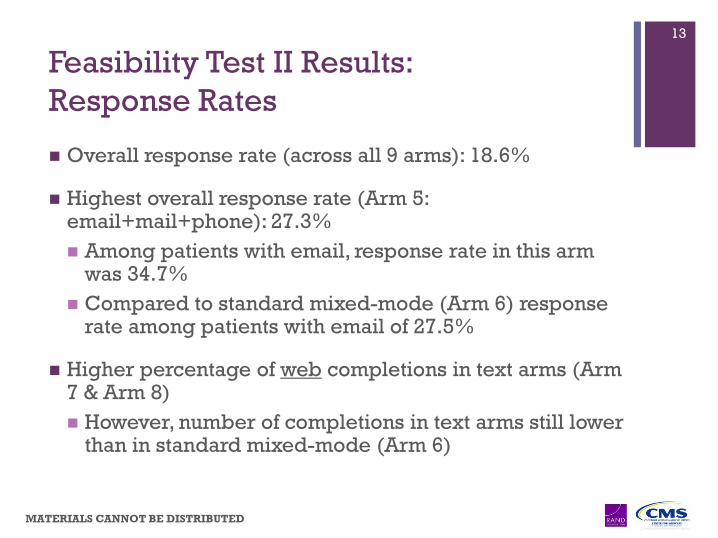
Overall response rate (across all 9 arms): 18.6%
Highest overall response rate (Arm 5: email+mail+phone): 27.3%
Among patients with email, response rate in this arm was 34.7%
Compared to standard mixed-mode (Arm 6) response rate among patients with email of 27.5%
Higher percentage of web completions in text arms (Arm 7 & Arm 8)
However, number of completions in text arms still lower than in standard mixed-mode (Arm 6)
MATERIALS CANNOT BE DISTRIBUTED
13

Response Rates by Arm
MATERIALS CANNOT BE DISTRIBUTED
14
Arm 1 Arm 2 Arm 3 Arm 4 Arm 5 Arm 6
(SMM)
Arm 7 Arm 8 Arm 9 Overall
(x4) +
(x2)
Paper
Invite +
Email (x2)
+ Mail (x2)
Paper
Invite +
(x3) +
Email (x4)
+ Phone
(x4) +
Mail +
Phone
Mail +
Phone
Text +
Email +
Text +
Email +
Mail (x2)
Paper
Invite +
Text +
(x2) +
Paper
Invite
(URL
only) +
(x2) +
Mail (x2)
N Sampled 3195 2848 2846 3193 3192 2844 3191 2841 2841 26991
N Ineligible 45 (1.4%) 49 (1.7%) 26 (0.9%) 152 (4.8%) 172 (5.4%) 137 (4.8%) 38 (1.2%) 36 (1.3%) 49 (1.7%) 704 (2.6%)
N Respondents 482 433 378 697 824 690 555 405 429 4893
Response Rate
among Eligible15.3%*** 15.5%*** 13.4%*** 22.9%* 27.3% 25.5% (ref) 17.6%*** 14.4%*** 15.4%*** 18.6%
*p<0.05,**0.05≦p<0.01,*** 0.01≦p<0.001
Protocol Comparisons
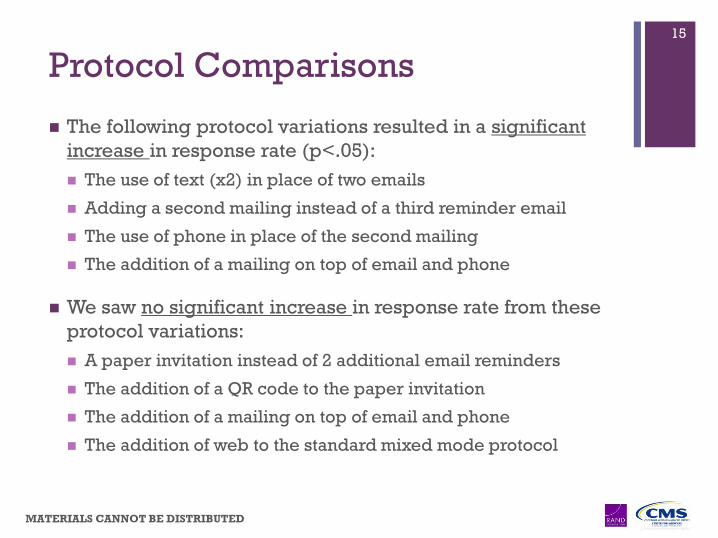
The following protocol variations resulted in a significant
increase in response rate (p<.05):
The use of text (x2) in place of two emails
Adding a second mailing instead of a third reminder email
The use of phone in place of the second mailing
The addition of a mailing on top of email and phone
We saw no significant increase in response rate from these
protocol variations:
A paper invitation instead of 2 additional email reminders
The addition of a QR code to the paper invitation
The addition of a mailing on top of email and phone
The addition of web to the standard mixed mode protocol
MATERIALS CANNOT BE DISTRIBUTED
15

Responses by Completion Mode
within Arm
Arm 1 Arm 2 Arm 3 Arm 4 Arm 5 Arm 6
(SMM)
Arm 7 Arm 8 Arm 9
(x4) +
Mail (x2)
Paper
Invite +
Email (x2)
(x2)
Paper Invite
+ Email (x3)
Email (x4)
+ Phone
Email (x4)
+ Mail +
Phone
Mail +
Phone
Text +
Email +
Text +
Email +
Mail (x2)
Paper
Invite +
Text +
Email (x2)
Paper
Invite (URL
only) +
Email (x2)
+ Mail (x2)
Web 173
(35.9%)140
(32.3%)181
(47.9%)146
(21.0%)163
(19.8%)--
237 (42.7%)
209 (51.6%)
155 (36.1%)
Mail 309 (64.1%)
293 (67.7%)
197 (52.1%)
--236
(28.6%)280
(40.6%)318
(57.3%)196
(48.4%)274
(63.9%)
Phone -- -- --551
(79.1%)425
(51.6%)410
(59.4%)-- -- --
Total
Response
(RR)
482(15.3%)
433(15.5%)
378(13.4%)
697(22.9%)
824(27.3%)
690(25.5%)
555(17.6%)
405(14.4%)
429(15.4%)
MATERIALS CANNOT BE DISTRIBUTED
16

Characteristics of Survey Respondents
Web respondents were more likely:
Female
More highly educated
Visiting the ED for a new health problem
But less likely to arrive to the ED in an
ambulance
Mail respondents were more likely:
Older
Use more proxy assistance
Arrive to the ED in an ambulance
MATERIALS CANNOT BE DISTRIBUTED
17
Respondent Characteristics (Cont.)
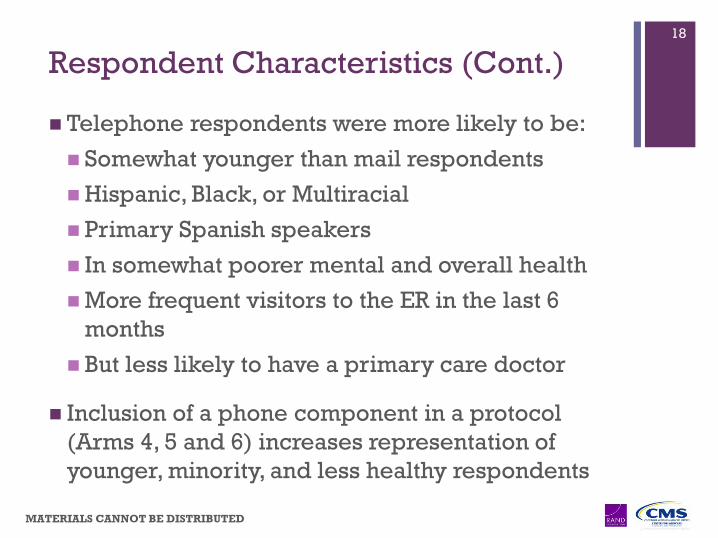
Telephone respondents were more likely to be:
Somewhat younger than mail respondents
Hispanic, Black, or Multiracial
Primary Spanish speakers
In somewhat poorer mental and overall health
More frequent visitors to the ER in the last 6
months
But less likely to have a primary care doctor
Inclusion of a phone component in a protocol
(Arms 4, 5 and 6) increases representation of
younger, minority, and less healthy respondents
MATERIALS CANNOT BE DISTRIBUTED
18

Contact Method for Web Invitation
19.4% of sampled patients had both an email address and could be texted
10.5% of sampled patients had only an email address
39.8% of sampled patients could only be texted (not emailed)
Remaining 30.3% of sampled patients had neither
Texting dramatically increased the reach of the web survey
MATERIALS CANNOT BE DISTRIBUTED
19

Time from First Attempt to Completed Survey
MATERIALS CANNOT BE DISTRIBUTED
20
Arm 6: Standard Mixed Mode (Mail +Phone)
119
63
102 102 113 124
180 185199
243
292
341372 380
408
446
485514
534553
571 583
615635
653667 670 678 684 690
0
100
200
300
400
500
600
700
800
900
1
M
2 4 6 8 10 12 14 16 18 20 22
P
24 26 28 30 32 34 36 38 40 42
Cu
mu
lati
ve
Nu
mb
er
of
Re
sp
on
de
nts
Completed by Mail Completed by Phone Cumulative Complete

Time from First Attempt to Completed Survey
(Cont.)
Arm 7: Text, Email, Text, Email, Mail x2
MATERIALS CANNOT BE DISTRIBUTED
21
75
134147
180 190 199220 226 228 229 230 231 233 234 235 239
255274
299323
356 367384 388 393
409431 439 440 443 454 455
472495 504 513
529 535 540 551 555
0
100
200
300
400
500
600
700
800
900
1
T
2
E
4
T
6
E
8
M
10 12 14 16 18 20 22
M
24 26 28 30 32 34 36 38 40 42
Cu
mu
lati
ve
Nu
mb
er
of
Re
sp
on
de
nts
Completed by Web Completed by Mail Cumulative Complete

Lessons from Feasibility Test II
CAUTION – Results are not generalizable across all EDs
Overall, response rates in the ED setting are low
regardless of administration protocol. No arm
performed significantly better than standard mixed
mode.
Email coverage varies dramatically
31% avg. across 16 hospitals with a range of 6.5%-59.2%
Using text messages increases the reach of the survey, but
hospitals need to consider TCPA regulations and
administrative procedures before adding this mode of
contact
MATERIALS CANNOT BE DISTRIBUTED
22

Feasibility Test II Lessons (Cont.)
MATERIALS CANNOT BE DISTRIBUTED
23
Response rates were improved by offering
multiple sequential modes for survey invitations
and survey administration
Although the most expensive mode, phone
surveys do capture a segment of the population
that may not respond otherwise and increased
response rates
A push-to-web focus did result in respondents
using the web survey

Feasibility Test II Lessons (Cont.)
MATERIALS CANNOT BE DISTRIBUTED
24
Web survey respondents are able to and did
respond within a short timeframe
Respondent characteristics differ by mode and
access to the web, so multiple modes are needed
to ensure a representative sample

Thank you
Contact:
Kirsten Becker, [email protected]
William Lehrman, [email protected]
MATERIALS CANNOT BE DISTRIBUTED
25