Embed Size (px)
Citation preview
Examining the Impact of Later High School Start Times on the
Health and Academic Performance of High School Students: A Multi-Site Study
Final Report February 2014
Kyla L. Wahlstrom, Ph.D. Project Director/ Lead Investigator
Research Team/Report Authors Kyla L. Wahlstrom, PhD, Principal Investigator
Beverly J. Dretzke, PhD, Research Associate Molly F. Gordon, PhD, Research Associate
Kristin Peterson, MA, Research Fellow Katherine Edwards, BA, Research Assistant
Julie Gdula, MA, Research Assistant
Center for Applied Research and Educational Improvement ii University of Minnesota
Acknowledgements:
This study was funded primarily by a grant from the Centers for Disease Control and Prevention (CDC) in Atlanta, GA. Additional funding was also provided by Teton County School District, Jackson Hole, WY.
The researchers wish to thank the school districts that participated in this research study. The school leaders, teachers, students, and administrative support staff generously gave of their time in this effort to provide survey and performance data to the research team. This study could not have been completed without their invaluable assistance. We are also grateful to Brad Estochen, Minnesota Department of Transportation’s Office of Traffic, Safety and Technology, for providing car crash data from Minnesota’s Transportation Information System (TIS).
How to cite this report:
Wahlstrom, K., Dretzke, B., Gordon, M., Peterson, K., Edwards, K., & Gdula, J. (2014). Examining the Impact of Later School Start Times on the Health and Academic Performance of High School Students: A Multi-Site Study. Center for Applied Research and Educational Improvement. St Paul, MN: University of Minnesota. Contact Information Kyla L. Wahlstrom, Director Center for Applied Research and Educational Improvement College of Education and Human Development University of Minnesota 1954 Buford Ave., Suite 425 St. Paul, MN 55108 USA Telephone: (612) 624-0300 Email: [email protected]
Center for Applied Research and Educational Improvement iii University of Minnesota
TABLE OF CONTENTS
Introduction ....................................................................................................................................1 Study Overview ..............................................................................................................................1 Research Questions ........................................................................................................................2 Overview of Factors Related to Sleep in Adolescence ................................................................3
Factors Influencing Amount of Sleep ...............................................................................3 Consequences of Not Enough Sleep .................................................................................5
Profiles of Participating Communities .........................................................................................8 Teen Sleep Habits Survey ............................................................................................................12
Introduction ......................................................................................................................13 Response Rate and Description of Sample ....................................................................15 Analysis Methods .............................................................................................................17 Results of Teen Habits Survey, All High Schools Combined .......................................18
Part 1: Teen Sleep Patterns .................................................................................18 Part 2: Teen Sleep Quality and Daytime Sleepiness .........................................23 Part 3: Students’ Perceptions of Ideal Times for School Start and for School-Related and Other Activities ..................................................................25 Part 4: Teen Participation in Out-of-School Activities ....................................26 Part 5: Links Among Students’ Letter Grades, Health Factors, and Out-of-School Activities.......................................................................................29
Academic Performance Outcomes .............................................................................................35 Minnesota, Colorado, and Wyoming School Districts: Academic Results .................36
Data Collection and Analysis Methods ..............................................................36 Attendance and Tardies ......................................................................................37 Excused and Unexcused Absences ......................................................................39 GPA .......................................................................................................................40 Performance on Standardized Tests ..................................................................41
Car Crash Data ............................................................................................................................42 Vehicle Crashes During the School Year Involving 16 to 18 Year Old Drivers ........43
Data Collection Methods .....................................................................................43 Discussion of Car Crash Results .........................................................................48
District Decision Processes ..........................................................................................................50 Final Report Summary and Conclusions ...................................................................................52 References .....................................................................................................................................53 Appendices
Appendix A—Data Cleaning Methods...........................................................................58 Appendix B—Results of Factor Analysis .......................................................................59

Center for Applied Research and Educational Improvement iv University of Minnesota
Appendix C—Fairview High School, Boulder, CO, Academic Performance Analysis Summary ...........................................................................................................60 Appendix D—Boulder High School, Boulder, CO, Academic Performance Analysis Summary ...........................................................................................................62 Appendix E—Mahtomedi High School, Mahtomedi, MN, Academic Performance Analysis Summary ...........................................................................................................63 Appendix F—St. Louis Park High School, St. Louis Park, MN, Academic Performance Analysis Summary ....................................................................................66 Appendix G—South Washington County School District, MN, Academic Performance Analysis Summary ....................................................................................68 Appendix H—Jackson Hole High School, Jackson Hole, WY, Academic Performance Analysis Summary ....................................................................................71
Center for Applied Research and Educational Improvement 1 University of Minnesota
Examining the Impact of Later High School Start Times on the Health and Academic Performance of High School Students: A Multi-Site Study
Final Report
Major findings: The results from this three-year research study, conducted with over 9,000 students in eight public high schools in three states, reveal that high schools that start at 8:30 AM or later allow for more than 60% of students to obtain at least eight hours of sleep per school night. Teens getting less than eight hours of sleep reported significantly higher depression symptoms, greater use of caffeine, and are at greater risk for making poor choices for substance use. Academic performance outcomes, including grades earned in core subject areas of math, English, science and social studies, plus performance on state and national achievement tests, attendance rates and reduced tardiness show significantly positive improvement with the later start times of 8:35 AM or later. Finally, the number of car crashes for teen drivers from 16 to 18 years of age was significantly reduced by 70% when a school shifted start times from 7:35 AM to 8:55 AM.
INTRODUCTION
High school students often seem to stay up too late at night and then have difficulty
getting out of bed the next morning. Although there might be social and environmental factors that influence adolescents’ sleep behavior, recent research on the sleep-wake cycle of teens has identified changes in specific biological processes that occur with the onset of puberty that cause adolescents not only to need more sleep but also to feel sleepy at a later time (e.g., Crowley, Acebo, & Carskadon, 2007). Because the sleep-wake cycle changes as children grow into adolescents, early high school start time has been identified as an important external factor that could restrict sleep and negatively affect academic learning (e.g., Owens, Belon, & Moss, 2010).
STUDY OVERVIEW
This research project examined whether or not a delay in start time for high school students had an impact on their overall health and academic performance. Data were collected in
Center for Applied Research and Educational Improvement 2 University of Minnesota
eight public high schools in five school districts in three states—Minnesota, Colorado, and Wyoming. The population was ethnically and socio-economically diverse. Percentages of white students ranged from 60% to 90%, the free/reduced lunch rate ranged from 34% to 10%, and the graduation rates ranged from 81% to 97%.
The research study consisted of three parts. Part 1 of the study involved collecting survey data from over 9,000 students across eight high schools in five school districts. Students were individually surveyed about their daily activities, substance use, and sleep habits. We examined various health factors post-start time delay, plus we compared them with national average data from other studies. In Part 2 of the study, we collected data regarding students’ academic performance, such as grades earned, attendance, tardiness, and performance on state and national tests. We also examined car crash data for the communities involved in this project. Part 3 of the research included an examination of the processes by which local school districts made the decision to change to a later start time. Interviews with key players who were active participants in the discussions and in the decisions for each of the five districts identified both the barriers and facilitative aspects in making such a policy change.
RESEARCH QUESTIONS
The major research questions addressed by this study are: 1. What are the health outcomes for high school students in schools that have shifted to a later
start time, including: bedtimes and wake times, sleepiness in class, emotional and physical well-being, depressive feelings, and car crash rates?
2. What are the pre-post start time delay differences in academic outcomes such as grade point average, standardized test scores, school attendance, and tardiness? What is the relationship between participation in activities outside of school and grades earned?
3. What actions are taken and what information is used by school district and community leaders as they engage in policy discussions and make an eventual decision to shift to a later high school start time?
The literature review included in this research report is intended to be an overview of many key studies across a range of topics associated with teens and sleep. Because the range of topics embedded within the design of this study is so wide, we have touched on the topics that have relevance for this investigation, citing literature for each one. To that end, the findings of this research can be framed within what we already know and what is still to be investigated or confirmed.
Center for Applied Research and Educational Improvement 3 University of Minnesota
Overview of Factors Related to Sleep in Adolescence
While all of the benefits of sleep are not yet clear, the fact that all animals do sleep indicates its importance (Tononi & Cirelli, 2013; Tononi & Cirelli, 2005). Sleep appears to help with the encoding of memories and learning (Carskadon, 2011a; Payne, 2011; Tononi & Cirelli, 2013; Tononi & Cirelli, 2006), ability to pay attention (Beebe, 2011; Beebe, Rose, & Amin, 2010), emotional regulation (Dahl, 1999) and other health benefits such as lower prevalence of mood disorders (Harvey, Alfano & Clarke, in press). Additionally, evidence of higher sleep amounts in younger animals suggests that sleep plays an important role during the maturational process (Dahl, 1999). Given that adolescence is a time of great biological change, it is necessary to consider the importance of getting enough sleep in this developmental period. Although many believe that the amount of sleep needed decreases as a child enters adolescence, research has shown that adolescents still need the same amount of sleep or more (Carskadon, 2013; Carskadon, Acebo, & Jenni, 2004). While an estimated 9 hours 20 minutes may be ideal for adolescents (Carskadon, 2013), results from many studies have found that, on average, adolescents report sleeping less than 8 hours on school nights (Carskadon, 2011b; Carskadon, Wolfson, Acebo, Tzischinsky, & Seifer, 1998; Dexter, 2003; Eliasson, Eliasson, King, Gould, & Eliasson, 2002; National Sleep Foundation, 2006; Wahlstrom, 2002). While students tend to report longer amounts of sleep on weekends, typically believed to be due to attempting to “catch up” from inadequate sleep during the school week, there are still detrimental effects due to the insufficient sleep on school nights (Andrade, Benedito-Silva, Domenice, Arnhold & Menna-Barreto, 1993; Dahl & Lewin, 2002; Wahlstrom, 2002). Given the negative effects, it is important to consider why adolescents tend to be sleep deprived.
Factors Influencing Amount of Sleep
Adolescence brings changes in a child’s life due to a number of biological changes and psychosocial factors. Not only are children going through puberty, they are also experiencing more independence through choice of after school activities, driving, after school jobs, and other responsibilities, as well as more peer influence on their thoughts and behavior.
Biological changes. Aside from physiological changes associated with puberty, changes in natural sleep time preference occurs in adolescence (Crowley, Acebo, & Carskadon, 2007; Hagenauer, Perryman, Lee, & Carskadon, 2009). As children reach more advanced stages of physical puberty, the changes in the sleep patterns become more pronounced (Carsdakon, 1999). Sleep patterns are influenced by two competing, yet compatible processes known as the circadian rhythm (Process C) and homeostasis (Process S) (Crowley, Acebo, & Carskadon, 2007; Hagenauer, Perryman, Lee, & Carskadon, 2009).

Center for Applied Research and Educational Improvement 4 University of Minnesota
Process S can be thought of as a measure of sleep pressure. That is, when one has been awake for a while, the pressure to sleep becomes greater; however, if one has been sleeping for some time, the pressure to sleep lessens. Process C, on the other hand, can be thought of more as a biological clock that lets us know when sleep should occur. This feeling of when sleep should occur is related to when the body is exposed to light as well as when secretion of a chemical known as melatonin occurs. As children mature, the timing of melatonin secretion becomes later in the evening (Tarokh & Carskadon, 2009), known as a phase delay.
It has been shown that the pressure to fall asleep tends to become lower as a child enters adolescence (Carskadon, Acebo, & Jenni, 2004; Carskadon, 2011b). This, in combination with the natural phase delay in the circadian rhythm can help to explain why sleeping patterns change with puberty. This phase delay has been seen in other types of mammals at puberty, which provides further evidence of the shift in circadian phase seen in humans being purely biological (Hagenauer et al., 2009). However, the reason adolescents tend to have insufficient sleep is not solely due to their body’s natural changes, but also due to an interaction with societal expectations and norms.
Societal expectations. One of the most commonly cited and researched societal factors influencing adolescent sleep is that of school start times. In the United States in particular, as students get older, school start times tend to be earlier (Wolfson & Carskadon, 2005). However, this pattern of earlier morning obligations is in direct opposition to the students’ natural sleep patterns. It has repeatedly been shown that when middle or high school start times are pushed later, students still tend to go to bed about the same time, but, due to waking up later, increase their sleep (Carskadon et al., 1998; Vedaa, Saxvig & Wilhelmsen-Langeland, Wahlstrom, 2002). While the benefits to later school start times are undeniable regarding amount of sleep students get, there are many other factors which must be considered. When schools change their schedules, transportation to and from school and school activities can be affected in a variety of ways. For instance, many school districts use the same buses to serve multiple schools. If the start times of some schools are delayed, it is possible that the change would force other schools to start earlier in order to allow for all necessary busing to occur. Typically, this would mean that younger students would have to catch the bus at an earlier time, which may mean more time spent waiting in the dark (Wrobel, 1999; Wahlstrom, 2002; Wolfson & Carskadon, 2005). If the younger children are also beginning earlier than the adolescents, this can mean that older children are no longer available for after school care for their younger siblings. A similar problem with parent work schedules and providing transportation and child care could occur with a change in school start times (Wrobel, 1999). Delaying the start time of schools may affect after school activities, such as sports, because school end times are delayed as well. With sports schedules dependent on other school schedules, more time in the afternoon classes may have to be missed by some students in order to allow them to participate in sports games. The amount of time that students would have available for after school jobs may also become less, which could be problematic for families that rely on adolescent income for everyday living (Wolfson & Carskadon, 2005; Wrobel, 1999). That said,

Center for Applied Research and Educational Improvement 5 University of Minnesota
the study by Wahlstrom (2002) found there was no negative impact on after school employment of high school students whose schools shifted to later start times because all employers who were interviewed indicated that their need for additional staff did not occur until 4:00 PM or later. While changing school start times can negatively impact ability to participate in after school activities, the increased need for social activities in adolescence may be related to insufficient sleep as well. Students not only want to participate in social activities, but also must complete daily homework assignments. Some students may sacrifice sleep in order to be able to complete both types of activities.
Use of technology. In adolescence, there is increased reliance on technology for social interactions as well as increased availability of technology (National Sleep Foundation, 2006). Negative effects of nighttime use of computers or watching TV, such as difficulty falling asleep (Polos et al., 2010; Shochat, Flint-Bretler, & Tzischinsky, 2010), as well as problems with mood, behavior, and cognitive functioning during the day have been reported (Polos et al., 2010). Many students with technology in their bedrooms report frequent awakening at night due to receiving a text, phone call, or email (Harvey et al., in press).
Light exposure. As mentioned above, the circadian rhythm is influenced in part by exposure to light. This light can either be natural, as from the sun, or artificial, as from electronics such as a computer or TV. Thus, adolescents who report using an electronic device which emits light, in particular blue light, shortly before bed may be artificially affecting their bodies’ natural sleep rhythm (Calamaro et al., 2009; Carskadon, 2013). While light exposure in the morning helps adults to awaken more easily, there is some evidence that this facilitating factor is diminished in adolescence (Hansen et al., 2005) while the effect of evening light exposure inhibiting sleep may be enhanced (Carskadon, Acebo, & Jenni, 2004).
Caffeine. Another known inhibiter of sleep is the consumption of caffeine. Not only is drinking soda prevalent in adolescence, energy drinks high in caffeine content, as well as coffee and tea, are also consumed (Calamaro, Mason, & Ratcliffe, 2009; Ludden & Wolfson, 2009; Pollak & Bright, 2003). Because caffeine is known to reduce sleep pressure, it is no surprise that studies looking at adolescent consumption find that students who have more caffeinated drinks slept less overall (Ludden & Wolfson, 2009; Pollak & Bright, 2003) and tend to have a harder time staying awake at school (Calamaro et al., 2009; Ludden & Wolfson, 2009).
Consequences of Not Enough Sleep
Mental health and behavioral outcomes. Sleep problems in childhood are known to be predictive of the development of anxiety and depressive symptoms as the child matures (Beebe, 2011). This negative effect of sleep problems appears to carry on into adolescence, where teens are more likely to have lower self-esteem (Frediksen, Rhodes, Reddy & Way, 2004), have a more negative attitude towards life (Perkinson-Gloor, Lemola, & Grob, 2013), more problems regulating their emotions (Dahl, 1999; Dahl & Lewin, 2002), higher rates of mood disorders (Harvey et al., in press), and thoughts of suicide (Fitzgerald, Messias, & Buysse, 2011).
Center for Applied Research and Educational Improvement 6 University of Minnesota
However, mood disorders such as depression or bipolar disorder are considered to have a bidirectional causal influence with sleep (Harvey et al., in press). That is, people with depression tend to have more sleep problems, but people with more sleep problems also tend to be more likely to be depressed. A bidirectional causal relationship between sleep and suicidality may also exist (Fitzgerald et al., 2011; Gau et al., 2007), revealing the difficulty of interpreting the interaction between sleep, depressive symptoms, and thoughts of suicide.
High risk behaviors. Many people who have mood disorders such as depression also tend to use drugs and alcohol more (Harvey et al., in press). Teens who report having insufficient sleep have been found to be more likely to smoke cigarettes, use marijuana, engage in sexual activity, and drink alcohol (McKnight-Eily et al., 2011; Dahl & Lewin, 2002). Furthermore, older adolescents and college students who are at the late end of the morningness-eveningness continuum are more likely to habitually use drugs and alcohol (Gau et al., 2007; Onyper, Tacher, Gilber, & Gradess, 2012).
Attention problems. Ability to focus is important not only for learning of new information, but also for safe completion of activities such as driving. The level of inattentive behavior has been found to be higher for students who have had less sleep (Beebe et al., 2010; Lufi, Tzischinsky, & Hadar, 2011). Additionally, reaction times improve in students who have had more sleep (Lufi et al., 2011; Vedaa et al., 2012). Given that reaction time is an important factor when driving in order to avoid having an accident, it is no surprise that there is a high prevalence of teen automobile accidents. Lower quality sleep has been shown to be associated with higher prevalence of self-reported accidents among teen drivers (Pizza et al., 2010), as well as lower quantity (Danner & Phillips, 2008). A study that used DMV records of teen automobile accidents found that adolescent automobile accidents occurred at a higher rate in a city which had an earlier high school start time than its neighboring, but demographically similar city (Vorona et al., 2011). Because of the extensive research indicating that students who start school later get more sleep, it may be reasonable to assume that this difference in crash rates is in part due to differences in sleep amounts for teens in the two cities.
Academics. While the evidence pertaining to consequences of not enough sleep in adolescents as related to academic outcomes (grades, test scores, attendance) is still emerging, the general consensus of research indicates that good sleep has a positive relationship with academic outcomes for students in middle school all the way through college (Wolfson & Carskadon, 2003; Edwards, 2012; Wahlstrom, 2002; Carrell, Maghakian, & West, 2011). Additionally, if students do not obtain enough sleep before beginning their school day, they will have more difficulty understanding material taught that day and struggle to complete an assignment or test, regardless of the amount of time spent studying (Gillen-O’Neel, Huynh, & Fuligni, 2013).
Studies have shown when school start times are pushed back, an increase in amount of sleep, as well as attendance and decrease in tardies to first period are observed (Drake et al., 2003; Wahlstrom, 2002). While some studies do not report a significant relationship between
Center for Applied Research and Educational Improvement 7 University of Minnesota
grade point average (GPA) and amount of sleep (Eliasson et al., 2002; Wahlstrom, 2002; Fredriksen et al., 2004), studies where the variables in the methodology could be adequately controlled do show a relationship between amount of sleep and GPA (Carrell et al., 2011; Perkinson-Gloor et al., 2013). In studies that examined subject areas independently, mathematics grades appear to be more related to amount of sleep obtained than other core courses (Ng, Ng, & Chan, 2009). As with grades, there are inconsistent results in studies that examined changes in test scores related to more sleep, with some reporting a positive effect (Edwards, 2012; Carrell, 2011) and others reporting no effect (Hinrichs, 2012). However, as with the studies looking at grades, those which found significant, positive relationships used stronger and more valid methodology to assess the relationship between sleep and test scores.
It is known that people who consider themselves as “morning people” show their best performance earlier in the day, with performance decreasing as the day continues. On the other hand, evening types tend to show greater performance throughout the day (Anderson et al., 1991). One possible explanation for the lack of academic effects found in some studies is that most adolescents tend to shift towards being evening types (Randler & Frech, 2009) and tend to show optimal performance on tasks later in the day (Hansen et al., 2005; Kirby, Maggi, & D’Angiulli, 2011). Therefore, studies which look at differences in academic tests such as the ACT which are typically given in the morning (e.g., Hinrichs, 2011) may not be controlling for the confounding factor of the time of day that the assessment is given. To summarize, sleep plays an important role in all aspects of an adolescent’s life. Insufficient sleep can be related to attention problems both in and out of school, general cognitive functioning, emotional regulation, mood disorders, engaging in risky behaviors, and academic outcomes. Therefore, it is important that school personnel, parents, and students alike understand and make choices using the knowledge that we have about sleep both as a framework and a lens.

Center for Applied Research and Educational Improvement 8 University of Minnesota
Profiles of Participating Communities
This study involved an array of city and suburban communities. As seen in the profiles of the communities below, median family income ranged from $53,974 to $95,173, and graduation rates ranged from 81% to 97%. Ethnic diversity information reveals a range as well, with some communities having 90% White students and others having up to 40% students of color. Mahtomedi Public Schools (MN)
Mahtomedi is a small suburb located northeast of St. Paul, Minnesota. In addition to the city of Mahtomedi, the district services the neighboring communities of Dellwood, Grant, Hugo, Pine Springs, Willernie, and parts of Lake Elmo, Oakdale, Stillwater, and White Bear Lake. The population of Mahtomedi is approximately 7,883 people, and a total of 3,305 students attending the district schools. The student body is largely White (90%), with less than 1% of students identified as English Learners. Approximately 10% of students are eligible for free or reduced price lunch and 9% receive special education services. The district has four schools, including one high school, one middle school, and two elementary schools, with a ratio of approximately one licensed teacher for every 18 students. Mahtomedi Public Schools are high performing, with test scores above state averages for math, reading, and science over the last several years and a 97% graduation rate. The estimated median household income for the city of Mahtomedi is $95,173. Given its location, many residents commute for work to businesses in the Twin Cities metro area.
St. Louis Park (MN)
St. Louis Park is a first-ring suburb immediately west of Minneapolis, Minnesota, with its school district serving an area of 10.8 square miles. The community has approximately 46,363 residents, and a total of 4,605 students attending the district schools. While the majority of students are White (60%), about 22% are Black/African American and 10% Hispanic/Latino, with 9% of students identified as English Learners. Approximately 34% of students are eligible for free or reduced price lunch, and 15% receive special education services. The district has 12 schools, with a ratio of approximately one licensed teacher for every 18 students. In terms of performance, St. Louis Park test scores have been consistent with state averages for math, reading, and science over the last several years. However, the district has failed to meet adequate yearly progress (AYP) in math for the last three years. The graduation rate in 2013 was 89%. The estimated median household income for St. Louis Park is $64,300. Given its location, many residents commute for work to businesses in the Twin Cities metro area or work in one of the 2,700 businesses in the St. Louis Park community.

Center for Applied Research and Educational Improvement 9 University of Minnesota
South Washington County (MN)
South Washington County is a large suburban district located southeast of St. Paul, Minnesota. The district includes all or parts of the communities of Cottage Grove, Newport, St. Paul Park, Woodbury, and Afton, Denmark and Grey Cloud Island Townships, an area of 84 square miles. The population within district boundaries is approximately 94,000 people, and 17,300 students attend district schools. The student body is mostly White (74%), with small percentages of students who are Asian/Pacific Islander (10%), African American/Black (9%), or Hispanic (7%). Approximately 10% of students are eligible for free or reduced price lunch, 9% receive special education services, and 5% are identified as English Learners. The district has 28 schools, with a ratio of approximately one licensed teacher for every 16 students. In terms of performance, South Washington County test scores have been slightly above state averages for math, reading, and science over the last several years. In 2013, the graduation rate was 90%. The two major communities in the South Washington Country School District are Woodbury (64,496 residents) and Cottage Grove (35,181), with estimated median household incomes of $94,506 and $82,107, respectively. Residents are employed by the many retail and manufacturing businesses in South Washington County or commute to work in the Twin Cities metro area.
Boulder Valley School District (CO)
Boulder, Colorado is located at the base of the foothills of the Rocky Mountains, 25 miles northwest of Denver. The Boulder Valley School District is based in Boulder, but also serves several neighboring communities, including Gold Hill, Jamestown, Lafayette, Louisville, Nederland, Superior, and Ward. Its area also includes portions of Broomfield and Erie. The estimated population of Boulder is 101,808, and 29,526 students attend the Boulder Valley District schools. The current study involved only two of Boulder’s 13 high schools: Boulder High School and Fairview High School. These two high schools have similarly sized student bodies, with around 2,000 students each. At Boulder High School, the student body is mostly White (71%), with the second most represented group being Hispanic (18%), and small percentages of Asian (4%), African American/Black (2%), and American Indian/Alaskan Native (less than 1%). Like Boulder, Fairview’s student body is mostly White (76%), but the second most represented group is Asian (10%), followed by Hispanic (8%), with less than 1% of students represented by African American/Black or American Indian/Alaskan Native. The percentage of students eligible for free or reduced price lunch is higher at Boulder High School (18%) than at Fairview High School (7%). District-wide, approximately 9% of students receive special education services and 9% are identified as English Learners.
Overall, the Boulder Valley School District has 55 schools, with a ratio of approximately one teacher for every 18 students. The district test scores have been above state averages for math, reading, science, and writing over the last few years, and the graduation rate is 97%. Boulder has a diverse economy representing a variety of industries. Most employment is in
Center for Applied Research and Educational Improvement 10 University of Minnesota
government (including the University of Colorado and federal labs) and the professional services, manufacturing, accommodations and food services, retail, health care, and information industries. The estimated median household income for the city of Boulder is $56,206. Teton County School District (WY)
Jackson (also referred to as “Jackson Hole”), Wyoming, is a town in the Jackson Hole valley of Teton County, surrounded by the Teton and Gros Ventre mountain ranges. Teton County School District is based in Jackson, but also serves many neighboring small communities, such as Alta, Hoback, Moose, South Park, Teton Village, Wilson, Kelly, and Moran. The estimated population of Jackson is 9,838, and 2,487 students attend the Teton County District schools. The student body is mostly White (66%), with the second most represented group being Hispanic (30%), and small percentages of Asian (1%), African American/Black (less than 1%), and American Indian/Alaskan Native (less than 1%). Approximately 22% of students are eligible for free or reduced price lunch, 12% receive special education services, and 15% are identified as English Learners. The district has nine schools, with a ratio of approximately one teacher for every 12 students. In 2012, the graduation rate was 81%. Jackson Hole Valley is a major gateway for tourists, located in close proximity to national parks (Grand Teton and Yellowstone) and several impressive ski resorts. Accordingly, the local economy is primarily supported by tourism with arts, entertainment, recreation, accommodation, and food services serving as major industries. In Jackson, the estimated median household income is $53,974.
Center for Applied Research and Educational Improvement 11 University of Minnesota
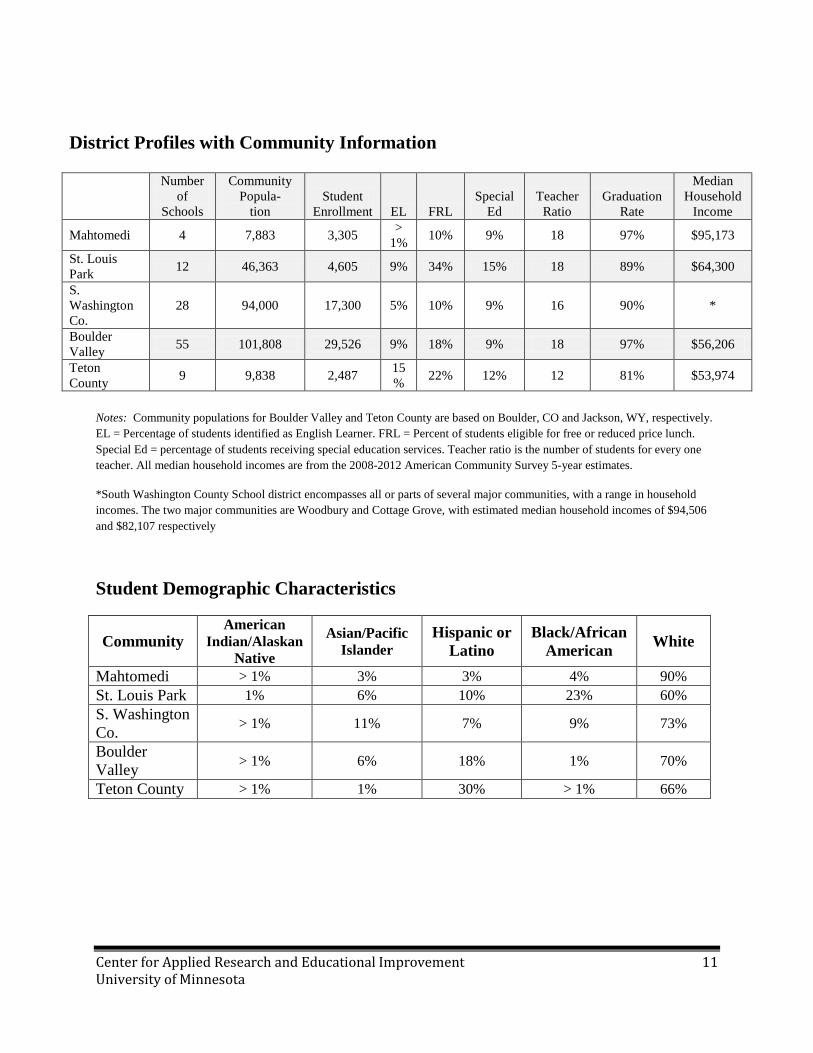
Notes: Community populations for Boulder Valley and Teton County are based on Boulder, CO and Jackson, WY, respectively. EL = Percentage of students identified as English Learner. FRL = Percent of students eligible for free or reduced price lunch. Special Ed = percentage of students receiving special education services. Teacher ratio is the number of students for every one teacher. All median household incomes are from the 2008-2012 American Community Survey 5-year estimates.
*South Washington County School district encompasses all or parts of several major communities, with a range in household incomes. The two major communities are Woodbury and Cottage Grove, with estimated median household incomes of $94,506 and $82,107 respectively
Student Demographic Characteristics
Community American
Indian/Alaskan Native
Asian/Pacific Islander
Hispanic or Latino
Black/African American White
Mahtomedi > 1% 3% 3% 4% 90% St. Louis Park 1% 6% 10% 23% 60% S. Washington Co. > 1% 11% 7% 9% 73%
Boulder Valley > 1% 6% 18% 1% 70%
Teton County > 1% 1% 30% > 1% 66%
District Profiles with Community Information
Number of
Schools
Community Popula-
tion Student
Enrollment EL FRL Special
Ed Teacher
Ratio Graduation
Rate
Median Household
Income
Mahtomedi 4 7,883 3,305 > 1% 10% 9% 18 97% $95,173
St. Louis Park 12 46,363 4,605 9% 34% 15% 18 89% $64,300
S. Washington Co.
28 94,000 17,300 5% 10% 9% 16 90% *
Boulder Valley 55 101,808 29,526 9% 18% 9% 18 97% $56,206
Teton County 9 9,838 2,487 15
% 22% 12% 12 81% $53,974
Center for Applied Research and Educational Improvement 12 University of Minnesota
Teen Sleep Habits Survey
Center for Applied Research and Educational Improvement 13 University of Minnesota
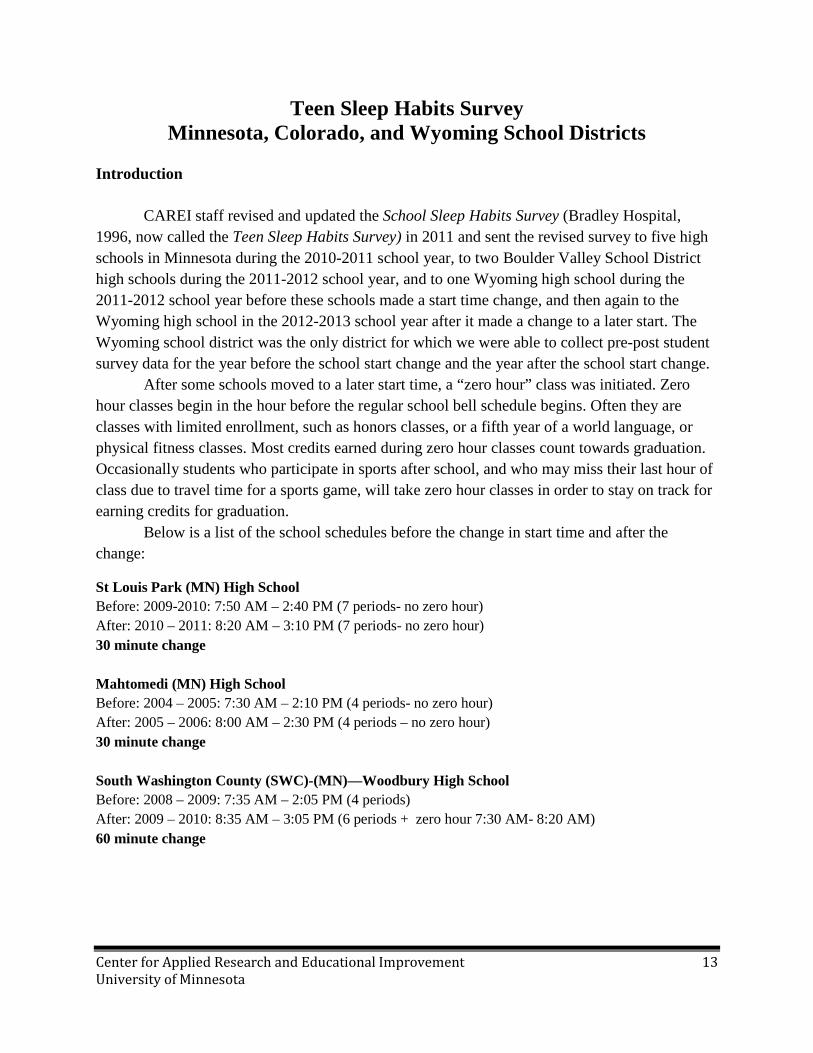
Teen Sleep Habits Survey Minnesota, Colorado, and Wyoming School Districts
Introduction
CAREI staff revised and updated the School Sleep Habits Survey (Bradley Hospital, 1996, now called the Teen Sleep Habits Survey) in 2011 and sent the revised survey to five high schools in Minnesota during the 2010-2011 school year, to two Boulder Valley School District high schools during the 2011-2012 school year, and to one Wyoming high school during the 2011-2012 school year before these schools made a start time change, and then again to the Wyoming high school in the 2012-2013 school year after it made a change to a later start. The Wyoming school district was the only district for which we were able to collect pre-post student survey data for the year before the school start change and the year after the school start change.
After some schools moved to a later start time, a “zero hour” class was initiated. Zero hour classes begin in the hour before the regular school bell schedule begins. Often they are classes with limited enrollment, such as honors classes, or a fifth year of a world language, or physical fitness classes. Most credits earned during zero hour classes count towards graduation. Occasionally students who participate in sports after school, and who may miss their last hour of class due to travel time for a sports game, will take zero hour classes in order to stay on track for earning credits for graduation.
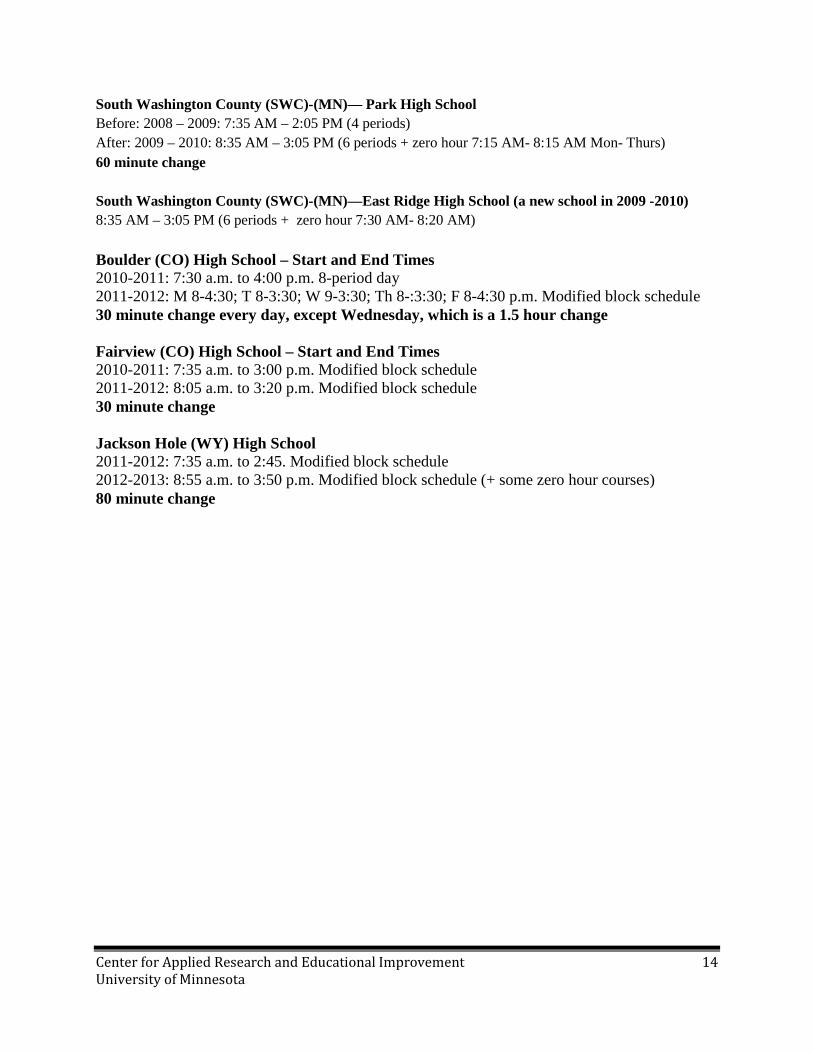
Below is a list of the school schedules before the change in start time and after the change:
St Louis Park (MN) High School Before: 2009-2010: 7:50 AM – 2:40 PM (7 periods- no zero hour) After: 2010 – 2011: 8:20 AM – 3:10 PM (7 periods- no zero hour) 30 minute change Mahtomedi (MN) High School Before: 2004 – 2005: 7:30 AM – 2:10 PM (4 periods- no zero hour) After: 2005 – 2006: 8:00 AM – 2:30 PM (4 periods – no zero hour) 30 minute change South Washington County (SWC)-(MN)—Woodbury High School Before: 2008 – 2009: 7:35 AM – 2:05 PM (4 periods) After: 2009 – 2010: 8:35 AM – 3:05 PM (6 periods + zero hour 7:30 AM- 8:20 AM) 60 minute change
Center for Applied Research and Educational Improvement 14 University of Minnesota
South Washington County (SWC)-(MN)— Park High School Before: 2008 – 2009: 7:35 AM – 2:05 PM (4 periods) After: 2009 – 2010: 8:35 AM – 3:05 PM (6 periods + zero hour 7:15 AM- 8:15 AM Mon- Thurs) 60 minute change South Washington County (SWC)-(MN)—East Ridge High School (a new school in 2009 -2010) 8:35 AM – 3:05 PM (6 periods + zero hour 7:30 AM- 8:20 AM) Boulder (CO) High School – Start and End Times 2010-2011: 7:30 a.m. to 4:00 p.m. 8-period day 2011-2012: M 8-4:30; T 8-3:30; W 9-3:30; Th 8-:3:30; F 8-4:30 p.m. Modified block schedule 30 minute change every day, except Wednesday, which is a 1.5 hour change Fairview (CO) High School – Start and End Times 2010-2011: 7:35 a.m. to 3:00 p.m. Modified block schedule 2011-2012: 8:05 a.m. to 3:20 p.m. Modified block schedule 30 minute change Jackson Hole (WY) High School 2011-2012: 7:35 a.m. to 2:45. Modified block schedule 2012-2013: 8:55 a.m. to 3:50 p.m. Modified block schedule (+ some zero hour courses) 80 minute change
Center for Applied Research and Educational Improvement 15 University of Minnesota
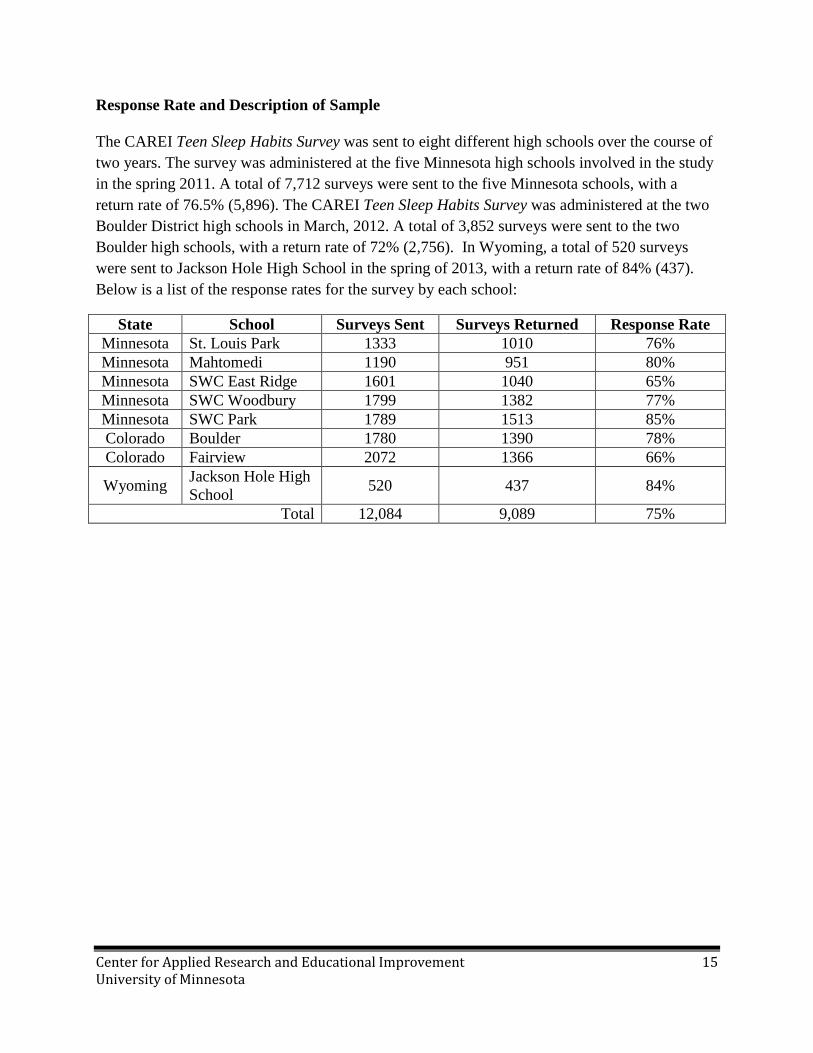
Response Rate and Description of Sample The CAREI Teen Sleep Habits Survey was sent to eight different high schools over the course of two years. The survey was administered at the five Minnesota high schools involved in the study in the spring 2011. A total of 7,712 surveys were sent to the five Minnesota schools, with a return rate of 76.5% (5,896). The CAREI Teen Sleep Habits Survey was administered at the two Boulder District high schools in March, 2012. A total of 3,852 surveys were sent to the two Boulder high schools, with a return rate of 72% (2,756). In Wyoming, a total of 520 surveys were sent to Jackson Hole High School in the spring of 2013, with a return rate of 84% (437). Below is a list of the response rates for the survey by each school:
State School Surveys Sent Surveys Returned Response Rate Minnesota St. Louis Park 1333 1010 76% Minnesota Mahtomedi 1190 951 80% Minnesota SWC East Ridge 1601 1040 65% Minnesota SWC Woodbury 1799 1382 77% Minnesota SWC Park 1789 1513 85% Colorado Boulder 1780 1390 78% Colorado Fairview 2072 1366 66%
Wyoming Jackson Hole High School 520 437 84%
Total 12,084 9,089 75%
Center for Applied Research and Educational Improvement 16 University of Minnesota
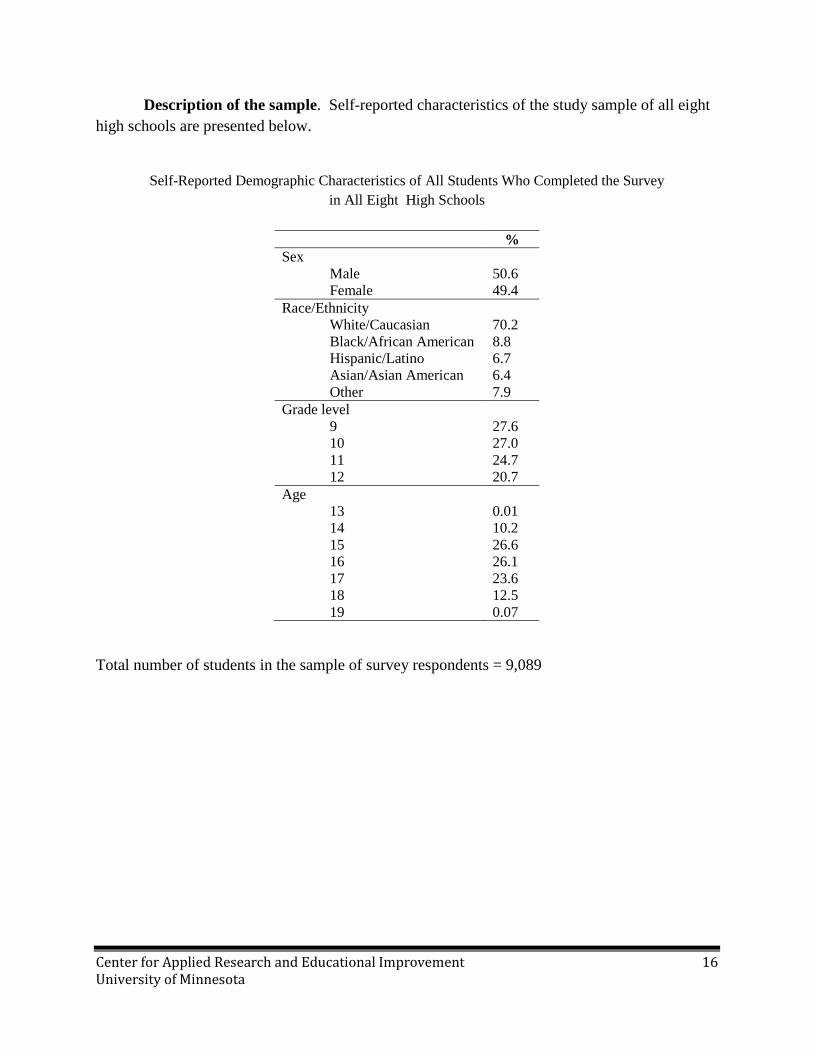
Description of the sample. Self-reported characteristics of the study sample of all eight high schools are presented below.
Self-Reported Demographic Characteristics of All Students Who Completed the Survey
in All Eight High Schools
% Sex
Male Female
50.6 49.4
Race/Ethnicity White/Caucasian Black/African American Hispanic/Latino Asian/Asian American Other
70.2 8.8 6.7 6.4 7.9
Grade level 9 10 11 12
27.6 27.0 24.7 20.7
Age 13 14 15 16 17 18 19
0.01 10.2 26.6 26.1 23.6 12.5 0.07
Total number of students in the sample of survey respondents = 9,089
Center for Applied Research and Educational Improvement 17 University of Minnesota
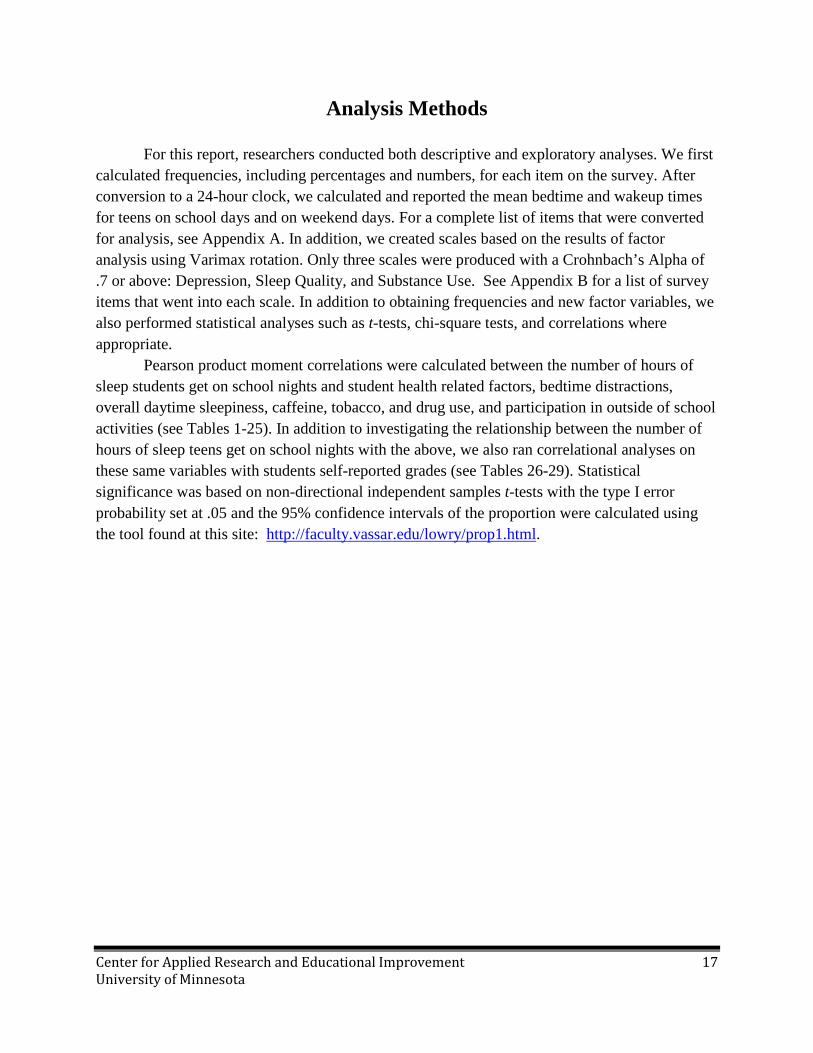
Analysis Methods
For this report, researchers conducted both descriptive and exploratory analyses. We first calculated frequencies, including percentages and numbers, for each item on the survey. After conversion to a 24-hour clock, we calculated and reported the mean bedtime and wakeup times for teens on school days and on weekend days. For a complete list of items that were converted for analysis, see Appendix A. In addition, we created scales based on the results of factor analysis using Varimax rotation. Only three scales were produced with a Crohnbach’s Alpha of .7 or above: Depression, Sleep Quality, and Substance Use. See Appendix B for a list of survey items that went into each scale. In addition to obtaining frequencies and new factor variables, we also performed statistical analyses such as t-tests, chi-square tests, and correlations where appropriate.
Pearson product moment correlations were calculated between the number of hours of sleep students get on school nights and student health related factors, bedtime distractions, overall daytime sleepiness, caffeine, tobacco, and drug use, and participation in outside of school activities (see Tables 1-25). In addition to investigating the relationship between the number of hours of sleep teens get on school nights with the above, we also ran correlational analyses on these same variables with students self-reported grades (see Tables 26-29). Statistical significance was based on non-directional independent samples t-tests with the type I error probability set at .05 and the 95% confidence intervals of the proportion were calculated using the tool found at this site: http://faculty.vassar.edu/lowry/prop1.html.
Center for Applied Research and Educational Improvement 18 University of Minnesota
Results
Teen Sleep Habits Survey All High Schools Combined
N=9,089
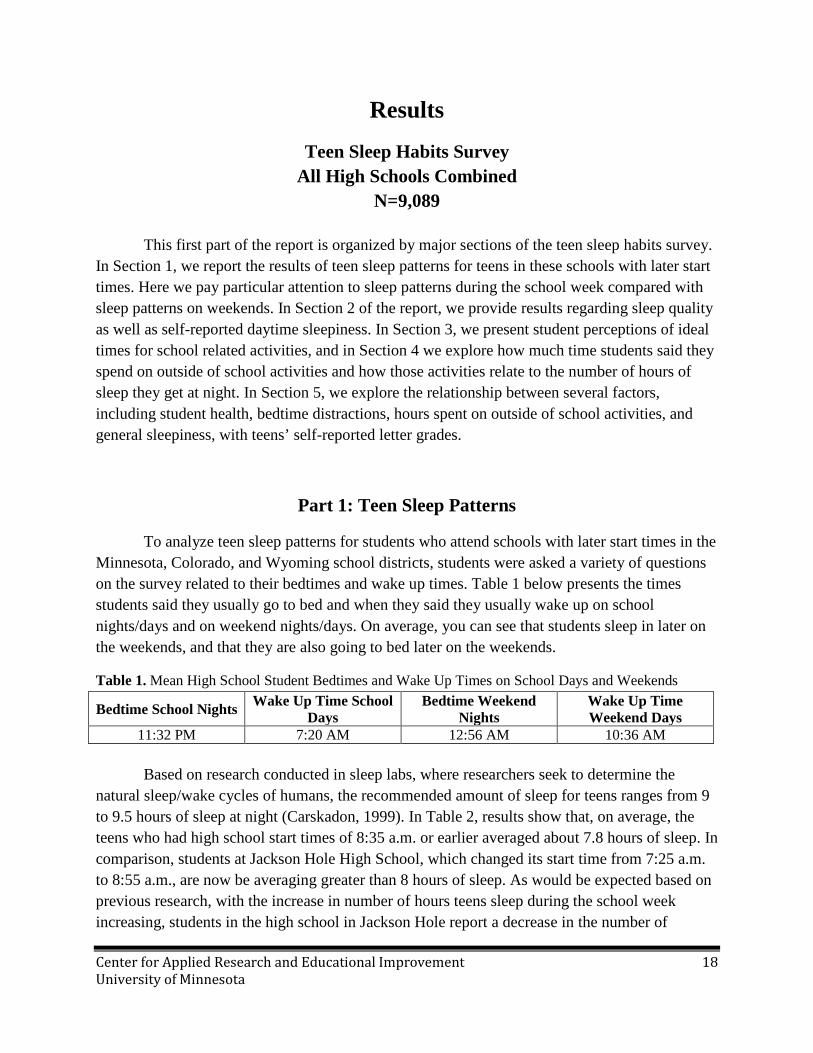
This first part of the report is organized by major sections of the teen sleep habits survey. In Section 1, we report the results of teen sleep patterns for teens in these schools with later start times. Here we pay particular attention to sleep patterns during the school week compared with sleep patterns on weekends. In Section 2 of the report, we provide results regarding sleep quality as well as self-reported daytime sleepiness. In Section 3, we present student perceptions of ideal times for school related activities, and in Section 4 we explore how much time students said they spend on outside of school activities and how those activities relate to the number of hours of sleep they get at night. In Section 5, we explore the relationship between several factors, including student health, bedtime distractions, hours spent on outside of school activities, and general sleepiness, with teens’ self-reported letter grades.
Part 1: Teen Sleep Patterns
To analyze teen sleep patterns for students who attend schools with later start times in the Minnesota, Colorado, and Wyoming school districts, students were asked a variety of questions on the survey related to their bedtimes and wake up times. Table 1 below presents the times students said they usually go to bed and when they said they usually wake up on school nights/days and on weekend nights/days. On average, you can see that students sleep in later on the weekends, and that they are also going to bed later on the weekends.
Table 1. Mean High School Student Bedtimes and Wake Up Times on School Days and Weekends
Bedtime School Nights Wake Up Time School Days
Bedtime Weekend Nights
Wake Up Time Weekend Days
11:32 PM 7:20 AM 12:56 AM 10:36 AM Based on research conducted in sleep labs, where researchers seek to determine the
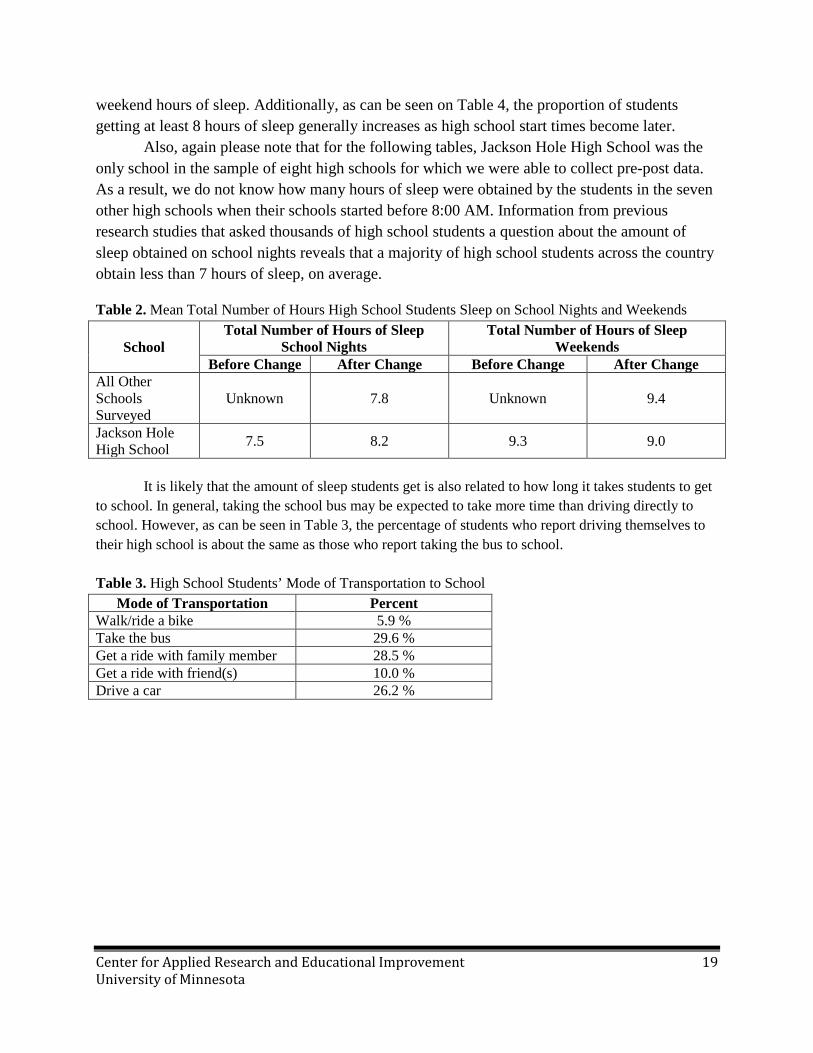
natural sleep/wake cycles of humans, the recommended amount of sleep for teens ranges from 9 to 9.5 hours of sleep at night (Carskadon, 1999). In Table 2, results show that, on average, the teens who had high school start times of 8:35 a.m. or earlier averaged about 7.8 hours of sleep. In comparison, students at Jackson Hole High School, which changed its start time from 7:25 a.m. to 8:55 a.m., are now be averaging greater than 8 hours of sleep. As would be expected based on previous research, with the increase in number of hours teens sleep during the school week increasing, students in the high school in Jackson Hole report a decrease in the number of
Center for Applied Research and Educational Improvement 19 University of Minnesota
weekend hours of sleep. Additionally, as can be seen on Table 4, the proportion of students getting at least 8 hours of sleep generally increases as high school start times become later.
Also, again please note that for the following tables, Jackson Hole High School was the only school in the sample of eight high schools for which we were able to collect pre-post data. As a result, we do not know how many hours of sleep were obtained by the students in the seven other high schools when their schools started before 8:00 AM. Information from previous research studies that asked thousands of high school students a question about the amount of sleep obtained on school nights reveals that a majority of high school students across the country obtain less than 7 hours of sleep, on average. Table 2. Mean Total Number of Hours High School Students Sleep on School Nights and Weekends
School Total Number of Hours of Sleep
School Nights Total Number of Hours of Sleep
Weekends Before Change After Change Before Change After Change
All Other Schools Surveyed
Unknown 7.8 Unknown 9.4
Jackson Hole High School 7.5 8.2 9.3 9.0
It is likely that the amount of sleep students get is also related to how long it takes students to get
to school. In general, taking the school bus may be expected to take more time than driving directly to school. However, as can be seen in Table 3, the percentage of students who report driving themselves to their high school is about the same as those who report taking the bus to school. Table 3. High School Students’ Mode of Transportation to School
Mode of Transportation Percent Walk/ride a bike 5.9 % Take the bus 29.6 % Get a ride with family member 28.5 % Get a ride with friend(s) 10.0 % Drive a car 26.2 %

Center for Applied Research and Educational Improvement 20 University of Minnesota
Previous national studies that assess the link between unhealthy behavior choices (e.g., drugs, alcohol, sexual activity) and depressive feelings and the amount of sleep time that students get (see McKnight-Eily, et al. 2011) have shown that 8 hours of sleep per night appears to be a critical point in whether or not high school students engage in such behaviors. In the table below, it is clear that as school starts later, an increasing number of high school students get 8 or more hours of sleep on school nights. For schools that started at around 7:30 AM, only a third to less than half of the student population obtained 8 hours of sleep or more. When the start time was 8:55 AM, the percentage of students obtaining at least 8 hours of sleep was 66%.
Table 4. Percent of High School Students Sleeping At Least 8 Hours Per School Night by School Start Time
School Start Time 7:30 AM 7:35 AM 8:00 AM 8:00 AM 8:05 AM 8:20 AM 8:35 AM 8:35 AM 8:35 AM 8:55 AM
School Year 2010-2011 2011-2012 2011-2012 2010- 2011
2011-2012 2010-2011 2010- 2011
2010- 2011
2010- 2011
2012-2013
District & State
Boulder Valley School District, CO
Teton County Schools, WY
Boulder Valley School District, CO
Mahtomedi School District, MN
Boulder Valley School District, CO
St. Louis Park High School, MN
South Washington Co., MN
South Washington Co., MN
South Washington Co., MN
Teton County Schools, WY
School Fairview High School
Jackson Hole High School
Boulder High School
Mahtomedi High School
Fairview High School
St. Louis Park High School
Woodbury High School
East Ridge High School
Park High School
Jackson Hole High School
Sample Size 333 446 1379 884 1353 902 1249 960 1407 459 Sleep ≥ 8 hours/night
33.6% 44.2% 44.5% 49.7% 42.5% 49.8% 57.0% 58.9% 60.0% 66.2%
Center for Applied Research and Educational Improvement 21 University of Minnesota
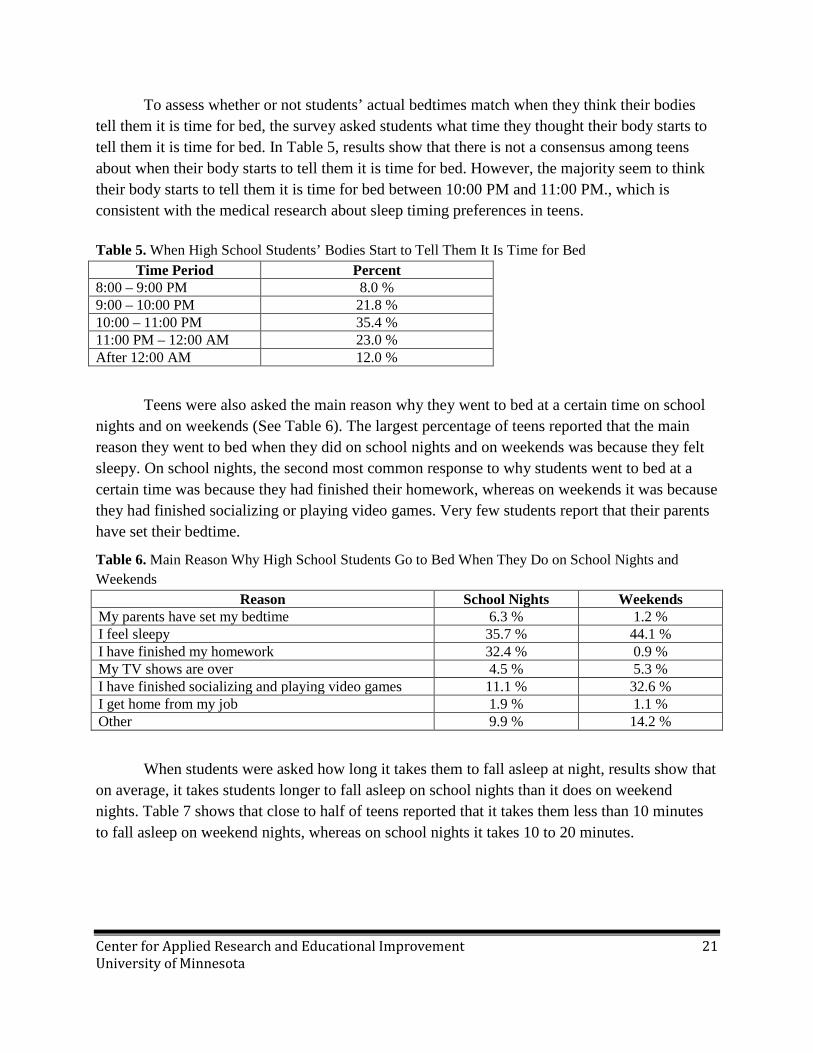
To assess whether or not students’ actual bedtimes match when they think their bodies tell them it is time for bed, the survey asked students what time they thought their body starts to tell them it is time for bed. In Table 5, results show that there is not a consensus among teens about when their body starts to tell them it is time for bed. However, the majority seem to think their body starts to tell them it is time for bed between 10:00 PM and 11:00 PM., which is consistent with the medical research about sleep timing preferences in teens. Table 5. When High School Students’ Bodies Start to Tell Them It Is Time for Bed
Time Period Percent 8:00 – 9:00 PM 8.0 % 9:00 – 10:00 PM 21.8 % 10:00 – 11:00 PM 35.4 % 11:00 PM – 12:00 AM 23.0 % After 12:00 AM 12.0 %
Teens were also asked the main reason why they went to bed at a certain time on school nights and on weekends (See Table 6). The largest percentage of teens reported that the main reason they went to bed when they did on school nights and on weekends was because they felt sleepy. On school nights, the second most common response to why students went to bed at a certain time was because they had finished their homework, whereas on weekends it was because they had finished socializing or playing video games. Very few students report that their parents have set their bedtime.
Table 6. Main Reason Why High School Students Go to Bed When They Do on School Nights and Weekends
Reason School Nights Weekends My parents have set my bedtime 6.3 % 1.2 % I feel sleepy 35.7 % 44.1 % I have finished my homework 32.4 % 0.9 % My TV shows are over 4.5 % 5.3 % I have finished socializing and playing video games 11.1 % 32.6 % I get home from my job 1.9 % 1.1 % Other 9.9 % 14.2 %
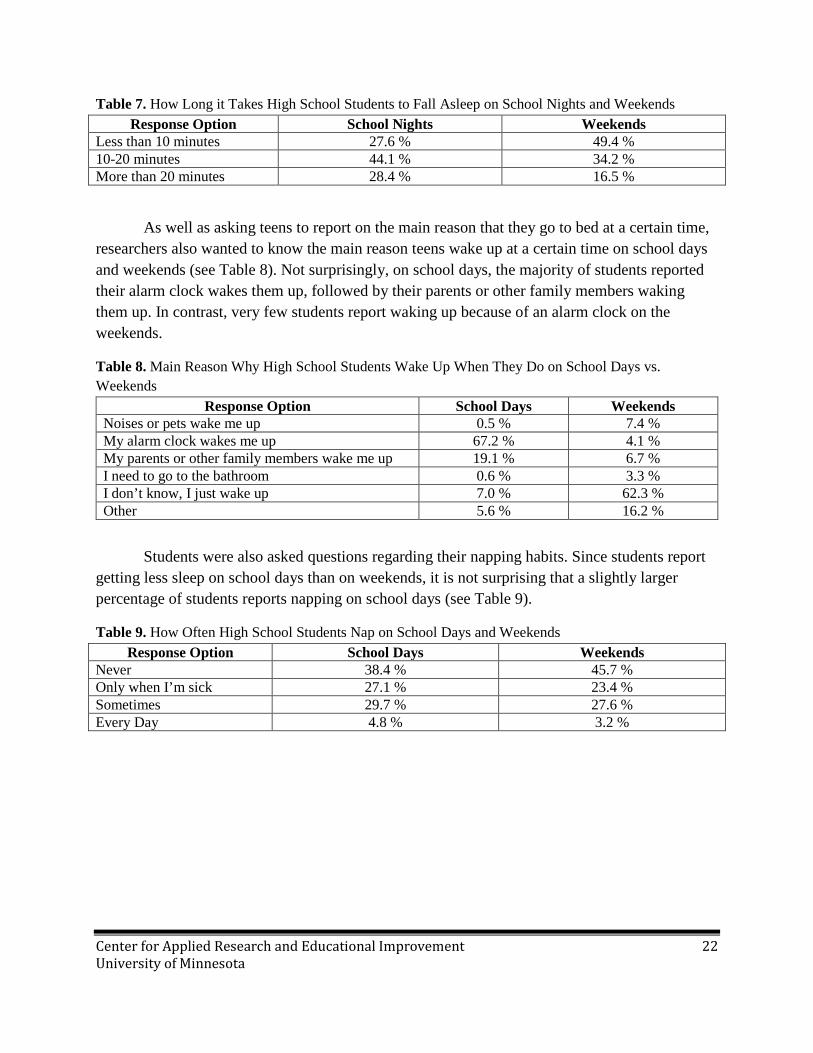
When students were asked how long it takes them to fall asleep at night, results show that on average, it takes students longer to fall asleep on school nights than it does on weekend nights. Table 7 shows that close to half of teens reported that it takes them less than 10 minutes to fall asleep on weekend nights, whereas on school nights it takes 10 to 20 minutes.
Center for Applied Research and Educational Improvement 22 University of Minnesota
Table 7. How Long it Takes High School Students to Fall Asleep on School Nights and Weekends Response Option School Nights Weekends
Less than 10 minutes 27.6 % 49.4 % 10-20 minutes 44.1 % 34.2 % More than 20 minutes 28.4 % 16.5 %
As well as asking teens to report on the main reason that they go to bed at a certain time, researchers also wanted to know the main reason teens wake up at a certain time on school days and weekends (see Table 8). Not surprisingly, on school days, the majority of students reported their alarm clock wakes them up, followed by their parents or other family members waking them up. In contrast, very few students report waking up because of an alarm clock on the weekends.
Table 8. Main Reason Why High School Students Wake Up When They Do on School Days vs. Weekends
Response Option School Days Weekends Noises or pets wake me up 0.5 % 7.4 % My alarm clock wakes me up 67.2 % 4.1 % My parents or other family members wake me up 19.1 % 6.7 % I need to go to the bathroom 0.6 % 3.3 % I don’t know, I just wake up 7.0 % 62.3 % Other 5.6 % 16.2 %
Students were also asked questions regarding their napping habits. Since students report getting less sleep on school days than on weekends, it is not surprising that a slightly larger percentage of students reports napping on school days (see Table 9).
Table 9. How Often High School Students Nap on School Days and Weekends Response Option School Days Weekends
Never 38.4 % 45.7 % Only when I’m sick 27.1 % 23.4 % Sometimes 29.7 % 27.6 % Every Day 4.8 % 3.2 %
Center for Applied Research and Educational Improvement 23 University of Minnesota
Part 2: Teen Sleep Quality and Daytime Sleepiness
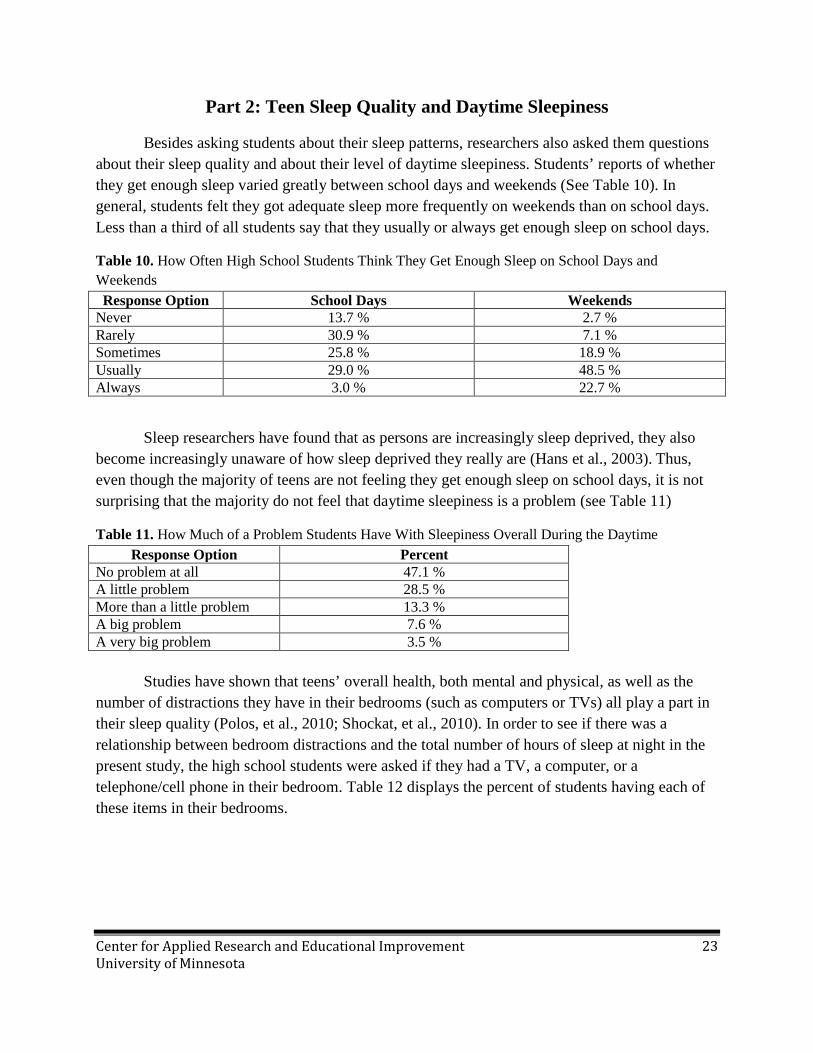
Besides asking students about their sleep patterns, researchers also asked them questions about their sleep quality and about their level of daytime sleepiness. Students’ reports of whether they get enough sleep varied greatly between school days and weekends (See Table 10). In general, students felt they got adequate sleep more frequently on weekends than on school days. Less than a third of all students say that they usually or always get enough sleep on school days.
Table 10. How Often High School Students Think They Get Enough Sleep on School Days and Weekends Response Option School Days Weekends
Never 13.7 % 2.7 % Rarely 30.9 % 7.1 % Sometimes 25.8 % 18.9 % Usually 29.0 % 48.5 % Always 3.0 % 22.7 %
Sleep researchers have found that as persons are increasingly sleep deprived, they also become increasingly unaware of how sleep deprived they really are (Hans et al., 2003). Thus, even though the majority of teens are not feeling they get enough sleep on school days, it is not surprising that the majority do not feel that daytime sleepiness is a problem (see Table 11)
Table 11. How Much of a Problem Students Have With Sleepiness Overall During the Daytime Response Option Percent
No problem at all 47.1 % A little problem 28.5 % More than a little problem 13.3 % A big problem 7.6 % A very big problem 3.5 %
Studies have shown that teens’ overall health, both mental and physical, as well as the
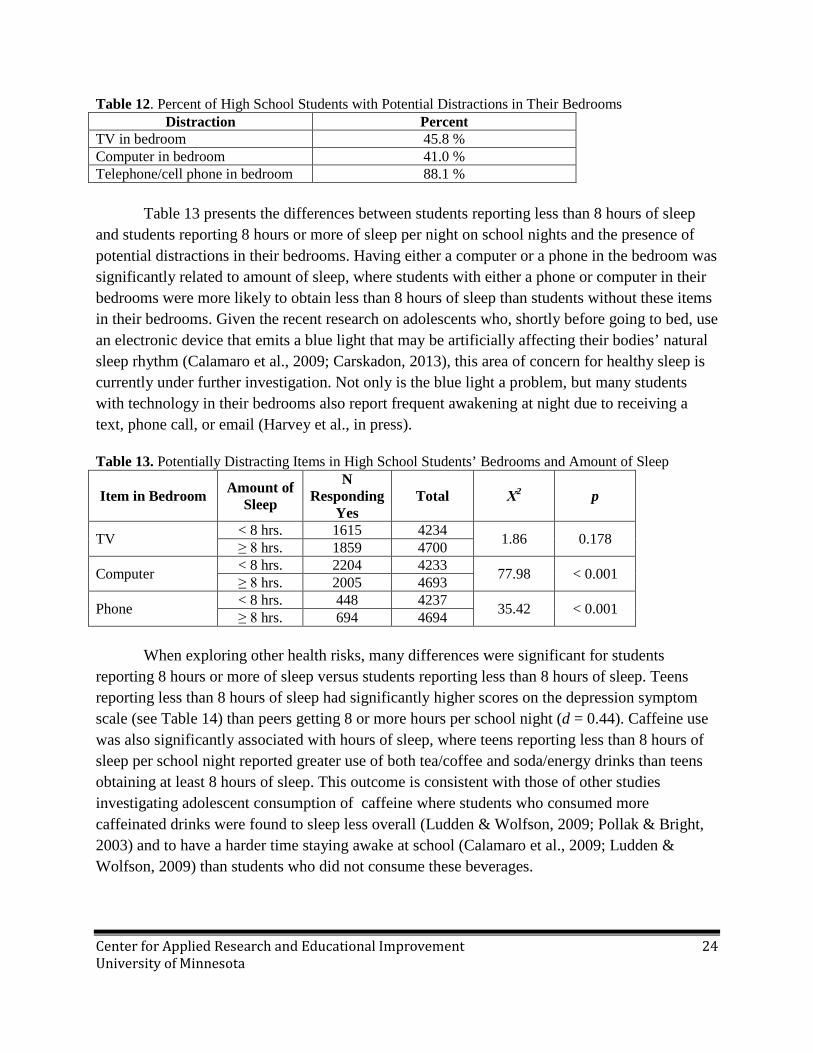
number of distractions they have in their bedrooms (such as computers or TVs) all play a part in their sleep quality (Polos, et al., 2010; Shockat, et al., 2010). In order to see if there was a relationship between bedroom distractions and the total number of hours of sleep at night in the present study, the high school students were asked if they had a TV, a computer, or a telephone/cell phone in their bedroom. Table 12 displays the percent of students having each of these items in their bedrooms.
Center for Applied Research and Educational Improvement 24 University of Minnesota
Table 12. Percent of High School Students with Potential Distractions in Their Bedrooms Distraction Percent
TV in bedroom 45.8 % Computer in bedroom 41.0 % Telephone/cell phone in bedroom 88.1 %
Table 13 presents the differences between students reporting less than 8 hours of sleep
and students reporting 8 hours or more of sleep per night on school nights and the presence of potential distractions in their bedrooms. Having either a computer or a phone in the bedroom was significantly related to amount of sleep, where students with either a phone or computer in their bedrooms were more likely to obtain less than 8 hours of sleep than students without these items in their bedrooms. Given the recent research on adolescents who, shortly before going to bed, use an electronic device that emits a blue light that may be artificially affecting their bodies’ natural sleep rhythm (Calamaro et al., 2009; Carskadon, 2013), this area of concern for healthy sleep is currently under further investigation. Not only is the blue light a problem, but many students with technology in their bedrooms also report frequent awakening at night due to receiving a text, phone call, or email (Harvey et al., in press). Table 13. Potentially Distracting Items in High School Students’ Bedrooms and Amount of Sleep
Item in Bedroom Amount of Sleep
N Responding
Yes Total Χ2 p
TV < 8 hrs. 1615 4234 1.86 0.178 ≥ 8 hrs. 1859 4700
Computer < 8 hrs. 2204 4233 77.98 < 0.001 ≥ 8 hrs. 2005 4693
Phone < 8 hrs. 448 4237 35.42 < 0.001 ≥ 8 hrs. 694 4694 When exploring other health risks, many differences were significant for students
reporting 8 hours or more of sleep versus students reporting less than 8 hours of sleep. Teens reporting less than 8 hours of sleep had significantly higher scores on the depression symptom scale (see Table 14) than peers getting 8 or more hours per school night (d = 0.44). Caffeine use was also significantly associated with hours of sleep, where teens reporting less than 8 hours of sleep per school night reported greater use of both tea/coffee and soda/energy drinks than teens obtaining at least 8 hours of sleep. This outcome is consistent with those of other studies investigating adolescent consumption of caffeine where students who consumed more caffeinated drinks were found to sleep less overall (Ludden & Wolfson, 2009; Pollak & Bright, 2003) and to have a harder time staying awake at school (Calamaro et al., 2009; Ludden & Wolfson, 2009) than students who did not consume these beverages.

Center for Applied Research and Educational Improvement 25 University of Minnesota
Table 14. High School Students’ Mean Depression Scale Scores by Amount of Sleep Sleep Group M SD t p d
< 8 hrs. 16.50 6.33 20.96 < 0.001 0.44 ≥ 8 hrs. 13.80 5.81 Students were also asked on the survey how often in the last 2 weeks they experienced a
negative sleep-related event at school. Table 15 shows that, at least once in the last 2 weeks, 31% of students arrived to class late because they overslept, 27% fell asleep in a morning class, and 29% fell asleep in an afternoon class. Even though the majority of students did not fall asleep in classes or arrive late due to oversleeping, it is notable that 87% of students said they felt tired, dragged out, or sleepy during the day at least once within the past 2 weeks, and 55% of students said they felt tired, dragged out, or sleepy several times or more in the past 2 weeks. Table 15. How Often High School Students Experienced Negative Sleep-Related Events at School in the Last 2 Weeks
Response Option
Arrived to Class Late Due to
Oversleeping
Fell Asleep in a Morning Class
Fell Asleep in an Afternoon Class
Felt Tired, Dragged Out or
Sleepy During the Day
Never 68.8 % 73.1 % 67.8 % 13.3 % Once 14.8 % 15.2 % 18.0 % 15.9 % Twice 6.9 % 6.0 % 7.3 % 16.0 % Several times 7.8 % 4.9 % 3.0 % 38.8 % Every day 1.7 % 0.8 % 0.8 % 15.9 %
Part 3: Students’ Perceptions of Ideal Times for School Start and for School-Related and Other Activities
In addition to sleep patterns, sleep quality, and daytime sleepiness, researchers also
wanted to investigate what students think is the ideal time for school to start. Table 16 shows that 75% of students think the ideal school start time is 8:30 AM or later, and half of all students say the ideal school start time is 9:00 AM or later.
Table 16. What Students Think Is the Ideal Time for School to Start Response Option Percent
7:00 AM 3.2 % 7:30 AM 5.1 % 8:00 AM 16.3 % 8:30 AM 24.8 % 9:00 AM 35.8 % Later than 9:00 AM 14.8 %
Center for Applied Research and Educational Improvement 26 University of Minnesota
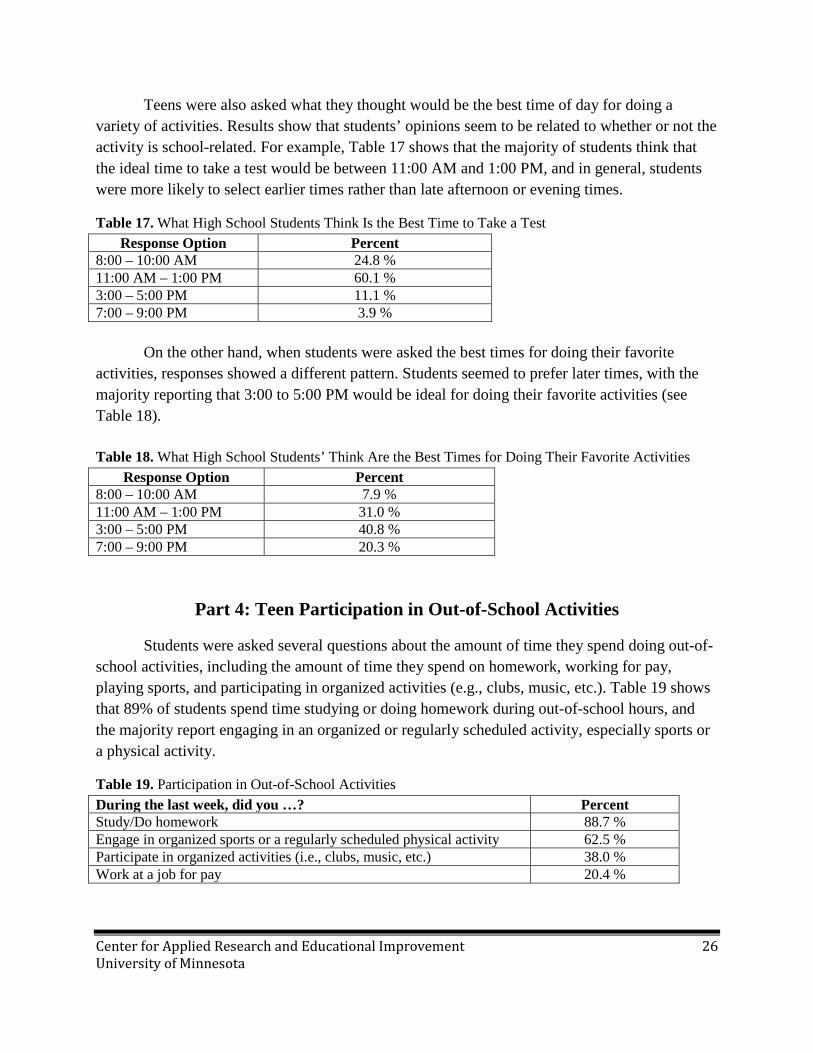
Teens were also asked what they thought would be the best time of day for doing a variety of activities. Results show that students’ opinions seem to be related to whether or not the activity is school-related. For example, Table 17 shows that the majority of students think that the ideal time to take a test would be between 11:00 AM and 1:00 PM, and in general, students were more likely to select earlier times rather than late afternoon or evening times.
Table 17. What High School Students Think Is the Best Time to Take a Test Response Option Percent
8:00 – 10:00 AM 24.8 % 11:00 AM – 1:00 PM 60.1 % 3:00 – 5:00 PM 11.1 % 7:00 – 9:00 PM 3.9 %
On the other hand, when students were asked the best times for doing their favorite
activities, responses showed a different pattern. Students seemed to prefer later times, with the majority reporting that 3:00 to 5:00 PM would be ideal for doing their favorite activities (see Table 18).
Table 18. What High School Students’ Think Are the Best Times for Doing Their Favorite Activities
Response Option Percent 8:00 – 10:00 AM 7.9 % 11:00 AM – 1:00 PM 31.0 % 3:00 – 5:00 PM 40.8 % 7:00 – 9:00 PM 20.3 %
Part 4: Teen Participation in Out-of-School Activities
Students were asked several questions about the amount of time they spend doing out-of-school activities, including the amount of time they spend on homework, working for pay, playing sports, and participating in organized activities (e.g., clubs, music, etc.). Table 19 shows that 89% of students spend time studying or doing homework during out-of-school hours, and the majority report engaging in an organized or regularly scheduled activity, especially sports or a physical activity.
Table 19. Participation in Out-of-School Activities During the last week, did you …? Percent Study/Do homework 88.7 % Engage in organized sports or a regularly scheduled physical activity 62.5 % Participate in organized activities (i.e., clubs, music, etc.) 38.0 % Work at a job for pay 20.4 %

Center for Applied Research and Educational Improvement 27 University of Minnesota
While not all students report doing out-of-school homework or studying, those who do spend an average of about 2 hours and 20 minutes a day on school days and a little over 3 hours 20 minutes per weekend (see Table 20).
Table 20. Mean Number of Hours High School Students Spend Studying* School Days Weekend 2.30 hours 3.28 hours
*Note: This table only includes students who said they studied or did homework for at least one hour during the school week.
Students were asked when they studied or did homework and were asked to check all the questionnaire options that applied to them (see Table 21). The only pattern that emerged was that students were more likely to do homework on school day mornings, afternoons, and evenings than on weekends.
Table 21. When High School Students Study or Do Homework During the last week, when did you study/do homework? (Mark all that apply.) Percent
In the morning before school 69.3 % In the evening on days that they had school 59.8 % In the afternoon after school 58.2 % On the weekend 28.7 %
Students were asked how much time they spend working for pay, playing sports, and participating in organized activities. The results indicate that students generally spend about the same amount of time on school days as on weekends working for pay and participating in organized activities (see Table 22). However, they spend more time playing sports on school days than on weekends.
Table 22. Mean Number of Out-of-School Hours Students Spend on Work for Pay, Sports, and Organized Activities
Work for Pay* Play Sports* Participate in Organized Activities*
School Days Weekend School Days Weekend School Days Weekend 8.48
hours/week 7.62
hours/week 7.84
hours/week 4.51
hours/week 4.97
hours/week 5.23
hours/week *This table only includes those students who said they worked, played sports, or participated in organized activities for at least one hour during the school week.
When asked when they worked, played sports, or participated in the organized activities, most teens reported participating in sports and other organized activities in the afternoon after school, but working for pay on the weekend (see Table 23). Results show that teens are least likely to work for pay, play sports, or participate in organized activities in the morning before school.

Center for Applied Research and Educational Improvement 28 University of Minnesota
Table 23. When High School Students Work for Pay, Play Sports, and Participate in Organized Activities
Time Period Work for Pay Play Sports Participate in Organized Activities
In the morning before school 3.6 % 14.6 % 10.1 % In the afternoon after school 50.7 % 77.2 % 64.9 % In the evening on days that they had school
40.7 % 37.2 % 41.8 %
On the weekend 64.0 % 47.0 % 37.6 %
In addition to finding out how many hours teens spend on out-of-school activities and when they participate, researchers also wanted to investigate how involvement in out-of-school activities impacts sleep patterns. To obtain student perceptions of their going-to-bed behavior, students were asked if they would go to bed at a different time if they did not participate in a particular out-of-school activity (Table 24). Results indicated that the students were especially likely to say they would go to bed earlier than they usually do if they did not have studying or homework to do, whereas discontinuing participation in working for pay, playing sports, or participating in organized activities was somewhat less likely to result in going to bed earlier.
Table 24. When High School Students Would Go to Bed If They Did Not Participate in Selected Out-of-School Activities
Response Option Study/Do Homework Work for Pay Play Sports
Participate in Organized Activities
Earlier than they do 54.0 % 30.9 % 35.5 % 29.3 % Later than they do 6.7 % 9.9 % 11.5 % 5.9 % The same as they do 39.3 % 59.7 % 53.0 % 64.7 %
Students were also asked whether they would wake up at a different time if they did not participate in their out-of-school activities (see Table 25). Unlike bed times, students’ reports of waking times did not differ much from one activity to the next. The majority of students reported that they would wake up at the same time as they usually do if they did not study or do homework, work for pay, play sports, or participate in organized activities.
Table 25. When High School Students Would Wake up If They Did Not Participate in Selected Out-of-School Activities
Response Option Study/Do Homework Work for Pay Play Sports Participate in
Organized Activities
Earlier than they do 12.8 % 11.1 % 11.0 % 7.0 % Later than they do 26.9 % 25.7 % 21.7 % 15.0 % The same as they do 60.3 % 63.6 % 67.3 % 78.0 %
Center for Applied Research and Educational Improvement 29 University of Minnesota
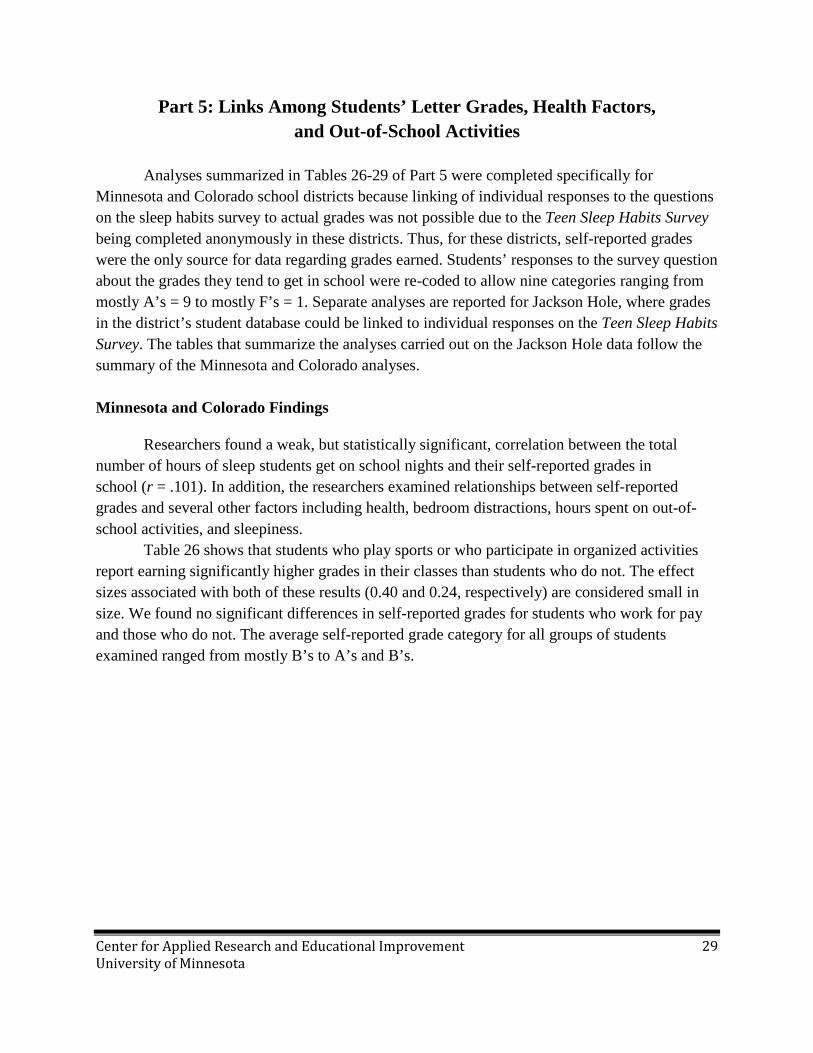
Part 5: Links Among Students’ Letter Grades, Health Factors, and Out-of-School Activities
Analyses summarized in Tables 26-29 of Part 5 were completed specifically for
Minnesota and Colorado school districts because linking of individual responses to the questions on the sleep habits survey to actual grades was not possible due to the Teen Sleep Habits Survey being completed anonymously in these districts. Thus, for these districts, self-reported grades were the only source for data regarding grades earned. Students’ responses to the survey question about the grades they tend to get in school were re-coded to allow nine categories ranging from mostly A’s = 9 to mostly F’s = 1. Separate analyses are reported for Jackson Hole, where grades in the district’s student database could be linked to individual responses on the Teen Sleep Habits Survey. The tables that summarize the analyses carried out on the Jackson Hole data follow the summary of the Minnesota and Colorado analyses. Minnesota and Colorado Findings
Researchers found a weak, but statistically significant, correlation between the total number of hours of sleep students get on school nights and their self-reported grades in school (r = .101). In addition, the researchers examined relationships between self-reported grades and several other factors including health, bedroom distractions, hours spent on out-of-school activities, and sleepiness.
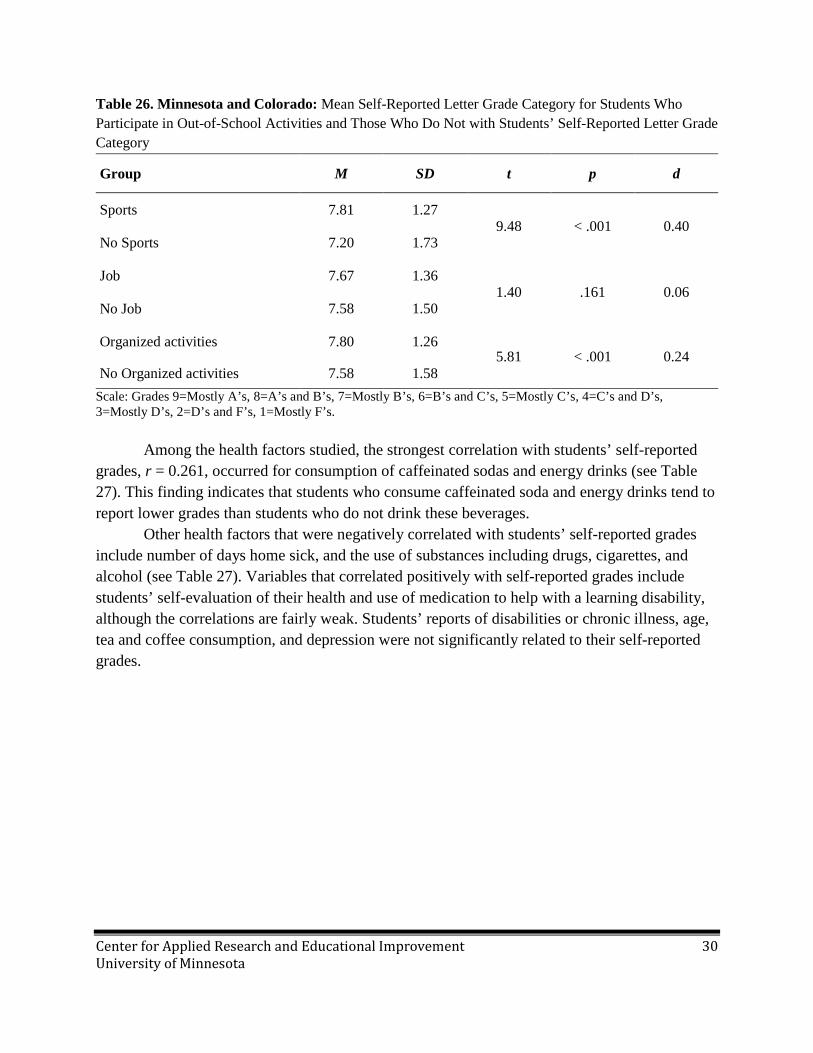
Table 26 shows that students who play sports or who participate in organized activities report earning significantly higher grades in their classes than students who do not. The effect sizes associated with both of these results (0.40 and 0.24, respectively) are considered small in size. We found no significant differences in self-reported grades for students who work for pay and those who do not. The average self-reported grade category for all groups of students examined ranged from mostly B’s to A’s and B’s.
Center for Applied Research and Educational Improvement 30 University of Minnesota
Table 26. Minnesota and Colorado: Mean Self-Reported Letter Grade Category for Students Who Participate in Out-of-School Activities and Those Who Do Not with Students’ Self-Reported Letter Grade Category
Group M SD t p d
Sports 7.81 1.27 9.48 < .001 0.40
No Sports 7.20 1.73
Job 7.67 1.36 1.40 .161 0.06
No Job 7.58 1.50
Organized activities 7.80 1.26 5.81 < .001 0.24
No Organized activities 7.58 1.58 Scale: Grades 9=Mostly A’s, 8=A’s and B’s, 7=Mostly B’s, 6=B’s and C’s, 5=Mostly C’s, 4=C’s and D’s, 3=Mostly D’s, 2=D’s and F’s, 1=Mostly F’s.
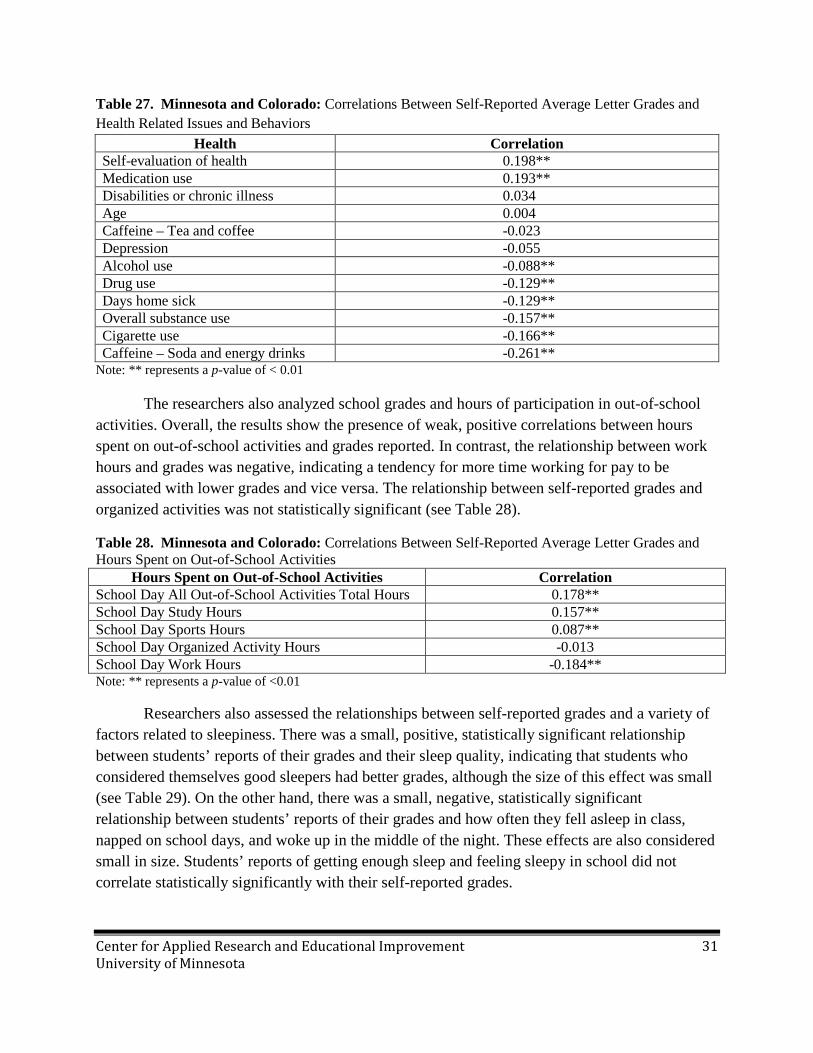
Among the health factors studied, the strongest correlation with students’ self-reported
grades, r = 0.261, occurred for consumption of caffeinated sodas and energy drinks (see Table 27). This finding indicates that students who consume caffeinated soda and energy drinks tend to report lower grades than students who do not drink these beverages.
Other health factors that were negatively correlated with students’ self-reported grades include number of days home sick, and the use of substances including drugs, cigarettes, and alcohol (see Table 27). Variables that correlated positively with self-reported grades include students’ self-evaluation of their health and use of medication to help with a learning disability, although the correlations are fairly weak. Students’ reports of disabilities or chronic illness, age, tea and coffee consumption, and depression were not significantly related to their self-reported grades.
Center for Applied Research and Educational Improvement 31 University of Minnesota
Table 27. Minnesota and Colorado: Correlations Between Self-Reported Average Letter Grades and Health Related Issues and Behaviors
Health Correlation Self-evaluation of health 0.198** Medication use 0.193** Disabilities or chronic illness 0.034 Age 0.004 Caffeine – Tea and coffee -0.023 Depression -0.055 Alcohol use -0.088** Drug use -0.129** Days home sick -0.129** Overall substance use -0.157** Cigarette use -0.166** Caffeine – Soda and energy drinks -0.261**
Note: ** represents a p-value of < 0.01
The researchers also analyzed school grades and hours of participation in out-of-school activities. Overall, the results show the presence of weak, positive correlations between hours spent on out-of-school activities and grades reported. In contrast, the relationship between work hours and grades was negative, indicating a tendency for more time working for pay to be associated with lower grades and vice versa. The relationship between self-reported grades and organized activities was not statistically significant (see Table 28).
Table 28. Minnesota and Colorado: Correlations Between Self-Reported Average Letter Grades and Hours Spent on Out-of-School Activities
Hours Spent on Out-of-School Activities Correlation School Day All Out-of-School Activities Total Hours 0.178** School Day Study Hours 0.157** School Day Sports Hours 0.087** School Day Organized Activity Hours -0.013 School Day Work Hours -0.184** Note: ** represents a p-value of <0.01
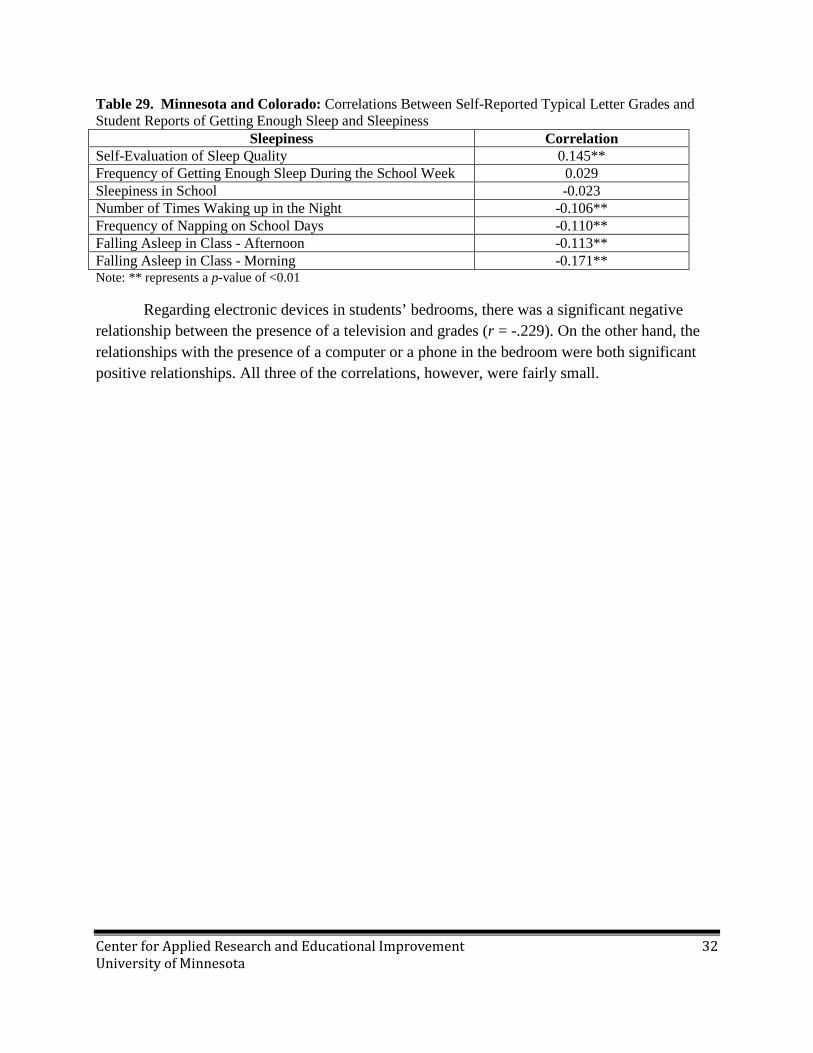
Researchers also assessed the relationships between self-reported grades and a variety of factors related to sleepiness. There was a small, positive, statistically significant relationship between students’ reports of their grades and their sleep quality, indicating that students who considered themselves good sleepers had better grades, although the size of this effect was small (see Table 29). On the other hand, there was a small, negative, statistically significant relationship between students’ reports of their grades and how often they fell asleep in class, napped on school days, and woke up in the middle of the night. These effects are also considered small in size. Students’ reports of getting enough sleep and feeling sleepy in school did not correlate statistically significantly with their self-reported grades.
Center for Applied Research and Educational Improvement 32 University of Minnesota
Table 29. Minnesota and Colorado: Correlations Between Self-Reported Typical Letter Grades and Student Reports of Getting Enough Sleep and Sleepiness
Sleepiness Correlation Self-Evaluation of Sleep Quality 0.145** Frequency of Getting Enough Sleep During the School Week 0.029 Sleepiness in School -0.023 Number of Times Waking up in the Night -0.106** Frequency of Napping on School Days -0.110** Falling Asleep in Class - Afternoon -0.113** Falling Asleep in Class - Morning -0.171** Note: ** represents a p-value of <0.01
Regarding electronic devices in students’ bedrooms, there was a significant negative relationship between the presence of a television and grades (r = -.229). On the other hand, the relationships with the presence of a computer or a phone in the bedroom were both significant positive relationships. All three of the correlations, however, were fairly small.
Center for Applied Research and Educational Improvement 33 University of Minnesota
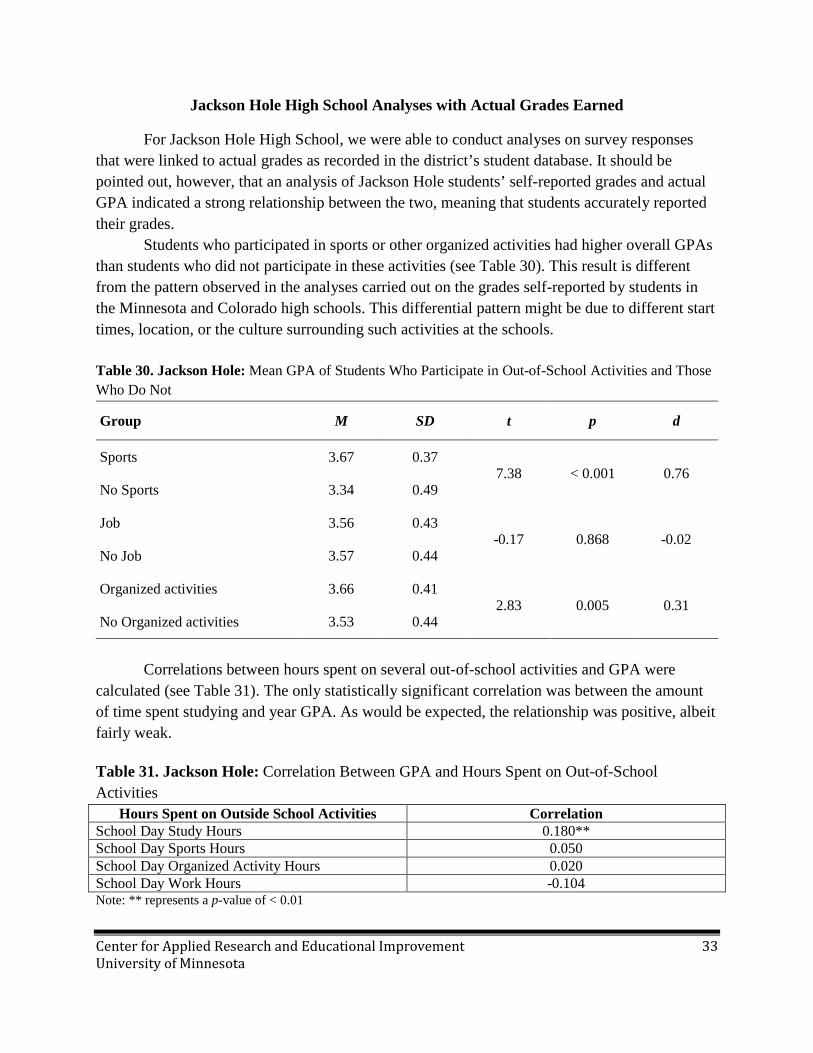
Jackson Hole High School Analyses with Actual Grades Earned
For Jackson Hole High School, we were able to conduct analyses on survey responses that were linked to actual grades as recorded in the district’s student database. It should be pointed out, however, that an analysis of Jackson Hole students’ self-reported grades and actual GPA indicated a strong relationship between the two, meaning that students accurately reported their grades.
Students who participated in sports or other organized activities had higher overall GPAs than students who did not participate in these activities (see Table 30). This result is different from the pattern observed in the analyses carried out on the grades self-reported by students in the Minnesota and Colorado high schools. This differential pattern might be due to different start times, location, or the culture surrounding such activities at the schools. Table 30. Jackson Hole: Mean GPA of Students Who Participate in Out-of-School Activities and Those Who Do Not
Group M SD t p d
Sports 3.67 0.37 7.38 < 0.001 0.76
No Sports 3.34 0.49
Job 3.56 0.43 -0.17 0.868 -0.02
No Job 3.57 0.44
Organized activities 3.66 0.41 2.83 0.005 0.31
No Organized activities 3.53 0.44
Correlations between hours spent on several out-of-school activities and GPA were
calculated (see Table 31). The only statistically significant correlation was between the amount of time spent studying and year GPA. As would be expected, the relationship was positive, albeit fairly weak. Table 31. Jackson Hole: Correlation Between GPA and Hours Spent on Out-of-School Activities
Hours Spent on Outside School Activities Correlation School Day Study Hours 0.180** School Day Sports Hours 0.050 School Day Organized Activity Hours 0.020 School Day Work Hours -0.104 Note: ** represents a p-value of < 0.01
Center for Applied Research and Educational Improvement 34 University of Minnesota
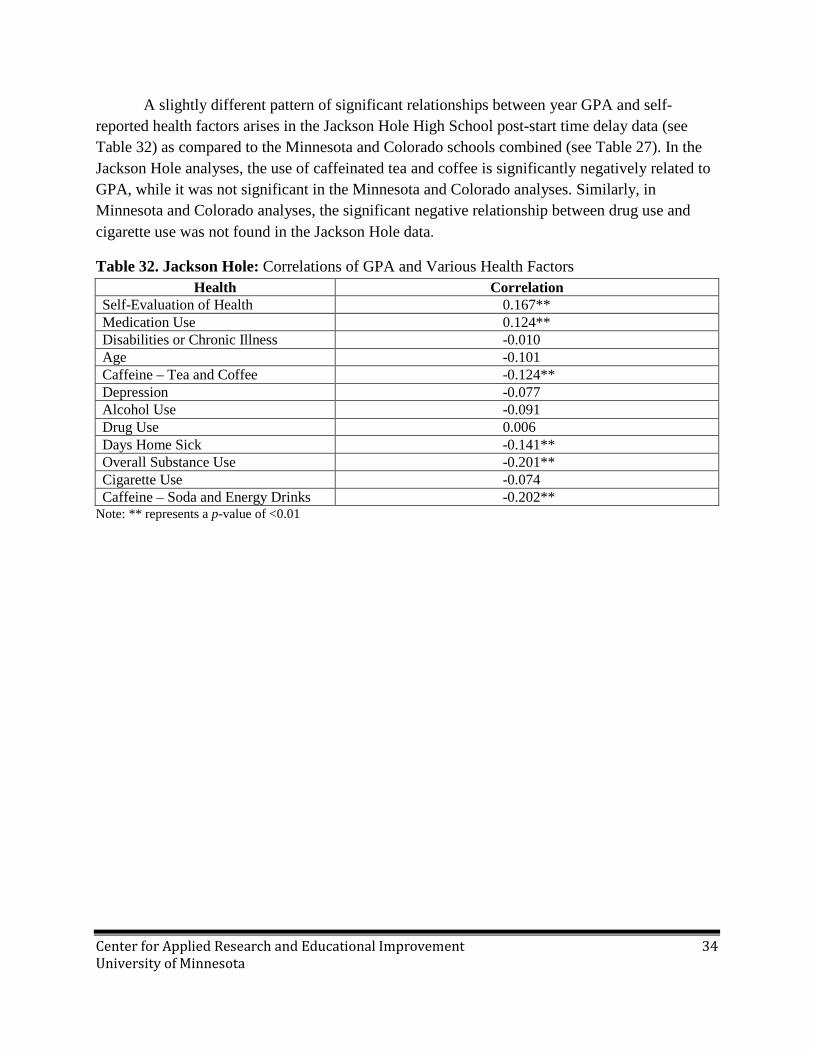
A slightly different pattern of significant relationships between year GPA and self-reported health factors arises in the Jackson Hole High School post-start time delay data (see Table 32) as compared to the Minnesota and Colorado schools combined (see Table 27). In the Jackson Hole analyses, the use of caffeinated tea and coffee is significantly negatively related to GPA, while it was not significant in the Minnesota and Colorado analyses. Similarly, in Minnesota and Colorado analyses, the significant negative relationship between drug use and cigarette use was not found in the Jackson Hole data.
Table 32. Jackson Hole: Correlations of GPA and Various Health Factors Health Correlation
Self-Evaluation of Health 0.167** Medication Use 0.124** Disabilities or Chronic Illness -0.010 Age -0.101 Caffeine – Tea and Coffee -0.124** Depression -0.077 Alcohol Use -0.091 Drug Use 0.006 Days Home Sick -0.141** Overall Substance Use -0.201** Cigarette Use -0.074 Caffeine – Soda and Energy Drinks -0.202**
Note: ** represents a p-value of <0.01
Center for Applied Research and Educational Improvement 35 University of Minnesota
Academic Performance Outcomes
Center for Applied Research and Educational Improvement 36 University of Minnesota
Minnesota, Colorado, and Wyoming School Districts
Academic Results Data Collection and Analysis Methods
The research question addressed in this part of the study was: What are the pre-post start time delay differences in academic outcomes? This question is notable in that identifying and then locating specific outcome variables across two or more school systems is an enormous challenge. Every district has its own data system containing data fields for student attendance and achievement data that are often not comparable from one district to another. Defining or operationalizing each variable to allow for comparison across districts required many conversations among the research team and the database specialists in each of the districts participating in this study. As a result, we had to clarify exactly what was comparable before we conducted our analyses, and we arrived at a list of commonly defined variables for pre-post examination across the districts, including:
• Attendance rate • Excused and unexcused absences • Tardiness • Overall grade point average (GPA) • Grades earned in core subject areas of English, math, social studies, and science in 1st-
and 3rd-period classes • Standardized test performance
Additionally, because of when the data were collected it was not possible to complete all desired comparisons. All significant results based on analyses that could be completed can be found in Appendix C. Although the same comparisons could not be made across all schools and districts, there were some general patterns noticeable in the data. Analysis was conducted for both independent groups (i.e., students grouped by grade level) and dependent groups (i.e., comparing the same students from year to year).
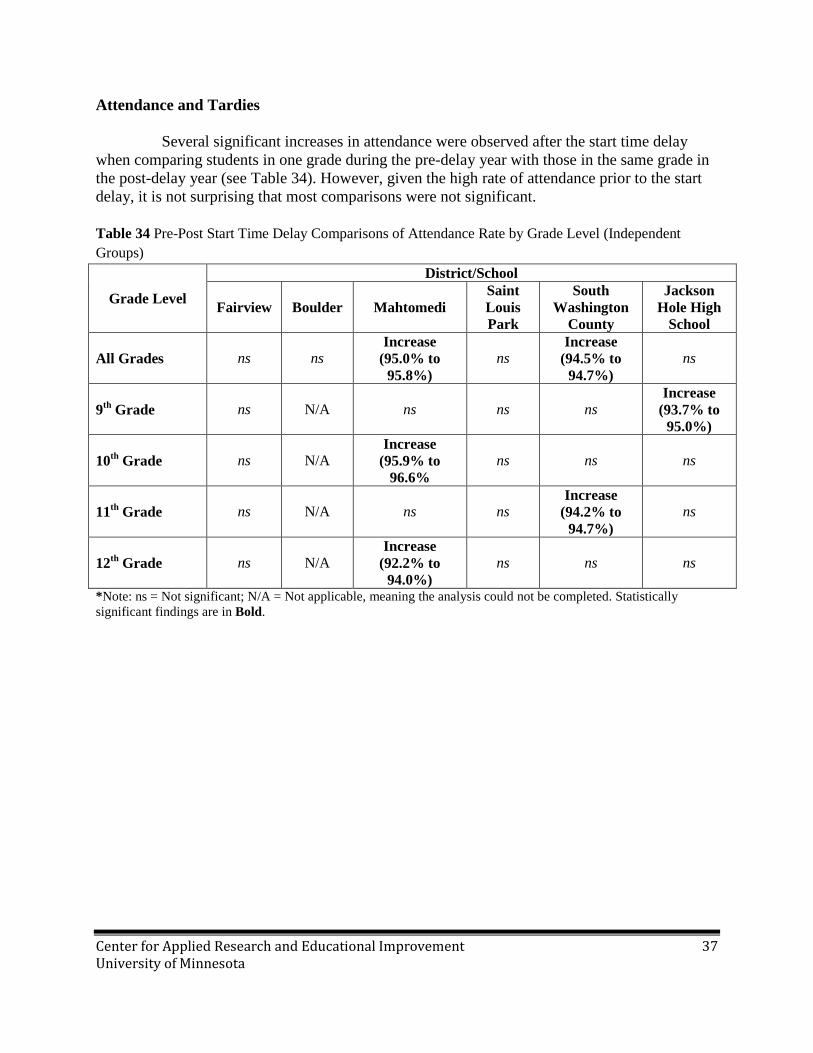
Center for Applied Research and Educational Improvement 37 University of Minnesota
Attendance and Tardies Several significant increases in attendance were observed after the start time delay when comparing students in one grade during the pre-delay year with those in the same grade in the post-delay year (see Table 34). However, given the high rate of attendance prior to the start delay, it is not surprising that most comparisons were not significant. Table 34 Pre-Post Start Time Delay Comparisons of Attendance Rate by Grade Level (Independent Groups)
Grade Level
District/School
Fairview Boulder Mahtomedi Saint Louis Park
South Washington
County
Jackson Hole High
School
All Grades ns ns Increase
(95.0% to 95.8%)
ns Increase
(94.5% to 94.7%)
ns
9th Grade ns N/A ns ns ns Increase
(93.7% to 95.0%)
10th Grade ns N/A Increase
(95.9% to 96.6%
ns ns ns
11th Grade ns N/A ns ns Increase
(94.2% to 94.7%)
ns
12th Grade ns N/A Increase
(92.2% to 94.0%)
ns ns ns
*Note: ns = Not significant; N/A = Not applicable, meaning the analysis could not be completed. Statistically significant findings are in Bold.
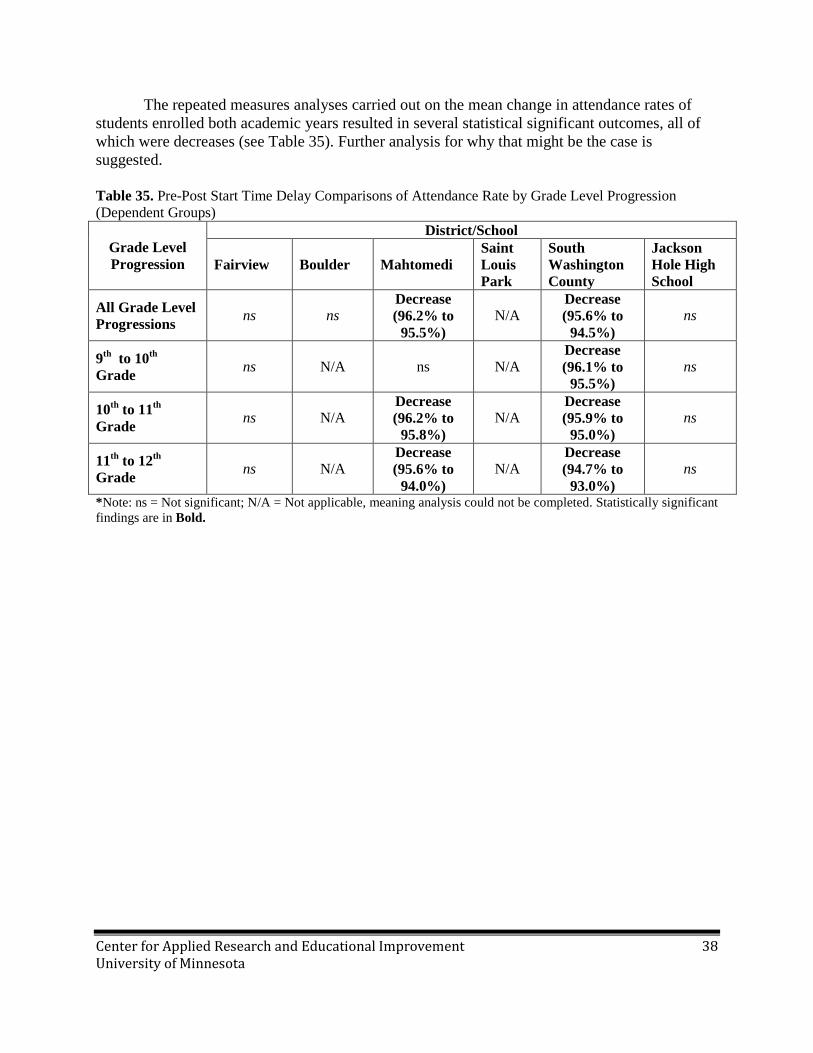
Center for Applied Research and Educational Improvement 38 University of Minnesota
The repeated measures analyses carried out on the mean change in attendance rates of students enrolled both academic years resulted in several statistical significant outcomes, all of which were decreases (see Table 35). Further analysis for why that might be the case is suggested. Table 35. Pre-Post Start Time Delay Comparisons of Attendance Rate by Grade Level Progression (Dependent Groups)
Grade Level Progression
District/School
Fairview Boulder Mahtomedi Saint Louis Park
South Washington County
Jackson Hole High School
All Grade Level Progressions ns ns
Decrease (96.2% to
95.5%) N/A
Decrease (95.6% to
94.5%) ns
9th to 10th Grade ns N/A ns N/A
Decrease (96.1% to
95.5%) ns
10th to 11th Grade ns N/A
Decrease (96.2% to
95.8%) N/A
Decrease (95.9% to
95.0%) ns
11th to 12th Grade ns N/A
Decrease (95.6% to
94.0%) N/A
Decrease (94.7% to
93.0%) ns
*Note: ns = Not significant; N/A = Not applicable, meaning analysis could not be completed. Statistically significant findings are in Bold.
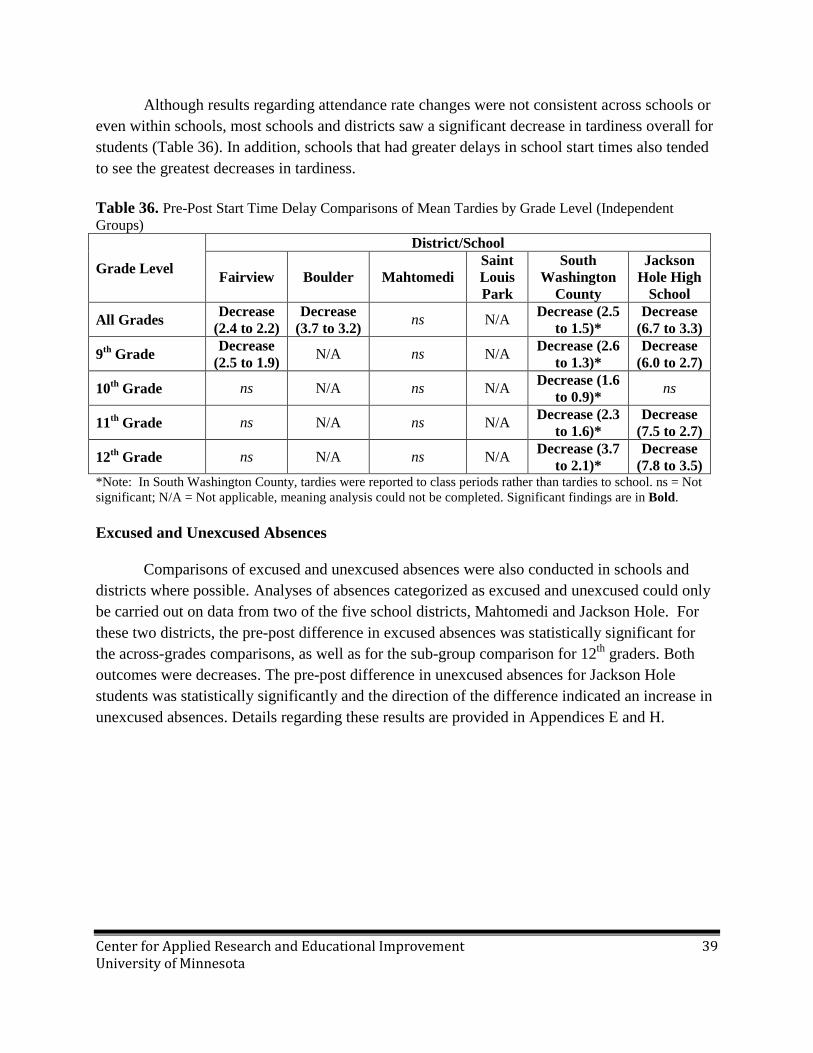
Center for Applied Research and Educational Improvement 39 University of Minnesota
Although results regarding attendance rate changes were not consistent across schools or even within schools, most schools and districts saw a significant decrease in tardiness overall for students (Table 36). In addition, schools that had greater delays in school start times also tended to see the greatest decreases in tardiness. Table 36. Pre-Post Start Time Delay Comparisons of Mean Tardies by Grade Level (Independent Groups)
Grade Level
District/School
Fairview Boulder Mahtomedi Saint Louis Park
South Washington
County
Jackson Hole High
School
All Grades Decrease (2.4 to 2.2)
Decrease (3.7 to 3.2) ns N/A Decrease (2.5
to 1.5)* Decrease
(6.7 to 3.3)
9th Grade Decrease (2.5 to 1.9) N/A ns N/A Decrease (2.6
to 1.3)* Decrease
(6.0 to 2.7)
10th Grade ns N/A ns N/A Decrease (1.6 to 0.9)* ns
11th Grade ns N/A ns N/A Decrease (2.3 to 1.6)*
Decrease (7.5 to 2.7)
12th Grade ns N/A ns N/A Decrease (3.7 to 2.1)*
Decrease (7.8 to 3.5)
*Note: In South Washington County, tardies were reported to class periods rather than tardies to school. ns = Not significant; N/A = Not applicable, meaning analysis could not be completed. Significant findings are in Bold. Excused and Unexcused Absences
Comparisons of excused and unexcused absences were also conducted in schools and districts where possible. Analyses of absences categorized as excused and unexcused could only be carried out on data from two of the five school districts, Mahtomedi and Jackson Hole. For these two districts, the pre-post difference in excused absences was statistically significant for the across-grades comparisons, as well as for the sub-group comparison for 12th graders. Both outcomes were decreases. The pre-post difference in unexcused absences for Jackson Hole students was statistically significantly and the direction of the difference indicated an increase in unexcused absences. Details regarding these results are provided in Appendices E and H.
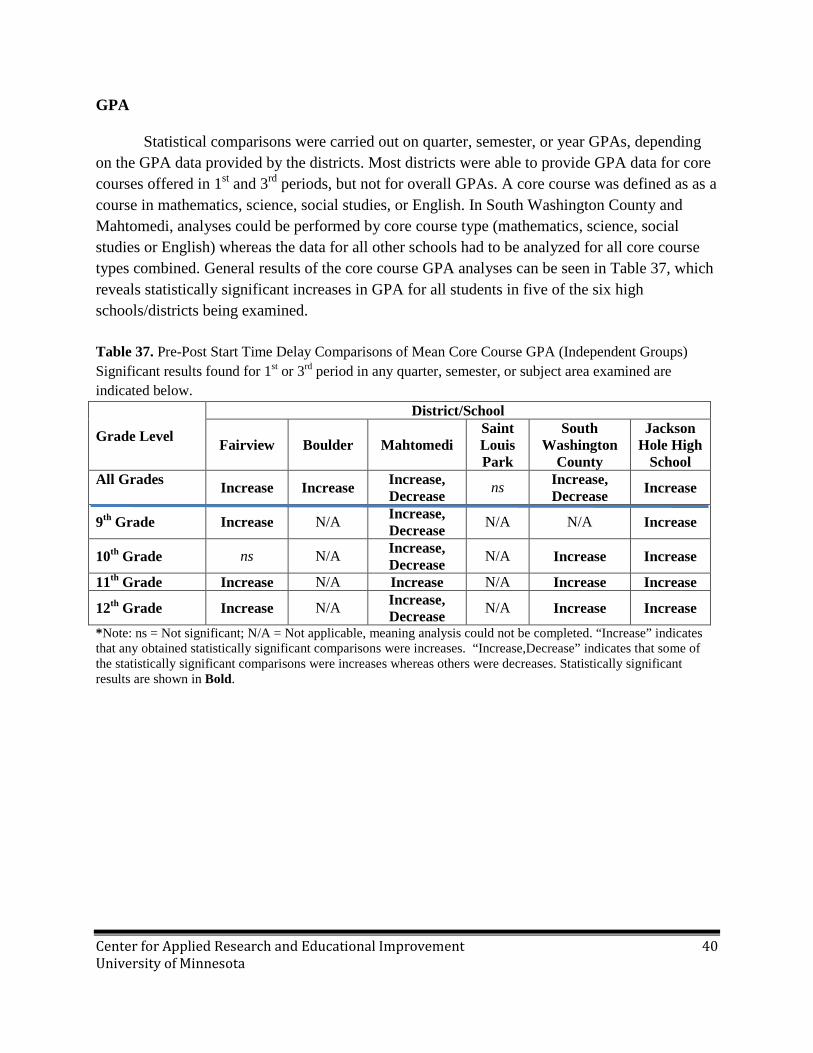
Center for Applied Research and Educational Improvement 40 University of Minnesota
GPA
Statistical comparisons were carried out on quarter, semester, or year GPAs, depending on the GPA data provided by the districts. Most districts were able to provide GPA data for core courses offered in 1st and 3rd periods, but not for overall GPAs. A core course was defined as as a course in mathematics, science, social studies, or English. In South Washington County and Mahtomedi, analyses could be performed by core course type (mathematics, science, social studies or English) whereas the data for all other schools had to be analyzed for all core course types combined. General results of the core course GPA analyses can be seen in Table 37, which reveals statistically significant increases in GPA for all students in five of the six high schools/districts being examined. Table 37. Pre-Post Start Time Delay Comparisons of Mean Core Course GPA (Independent Groups) Significant results found for 1st or 3rd period in any quarter, semester, or subject area examined are indicated below.
Grade Level
District/School
Fairview Boulder Mahtomedi Saint Louis Park
South Washington
County
Jackson Hole High
School All Grades Increase Increase Increase,
Decrease ns Increase, Decrease Increase
9th Grade Increase N/A Increase, Decrease N/A N/A Increase
10th Grade ns N/A Increase, Decrease N/A Increase Increase
11th Grade Increase N/A Increase N/A Increase Increase
12th Grade Increase N/A Increase, Decrease N/A Increase Increase
*Note: ns = Not significant; N/A = Not applicable, meaning analysis could not be completed. “Increase” indicates that any obtained statistically significant comparisons were increases. “Increase,Decrease” indicates that some of the statistically significant comparisons were increases whereas others were decreases. Statistically significant results are shown in Bold.
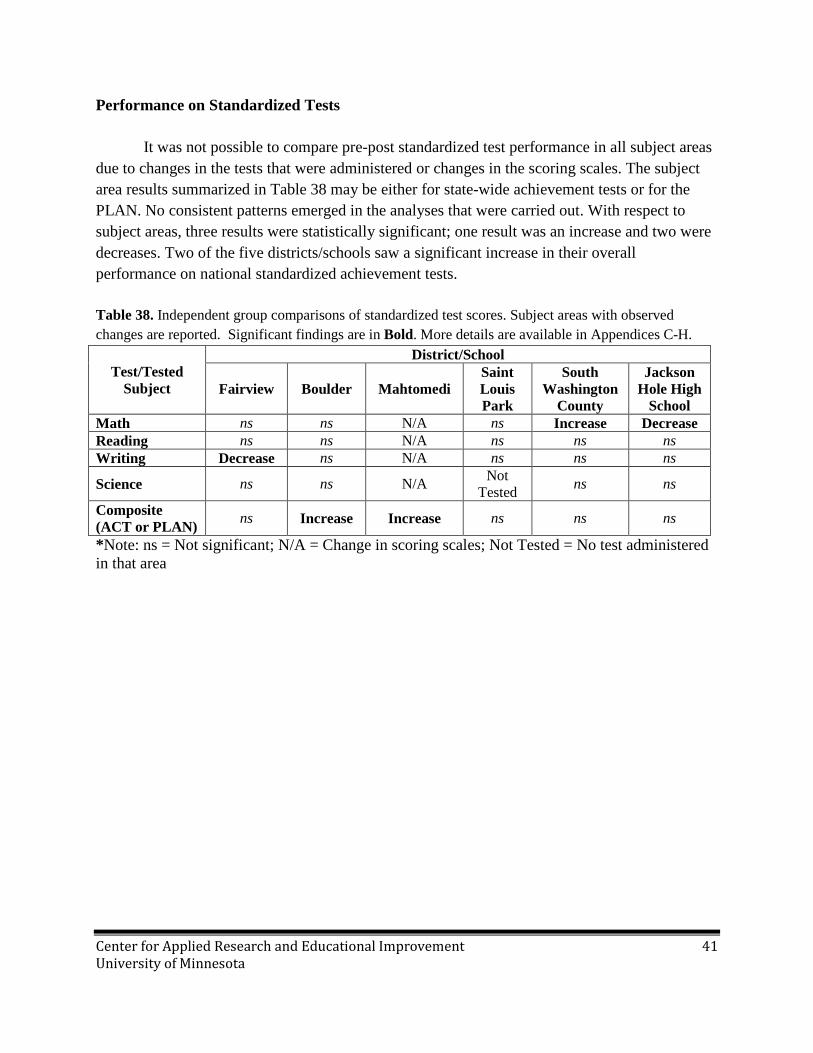
Center for Applied Research and Educational Improvement 41 University of Minnesota
Performance on Standardized Tests
It was not possible to compare pre-post standardized test performance in all subject areas due to changes in the tests that were administered or changes in the scoring scales. The subject area results summarized in Table 38 may be either for state-wide achievement tests or for the PLAN. No consistent patterns emerged in the analyses that were carried out. With respect to subject areas, three results were statistically significant; one result was an increase and two were decreases. Two of the five districts/schools saw a significant increase in their overall performance on national standardized achievement tests. Table 38. Independent group comparisons of standardized test scores. Subject areas with observed changes are reported. Significant findings are in Bold. More details are available in Appendices C-H.
Test/Tested Subject
District/School
Fairview Boulder Mahtomedi Saint Louis Park
South Washington
County
Jackson Hole High
School Math ns ns N/A ns Increase Decrease Reading ns ns N/A ns ns ns Writing Decrease ns N/A ns ns ns
Science ns ns N/A Not Tested ns ns
Composite (ACT or PLAN) ns Increase Increase ns ns ns
*Note: ns = Not significant; N/A = Change in scoring scales; Not Tested = No test administered in that area
Center for Applied Research and Educational Improvement 42 University of Minnesota
Car Crash Data

Center for Applied Research and Educational Improvement 43 University of Minnesota
Vehicle Crashes During School Year Involving 16 to 18 Year Old Drivers Data Collection Methods Minnesota
The vehicle crash data were provided by the Minnesota Department of Transportation’s Office of Traffic, Safety and Technology. The data source for Minnesota is the Transportation Information System (TIS). We requested crash data for 16-18 year old drivers for the school year months of September through May for the school year before the start time delay and the school year after the start time delay. To ensure that the majority of drivers were enrolled in the schools of interest, we requested data for crashes occurring within the city limits of Cottage Grove, Woodbury, St. Louis Park, and Mahtomedi.
Thirteen codes were utilized for the physical condition of the driver. We selected three of these codes for our analyses: “Normal-No drugs or drinking,” “Under the influence,” and “Asleep.” Thirty-five codes were used for contributing factors, 15 of which were related to driver behavior. We selected five of the driver behavior codes for our analyses: “Failure to yield right of way,” “Over-correcting,” “Driver inattention or distraction,” “Driver inexperience,” and “Driver on car phone, CB, or two-way radio.” Because the code for “Driver on car phone, CB, or two-way radio” did not appear in any of the crash records, it was not included in the summary tables. Colorado
Data on crash rates were not available for specific areas in the Boulder Valley School
District. Therefore, since only two of the five high schools in the district had delayed their start times, a decision was made to conduct no crash rate analyses for the Colorado communities participating in this study. Wyoming
The vehicle crash data were provided by the Wyoming Department of Transportation. We requested crash data for 16-18 year old drivers for the school year months of September through May for the school year before the start time delay and the school year after the start time delay. To ensure that the majority of drivers were enrolled in the schools of interest, we requested data for crashes only occurring within Teton County.
Analysis categories utilized by Wyoming were modified to be as similar as possible to those utilized in the analyses of the Minnesota crash data. For example, if the reason for the accident indicated sleeping, the driver would have been categorized as “Asleep.” However, no 16 to 18 year olds had this listed as reason for the accident. Drivers who were reported as running a red light or failing to yield the right of way were counted as failure to yield right of way. Drivers who were driving too fast for conditions were counted as driver inexperience. Drivers that were following too close were counted as driver inattention or distraction.
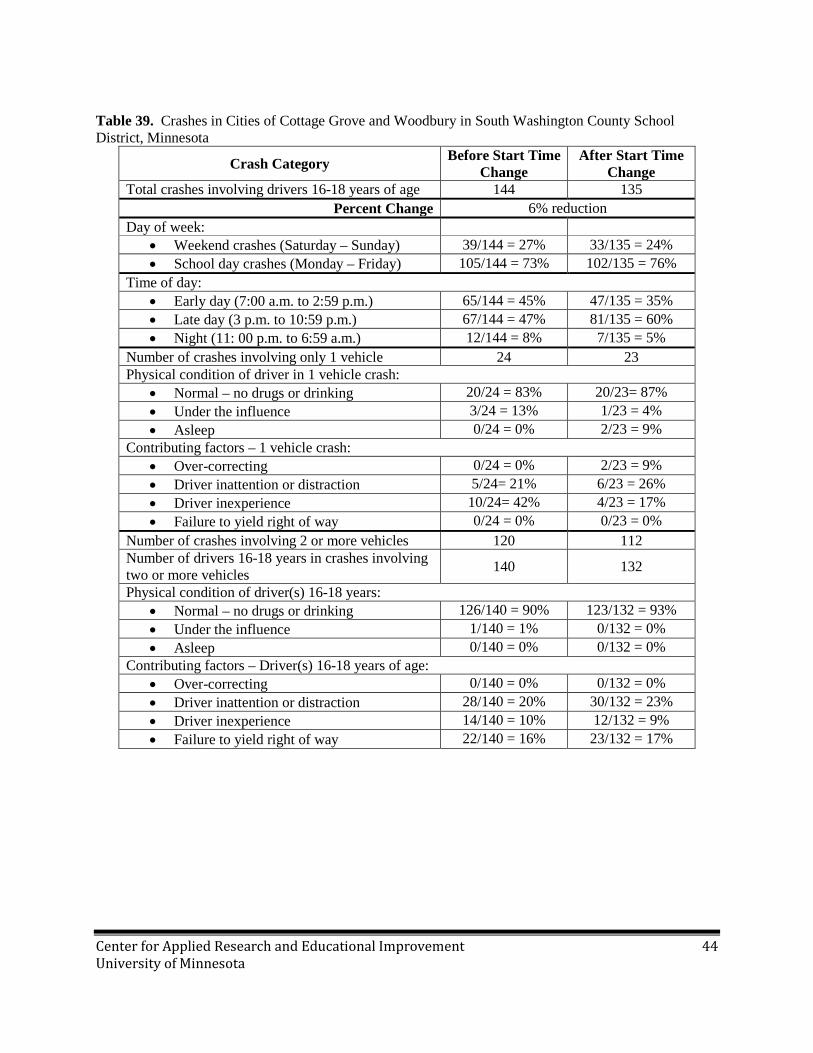
Center for Applied Research and Educational Improvement 44 University of Minnesota
Table 39. Crashes in Cities of Cottage Grove and Woodbury in South Washington County School District, Minnesota
Crash Category Before Start Time Change
After Start Time Change
Total crashes involving drivers 16-18 years of age 144 135 Percent Change 6% reduction
Day of week: • Weekend crashes (Saturday – Sunday) 39/144 = 27% 33/135 = 24% • School day crashes (Monday – Friday) 105/144 = 73% 102/135 = 76%
Time of day: • Early day (7:00 a.m. to 2:59 p.m.) 65/144 = 45% 47/135 = 35% • Late day (3 p.m. to 10:59 p.m.) 67/144 = 47% 81/135 = 60% • Night (11: 00 p.m. to 6:59 a.m.) 12/144 = 8% 7/135 = 5%
Number of crashes involving only 1 vehicle 24 23 Physical condition of driver in 1 vehicle crash:
• Normal – no drugs or drinking 20/24 = 83% 20/23= 87% • Under the influence 3/24 = 13% 1/23 = 4% • Asleep 0/24 = 0% 2/23 = 9%
Contributing factors – 1 vehicle crash: • Over-correcting 0/24 = 0% 2/23 = 9% • Driver inattention or distraction 5/24= 21% 6/23 = 26% • Driver inexperience 10/24= 42% 4/23 = 17% • Failure to yield right of way 0/24 = 0% 0/23 = 0%
Number of crashes involving 2 or more vehicles 120 112 Number of drivers 16-18 years in crashes involving two or more vehicles 140 132
Physical condition of driver(s) 16-18 years: • Normal – no drugs or drinking 126/140 = 90% 123/132 = 93% • Under the influence 1/140 = 1% 0/132 = 0% • Asleep 0/140 = 0% 0/132 = 0%
Contributing factors – Driver(s) 16-18 years of age: • Over-correcting 0/140 = 0% 0/132 = 0% • Driver inattention or distraction 28/140 = 20% 30/132 = 23% • Driver inexperience 14/140 = 10% 12/132 = 9% • Failure to yield right of way 22/140 = 16% 23/132 = 17%
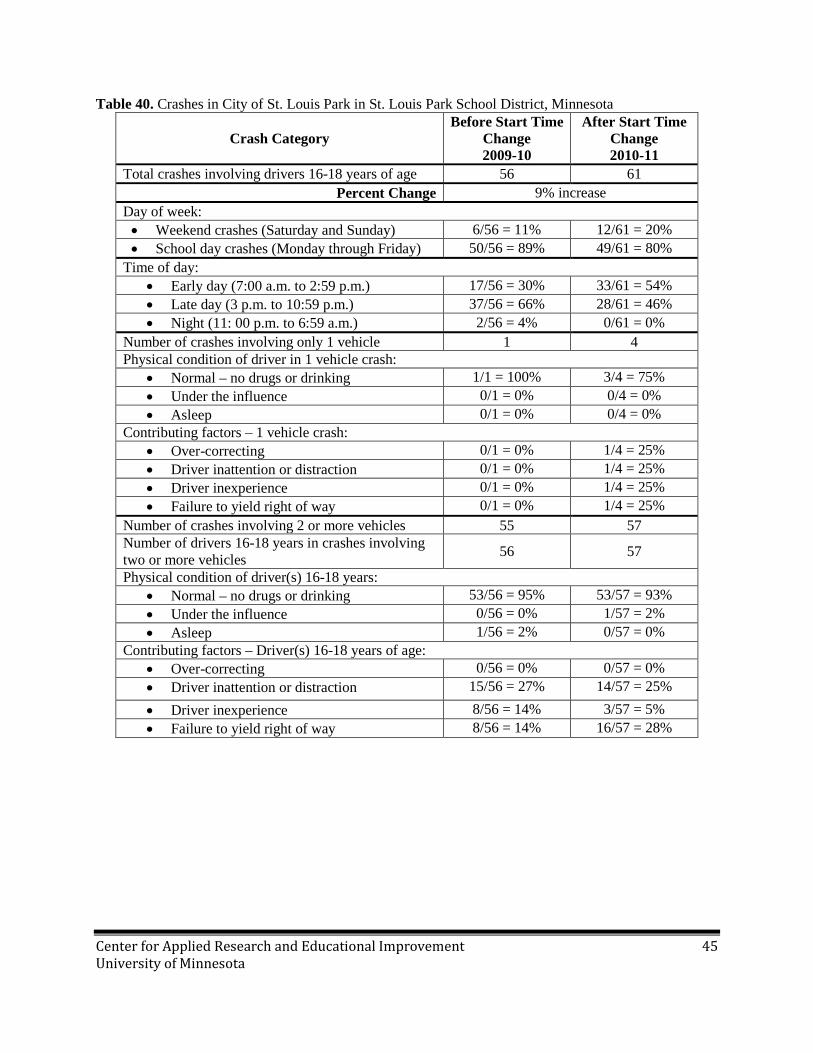
Center for Applied Research and Educational Improvement 45 University of Minnesota
Table 40. Crashes in City of St. Louis Park in St. Louis Park School District, Minnesota
Crash Category Before Start Time
Change 2009-10
After Start Time Change 2010-11
Total crashes involving drivers 16-18 years of age 56 61 Percent Change 9% increase
Day of week: • Weekend crashes (Saturday and Sunday) 6/56 = 11% 12/61 = 20% • School day crashes (Monday through Friday) 50/56 = 89% 49/61 = 80%
Time of day: • Early day (7:00 a.m. to 2:59 p.m.) 17/56 = 30% 33/61 = 54% • Late day (3 p.m. to 10:59 p.m.) 37/56 = 66% 28/61 = 46% • Night (11: 00 p.m. to 6:59 a.m.) 2/56 = 4% 0/61 = 0%
Number of crashes involving only 1 vehicle 1 4 Physical condition of driver in 1 vehicle crash:
• Normal – no drugs or drinking 1/1 = 100% 3/4 = 75% • Under the influence 0/1 = 0% 0/4 = 0% • Asleep 0/1 = 0% 0/4 = 0%
Contributing factors – 1 vehicle crash: • Over-correcting 0/1 = 0% 1/4 = 25% • Driver inattention or distraction 0/1 = 0% 1/4 = 25% • Driver inexperience 0/1 = 0% 1/4 = 25% • Failure to yield right of way 0/1 = 0% 1/4 = 25%
Number of crashes involving 2 or more vehicles 55 57 Number of drivers 16-18 years in crashes involving two or more vehicles 56 57
Physical condition of driver(s) 16-18 years: • Normal – no drugs or drinking 53/56 = 95% 53/57 = 93% • Under the influence 0/56 = 0% 1/57 = 2% • Asleep 1/56 = 2% 0/57 = 0%
Contributing factors – Driver(s) 16-18 years of age: • Over-correcting 0/56 = 0% 0/57 = 0% • Driver inattention or distraction 15/56 = 27% 14/57 = 25% • Driver inexperience 8/56 = 14% 3/57 = 5% • Failure to yield right of way 8/56 = 14% 16/57 = 28%
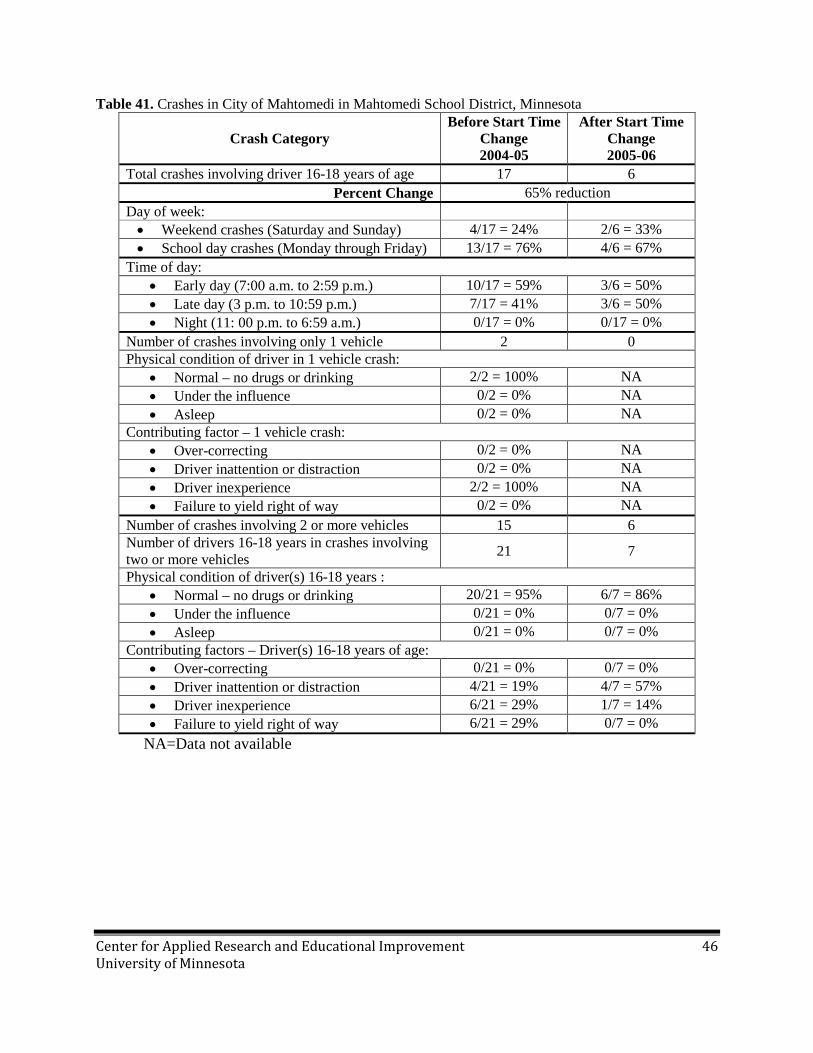
Center for Applied Research and Educational Improvement 46 University of Minnesota
Table 41. Crashes in City of Mahtomedi in Mahtomedi School District, Minnesota
Crash Category Before Start Time
Change 2004-05
After Start Time Change 2005-06
Total crashes involving driver 16-18 years of age 17 6 Percent Change 65% reduction
Day of week: • Weekend crashes (Saturday and Sunday) 4/17 = 24% 2/6 = 33% • School day crashes (Monday through Friday) 13/17 = 76% 4/6 = 67%
Time of day: • Early day (7:00 a.m. to 2:59 p.m.) 10/17 = 59% 3/6 = 50% • Late day (3 p.m. to 10:59 p.m.) 7/17 = 41% 3/6 = 50% • Night (11: 00 p.m. to 6:59 a.m.) 0/17 = 0% 0/17 = 0%
Number of crashes involving only 1 vehicle 2 0 Physical condition of driver in 1 vehicle crash:
• Normal – no drugs or drinking 2/2 = 100% NA • Under the influence 0/2 = 0% NA • Asleep 0/2 = 0% NA
Contributing factor – 1 vehicle crash: • Over-correcting 0/2 = 0% NA • Driver inattention or distraction 0/2 = 0% NA • Driver inexperience 2/2 = 100% NA • Failure to yield right of way 0/2 = 0% NA
Number of crashes involving 2 or more vehicles 15 6 Number of drivers 16-18 years in crashes involving two or more vehicles 21 7
Physical condition of driver(s) 16-18 years : • Normal – no drugs or drinking 20/21 = 95% 6/7 = 86% • Under the influence 0/21 = 0% 0/7 = 0% • Asleep 0/21 = 0% 0/7 = 0%
Contributing factors – Driver(s) 16-18 years of age: • Over-correcting 0/21 = 0% 0/7 = 0% • Driver inattention or distraction 4/21 = 19% 4/7 = 57% • Driver inexperience 6/21 = 29% 1/7 = 14% • Failure to yield right of way 6/21 = 29% 0/7 = 0%
NA=Data not available
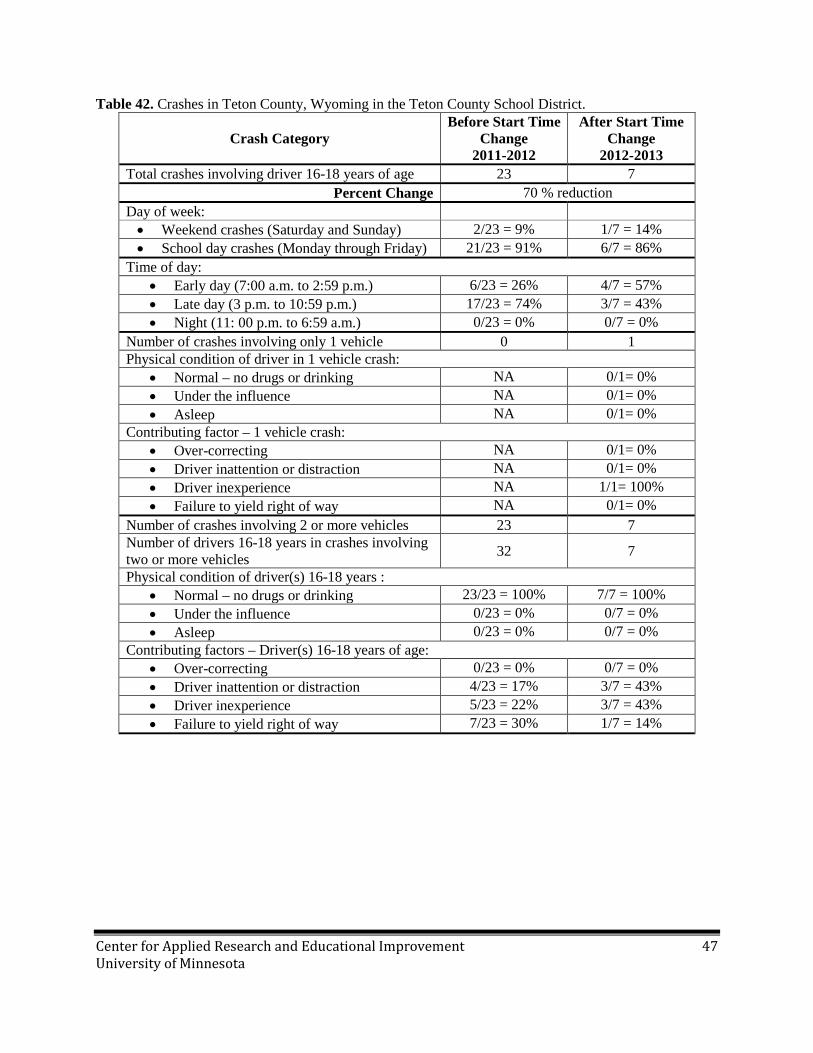
Center for Applied Research and Educational Improvement 47 University of Minnesota
Table 42. Crashes in Teton County, Wyoming in the Teton County School District.
Crash Category Before Start Time
Change 2011-2012
After Start Time Change
2012-2013 Total crashes involving driver 16-18 years of age 23 7
Percent Change 70 % reduction Day of week: • Weekend crashes (Saturday and Sunday) 2/23 = 9% 1/7 = 14% • School day crashes (Monday through Friday) 21/23 = 91% 6/7 = 86%
Time of day: • Early day (7:00 a.m. to 2:59 p.m.) 6/23 = 26% 4/7 = 57% • Late day (3 p.m. to 10:59 p.m.) 17/23 = 74% 3/7 = 43% • Night (11: 00 p.m. to 6:59 a.m.) 0/23 = 0% 0/7 = 0%
Number of crashes involving only 1 vehicle 0 1 Physical condition of driver in 1 vehicle crash:
• Normal – no drugs or drinking NA 0/1= 0% • Under the influence NA 0/1= 0% • Asleep NA 0/1= 0%
Contributing factor – 1 vehicle crash: • Over-correcting NA 0/1= 0% • Driver inattention or distraction NA 0/1= 0% • Driver inexperience NA 1/1= 100% • Failure to yield right of way NA 0/1= 0%
Number of crashes involving 2 or more vehicles 23 7 Number of drivers 16-18 years in crashes involving two or more vehicles 32 7
Physical condition of driver(s) 16-18 years : • Normal – no drugs or drinking 23/23 = 100% 7/7 = 100% • Under the influence 0/23 = 0% 0/7 = 0% • Asleep 0/23 = 0% 0/7 = 0%
Contributing factors – Driver(s) 16-18 years of age: • Over-correcting 0/23 = 0% 0/7 = 0% • Driver inattention or distraction 4/23 = 17% 3/7 = 43% • Driver inexperience 5/23 = 22% 3/7 = 43% • Failure to yield right of way 7/23 = 30% 1/7 = 14%
Center for Applied Research and Educational Improvement 48 University of Minnesota
Discussion of Car Crash Results
In two of the four communities for which we had crash data and which had instituted a later start time for their high schools, the rate of car crashes for high school age drivers dropped by 65-70%. Another district saw a slight decrease of 6%, and the fourth experienced an increase of 9%. The district with the increase, St. Louis Park, is a first-ring suburb of Minneapolis. St. Louis Park contains many major highway routes between the city of Minneapolis and other neighboring second- and third-ring suburbs. This may be a contributing factor in the increase in crash rates there, as those crashes may involve teens who attend local high schools in other nearby districts with earlier start times. The data that were provided did not enable us to identify which high schools the teens involved in crashes were attending.
Cottage Grove and Woodbury are communities that are considered second- or third-ring suburbs and are significantly distant from the central cities of Minneapolis and St. Paul. In addition, Cottage Grove and Woodbury are both experiencing high growth rates. They have combined into one school district called South Washington County. Their crash rate decreased by 6%. Mahtomedi is the other Minnesota school district, a second-ring suburb, and their crash rate dropped by 65%.
We believe that the crash data also need to be viewed within additional geographic lenses. For example, the geographic sizes of Cottage Grove and Woodbury, together as one school district, are 73 square miles in size, and are 6 to 12 times larger than either St. Louis Park (10.8 sq. mi) or Mahtomedi (5.5 sq. mi), and thus the driving distances are greater. Prior research has shown that the longer the distances for driving, the greater the problem with drowsy driving (Maclean et al., 2003).
The Teton County (Wyoming) School District had the latest school start time of the four districts involved in this portion of the research study and had a substantial reduction in car crashes during the school year after the later start time was initiated. The number dropped from 23 to 7 for drivers 16 to 18 years of age, which is a crash rate reduction of 70%. The fact that over 66% of Jackson Hole High School students now obtain more than 8 hours of sleep each school night may be the reason for the significant drop.
Finally, police officers on the scene of any crash make certain subjective assessments of contributing factors, the subjectivity of which makes an initial comparison of causal factors somewhat speculative. However, the time of day is factual information, and it can be seen that crashes during the school year with the earlier start for the high school were three times more likely to happen in the time period between end of the school day and bedtime. After the later start time change, not only were there fewer crashes, but the proportion of crashes happening before school versus after school was about evenly split. Also, the factor of having greater driving distances for the Jackson Hole area, which is over 500 square miles, and which has the largest geographic size of all districts studied, makes the reduction of crashes by 70% all the more remarkable, given what was noted above about the link between drowsy driving and longer
Center for Applied Research and Educational Improvement 49 University of Minnesota
distances. Finally, with Jackson Hole High School being the only major high school in Teton County, this allows for greater confidence that the drop in the crash rate is not influenced by other changes in other high schools nearby, since theirs is the only high school in the area.
Center for Applied Research and Educational Improvement 50 University of Minnesota
District Decision Processes
Center for Applied Research and Educational Improvement 51 University of Minnesota
District Decision Processes
The third major research question addressed in this study explored the actions taken and the information used by school district and community leaders as they engaged in policy discussions and an eventual decision to shift to a later high school start time. As was found over fifteen years ago (Wahlstrom, 1999), school district leaders are mostly very reluctant to engage in any form of public discussion about changing school start times for any reason other than financial (e.g., saving money) or logistical (e.g., boundary changes). In particular, a proposal to delay high school times is often met with organized resistance related to sports, day care, parents’ work schedules, district bus transportation, and perceptions of “lazy” teenagers.
To better understand how districts initiated the discussions and dealt with what is known about making a change, we conducted fourteen interviews with district leaders, such as superintendents, high school principals, school board members, and parents in all five school districts enrolled in this study. In four of the five districts, before the decision was reached to change to a later high school start time, there were many public discussions at school board meetings and informational forums that generally spanned the course of a school year. Research studies on teen sleep patterns and sleep needs, information on potential costs, and previous start time delay findings were widely shared. No organized effort to defeat the start time delay was present in any of the five districts studied. In the fifth district, the high school principals are able to decide the starting time for their schools, and two of the principals made a decision to enact a later start time. Those two schools also used the research information available to them, with the schools’ parent engagement network being one of the strongest catalysts towards initiating and supporting the start time delay.
Center for Applied Research and Educational Improvement 52 University of Minnesota
Final Report Summary and Conclusions Despite the strong medical evidence of the need for adolescents to obtain at least 8, and
preferably 9, hours of sleep every night to maximize their neural development, a strong resistance to a delayed high school start time exists in many localities across the U.S. School districts are very complex organisms that link bureaucratic structures with community norms and family life patterns, and where homeostasis or maintenance of the status quo is probably the strongest force against adopting a later start time for high schools.
However, given the analyses summarized here, there are clear benefits for students whose high schools start at 8:30 AM or later. This would include, for teens who reported they got at least 8 hours of sleep per night, that they were more likely to say they have good overall health and were less likely to report being depressed or using caffeine and other substances (e.g., alcohol, tobacco, other drugs). Other positive findings include a significant reduction in local car crashes, less absenteeism, less tardiness, as well as higher test scores on national achievement tests. Most of the research completed prior to the study being reported here has been conducted in single districts, with none examining multiple school districts in multiple locations across the U.S., using identical metrics to assess changes. Replications of this study would go a long way in confirming what appear to be substantive findings.
Finally, conducting research in school districts has more challenges than anyone might imagine. Hurdles include such things as gaining access to the students for conducting a survey, administering student surveys prior to the start time delay so that pre-post analyses can be carried out, obtaining reliable comparative academic performance data, gaining IRB approval from the local school district to conduct the study, locating several districts who are willing to have their experiences thrust into public view, and so forth. Despite those hurdles, the findings of this research study reveal that there are empirically-based positive outcomes for adolescents whenever the start time of their high school is moved to a later time—with the starting time of 8:30 AM or later clearly showing the most positive results.
Center for Applied Research and Educational Improvement 53 University of Minnesota
References
Andrade, M. M. M., Benedito-Silva, A. A., Domenice, S., Arnhold, I. J. P., & Menna-Barreto, L. (1993). Sleep characteristics of adolescents: A longitudinal study. Journal of Adolescent Health, 14, 401-406. doi: 10.1016/S1054-139X(08)80016-X
Beebe, D. W. (2011). Cognitive, behavioral, and functional consequences of inadequate sleep in children and adolescents. Pediatrics Clinics of North America, 58, 649-665. doi: 10.1016/j.pcl.2011.03.002
Beebe, D. W., Rose, D., & Amin, R. (2010). Attention, learning, and arousal of experimentally sleep-restricted adolescents in a simulated classroom. Journal of Adolescent Health, 47, 523-525. doi: 10.1016/j.jadohealth.2010.03.005
Cain, N., & Gradisar, M. (2009). Electronic media use and sleep in school-aged children and adolescents: A review. Sleep Medicine, 11, 735-742. doi: 10.1016/j.sleep.2010.02.006.
Calamaro, C. J., Mason, T. B. A., & Ratcliffe, S. J. (2009). Adolescents living the 24/7 lifestyle: Effects of caffeine and technology on sleep duration and daytime functioning. PEDIATRICS, 123, 1005-1010. doi: 10.1542/peds.2008-3641
Carrell, S.E., Maghakian, T., & West, J.E. (2011). A’s from Zzzz’s? The causal effect of school start time on academic achievement of adolescents. American Economic Journal: Economic Policy, Vol. 3, (3), pp. 62-81.
Carskadon, M. A. (1999). When worlds collide: Adolescent need for sleep versus societal demands. . Phi Delta Kappan, 80, 354-359. Retrieved from: http://www.kappanmagazine.org/
Carskadon, M.A. (2011a). Sleep’s effects on cognition and learning in adolescence. Progress in Brain Research, 190, 137-143. doi: 10.106/B978-0-444-53817-8.00008-6
Carskadon, M. A. (2011b). Sleep in adolescents: The perfect storm. Pediatrics Clinics of North America, 58, 637-647. doi: 10.1016/j.pcl.2011.03.003
Carskadon, M. A. (2013). Optimal sleep habits in adolescents. In H. P. A. Van Dongen & G. A. Kerkhof (Eds.), Encyclopedia of Sleep (vol. 190, 86-87). doi: 10.1016/B978-0-12-378610-4.00018-8
Carskadon, M. A., Acebo, C., & Jenni, O. G. (2004). Regulation of adolescent sleep: Implications for behavior. Annals of the New York Academy of Sciences, 1021, 276-291. doi: 10.1196/annals.1308.032
Carskadon, M. A., Wolfson, A. R., Acebo, C., Tzischinsky, O., & Seifer, R. (1998). Adolescent sleep patterns, circadian timing, and sleepiness at a transition to early school days. SLEEP, 21, 871-881. Retrieved from: http://www.journalsleep.org/
Crowley, S. J., Acebo, C., & Carsakdon, M. A. (2007). Sleep, circadian rhythms, and delayed phase in adolescence. Sleep Medicine, 8, 602-612. doi: 10.1016/j.sleep.2006.12.002
Center for Applied Research and Educational Improvement 54 University of Minnesota
Dahl, R. E. (1999). The consequences of insufficient sleep for adolescents: Links between sleep and emotional regulation. Phi Delta Kappan, 80, 354-359. Retrieved from: http://www.kappanmagazine.org/
Dahl, R. E., & Lewin, D. S. (2002). Pathways to adolescent health: Sleep regulation and behavior. Journal of Adolescent Health, 31, 175-184. doi: 10.1016/S1054-139X(02)00506-2
Danner, F., & Phillips, B. (2008). Adolescent sleep, school start times, and teen motor vehicle crashes. Journal of Clinical Sleep Medicine, 4, 533-535. Retrieved from: http://www.aasmnet.org/JCSM/
Dexter, D., Bijwadia, J., Schilling, D., & Applebaugh, G. (2003). Sleep, sleepiness, and school start times: A preliminary study. Wisconsin Medical Journal, 102(1), 44-46. Retrieved from: https://www.wisconsinmedicalsociety.org/professional/wmj/
Drake, C., Nickel, C., Burduvali, E., Roth, T., Jefferson, C., & Badia, P. (2003). The pediatric daytime sleepiness scale (PDSS): Sleep habits and school outcomes in middle-school children. SLEEP, 26, 455-458. Retrieved from: http://www.journalsleep.org/
Elisasson, A., Eliasson, A., King, J., Gould, B., & Eliasson, A. (2002). Association of sleep and academic performance. Sleep and Breathing, 6, 45-48. doi: 10.1007/s11325-002-0045-9
Fitzerald, C. T., Messias, E., & Buysse, D. J. (2011). Teen sleep and suicidality: Results from the youth risk behavior surveys of 2007 and 2009. Journal of Clinical Sleep Medicine, 7, 351-356. doi: 10.5664/JCSM.1188
Fredriksen, K., Rodes, J., Reddy, R., & Way, N. (2004). Sleepless in Chicago: Tracking the effects of adolescent sleep loss during the middle school years. Child Development, 75, 84-95. doi: 10.1111/j.1467-8624.2004.00655.xsaa
Gau, S. S., Shang, C., Merikangas, K., Chiu, Y., Soong, W., & Cheng, A. T. (2007). Association between morningness-eveningness and behavioral/emotional problems among adolescents. Journal of Biological Rhythms, 22, 268-274. doi: 10.1177/0748730406298447
Gillen-O’Neel, C., Huynh, V. W., & Fuligni, A. J. (2013). To study or to sleep? The academic costs of extra studying at the expense of sleep. Child Development, 84, 133-142. doi: 10.1111/j.1467-8624.2012.01834.x
Hagenauer, M. H., Perryman, J. I., Lee, T. M., & Carskadon, M. A. (2009). Adolescent changes in the homeostatic and circadian regulation of sleep. Developmental Neuroscience, 31, 276-284. doi: 10.1159/000216538
Hans, P. A., Dongen, V., Maislin, G., Mullington, J. M., & Dinges, D. F. (2003). The cumulative cost of additional wakefulness: Dose-response effects on neurobehavioral functions and sleep physiology from chronic sleep restriction and total sleep deprivation. Sleep, 26(2), 117-126. Retrieved from: http://www.journalsleep.org
Center for Applied Research and Educational Improvement 55 University of Minnesota
Hansen, M., Janssen, I., Schiff, A., Zee, P., & Dubocovich, M. L. (2005). The impact of school daily schedule on adolescent sleep. Pediatrics, 115, 1555-1561. doi: 10.1542/peds.2004-1649
Harvey, A. G., Alfano, C. A., & Clarke, G. (in press). Mood disorders. In A. R. Wolfson & H. E. Montgomery-Downs (Eds.), The Oxford Handbook of Infant, Child, and Adolescent Sleep and Behavior (515-531). Ontario, Canada: Oxford University Press.
Kirby, M., Maggi, S., & D’Anguilli, A. (2011). School start times and sleep-wake cycle of adolescents: A review and critical evaluation of available evidence. Educational Researcher, 40, 56-61. doi: 10.3102/001389X11402323
Lamberg, L. (2009). High schools find later start time helps students’ health and performance. JAMA, 301(21), 2200-2201. Retrieved from: http://jama.jamanetwork.com.
Ludden, A. B., & Wolfson, A. R. (2009). Understanding adolescent caffeine use: Connecting use patterns with expectancies, reasons, and sleep. Health Education & Behavior, 37, 330-342. doi: 10.1177/1090198109341783
Lufi, D., Tzischinsky, O., & Hadar, S. (2011). Delaying school starting time by one hour: Some effects on attention levels in adolescents. Journal of Clinical Sleep Medicine, 7, 137-143. Retrieved from: http://www.aasmnet.org/JCSM/
McKnight-Eily, L. R., Eaton, D. K., Lowry, R., Croft, J. B., Presley-Cantrell, L., & Perry, G. S. (2011). Relationships between hours of sleep and health-risk behaviors in US adolescent students. Preventive Medicine, 53, 271-273. doi:10.1016/j.ypmed.2011.06.020
National Sleep Foundation (2006). Summary of findings: 2006 sleep in America poll. Retrieved from: http://www.sleepfoundation.org/article/sleep-america-polls/2006-teens-and-sleep
Ng, E. P., Ng, K., & Chan, K. C. (2009). Sleep duration,, wake/sleep symptoms, and academic performance in Hong Kong secondary school children. Sleep Breath, 13, 357-367. doi: 10.1007/s11325-009-025505
Onyper, S. V., Thacher, P. V., Gilber, J. W., & Gradess, S. G. (2012). Class start times, sleep, and academic performance in college: A path analysis. Chronobiology International, 29, 318-335. doi: 10.3109/07420528.2012.655868
Payne, J. D. (2011). Learning, memory, and sleep in humans. Sleep Medicine Clinics, 6, 15-30. doi: 10.1016/j.jsmc.2010.12.005
Perkinson-Gloor, N., Lemola, S., & Grob, A. (2013). Sleep duration, positive attitude toward life, and academic achievement: The role of daytime tiredness, behavioral persistence, and school start times. Journal of Adolescence, 36, 311-318. doi: 10.1016/j.adolescence.2012.11.008
Pizza, F., Contardi, S., Antognini, A. B., Zagoraiou, M., Borrotti, M., Mostacci, B., Mondini, S., & Cirignotta, F. (2010). Sleep quality and motor vehicle crashes in adolescents. Journal of Clinical Sleep Medicine, 6, 41-45. doi: 10.1177/1099800411408414
Center for Applied Research and Educational Improvement 56 University of Minnesota
Pollak, C. P., & Bright, D. (2003). Caffeine consumption and weekly sleep patterns in US seventh-, eighth-, and ninth-graders. PEDIATRICS, 111, 42-46. doi: 10.1542/peds.111.1.42
Randler, C., & Frech, D. (2009). Young people’s time-of-day preferences affect their school performance. Journal of Youth Studies, 12, 653-667. doi: 10.1080/13672609020902697
Tarokh, L., & Carskadon, M. A. (2009). Sleep in adolescents. In Squire, L.R. (Ed.). Encyclopedia of Neuroscience (vol. 8, 1015-1022). Oxford, England: Academic Press.
Tononi, G., & Cirelli, C. (2006). Sleep function and synaptic homeostasis. Sleep Medicine, 10¸ 49-62. doi: 10.1016/j.smrv.2005.05.002
Tononi, G., & Cirelli, C. (2013, August). Perchance to prune. Scientific American, 34-39. Vedaa, Ø., Saxvig, I. W., & Wilhelmsen-Langeland, A. (2012). School start time, sleepiness and
functioning in Norwegian adolescents. Scandinavian Journal of Educational Research, 56, 55-67. doi: 10.1080/00313831.2011.567396
Vorona, R. D., Szklo-Coxe, M., Wu, A., Dubik, M., Zhao, Y., & Ware, J. C. (2011). Dissimilar teen crash rates in two neighboring southeastern Virginia cities with different high school start times. Journal of Clinical Sleep Medicine, 7, 145-151. Retrieved from: http://www.aasmnet.org/JCSM/
Wahlstrom, K. (1999). The prickly politics of school starting times. Phi Delta Kappan, 80(5), 344-347.
Wahlstrom, K. (2002). Changing times: Findings from the first longitudinal study of later high school start times. NASSP Bulletin, 86(633), 3-21. doi: 10.1177/019263650208663302
Wahlstrom, K., Wrobel, G., & Kubow, P. (1998). Minneapolis public schools start time study executive summary. Center for Applied Research and Educational Improvement. Minneapolis, MN.
Wolfson, A., R., & Carskadon, M. A. (2003). Understanding adolescents’ sleep patterns and school performance: A critical appraisal. Sleep Medicine Review, 7, 491-503. doi: 10.1053/smrv.2002.0258
Wolfson, A. R., & Carskadon, M. A. (2005). A survey of factors influencing high school start times. NASSP Bulletin, 89(642), 47-66. doi: 10.1177/019263650508964205
Wolfson, A. R., Spaulding, N. L., Dandrow, C., & Baroni, E. M. (2008). Middle school start times: The importance of a good night’s sleep for young adolescents. Behavioral Sleep Medicine, 5(3), 194-209. doi: 10.1080/15402000t701263809.
Wrobel, G. D. (1999). The impact of school starting time on family life. Phi Delta Kappan, 80, 360-364. Retrieved from: http://www.kappanmagazine.org/
Center for Applied Research and Educational Improvement 57 University of Minnesota
Appendices
Center for Applied Research and Educational Improvement 58 University of Minnesota
Appendix A
Data Cleaning Methods
Researchers had to clean the data before running any analysis. Data were cleaned this way:
• All hours and minutes were converted to a 24 hour clock in order to calculate the total number of hours slept per night. Formula=(IF(Time to bed<Time wake up, time to bed+1,time to bed)-time wake up)*24 or =(IF(T2<S2,T2+1,T2)-S2)*24
• To figure out mean bedtime for school nights and weekends, 12 hours was added to times between 1:00 AM and 11:00 AM.
• Students were asked to estimate how many hours they worked, played sports, and participated in organized activities. Researchers made an executive decision to cut the data so that the range of student responses for these items during the week was between 0 and 30 hours. Approximately 99.8% of student responses fell in this range of responses. The range of responses for number of hours participating in these activities for the weekend was trimmed to be 0-20 hours and included only Saturday and Sunday. Again, about 99.4% of student responses fell between this range of responses. Students were asked to estimate the total number of hours they studied during the school week and weekend. Researchers included students who said they studied any number of hours between 0 and 40, which represented about 99.8% of student responses. For the weekend, researchers allowed ranges of time spent between 0 and 20 hours, which included 99.7% of student responses.
• For questions about how many hours students have studied in and outside of school, we included 0 in the calculation so that researchers could see the frequencies including students who reported 0 hours of homework during the week and on weekends. Then we also calculated the frequencies for those students who reported they had studied for at least one hour during the week or on the weekend. For the other questions regarding work time, playing sports, and organized activities, we included in the analysis only students who answered that they had participated in these activities at least 1 hour per week.
• Researchers also converting bedtimes and wakeup times for both school weeks and weekends into categories.
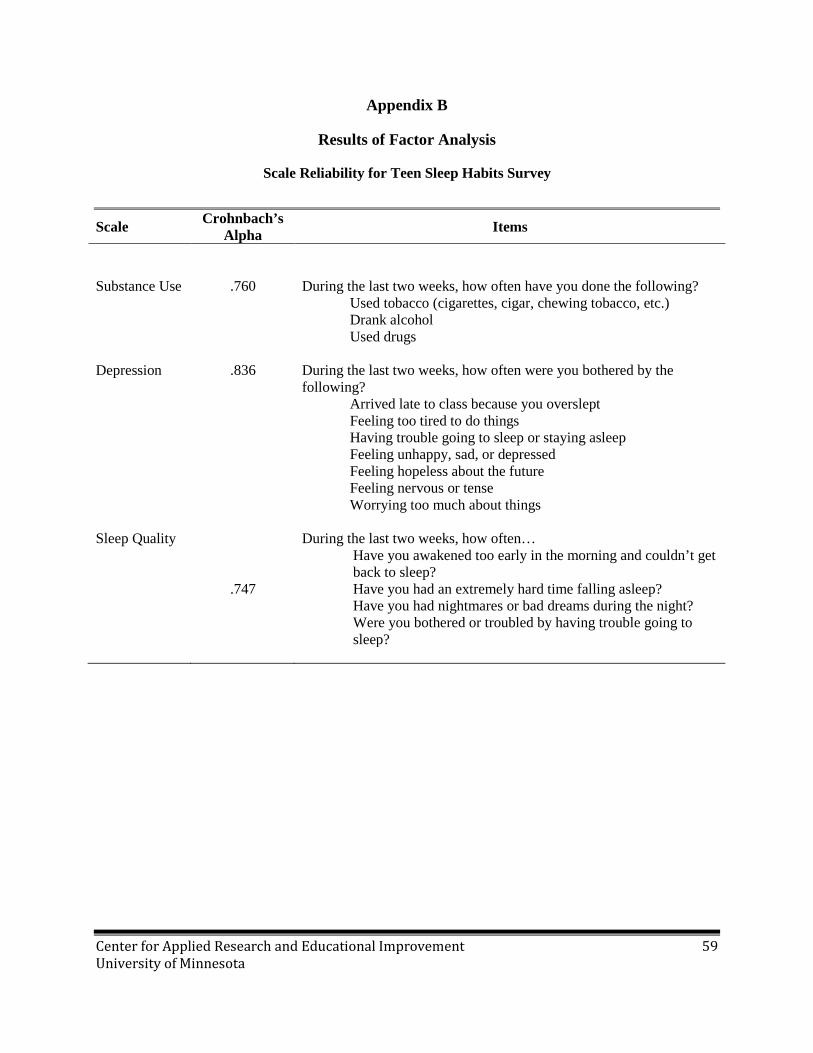
Center for Applied Research and Educational Improvement 59 University of Minnesota
Appendix B
Results of Factor Analysis
Scale Reliability for Teen Sleep Habits Survey
Scale Crohnbach’s Alpha Items
Substance Use .760 During the last two weeks, how often have you done the following?
Used tobacco (cigarettes, cigar, chewing tobacco, etc.) Drank alcohol Used drugs
Depression .836 During the last two weeks, how often were you bothered by the
following? Arrived late to class because you overslept Feeling too tired to do things Having trouble going to sleep or staying asleep Feeling unhappy, sad, or depressed Feeling hopeless about the future Feeling nervous or tense Worrying too much about things
Sleep Quality
.747
During the last two weeks, how often… Have you awakened too early in the morning and couldn’t get back to sleep? Have you had an extremely hard time falling asleep? Have you had nightmares or bad dreams during the night? Were you bothered or troubled by having trouble going to sleep?
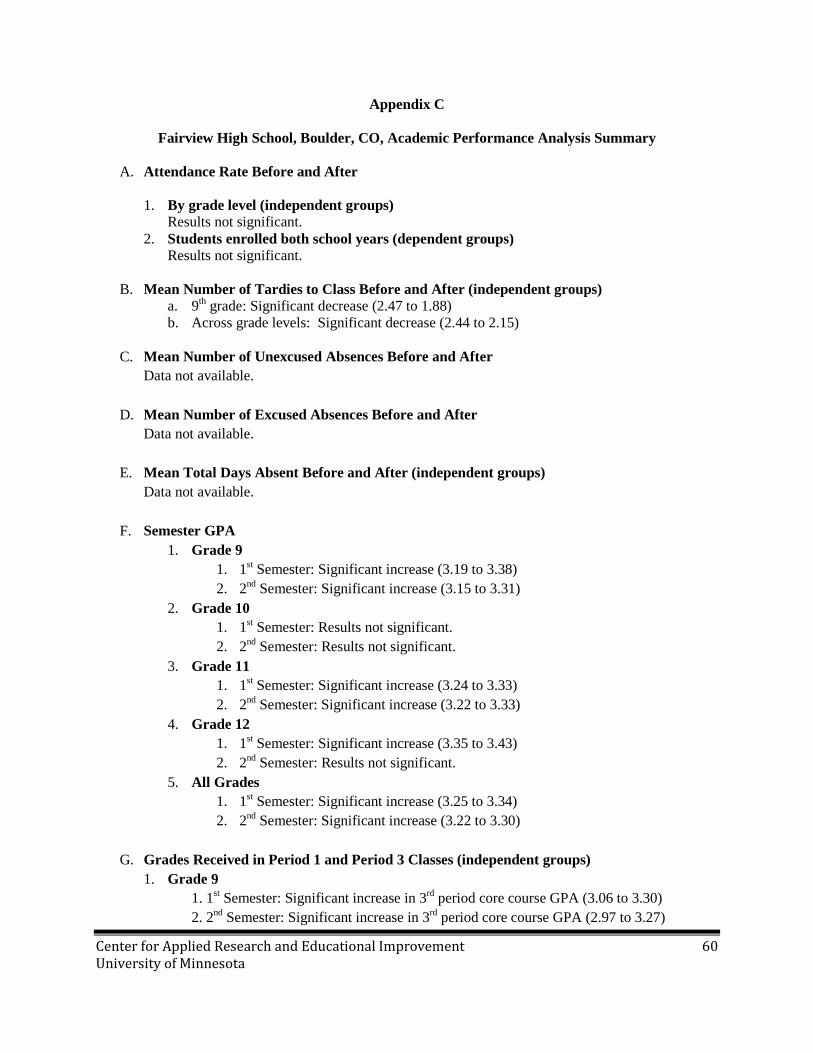
Center for Applied Research and Educational Improvement 60 University of Minnesota
Appendix C
Fairview High School, Boulder, CO, Academic Performance Analysis Summary
A. Attendance Rate Before and After
1. By grade level (independent groups) Results not significant.
2. Students enrolled both school years (dependent groups) Results not significant.
B. Mean Number of Tardies to Class Before and After (independent groups)
a. 9th grade: Significant decrease (2.47 to 1.88) b. Across grade levels: Significant decrease (2.44 to 2.15)
C. Mean Number of Unexcused Absences Before and After
Data not available.
D. Mean Number of Excused Absences Before and After Data not available.
E. Mean Total Days Absent Before and After (independent groups) Data not available.
F. Semester GPA 1. Grade 9
1. 1st Semester: Significant increase (3.19 to 3.38) 2. 2nd Semester: Significant increase (3.15 to 3.31)
2. Grade 10 1. 1st Semester: Results not significant. 2. 2nd Semester: Results not significant.
3. Grade 11 1. 1st Semester: Significant increase (3.24 to 3.33) 2. 2nd Semester: Significant increase (3.22 to 3.33)
4. Grade 12 1. 1st Semester: Significant increase (3.35 to 3.43) 2. 2nd Semester: Results not significant.
5. All Grades 1. 1st Semester: Significant increase (3.25 to 3.34) 2. 2nd Semester: Significant increase (3.22 to 3.30)
G. Grades Received in Period 1 and Period 3 Classes (independent groups)
1. Grade 9 1. 1st Semester: Significant increase in 3rd period core course GPA (3.06 to 3.30) 2. 2nd Semester: Significant increase in 3rd period core course GPA (2.97 to 3.27)
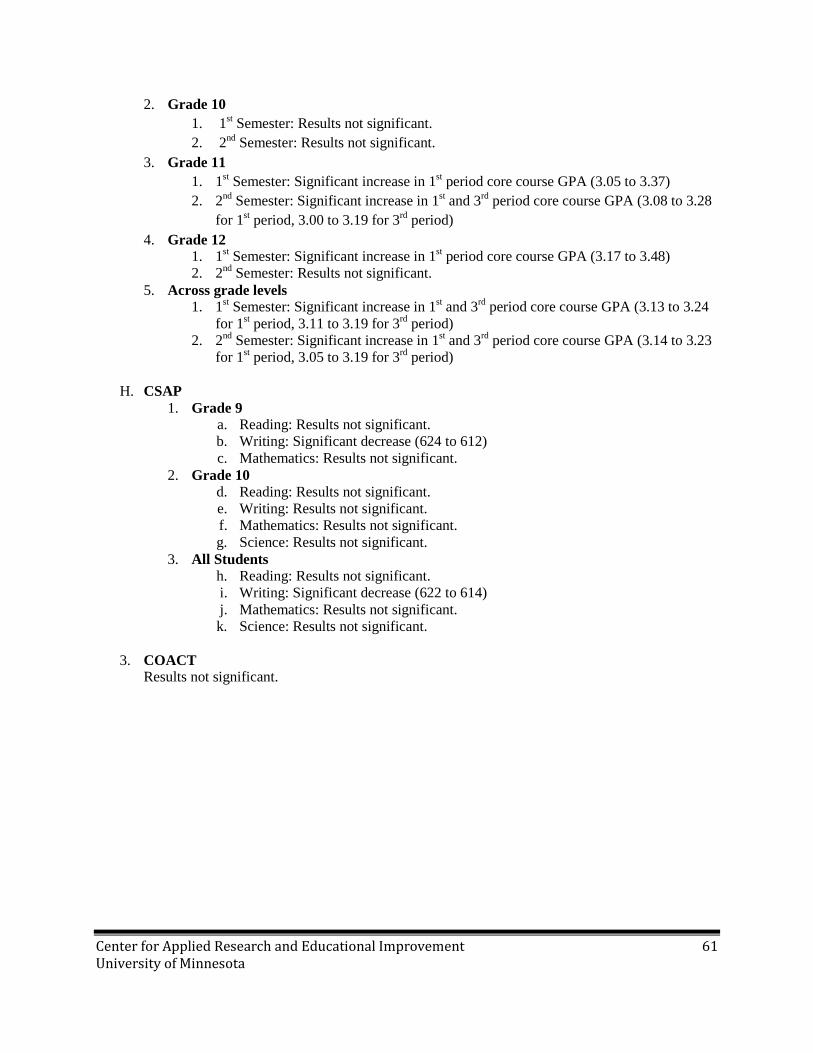
Center for Applied Research and Educational Improvement 61 University of Minnesota
2. Grade 10 1. 1st Semester: Results not significant. 2. 2nd Semester: Results not significant.
3. Grade 11 1. 1st Semester: Significant increase in 1st period core course GPA (3.05 to 3.37) 2. 2nd Semester: Significant increase in 1st and 3rd period core course GPA (3.08 to 3.28
for 1st period, 3.00 to 3.19 for 3rd period) 4. Grade 12
1. 1st Semester: Significant increase in 1st period core course GPA (3.17 to 3.48) 2. 2nd Semester: Results not significant.
5. Across grade levels 1. 1st Semester: Significant increase in 1st and 3rd period core course GPA (3.13 to 3.24
for 1st period, 3.11 to 3.19 for 3rd period) 2. 2nd Semester: Significant increase in 1st and 3rd period core course GPA (3.14 to 3.23
for 1st period, 3.05 to 3.19 for 3rd period)
H. CSAP 1. Grade 9
a. Reading: Results not significant. b. Writing: Significant decrease (624 to 612) c. Mathematics: Results not significant.
2. Grade 10 d. Reading: Results not significant. e. Writing: Results not significant. f. Mathematics: Results not significant. g. Science: Results not significant.
3. All Students h. Reading: Results not significant. i. Writing: Significant decrease (622 to 614) j. Mathematics: Results not significant. k. Science: Results not significant.
3. COACT
Results not significant.
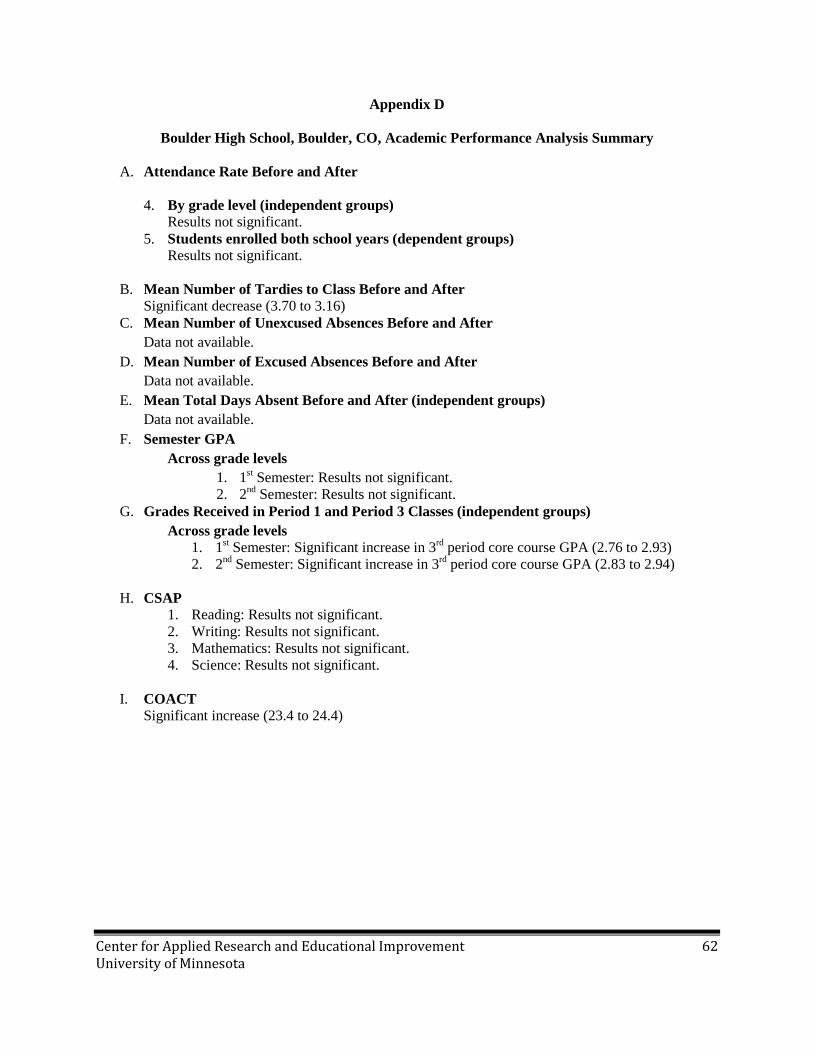
Center for Applied Research and Educational Improvement 62 University of Minnesota
Appendix D
Boulder High School, Boulder, CO, Academic Performance Analysis Summary
A. Attendance Rate Before and After
4. By grade level (independent groups) Results not significant.
5. Students enrolled both school years (dependent groups) Results not significant.
B. Mean Number of Tardies to Class Before and After
Significant decrease (3.70 to 3.16) C. Mean Number of Unexcused Absences Before and After
Data not available. D. Mean Number of Excused Absences Before and After
Data not available. E. Mean Total Days Absent Before and After (independent groups)
Data not available. F. Semester GPA
Across grade levels 1. 1st Semester: Results not significant. 2. 2nd Semester: Results not significant.
G. Grades Received in Period 1 and Period 3 Classes (independent groups) Across grade levels
1. 1st Semester: Significant increase in 3rd period core course GPA (2.76 to 2.93) 2. 2nd Semester: Significant increase in 3rd period core course GPA (2.83 to 2.94)
H. CSAP
1. Reading: Results not significant. 2. Writing: Results not significant. 3. Mathematics: Results not significant. 4. Science: Results not significant.
I. COACT
Significant increase (23.4 to 24.4)
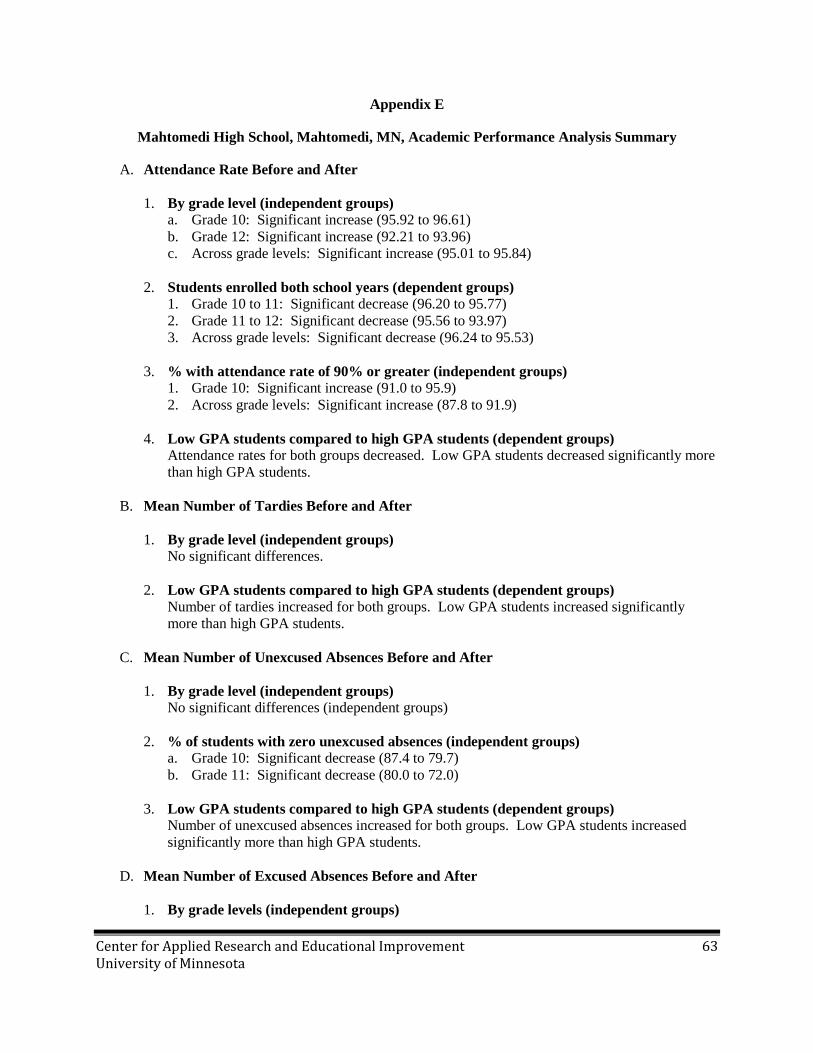
Center for Applied Research and Educational Improvement 63 University of Minnesota
Appendix E
Mahtomedi High School, Mahtomedi, MN, Academic Performance Analysis Summary
A. Attendance Rate Before and After 1. By grade level (independent groups)
a. Grade 10: Significant increase (95.92 to 96.61) b. Grade 12: Significant increase (92.21 to 93.96) c. Across grade levels: Significant increase (95.01 to 95.84)
2. Students enrolled both school years (dependent groups)
1. Grade 10 to 11: Significant decrease (96.20 to 95.77) 2. Grade 11 to 12: Significant decrease (95.56 to 93.97) 3. Across grade levels: Significant decrease (96.24 to 95.53)
3. % with attendance rate of 90% or greater (independent groups)
1. Grade 10: Significant increase (91.0 to 95.9) 2. Across grade levels: Significant increase (87.8 to 91.9)
4. Low GPA students compared to high GPA students (dependent groups)
Attendance rates for both groups decreased. Low GPA students decreased significantly more than high GPA students.
B. Mean Number of Tardies Before and After
1. By grade level (independent groups)
No significant differences.
2. Low GPA students compared to high GPA students (dependent groups) Number of tardies increased for both groups. Low GPA students increased significantly more than high GPA students.
C. Mean Number of Unexcused Absences Before and After
1. By grade level (independent groups)
No significant differences (independent groups)
2. % of students with zero unexcused absences (independent groups) a. Grade 10: Significant decrease (87.4 to 79.7) b. Grade 11: Significant decrease (80.0 to 72.0)
3. Low GPA students compared to high GPA students (dependent groups)
Number of unexcused absences increased for both groups. Low GPA students increased significantly more than high GPA students.
D. Mean Number of Excused Absences Before and After 1. By grade levels (independent groups)
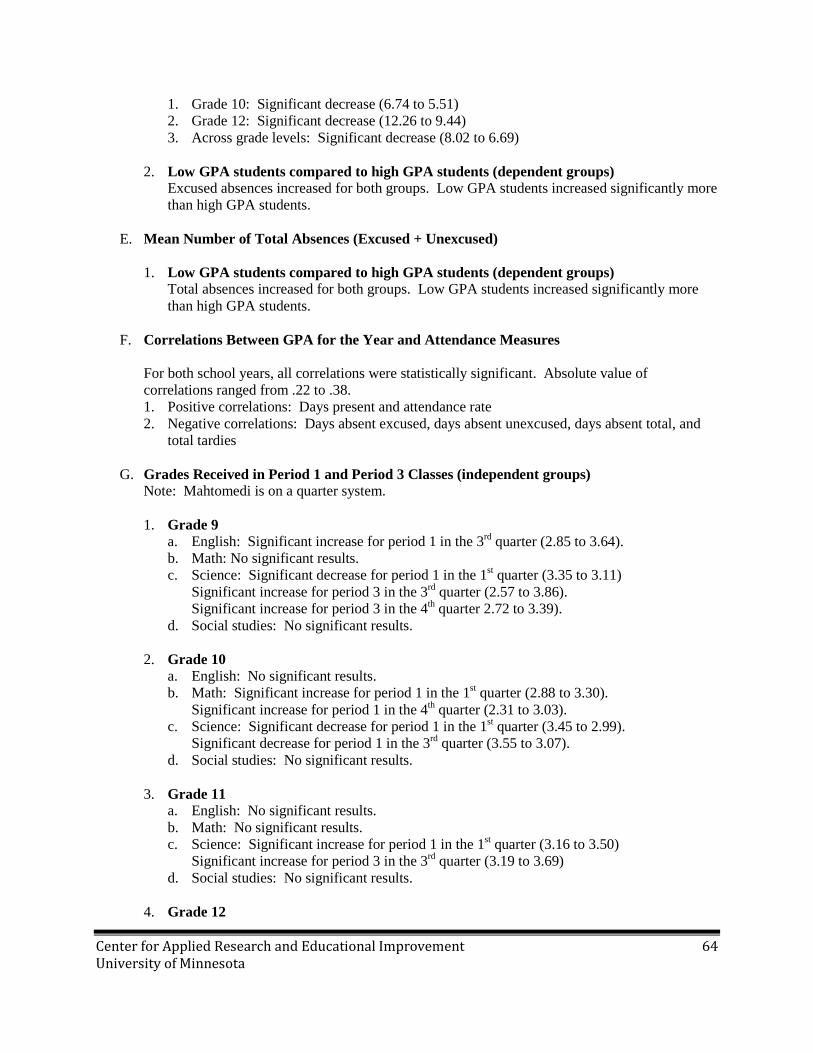
Center for Applied Research and Educational Improvement 64 University of Minnesota
1. Grade 10: Significant decrease (6.74 to 5.51) 2. Grade 12: Significant decrease (12.26 to 9.44) 3. Across grade levels: Significant decrease (8.02 to 6.69)
2. Low GPA students compared to high GPA students (dependent groups)
Excused absences increased for both groups. Low GPA students increased significantly more than high GPA students.
E. Mean Number of Total Absences (Excused + Unexcused) 1. Low GPA students compared to high GPA students (dependent groups)
Total absences increased for both groups. Low GPA students increased significantly more than high GPA students.
F. Correlations Between GPA for the Year and Attendance Measures
For both school years, all correlations were statistically significant. Absolute value of correlations ranged from .22 to .38. 1. Positive correlations: Days present and attendance rate 2. Negative correlations: Days absent excused, days absent unexcused, days absent total, and
total tardies
G. Grades Received in Period 1 and Period 3 Classes (independent groups) Note: Mahtomedi is on a quarter system. 1. Grade 9
a. English: Significant increase for period 1 in the 3rd quarter (2.85 to 3.64). b. Math: No significant results. c. Science: Significant decrease for period 1 in the 1st quarter (3.35 to 3.11)
Significant increase for period 3 in the 3rd quarter (2.57 to 3.86). Significant increase for period 3 in the 4th quarter 2.72 to 3.39).
d. Social studies: No significant results.
2. Grade 10 a. English: No significant results. b. Math: Significant increase for period 1 in the 1st quarter (2.88 to 3.30).
Significant increase for period 1 in the 4th quarter (2.31 to 3.03). c. Science: Significant decrease for period 1 in the 1st quarter (3.45 to 2.99).
Significant decrease for period 1 in the 3rd quarter (3.55 to 3.07). d. Social studies: No significant results.
3. Grade 11
a. English: No significant results. b. Math: No significant results. c. Science: Significant increase for period 1 in the 1st quarter (3.16 to 3.50)
Significant increase for period 3 in the 3rd quarter (3.19 to 3.69) d. Social studies: No significant results.
4. Grade 12

Center for Applied Research and Educational Improvement 65 University of Minnesota
a. English: No significant results. b. Math: Significant increase for period 3 in the 2nd quarter (2.68 to 3.08) c. Science: No significant results. d. Social studies: Significant decrease for period 1 in the 1st quarter (3.50 to 3.05)
5. Across grade levels
a. English: Significant increase for period 3 in the 1st quarter (2.89 to 3.13) Significant decrease for period 1 in the 3rd quarter (3.23 to 2.89) Significant decrease for period 3 in the 4th quarter (3.13 to 2.85)
b. Math: Significant increase for period 1 in the 1st quarter (2.90 to 3.16) Significant increase for period 1 in the 4th quarter (2.69 to 3.01) Significant decrease for period 3 in the 4th quarter (3.28 to 3.06)
c. Science: Significant increase for period 3 in the 2nd quarter (3.06 to 3.31) Significant increase for period 3 in the 3rd quarter (2.97 to 3.58) Significant increase for period 3 in the 4th quarter (3.05 to 3.48)
d. Social studies: Significant decrease for period 1 in the 1st quarter (3.29 to 2.98)
H. Composite ACT Significant increase (23.37 to 24.12)
I. MCA-II Math Before and After Due to change in test, comparisons cannot be made.
J. MCA Reading Before and After Due to change in test, comparisons cannot be made.
K. GRAD Writing Scale Score Before and After GRAD writing data were not available.
L. PLAN Before and After PLAN data were not available.
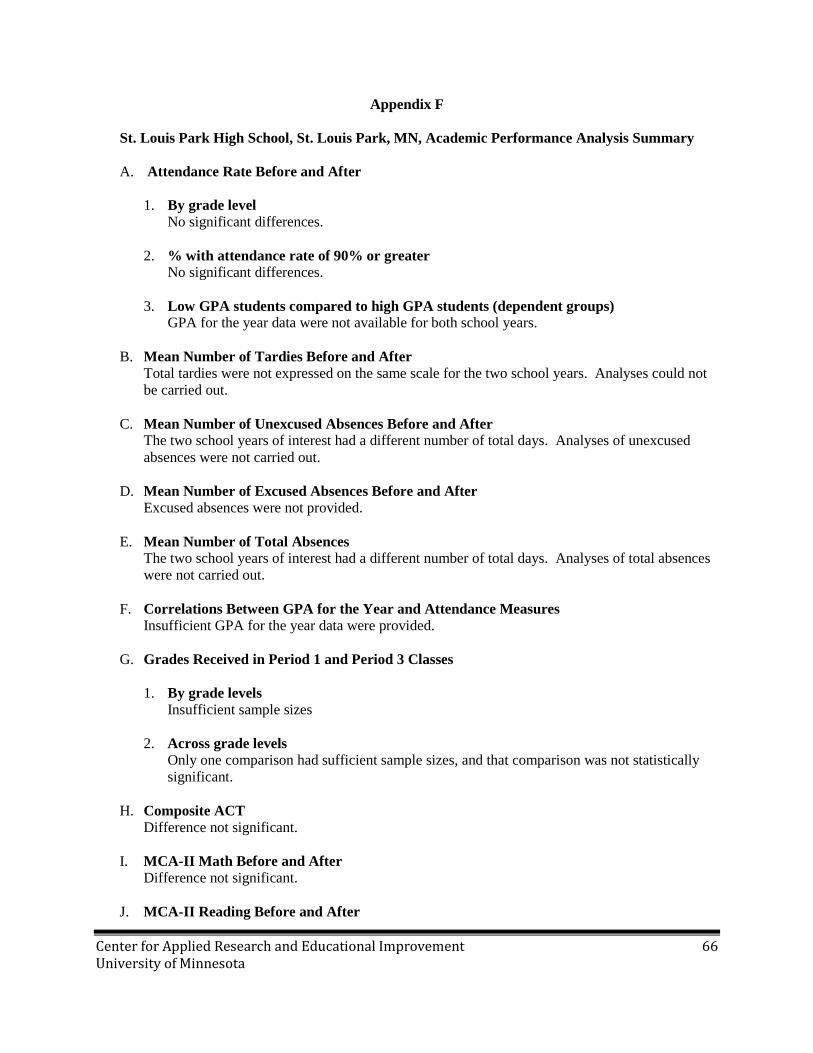
Center for Applied Research and Educational Improvement 66 University of Minnesota
Appendix F
St. Louis Park High School, St. Louis Park, MN, Academic Performance Analysis Summary
A. Attendance Rate Before and After
1. By grade level No significant differences.
2. % with attendance rate of 90% or greater
No significant differences.
3. Low GPA students compared to high GPA students (dependent groups) GPA for the year data were not available for both school years.
B. Mean Number of Tardies Before and After
Total tardies were not expressed on the same scale for the two school years. Analyses could not be carried out.
C. Mean Number of Unexcused Absences Before and After
The two school years of interest had a different number of total days. Analyses of unexcused absences were not carried out.
D. Mean Number of Excused Absences Before and After Excused absences were not provided.
E. Mean Number of Total Absences
The two school years of interest had a different number of total days. Analyses of total absences were not carried out.
F. Correlations Between GPA for the Year and Attendance Measures
Insufficient GPA for the year data were provided.
G. Grades Received in Period 1 and Period 3 Classes 1. By grade levels
Insufficient sample sizes
2. Across grade levels Only one comparison had sufficient sample sizes, and that comparison was not statistically significant.
H. Composite ACT
Difference not significant.
I. MCA-II Math Before and After Difference not significant.
J. MCA-II Reading Before and After

Center for Applied Research and Educational Improvement 67 University of Minnesota
Difference not significant.
K. GRAD Writing Scale Score Before and After Difference not significant.
L. PLAN Before and After
PLAN data were provided for only one of the school years.
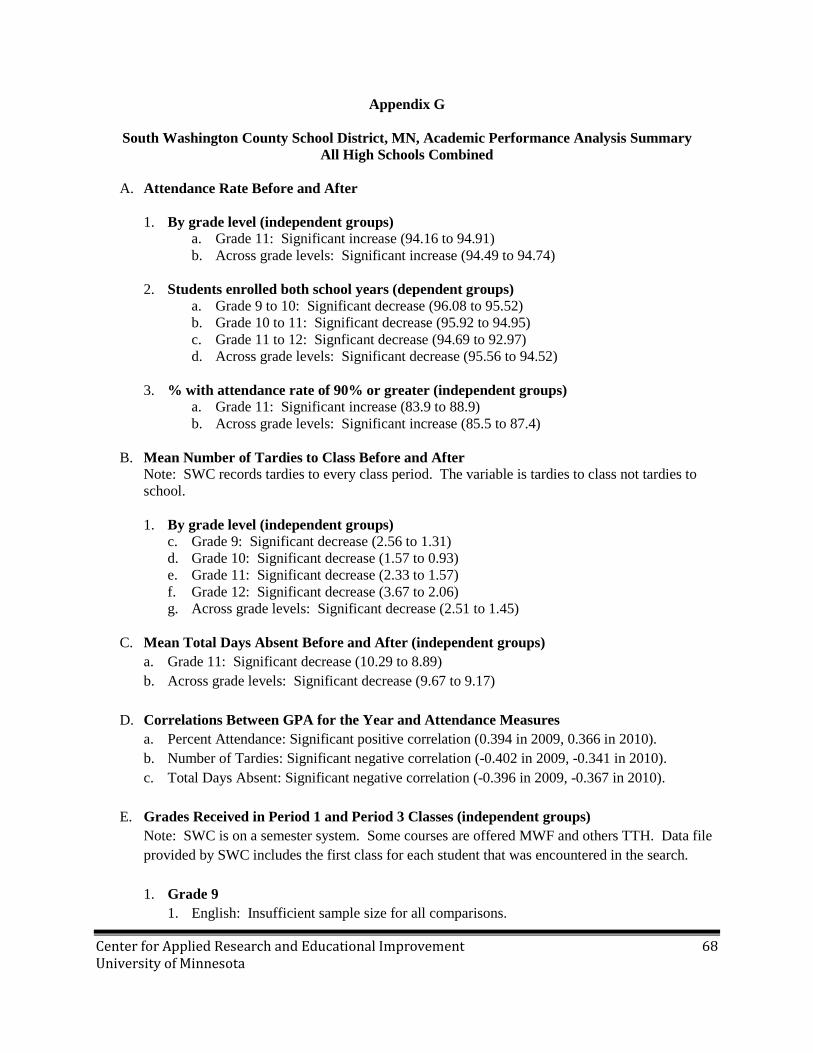
Center for Applied Research and Educational Improvement 68 University of Minnesota
Appendix G
South Washington County School District, MN, Academic Performance Analysis Summary All High Schools Combined
A. Attendance Rate Before and After
1. By grade level (independent groups)
a. Grade 11: Significant increase (94.16 to 94.91) b. Across grade levels: Significant increase (94.49 to 94.74)
2. Students enrolled both school years (dependent groups)
a. Grade 9 to 10: Significant decrease (96.08 to 95.52) b. Grade 10 to 11: Significant decrease (95.92 to 94.95) c. Grade 11 to 12: Signficant decrease (94.69 to 92.97) d. Across grade levels: Significant decrease (95.56 to 94.52)
3. % with attendance rate of 90% or greater (independent groups)
a. Grade 11: Significant increase (83.9 to 88.9) b. Across grade levels: Significant increase (85.5 to 87.4)
B. Mean Number of Tardies to Class Before and After
Note: SWC records tardies to every class period. The variable is tardies to class not tardies to school. 1. By grade level (independent groups)
c. Grade 9: Significant decrease (2.56 to 1.31) d. Grade 10: Significant decrease (1.57 to 0.93) e. Grade 11: Significant decrease (2.33 to 1.57) f. Grade 12: Significant decrease (3.67 to 2.06) g. Across grade levels: Significant decrease (2.51 to 1.45)
C. Mean Total Days Absent Before and After (independent groups)
a. Grade 11: Significant decrease (10.29 to 8.89) b. Across grade levels: Significant decrease (9.67 to 9.17)
D. Correlations Between GPA for the Year and Attendance Measures
a. Percent Attendance: Significant positive correlation (0.394 in 2009, 0.366 in 2010). b. Number of Tardies: Significant negative correlation (-0.402 in 2009, -0.341 in 2010). c. Total Days Absent: Significant negative correlation (-0.396 in 2009, -0.367 in 2010).
E. Grades Received in Period 1 and Period 3 Classes (independent groups)
Note: SWC is on a semester system. Some courses are offered MWF and others TTH. Data file provided by SWC includes the first class for each student that was encountered in the search. 1. Grade 9
1. English: Insufficient sample size for all comparisons.

Center for Applied Research and Educational Improvement 69 University of Minnesota
2. Math: Insufficient sample size for all comparisons. 3. Science: Insufficient sample size for all comparisons. 4. Social studies: Insufficient sample size for all comparisons.
2. Grade 10
1. English: Significant increase for period 1 in the 2nd semester (2.62 to 2.88) 2. Math: Significant increase for period 1 in the 1st semester (2.74 to 3.08) 3. Science: Significant increase for period 3 in the 1st semester (2.67 to 3.02) 4. Social studies: Significant increase for period 3 in the 1st semester (2.78 to 3.26)
3. Grade 11
1. English: Significant increase for period 3 in the 1st semester (2.69 to 3.02) Significant increase for period 3 in the 2nd semester (2.67 to 2.94) 2. Math: No significant results. 3. Science: No significant results. 4. Social studies: Significant increase for period 1 in the 2nd semester (2.72 to 3.04)
4. Grade 12
1. English: No significant results. 2. Math: No significant results. 3. Science: Significant increase for period 3 in the 2nd semester (2.49 to 2.80). 4. Social studies: Significant increase for period 3 in the 2nd semester (2.49 to 2.89).
5. Across grade levels
1. English: No significant results. 2. Math: Significant decrease for period 3 in the 1st semester (2.85 to 2.68). 3. Science: No significant results. 4. Social studies: Significant increase for period 1 in the 2nd semester (2.70 to 2.87) and
period 3 in the 2nd semester (2.77 to 2.97).
F. Composite ACT Before and After Result not significant.
G. MCA-11 Math Before and After 1. Scale score: Significant increase (1150.07 to 1152.04) 2. Percent at or above proficiency: Significant increase (51.8 to 57.4)
H. MCA-II Reading Before and After
1. Scale score: Result not significant. 2. Percent at or above proficiency: Result not significant.
I. GRAD Writing Scale Score Before and After
Result not significant.
J. PLAN Before and After 1. English: Result not significant. 2. Math: Significant increase (18.78 to 19.35)
Center for Applied Research and Educational Improvement 70 University of Minnesota
3. Reading: Result not significant. 4. Science: Result not significant. 5. Composite: Result not significant.
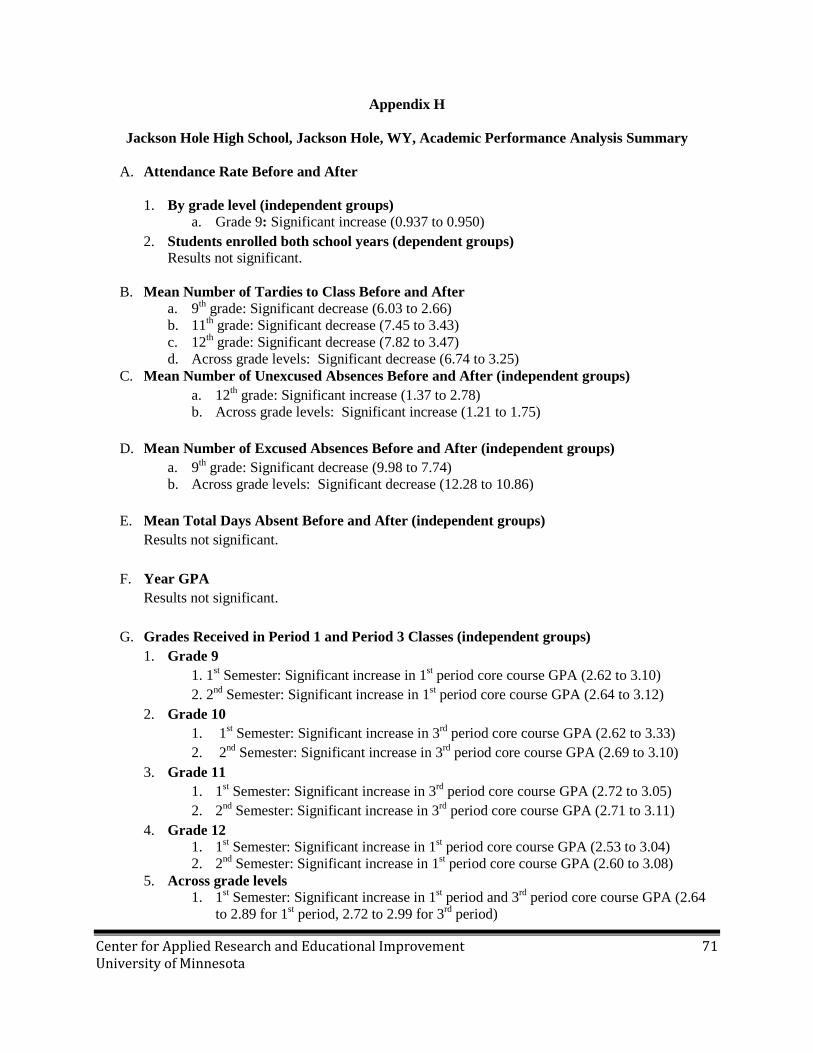
Center for Applied Research and Educational Improvement 71 University of Minnesota
Appendix H
Jackson Hole High School, Jackson Hole, WY, Academic Performance Analysis Summary
A. Attendance Rate Before and After
1. By grade level (independent groups) a. Grade 9: Significant increase (0.937 to 0.950)
2. Students enrolled both school years (dependent groups) Results not significant.
B. Mean Number of Tardies to Class Before and After
a. 9th grade: Significant decrease (6.03 to 2.66) b. 11th grade: Significant decrease (7.45 to 3.43) c. 12th grade: Significant decrease (7.82 to 3.47) d. Across grade levels: Significant decrease (6.74 to 3.25)
C. Mean Number of Unexcused Absences Before and After (independent groups) a. 12th grade: Significant increase (1.37 to 2.78) b. Across grade levels: Significant increase (1.21 to 1.75)
D. Mean Number of Excused Absences Before and After (independent groups)
a. 9th grade: Significant decrease (9.98 to 7.74) b. Across grade levels: Significant decrease (12.28 to 10.86)
E. Mean Total Days Absent Before and After (independent groups)
Results not significant.
F. Year GPA Results not significant.
G. Grades Received in Period 1 and Period 3 Classes (independent groups)
1. Grade 9 1. 1st Semester: Significant increase in 1st period core course GPA (2.62 to 3.10) 2. 2nd Semester: Significant increase in 1st period core course GPA (2.64 to 3.12)
2. Grade 10 1. 1st Semester: Significant increase in 3rd period core course GPA (2.62 to 3.33) 2. 2nd Semester: Significant increase in 3rd period core course GPA (2.69 to 3.10)
3. Grade 11 1. 1st Semester: Significant increase in 3rd period core course GPA (2.72 to 3.05) 2. 2nd Semester: Significant increase in 3rd period core course GPA (2.71 to 3.11)
4. Grade 12 1. 1st Semester: Significant increase in 1st period core course GPA (2.53 to 3.04) 2. 2nd Semester: Significant increase in 1st period core course GPA (2.60 to 3.08)
5. Across grade levels 1. 1st Semester: Significant increase in 1st period and 3rd period core course GPA (2.64
to 2.89 for 1st period, 2.72 to 2.99 for 3rd period)
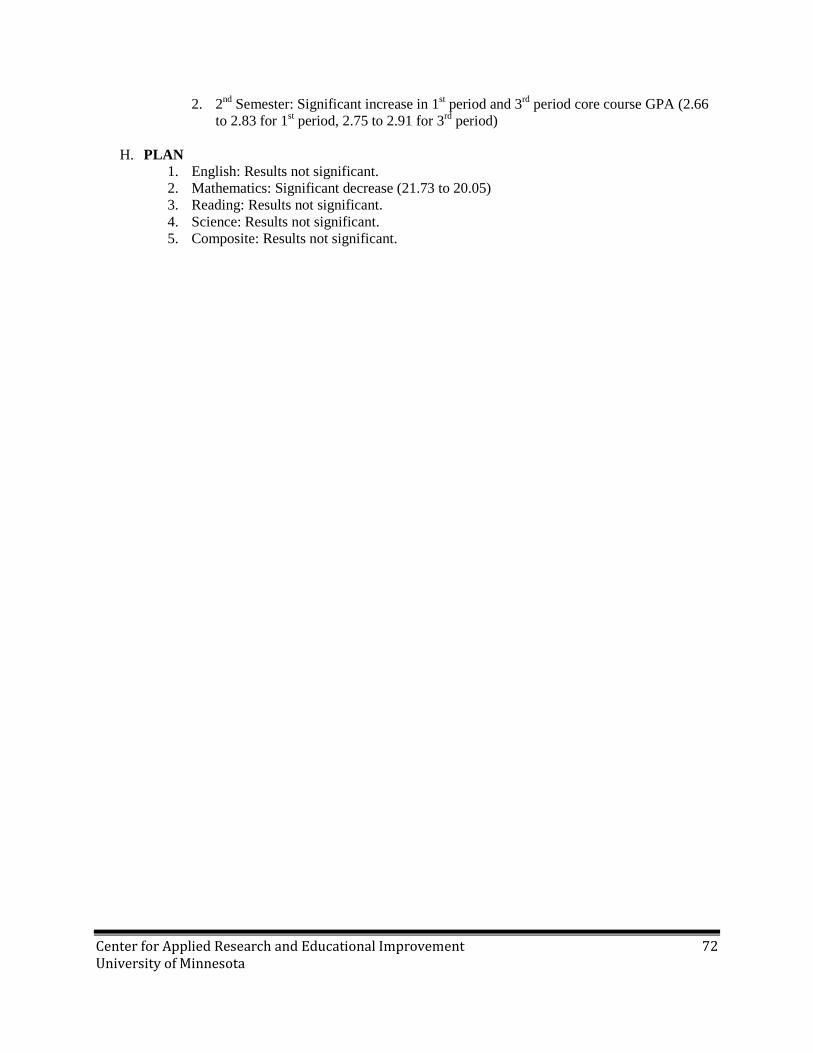
Center for Applied Research and Educational Improvement 72 University of Minnesota
2. 2nd Semester: Significant increase in 1st period and 3rd period core course GPA (2.66 to 2.83 for 1st period, 2.75 to 2.91 for 3rd period)
H. PLAN 1. English: Results not significant. 2. Mathematics: Significant decrease (21.73 to 20.05) 3. Reading: Results not significant. 4. Science: Results not significant. 5. Composite: Results not significant.