Embed Size (px)
Citation preview
DI
SC
US
SI
ON
P
AP
ER
S
ER
IE
S
Forschungsinstitut zur Zukunft der ArbeitInstitute for the Study of Labor
Examining the Relationship between Employee Resistance to Changes in Job Conditions and Wider Organisational Change: Evidence from Ireland
IZA DP No. 8441
August 2014
Hugh CroninSeamus McGuinness
Examining the Relationship between
Employee Resistance to Changes in Job Conditions and Wider Organisational
Change: Evidence from Ireland
Hugh Cronin Economic & Social Research Institute Dublin (Research Intern 2013)
Seamus McGuinness
Economic & Social Research Institute Dublin, Trinity College Dublin, NILS, Flinders University and IZA
Discussion Paper No. 8441 August 2014
IZA
P.O. Box 7240 53072 Bonn
Germany
Phone: +49-228-3894-0 Fax: +49-228-3894-180
E-mail: [email protected]
Any opinions expressed here are those of the author(s) and not those of IZA. Research published in this series may include views on policy, but the institute itself takes no institutional policy positions. The IZA research network is committed to the IZA Guiding Principles of Research Integrity. The Institute for the Study of Labor (IZA) in Bonn is a local and virtual international research center and a place of communication between science, politics and business. IZA is an independent nonprofit organization supported by Deutsche Post Foundation. The center is associated with the University of Bonn and offers a stimulating research environment through its international network, workshops and conferences, data service, project support, research visits and doctoral program. IZA engages in (i) original and internationally competitive research in all fields of labor economics, (ii) development of policy concepts, and (iii) dissemination of research results and concepts to the interested public. IZA Discussion Papers often represent preliminary work and are circulated to encourage discussion. Citation of such a paper should account for its provisional character. A revised version may be available directly from the author.
IZA Discussion Paper No. 8441 August 2014
ABSTRACT
Examining the Relationship between Employee Resistance to Changes in Job Conditions and Wider Organisational Change:
Evidence from Ireland This paper uses a linked employer-employee dataset, the National Employment Survey, to examine the determinants of organisational change and employee resistance to change and, specifically, to examine the influence of employee inflexibility on the implementation of firm-level policies aimed at increasing competitiveness and workforce flexibility. Key finding arising from the research is that while workforce resistance to job-related change often forces firms to seek alternative means of achieving labour flexibility, there appears little that firms can do to prevent such resistance occurring. The presence of HRM staff, consultation procedures, wage bargaining mechanisms, bullying and equality polices etc were found to have little impact on the incidence of workforce resistance to changes in job conditions. JEL Classification: J31, J51, J53 Keywords: workforce resistance, organisational change, linked employer-employee data Corresponding author: Seamus McGuinness Economic and Social Research Institute Whitaker Square Sir John Rogerson’s Quay Dublin 2 Ireland E-mail: [email protected]
2
Background and Introduction
Ireland’s economic difficulties have been well documented. The international financial
collapse had a severe effect on Ireland, the combination of a banking crises and the bursting
of a property bubble led to a dramatic fall in economic output and a rapid rise in
unemployment. The crises began to be felt by firms towards the latter part of 2008, the data
point relevant to this study, with GDP falling by 2% in that year.
Within a deteriorating economic environment, firms - both domestic and foreign-owned -
struggle to maintain competitiveness, particularly given that wages remain downwardly rigid
even in times of recession (Babecky et al., 2009, 2010; 2012; Bertola et al., 2010;
Christopoulou et al., 2010; Autor and Katz, 1999; Fuss, 2008). The majority of the research
has found that wage levels generally exhibit downward rigidity, with the probability of wage
cuts being lower the more skilled the worker. In terms of theoretical frameworks, downward
wage rigidity is consistent with a number of theoretical labour market models such as the
efficiency wage theory (Shapiro and Stiglitz, 1984), adverse selection theory (Weiss, 1980)
and insider-outsider theory (Lindbeck and Snower, 1988). Consistent with the international
evidence, a recent study confirmed that both real average wages and average labour costs
increased in Ireland during the course of the recession (Bergin et al, 2012). Given the
inflexibility of earnings, it stands to reason that firms tend to seek to improve competitiveness
during a recession primarily through other forms of organisational change. In addition,
Pfeffer (1994) notes that, with a decreasing competitive advantage provided by traditional
sources of success such as product and process technology, how the workforce is managed is
comparatively more important. The ability of firms to implement organisational change will
undoubtedly be impacted by the extent of co-operation of the workforce which, itself, may be
a function of many factors such as the nature and scale of HRM practices, bargaining
3
arrangements and industrial sector etc. Nevertheless, the link between workforce resistance
and organisational change is under-researched perhaps due to a lack of available data that
allows for a linking of employee sentiment to firm-level management strategies. This paper
utilises data from a matched employer-employee survey captured at the beginning of the Irish
downturn in October 2008. The study captures activity at the very beginning of the economic
crises, when the decline in output was still relatively modest and the scale of the recession to
come remained largely unforeseen. The research provides a unique assessment of the
determinants of firm-level organisational change over a range of dimensions related to
employee performance and, more importantly, measures the extent to which such change was
impeded or stimulated as a consequence of levels of workforce resistance.
There is a relatively limited literature relating workforce resistance to organisational change.
Dow and Perotti (2008) develop a theoretical construct of resistance to change by attempting
to explain why established firms fail to adjust to take advantage of opportunities when new
firms typically succeed. Dow and Perotti (2008) argues that radical adjustment of assets
within the firm can create winners and losers and, consequently, employees whose skills are
less valued as a result of proposed changes will tend to resist. The paper predicts modest
shifts in the role of different skills can be implemented by consensus but that the likelihood of
success diminishes as the desired shift gets larger. Choi (2011) reviews the literature on
attitude and organisational change using the keywords ‘readiness for change’, ‘commitment
to change’, ‘openness to change’ and ‘cynicism about organisational change’. The review
highlights research that demonstrates that change-specific commitments, such as commitment
to change and cynicism about organisational change, are better predictors of either support
for change or resistance to it than general attitudes, such as organisational commitment and
organisational cynicism. Choi (2011) concludes that, given their propensity to evolve
4
according to the situation, attitudes to change are better conceptualised as states rather than
personality traits.
A number of studies have sought to indentify the determinants of resistance to change, some
of which have linked workforce resistance with employee level performance. Iverson (1996),
tests a causal model predicting employees’ acceptance of organisational change in a public
hospital in Australia. Using multiple regression, he finds that the most important determinant
of acceptance to organisational change is union membership, with members less accepting
than non-members. Oreg (2003) developed a measurement scale relating individual worker
characteristics to resistance to change across and identifies four reliable factors: routine
seeking, emotional reaction to imposed change, cognitive rigidity and short-term focus.
Kunze et al (2013) interrogate the assumption of a correlation between age and resistance to
change using the scale developed by Oreg (2003). The findings of Kunze et al (2013)
contradict the common stereotype of older employees being more resistant to change and the
authors suggest this may be due to older employees being more stable and better able to cope
with negative emotional reactions to change. The study also finds tenure and occupational
status have positive coefficients for resistance to change, while the examination of how
resistance to change interacts with individual performance finds individual resistance to
change has negative consequences, such as lower efficiency, higher absenteeism due to health
problems and the emergence of fewer new ideas. Wanberg and Banas (2000) find that while
the characteristic of resilience is not predictive of a more positive view of a given change, it
is related to higher levels of change acceptance.
Finally, a number of papers examine the impact of organisational change on workers, thus
providing some further understanding of the motivation for resistance. Black et al (2004)
find that firms that implement high-performance practices compensate at least some of their
workers for such work practices but that there is a significant association between such
5
practices and increased wage inequality. Secondly, they find that some forms of
organisational change, such as self-managed teams and job rotation, tend to reduce
employment levels within the firm. Bryson et al (2013) use a linked employee-employer
dataset to study the effects of organisational change on employee well-being in the private
sector. The paper finds that change can be introduced without adversely affecting the
employee's job-related anxiety by engaging with employees when implementing change but
only where one or more unions operate in the workplace. Otherwise, organisational change
always increases job-related anxiety.
Data and Methods
The objectives of this paper are two-fold: firstly, we model the determinants of workforce
resistance to job-related change and, secondly, we assess the impacts of such resistance on
the probability that firms will implement various wider forms of organisational change. The
data is taken from the October 2008 National Employment Survey (NES) and captures the
very beginning of the Irish economic recession, when the need for organisational
restructuring was likely to be relatively high. The NES is a linked employee-employer
survey that is nationally representative of the distribution of employers in Ireland. The
employer sample is drawn from the CSO’s Central Business Register. Selected firms are
asked to extract a systematic sample of employees from payrolls. The dataset covers 10,000
employers and 100,000 employees and the sample generated is representative of the
proportion of companies in each economic sector and size class. The employer questionnaire
requested information on employee earnings, hours worked and occupation. Information was
also obtained on firm size, sector, the use of pay agreements, HRM procedures etc.
Employees were issued with a separate questionnaire within which they provided information
on age, gender, educational attainment, employment status (part-time or full-time), length of
6
time in paid employment, length of service with current employer and also other job-related
characteristics (for example, trade union membership, shift-work etc).
The October 2008 survey includes modules on employee resistance and organisational
change, with separate employer and employee questions. Employers were asked “Has your
business experienced any of the following forms of change in 2008?” with the respondent
then providing dichotomous response to nine suggestions: (1) a greater reliance on temporary
workers, (2) a greater reliance on part-time workers, (3) an increase in overtime hours, (4) a
reduction in the number of management levels, (5) a greater reliance on job-rotation and
multi-tasking, (6) a greater reliance on external suppliers of products/services (outsourcing),
(7) a downsizing the operation, (8) an increases in the level of staff absenteeism, and (9)
increases in the level of involuntary staff turnover1. With respect to employee resistance to
job-related change, employees were asked “If the following changes were implemented in
your workplace over the next two years, how acceptable would you find: (1) an increase in
your level of responsibility for your workload, (2) an increase in the level of technology
involved in your work, (3) an increase in the level of supervision of your work, (4) an
increase in the level of skills necessary to carry out your job, (5) having to work more
unsociable hours, (7) an increase in your authority to make decisions, (8) changes to terms
and conditions of your employment. In response, employees had the options of ‘acceptable’,
‘not acceptable’ and no response.
Given that our objective is to identify the factors that influence workforce resistance and the
subsequent impact of such resistance on various forms of organisational change, we reduce 1 As changes in the levels of absenteeism and staff turnover are not determined by management, these are not
subsequently included as measures of organisational change. Similarly, down-sizing is not considered as this
may also be an exogenous influence largely outside of management control.
7
our linked employer-employee data to the level of the firm by retaining one observation per
organisation. In doing so, our employee resistance terms now relate to the average level of
resistance within the employing organisation. We retain information from the employer
survey and derive a range of organisational average variables based on the employee
responses within each organisation. We apply establishment-level weights to our firm-level
observations to ensure that our data is representative of the population of firms in Ireland
during 2008. Our sample is restricted to private sector organisations only on the grounds that
public sector organisations are more insulated from market forces and thus both employees
and managers are likely to behave differently both in terms of resistance to change and the
need for organisational reform. After exclusions for missing data etc, we retain an effective
sample of 4,035 firms.
Moving onto the econometric analysis, our specifications are based around the assumption
that our key outcome variables (workforce resistance and organisational change) at the level
of the firm will be driven by a combination of the human capital characteristics of the
workforce and a range of organisational attributes. Given this, we begin by estimating
equation 1 where the dependant variable is binary in nature and indicates that the firm has a
incidence of workforce resistance to change in specific areas of job performance that places it
in the top quartile of resistant firms. The choice of the cut-off point is somewhat arbitrary --
nevertheless, it is fair to conclude that firms selected in this manner can be classified as
having the most resistant workforces. Equation 1 is estimated for each of the 7 job-related
areas of potential reform. Resistance is modelled as a function of the firm-level
characteristics, measured either in terms of variables derived from average employee
responses (H), which typically reflect the firm’s human capital such as average levels of
education and experience, or single response measures (F) taken from the employer survey

8
which capture firm-level characteristics such as firm size, sector, HRM practices etc.
Subsequent to identifying the drivers of employee level resistance, we then estimate equation
2, which models the determinants of firm-level organisational change as a function of firm-
level characteristics (H and F) and the binary measures of employee resistance to change
(Res). On the grounds that organisational change may be non-random with respect to
employee resistance i.e. firms may select into various modes of organisational change based
on their observable characteristics which may also be related to levels of employee resistance,
a Heckman selection adjustment is added to the models. The selection terms are derived by
extracting inverse Mills ratios from equation 1. In order to ensure that the models are
properly identified, equation 1 includes a number of additional controls that are omitted from
equation 22 (see Puhani, 2000).
1 2Re s H Fα β β ε= + + + (1)
1 2 3 Re ReOrgch H F s sα β β β λ ε= + + + + + (2)
Results
Table 1 reports the average proportions of employees stating that a specific change in
employment conditions is unacceptable by industrial sector. There was a relatively low level
of variation in the level of workforce resistance to change on the various dimensions of
employment conditions, with between 20 and 25 per cent of workers indicating that they
would resist any attempt to alter aspects of their employment (Table 1). At 20 per cent,
2 The exclusions instruments should ideally have a theoretical basis. In our models we adopt management
and individual development programmes and employee incentive schemes such as profit sharing, share
incentive, group incentives (productivity incentives based in group performance) and individual incentives
(bonuses etc) on the grounds that while such measures may impact employee resistance they will be
relatively unimportant in a firms decision to implement change.
9
workforce resistance was lowest with respect to proposed increases in the number of
unsociable hours worked. At 26 percent, workforce resistance was most pronounced with
respect to any increase in the skill content of jobs.
There was some substantial variation in the extent of workforce resistance to altered
employment conditions across sectors. Subjective resistance was somewhat higher than
average in the Financial and Insurance industry, particularly with respect to potential changes
to terms and conditions and increases in unsociable hours. Conversely, workforce resistance
to many dimensions of job-related change was lower than average within the Construction
sector, perhaps reflecting a higher tolerance for harsher working conditions among
construction workers. With respect to specific dimensions of workforce resistance across
sectors, the potential introduction of new technologies was associated with low levels of
resistance in the Real Estate, Professional and Construction industries. Employees in the
Health and Social Care sector appeared relatively hostile to the introduction of additional
technologies or increased job autonomy.
Table 2 cross-tabulates workforce resistance to changing job conditions by organisational
size and demonstrates, very clearly, that workforce resistance across all dimensions of change
is strongly and positively correlated with organisational size.
<Insert Table 1 around here>
<Insert Table 2 around here>
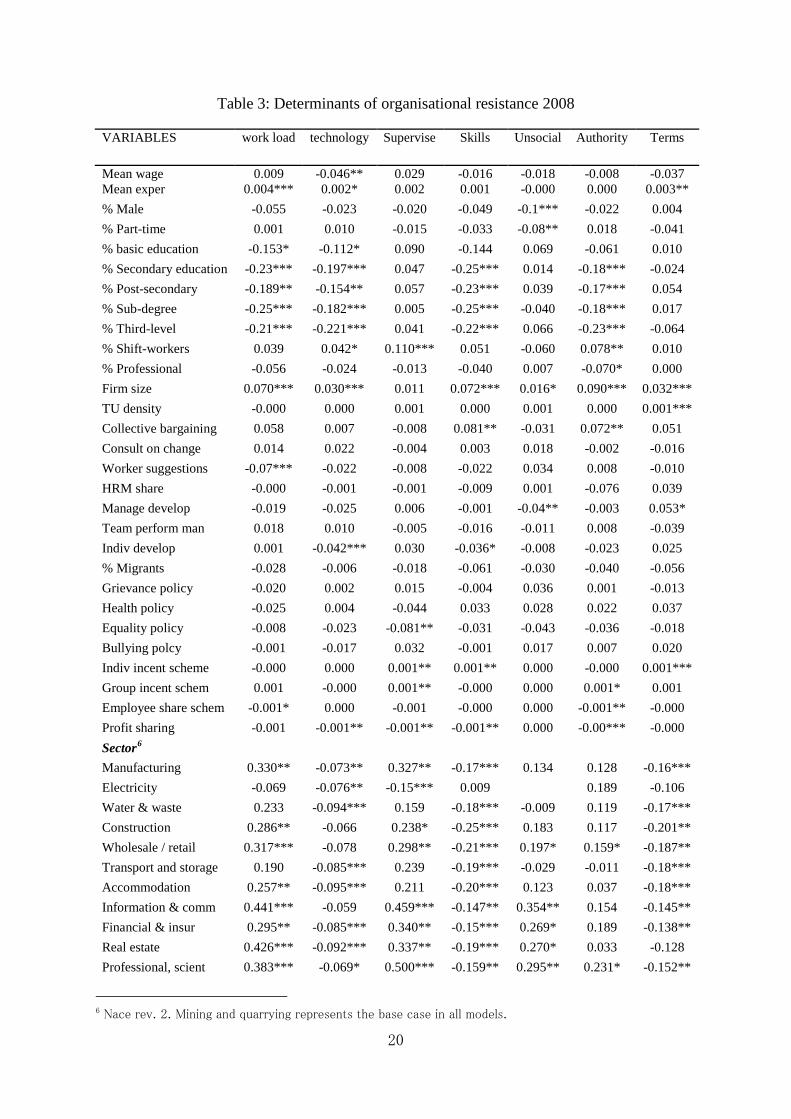
Table 3 presents the result from equation 1, which models the determinants of employee
resistance at the level of the firm across a range of areas related to job performance. The
10
dependant variable takes the value 1 if the proportion of employees indicating that they
would find change in a particular area unacceptable lies above the 75th percentile, and zero
otherwise3. As such, the models identify the characteristics of highly resistant firms. We
estimate the model using a binary variable, as opposed to the continuous alternative, in order
to facilitate the Heckman adjustment in equation 2; nevertheless, the results from a model
estimated using a continuous dependant variable are comparable to those presented in Table
34. The explanatory variables in our model capture the education and experience
composition of the firm, existing work practices, management/HRM structures and employee
incentive schemes.
A number of variables are significant with respect to all or most dimensions of workforce
resistance, specifically, resistant firms tended to employ lower shares of educated workers.
Similarly, a relatively high level of workforce resistance to change in various dimensions of
employment conditions was consistently more common in larger firms. Pay levels were
largely unimportant; however, workforce resistance to the introduction of new technologies
was lower in higher paying firms. Firms employing higher shares of more experience --
typically older -- workers were more likely to experience workforce resistance to any
increases in workloads or changes to terms and conditions.
Interestingly, both trade union density and the presence of collective bargaining
arrangements were not consistently related to workforce resistance; nevertheless, some
3 The exception relates to the variable capturing resistance to an increase in skill requirements. The
distribution of this measure was highly skewed to the left and, consequently, the cut-off point was raised to
above the 90th percentile in this case. 4 Results available from the authors.
11
results were detected. In line with prior expectations, workforce resistance to proposed
changes in terms and conditions was positively related to trade union density. The presence
of collective wage bargaining arrangements was also found to raise workforce resistance to
any proposed change involving increases in either the skill requirements of jobs or levels of
supervisory responsibility. Employee consultation also had little impact; however, the
collection of worker suggestions was related to a 7 per cent reduction in the probability of
workforce resistance to any proposed increases in workloads. The share of workers
employed in HRM and the existence of management development procedures had minimal or
no impact on workforce resistant to potential changes in employment conditions. The
presence of equality policies within the organisation tended to lower the probability of
workforce resistance to increases in levels of supervisory responsibility; however, no impacts
were found with regard to bullying, health or grievance policies. Organisations implementing
individual performance management systems were somewhat less likely to have a workforce
resistant to the introduction of new technologies into existing jobs.
The presence of certain financial incentive schemes was found to have some impact on the
probability of workforce resistance to changes in working conditions -- specifically, the
higher the proportion of employees in profit sharing schemes, the lower probability of
resistance across most dimensions of change However, individual incentive schemes raised
the likelihood of workforce resistance to any proposed changes in levels of supervision, terms
and conditions of employment and skill requirements. The presence of group incentive
schemes also exerts a positive impact with regard to resistance to any proposed increase in
supervisory requirements. Presumably, if efforts are rewarded on a group basis, this reduces
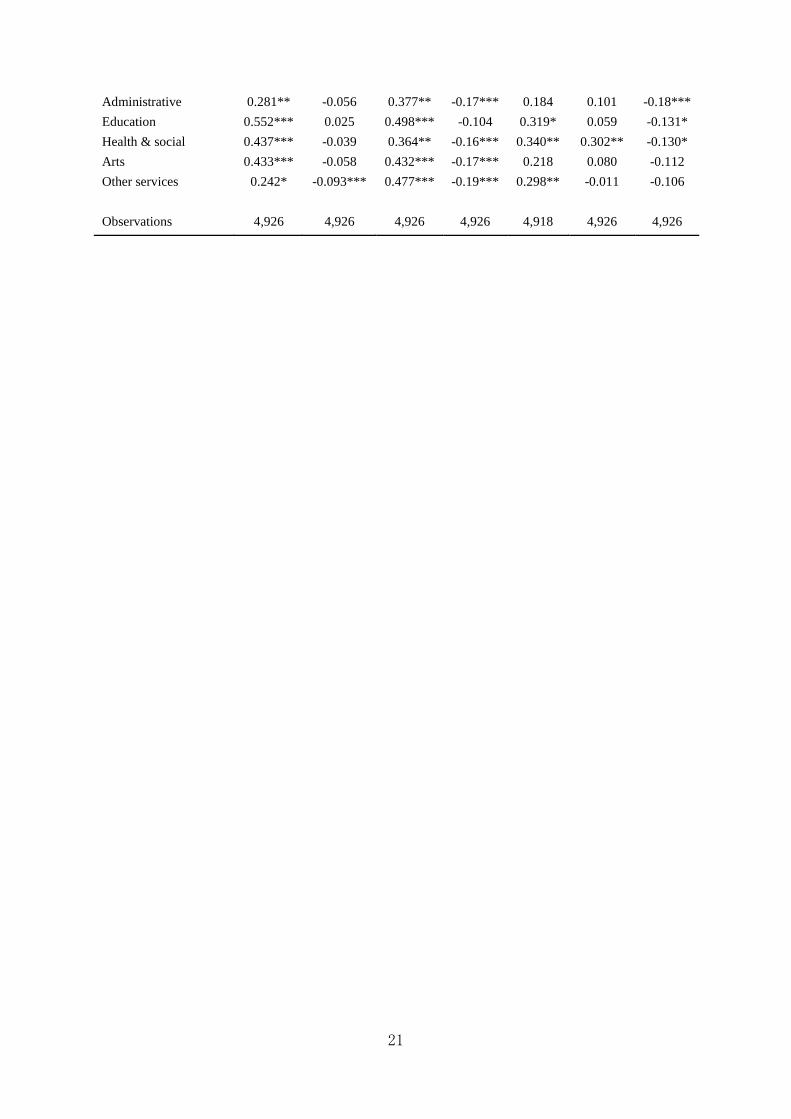
the incentive to take on supervisory duties. Finally, with respect to the Industrial sector, in
line with the descriptive statistics, the probability of workforce resistance across most
dimensions of change was higher within the Information and communication industry.
12
<Insert Table 3 around here>
In Table 4, we model the probability that firms implementing a range of strategies related
either the increased labour force flexibility or downsizing. The explanatory variables again
include a range of firm-level characteristics; however, we now also include measures of
workforce resistance to examine the hypothesis that employee-level inflexibility to changes
in job conditions can stimulate, or inhibit, some forms of change related to labour flexibility
and competitiveness. As the dependant variables are binary in nature, we estimate probit
models (equation 2). We augment the model with inverse Mills ratios (taken from equation
1) to control for the possibility that firms that are workforce resistant will possess
characteristics that are also correlated with organisational change. Failure to control for these
selection effects may result in biased estimates of the impact of workforce resistance on
wider organisational change.
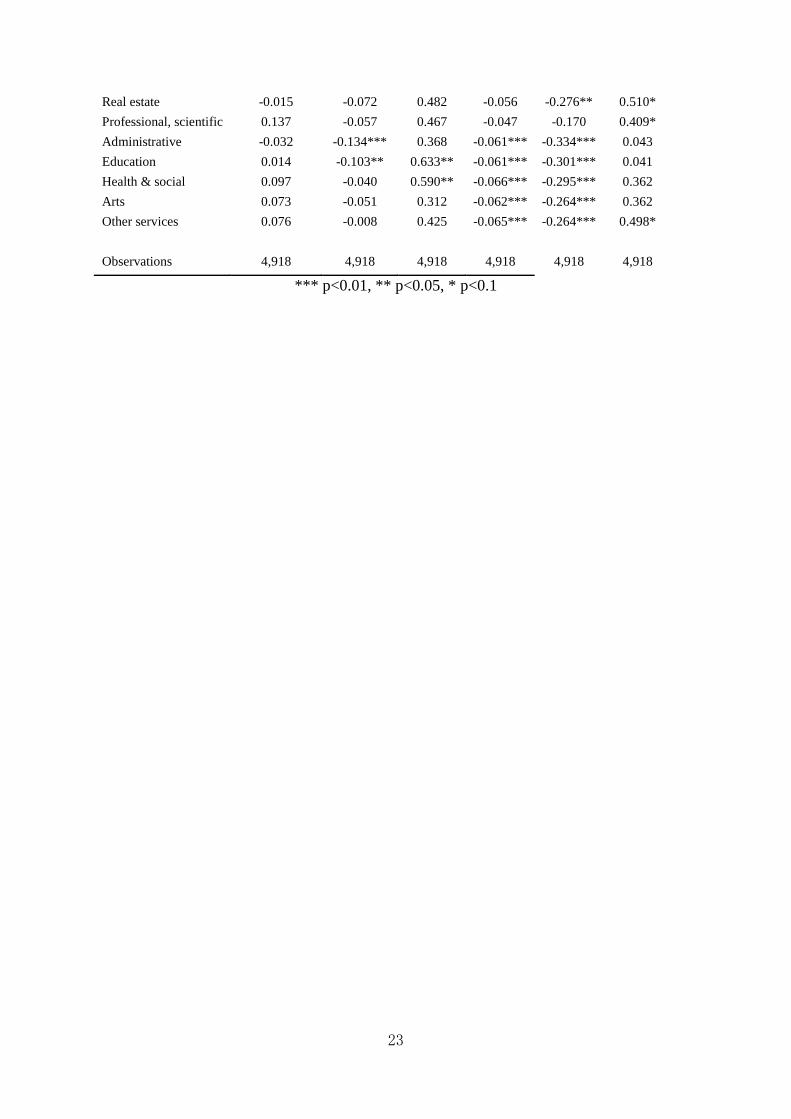
The results from the organisational change models are presented in Table 4. Although the
models are well specified, there are few consistent impacts with respect to general firm-level
characteristics. Nevertheless, some patterns were evident. Larger firms were more likely to
have increased their use of temporary and part-time workers, to have increased their reliance
on job rotation/multi-tasking and reduced management levels in the preceding period. Firms
employing more experienced staff were less likely to have increased their use of part-time
workers5. Employee relations variables were more significant, with organisations that had a
system of staff consultation more likely to have reduced management levels, increased job
rotation/multi-tasking or downsized during 2008. Workplaces with an employee suggestions
system were more likely to have outsourced products or services in the months previous to
the survey. Firms with a higher share of migrant workers were less likely to have increased
5 Organisations employing higher shares of part-time workers were, unsurprisingly, more likely to have increased their reliance of part-time throughout the year. The result is potentially highly endogenous and should be interpreted with caution.
13
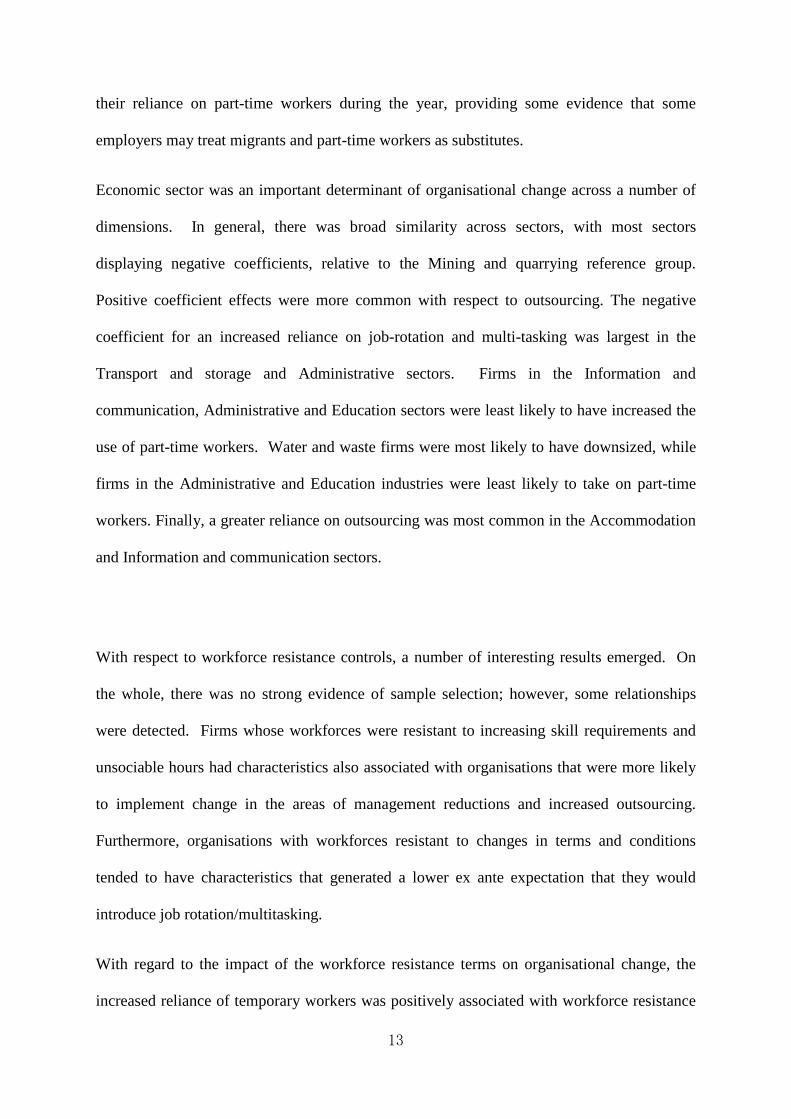
their reliance on part-time workers during the year, providing some evidence that some
employers may treat migrants and part-time workers as substitutes.
Economic sector was an important determinant of organisational change across a number of
dimensions. In general, there was broad similarity across sectors, with most sectors
displaying negative coefficients, relative to the Mining and quarrying reference group.
Positive coefficient effects were more common with respect to outsourcing. The negative
coefficient for an increased reliance on job-rotation and multi-tasking was largest in the
Transport and storage and Administrative sectors. Firms in the Information and
communication, Administrative and Education sectors were least likely to have increased the
use of part-time workers. Water and waste firms were most likely to have downsized, while
firms in the Administrative and Education industries were least likely to take on part-time
workers. Finally, a greater reliance on outsourcing was most common in the Accommodation
and Information and communication sectors.
With respect to workforce resistance controls, a number of interesting results emerged. On
the whole, there was no strong evidence of sample selection; however, some relationships
were detected. Firms whose workforces were resistant to increasing skill requirements and
unsociable hours had characteristics also associated with organisations that were more likely
to implement change in the areas of management reductions and increased outsourcing.
Furthermore, organisations with workforces resistant to changes in terms and conditions
tended to have characteristics that generated a lower ex ante expectation that they would
introduce job rotation/multitasking.
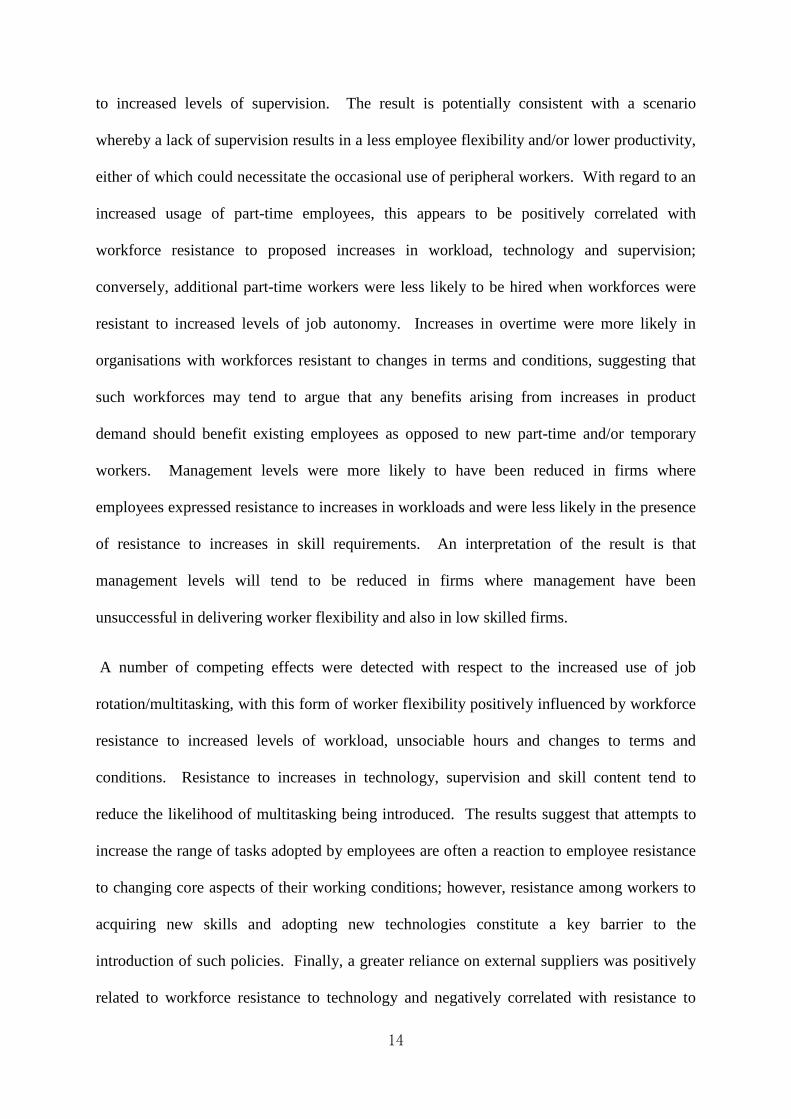
With regard to the impact of the workforce resistance terms on organisational change, the
increased reliance of temporary workers was positively associated with workforce resistance
14
to increased levels of supervision. The result is potentially consistent with a scenario
whereby a lack of supervision results in a less employee flexibility and/or lower productivity,
either of which could necessitate the occasional use of peripheral workers. With regard to an
increased usage of part-time employees, this appears to be positively correlated with
workforce resistance to proposed increases in workload, technology and supervision;
conversely, additional part-time workers were less likely to be hired when workforces were
resistant to increased levels of job autonomy. Increases in overtime were more likely in
organisations with workforces resistant to changes in terms and conditions, suggesting that
such workforces may tend to argue that any benefits arising from increases in product
demand should benefit existing employees as opposed to new part-time and/or temporary
workers. Management levels were more likely to have been reduced in firms where
employees expressed resistance to increases in workloads and were less likely in the presence
of resistance to increases in skill requirements. An interpretation of the result is that
management levels will tend to be reduced in firms where management have been
unsuccessful in delivering worker flexibility and also in low skilled firms.
A number of competing effects were detected with respect to the increased use of job
rotation/multitasking, with this form of worker flexibility positively influenced by workforce
resistance to increased levels of workload, unsociable hours and changes to terms and
conditions. Resistance to increases in technology, supervision and skill content tend to
reduce the likelihood of multitasking being introduced. The results suggest that attempts to
increase the range of tasks adopted by employees are often a reaction to employee resistance
to changing core aspects of their working conditions; however, resistance among workers to
acquiring new skills and adopting new technologies constitute a key barrier to the
introduction of such policies. Finally, a greater reliance on external suppliers was positively
related to workforce resistance to technology and negatively correlated with resistance to

15
working unsociable hours.
<Insert Table 4 around here>
Summary and conclusions
Workforce resistance to proposed changes in job conditions was found to be lower in
organisations employing higher shares of educated workers and also in smaller firms. HRM
and employee relations measures were found to have little impact on worker resistance to
changing employment conditions, while trade union density was important with respect to
alterations to core terms and conditions. The level of experience among the workforce and
rates of pay was also of relatively little importance in explaining resistance to proposed
changes in job conditions. Employee share schemes were found to lower workforce
resistance across a range of job-related dimensions; however, the marginal impact of such
initiatives on the probability of workforce resistance was low.
Overall, we found that high levels of workforce resistance to proposed changes in a range of
areas related to existing employment conditions tended to influence firms’ decisions to place
a heavier reliance on part-time and temporary workers. With respect to the increased use of
job rotation/multitasking, the results suggest that such polices tended to be introduced in
firms where the workforce was highly resistant to any changes in their core terms and
conditions, suggesting that the need for change may be related to existing worker
inflexibility. However, resistance among workers to acquiring new skills and adopting new
technologies are a key barrier to the introduction of job rotation/multi-tasking policies. A
greater reliance on external suppliers was positively related to workforce resistance to

16
increased technology and negatively correlated with resistance to working unsociable hours.
Finally, workforce resistance to increases in workload and higher levels of acceptance of new
skills was found to be related to management down-sizing decisions.
From a policy perspective, the key finding arising from the research is that while workforce
resistance to job-related change often forces firms to seek alternative means of achieving
labour flexibility, there appears little that firms can do to prevent such resistance occurring.
The presence of HRM staff, consultation procedures, wage bargaining mechanisms, bullying
and equality polices etc were found to have little impact on the incidence of workforce
resistance to changes in job conditions.
17
References
Babecký, J. Du Caju, P. Kosma, T., Lawless, M., Messina, J., Rõõm, T., Downward Nominal
and Real Wage Rigidity: Survey Evidence from European Firms, 2009, ECB Working Paper
Series no 1105 / November 2009
Bergin, A. Kelly, E and McGuinness, S, Explaining Changes in Earnings and Labour Costs
During the Recession, 2012, Renewal Series, Paper 9, April 2012.
Bertola, G., A. Dabusinskas, M. Hoeberichts, M. Izquierdo, C. Kwapil, J. Montornès and D.
Radowski.. Price, Wage and Employment Response to Shocks: Evidence from the WDN
Survey 2010, European Central Bank, Working Paper No. 1164
Black, SE, Lynch, LM and Krivelyova, A. (2004). “How Workers Fare When Employers
Innovate”, Industrial Relations. Vol. 43 Issue 1, p44-66.
Bryson, A, Barth, E and Dale-Olsen, H. (2013). “The effects of organizational change on
worker well-being and the moderating role of trade unions”, Industrial & Labor Relations
Review. Vol. 66(4), pp. 989-1011.
Campbell C, Kamlani, K. (1997). “The Reasons for Wage Rigidity: Evidence from a Survey
of Firms”, The Quarterly Journal of Economics, Vol. 112(3), pp. 759-789
Choi, M. (2011). “Employee's attitudes towards organizational change: a literature review”,
Human Resource Management, Vol. 50(4), p.479-500
Dow, J and Perotti, E. (2010). “Resistance to change”, FEEM Working Paper No. 48.
Dhyne, E. and Druant, M. (2010). “Wages, labor or prices: how do firms react to shocks?”,
European Central Bank, Working Paper No. 1224
Heckman, J. (1979). “Sample selection bias as a specification error”, Econometrica, Vol. 47,
pp. 153-61
Ichniowski, C, Shaw, K, and Prennushi, G. (1997). “The Effects of Human Resource
Management Practices on Productivity: A Study of Steel Finishing Lines”. American
Economic Review, Vol. 87 (3), pp 291-313.
Iverson, R. (1996). “Employee acceptance of organizational change”, The International
18
Journal of Human Resource Management, Vol. 7(1).
Kunze, F, Boehme, S, and Bruch, H. (2010) Age, Resistance to change, and job performance:
Testing for a common stereotype. Academy of Management Annual Meeting Proceedings.
2010, p1-6.
McGuinness, S., Kelly, E., O'Connell, P. (2010) “The Impact of Wage Bargaining Regime on
Firm-Level Competitiveness and Wage Inequality: The Case of Ireland”, Industrial
Relations, Vol. 49(4), pp. 593-615.
Oreg, S. (2003). “Resistance to Change: Developing an Individual Differences Measure”.=,
Journal of Applied Psychology, Vol. 88(4).
Palley, T. (1990), “A Theory of Downward Wage Rigidity: Job Commitment Costs,
Replacement Costs, and Tacit Coordination”, Journal of Post Keynesian Economics, Vol.
12(3), pp. 466-486
Paul, C, and Siegel, D. (2001). “The Impacts of Technology, Trade and Outsourcing on
Employment and Labor Composition”, The Scandinavian Journal of Economics, Vol. 103(2),
pp. 241-264
Piderit, S.K. (2000). “Rethinking resistance and recognizing ambivalence: a
multidimensional view of attitudes toward an organizational change”, Academy of
Management Review, Vol. 25(4), pp. 783-794.
Puhani (2000). “The Heckman Control for Selection and its critique”, Journal of Economic
Surveys, 14(1), pp 43-69.
Van Dam, K, Oreg, S, and Schyns, B. (2008). “ Daily Work Contexts and Resistance to
Organisational Change: The Role of Leader–Member Exchange, Development Climate, and
Change Process Characteristics” Applied Psychology: An International Review. Vol. 57(2),
pp. 313-334.
Wanberg, C.R. & Banas, J.T. (2000). “Predictors and Outcomes of Changes in a
Reorganizing Workplace”, Journal of Applied Psychology, Vol 85(1), pp. 132-142.

19
Table 1: Mean resistance scores by sector
Mean resistance to an increase in:
Sector Workload Technology Supervision Skills Unsociable Authority Terms Mining
Manufacturing 0.29 0.31 0.30 0.28 0.15 0.38 0.33 Electricity
Water & waste Construction 0.18 0.13 0.17 0.17 0.16 0.17 0.19
Wholesale / retail 0.25 0.25 0.23 0.27 0.21 0.26 0.24 Transport and storage 0.22 0.22 0.24 0.24 0.13 0.23 0.27 Accommodation 0.23 0.19 0.16 0.26 0.12 0.21 0.18 Information & comm. 0.24 0.15 0.42 0.23 0.31 0.17 0.25 Financial & insurance 0.20 0.24 0.29 0.32 0.40 0.25 0.42 Real estate 0.22 0.11 0.25 0.21 0.20 0.16 0.29 Professional, scientific 0.19 0.12 0.32 0.27 0.27 0.14 0.20 Administrative 0.23 0.28 0.27 0.26 0.15 0.28 0.22 Public
Education 0.25 0.34 0.32 0.42 0.37 0.24 0.20 Health & social 0.29 0.40 0.20 0.35 0.24 0.41 0.26 Arts 0.30 0.29 0.28 0.30 0.18 0.27 0.31 Other 0.24 0.18 0.30 0.21 0.25 0.21 0.21
Average 0.24 0.23 0.25 0.26 0.20 0.25 0.25
Table 2: Mean resistance scores firm size
Mean resistance to an increase in:
Size Workload Technology Supervision Skills Unsociable Authority Terms 1-50 0.23 0.16 0.23 0.24 0.20 0.20 0.20 50-500 0.30 0.38 0.31 0.31 0.21 0.41 0.40 500+ 0.39 0.69 0.39 0.45 0.28 0.53 0.52
Average 0.24 0.23 0.25 0.26 0.20 0.25 0.25
20
Table 3: Determinants of organisational resistance 2008
VARIABLES work load technology Supervise Skills Unsocial Authority Terms
Mean wage 0.009 -0.046** 0.029 -0.016 -0.018 -0.008 -0.037 Mean exper 0.004*** 0.002* 0.002 0.001 -0.000 0.000 0.003** % Male -0.055 -0.023 -0.020 -0.049 -0.1*** -0.022 0.004 % Part-time 0.001 0.010 -0.015 -0.033 -0.08** 0.018 -0.041 % basic education -0.153* -0.112* 0.090 -0.144 0.069 -0.061 0.010 % Secondary education -0.23*** -0.197*** 0.047 -0.25*** 0.014 -0.18*** -0.024 % Post-secondary -0.189** -0.154** 0.057 -0.23*** 0.039 -0.17*** 0.054 % Sub-degree -0.25*** -0.182*** 0.005 -0.25*** -0.040 -0.18*** 0.017 % Third-level -0.21*** -0.221*** 0.041 -0.22*** 0.066 -0.23*** -0.064 % Shift-workers 0.039 0.042* 0.110*** 0.051 -0.060 0.078** 0.010 % Professional -0.056 -0.024 -0.013 -0.040 0.007 -0.070* 0.000 Firm size 0.070*** 0.030*** 0.011 0.072*** 0.016* 0.090*** 0.032*** TU density -0.000 0.000 0.001 0.000 0.001 0.000 0.001*** Collective bargaining 0.058 0.007 -0.008 0.081** -0.031 0.072** 0.051 Consult on change 0.014 0.022 -0.004 0.003 0.018 -0.002 -0.016 Worker suggestions -0.07*** -0.022 -0.008 -0.022 0.034 0.008 -0.010 HRM share -0.000 -0.001 -0.001 -0.009 0.001 -0.076 0.039 Manage develop -0.019 -0.025 0.006 -0.001 -0.04** -0.003 0.053* Team perform man 0.018 0.010 -0.005 -0.016 -0.011 0.008 -0.039 Indiv develop 0.001 -0.042*** 0.030 -0.036* -0.008 -0.023 0.025 % Migrants -0.028 -0.006 -0.018 -0.061 -0.030 -0.040 -0.056 Grievance policy -0.020 0.002 0.015 -0.004 0.036 0.001 -0.013 Health policy -0.025 0.004 -0.044 0.033 0.028 0.022 0.037 Equality policy -0.008 -0.023 -0.081** -0.031 -0.043 -0.036 -0.018 Bullying polcy -0.001 -0.017 0.032 -0.001 0.017 0.007 0.020 Indiv incent scheme -0.000 0.000 0.001** 0.001** 0.000 -0.000 0.001*** Group incent schem 0.001 -0.000 0.001** -0.000 0.000 0.001* 0.001 Employee share schem -0.001* 0.000 -0.001 -0.000 0.000 -0.001** -0.000 Profit sharing -0.001 -0.001** -0.001** -0.001** 0.000 -0.00*** -0.000 Sector6 Manufacturing 0.330** -0.073** 0.327** -0.17*** 0.134 0.128 -0.16*** Electricity -0.069 -0.076** -0.15*** 0.009 0.189 -0.106 Water & waste 0.233 -0.094*** 0.159 -0.18*** -0.009 0.119 -0.17*** Construction 0.286** -0.066 0.238* -0.25*** 0.183 0.117 -0.201** Wholesale / retail 0.317*** -0.078 0.298** -0.21*** 0.197* 0.159* -0.187** Transport and storage 0.190 -0.085*** 0.239 -0.19*** -0.029 -0.011 -0.18*** Accommodation 0.257** -0.095*** 0.211 -0.20*** 0.123 0.037 -0.18*** Information & comm 0.441*** -0.059 0.459*** -0.147** 0.354** 0.154 -0.145** Financial & insur 0.295** -0.085*** 0.340** -0.15*** 0.269* 0.189 -0.138** Real estate 0.426*** -0.092*** 0.337** -0.19*** 0.270* 0.033 -0.128 Professional, scient 0.383*** -0.069* 0.500*** -0.159** 0.295** 0.231* -0.152**
6 Nace rev. 2. Mining and quarrying represents the base case in all models.
21
Administrative 0.281** -0.056 0.377** -0.17*** 0.184 0.101 -0.18*** Education 0.552*** 0.025 0.498*** -0.104 0.319* 0.059 -0.131* Health & social 0.437*** -0.039 0.364** -0.16*** 0.340** 0.302** -0.130* Arts 0.433*** -0.058 0.432*** -0.17*** 0.218 0.080 -0.112 Other services 0.242* -0.093*** 0.477*** -0.19*** 0.298** -0.011 -0.106 Observations 4,926 4,926 4,926 4,926 4,918 4,926 4,926

22
Table 4: Determinants of organisational change
VARIABLES Temp workers PT workers Over time Manage Rotate Extern
Mean wage -0.021 -0.017 0.000 0.020 0.071* 0.010 Mean exper -0.001 -0.003** -0.001 -0.001 -0.003 -0.001 % Male -0.018 -0.047 0.016 -0.055** -0.024 -0.043 % Part-time 0.032 0.111*** 0.007 -0.008 0.001 -0.051* % basic education -0.050 -0.054 -0.003 -0.15*** -0.086 0.012 % Secondary educatio -0.007 0.052 0.017 -0.063 -0.004 0.035 % Post-secondary -0.023 -0.071 -0.001 -0.13*** -0.054 0.021 % Sub-degree -0.063 0.027 -0.003 -0.023 -0.001 0.058 % Third-level -0.021 -0.053 0.027 -0.058 -0.177 -0.005 % Shift-workers 0.022 0.068 0.018 0.082** 0.204*** -0.005 % Professional body -0.005 0.038 0.007 0.027 -0.028 -0.021 Firm size 0.019* 0.033** 0.004 0.052*** 0.055** 0.011 TU density 0.000 -0.000 0.000 -0.000 -0.001 0.000 Collective bargaining -0.001 -0.010 -0.008 0.002 -0.078 -0.027 Consult on change 0.002 -0.006 0.011* 0.027** 0.065** 0.018 Worker suggestions 0.024 0.039 0.009 0.035* 0.057 0.045** HRM share 0.000 -0.041 -0.000 0.000 -0.026 -0.000 % Migant -0.039* -0.090** 0.010 -0.025 0.088 -0.028 Resistance Terms Resist workload 0.752 0.995*** -0.061 0.998*** 0.952*** 0.903* Resist technology -0.267 0.957*** -0.014 0.769 -0.573** 0.988*** Resist supervision 0.997*** 0.924*** -0.058 0.717 -0.585** 0.051 Resist skills 0.211 -0.361* 0.540 -0.550** -0.535** 0.158 Resist unsociable -0.151 -0.387 -0.248 -0.132 0.826*** -0.721*** Resist authority -0.095 -0.343** 0.022 -0.395* -0.475** -0.270* Resist terms -0.159 -0.061 1.000*** 0.541 0.972*** 0.460 λ Workload -0.204 -0.955* 0.069 -0.495 -1.296 -0.291 λ Technology 0.556* -0.645 0.006 -0.196 1.107 -0.640 λSupervision -0.441* -0.463 0.064 -0.203 0.677 -0.033 λSkills -0.082 0.495 -0.094 0.604*** 0.579 -0.074 λUnsociable 0.210 0.572 0.247 0.162 -0.711 0.946*** λAuthority 0.133 0.581* -0.015 0.594** 0.526 0.452* λTerms 0.215 0.040 -0.270** -0.153 -1.640*** -0.165 Sector Manufacturing 0.057 -0.051 0.540* -0.042 -0.196 0.485** Water & waste 0.093 -0.086 0.296 -0.037 -0.275** 0.425** Construction 0.041 -0.067 0.301 -0.070 -0.294** 0.366** Wholesale / retail 0.095 -0.096 0.306 -0.029 -0.259*** 0.339 Transport and storage 0.081 -0.056 0.298 -0.074*** -0.317*** 0.225 Accommodation 0.013 -0.101* 0.568* -0.061*** -0.280*** 0.755*** Information & comm -0.010 -0.099** 0.539* -0.061*** -0.272*** 0.548** Financial & insurance 0.200 -0.001 0.546 -0.034 -0.213* 0.411
23
Real estate -0.015 -0.072 0.482 -0.056 -0.276** 0.510* Professional, scientific 0.137 -0.057 0.467 -0.047 -0.170 0.409* Administrative -0.032 -0.134*** 0.368 -0.061*** -0.334*** 0.043 Education 0.014 -0.103** 0.633** -0.061*** -0.301*** 0.041 Health & social 0.097 -0.040 0.590** -0.066*** -0.295*** 0.362 Arts 0.073 -0.051 0.312 -0.062*** -0.264*** 0.362 Other services 0.076 -0.008 0.425 -0.065*** -0.264*** 0.498*
Observations 4,918 4,918 4,918 4,918 4,918 4,918
*** p<0.01, ** p<0.05, * p<0.1

24
Data Appendix
Variable name Description
Mean wage average gross weekly wage paid to employees in firm Mean exper average years sppent in employment by employees of firm % Male % share of employees in firm who are male % Part-time % share of employees in firm who are part-time % basic education % share of employees in firm who have a primary level education % Secondary education % share of employees in firm who have a secondary level education % Post-secondary % share of employees in firm who have a post-secondary level education % Sub-degree % share of employees in firm who have a sub-tertiary level education % Third-level % share of employees in firm who have a third level education % Shift-workers % share of employees in firm who are shift workers % Professional % share of employees in firm who belong to professional bodies Firm size number of employees in firm TU density % share of employees in firm who belong to a trade-union Collective bargaining Binary variable indicating that firm has a collection agreement with trade-unions Consult on change Binary variable indicating that firm has a sytem in place for consulting with employees Worker suggestions Binary variable indicating that firm has a employee suggestion scheme HRM share % share of employees in firm who work in HR Manage develop Binary variable indicating that firm has a system for developing management competency Team perform man Binary variable indicating that firm has a system of team-based performance management Indiv develop Binary variable indicating that firm has a system of individual performance management % Migrants % share of employees in firm who are immigrants Grievance policy Binary variable indicating that firm has a clearly specified grievance policy Health policy Binary variable indicating that firm has a clearly specified health policy Equality policy Binary variable indicating that firm has a clearly specified equality policy Bullying polcy Binary variable indicating that firm has a clearly specified bullying policy Indiv incent scheme % share of employees who participate in individual incentive schemes Group incent scheme % share of employees who participate in group incentive schemes Employee share scheme % share of employees who participate in share schemes Profit sharing % share of employees who participate in profit sharing schemes
Workforce resistance Resist workload Binary variable: firm is in highest quartile for workforce resistance to increased workload
Resist technology Binary variable: firm is in highest quartile for workforce resistance to increased technology Resist supervision Binary variable: firm is in highest quartile for workforce resistance to increased supervision Resist skills Binary variable: firm is in highest quartile for workforce resistance to increased skills Resist unsociable Binary variable: firm is in highest quartile for workforce resistance to unsociable hours Resist authority Binary variable: firm is in highest quartile for workforce resistance to increased autonomy Resist terms Binary variable: that firm is in highest quartile for workforce resistance to changes in terms λ Workload continuous variable, mills ratio from resistance to increased workload equation λ Technology continuous variable, mills ratio from resistance to increased technology equation Λ Supervision continuous variable, mills ratio from resistance to increased supervision equation Λ Skills continuous variable, mills ratio from resistance to increased skills equation

25
Λ Unsociable continuous variable, mills ratio from resistance to unsociable hours equation Λ Authority continuous variable, mills ratio from resistance to increased autonomy equation Λ Terms continuous variable, mills ratio from resistance to changes in terms and conditions equation
Organisational change Temp workers Binary variable indicating that firm increased its reliance on temporary workers
PT workers Binary variable indicating that firm increased its reliance on part-time workers Over time Binary variable indicating that firm increased its reliance on overtime Manage Binary variable indicating that firm reduced management numbers Rotate Binary variable indicating that firm increased its reliance on job rotation / multitasking Extern Binary variable indicating that firm increased its reliance on external suppliers