Embed Size (px)
Citation preview
Examining the Skills Gap in
Wisconsin
Prepared for the Wisconsin Legislative Council
By Megan Loritz
Ben Nerad Phil Sletten
Jennifer Cunha
Workshop in Public Affairs Spring 2013
©2013 Board of Regents of the University of Wisconsin System
All rights reserved.
For additional copies: Publications Office
La Follette School of Public Affairs 1225 Observatory Drive, Madison, WI 53706
www.lafollette.wisc.edu/publications/workshops.html [email protected]
The Robert M. La Follette School of Public Affairs is a teaching and research department
of the University of Wisconsin–Madison. The school takes no stand on policy issues; opinions expressed in these pages reflect the views of the authors.
The University of Wisconsin-Madison is an equal opportunity and affirmative-action educator and employer.
We promote excellence through diversity in all programs.
Table of Contents List of Figures ....................................................................................................... vii
List of Tables ........................................................................................................ vii
Foreword ................................................................................................................ ix
Acknowledgments.................................................................................................. xi
Executive Summary ............................................................................................. xiii
I. Introduction ......................................................................................................... 1
II. Background ........................................................................................................ 1 A. Factors Causing High Unemployment in the United States and Wisconsin .. 1 B. Current Wisconsin Programs Related to Workforce Development ............... 3
i. Employment and Job Skills Programs .................................................... 3 ii. Education Programs ................................................................................ 4
C. Recent Policy Initiatives Relating to Workforce Development ..................... 6 D. Wisconsin’s Workforce and Unemployment ................................................. 6 E. Wisconsin’s Industries ................................................................................... 7 F. Characteristics of the Unemployed in Wisconsin ........................................... 8
III. Statement of Problem ........................................................................................ 9
IV. Literature Review ............................................................................................. 9 A. Dominant Narratives Explaining the Skills Gap ............................................ 9 B. Examinations of the Skills Gap in Wisconsin .............................................. 10
Levine, 2013 ................................................................................................. 10 Competitive Wisconsin, 2012 ....................................................................... 11 Sullivan, 2012 ............................................................................................... 11 Skills2Compete-Wisconsin, 2009 ................................................................. 11
C. Examinations of the Skills Gap in the United States ................................... 12 Şahin, Song, Topa, and Violante, 2012 ........................................................ 12 Lazear and Spletzer, 2012 ............................................................................. 12 Elsby, Hobijn, Şahin, and Valletta, 2011 ...................................................... 13 Holzer, 2013 .................................................................................................. 13 Autor, 2010 ................................................................................................... 14
V. Analyzing the Skills Gap: Economic Indicators .............................................. 15 A. Unemployment Rates by Levels of Education ............................................. 15 B. Educational Attainment of Persons in Low-Skilled Jobs ............................. 16 C. Occupations with the Largest Projected Job Growth ................................... 17
VI. Analyzing the Skills Gap: Measuring Projected Supply and Demand ........... 19 A. Conceptualizing a Skills Gap with Economic Theory ................................. 19 B. Projection of Skill-Specific Labor Demand ................................................. 20 C. Projection of Skill-Specific Labor Supply ................................................... 21
VII. Analyzing the Skills Gap: Individual Occupations ....................................... 26 A. Registered Nurses ........................................................................................ 26 B. General and Operations Managers ............................................................... 27 C. Hairdressers, Hairstylists, and Cosmetologists ............................................ 28 D. Elementary School Teachers ........................................................................ 28 E. Middle and High School Teachers ............................................................... 29 F. Accountants and Auditors ............................................................................ 30 G. Nursing Aides, Orderlies, and Attendants ................................................... 31 H. Human Resources, Labor Relations, and Training Specialists .................... 32 I. Computer and Information Systems Workers ............................................... 32
VIII. Policy Options .............................................................................................. 33 A. Monitoring Projections of the Skills Gap .................................................... 33 B. Promote a High-Skill Economy ................................................................... 34 C. Easing the Transition to College and the Workforce ................................... 35
IX. Conclusion ...................................................................................................... 36
Appendix A: Wisconsin’s Total Employment by Industry ................................... 37
Appendix B: Percent Change in Employment by Industry ................................... 38
Appendix C: Supply Projection Methodology: Bachelor’s and Advanced Degrees ................................................................................................................. 39
A. Bachelor’s and Advanced Degree Projections ............................................. 39 B. Bachelor’s and Advanced Degree Workforce Adjustments ........................ 40 C. Key Assumptions ......................................................................................... 40
Appendix D: Supply Projection Methodology: Associate’s Degrees and Non-Degree Certificates ................................................................................................ 41
A. Associate’s Degree and Non-Degree Certificate Projections ...................... 41 B. Associate’s Degree and Non-Degree Certificate Workforce Adjustments .. 42 C. Key Assumptions ......................................................................................... 42
Appendix E: Supply Projection Methodology: Less Than High School, High School, and Some College Completion ............................................................... 44
A. Less Than High School Completion ............................................................ 44 B. High School Completion .............................................................................. 44 C. College Dropouts ......................................................................................... 45
Appendix F: Registered Nurses Projections ......................................................... 47
Appendix G: General and Operations Managers Projections ............................... 48
Appendix H: Hairdressers, Hairstylists, and Cosmetologists Projections ............ 49
Appendix I: Elementary School Teachers Projections ......................................... 50
Appendix J: Middle and High School Teachers Projections ................................ 51
Appendix K: Accountants and Auditors Projections ............................................ 53
Appendix L: Nursing Aides, Orderlies, and Attendants Projections .................... 54
Appendix M: Human Resources, Labor Relations, and Training Specialists Projections............................................................................................................. 55
Appendix N: Computer and Information Systems Workers Projections .............. 56
References ............................................................................................................. 57

vi
vii
List of Figures Figure 1: Unemployment Rate in Wisconsin and the U.S. ..................................... 7 Figure 2: Unemployment Rates in Wisconsin by Education Level in 2000,
2005, and 2011 .......................................................................................... 16
List of Tables Table 1: 2012 Workforce Development Programs ................................................. 4 Table 2: State Support for Public Education 2002-2012 ........................................ 5 Table 3: Wisconsin’s Four Largest Industry Sectors .............................................. 7 Table 4: Educational Attainment of Persons in Wisconsin in Jobs Requiring
Less than a High School Diploma, 2010 .................................................. 17 Table 5: Percent of Jobholders in Low-Skill Occupations Holding Bachelor’s
Degrees or More in Wisconsin, 2000-2010 .............................................. 17 Table 6: 20 Occupations With the Largest Projected Job Growth in
Wisconsin, 2010- 2020 ............................................................................. 18 Table 7: Wisconsin’s Projected Job Openings by Education Level, 2010-
2020........................................................................................................... 20 Table 8: Analysis of Total Additional Demand and Supply of Workers by
Skill Level in Wisconsin, 2012- 2020....................................................... 24 Table 9: Projected Skills Gap for Nurses .............................................................. 27 Table 10: Projected Skills Gap for General and Operations Managers ................ 27 Table 11: Projected Skills Gap for Hairdressers, Hairstylists, and
Cosmetologists .......................................................................................... 28 Table 12: Projected Skills Gap for Elementary School Teachers ......................... 29 Table 13: Projected Skills Gap for Middle and High School Teachers ................ 30 Table 14: Projected Skills Gap for Accountants and Auditors ............................. 31 Table 15: Projected Skills Gap for Nursing Aides, Orderlies, and Attendants ..... 31 Table 16: Projected Skills Gap for Human Resources, Labor Relations, and
Training Specialists ................................................................................... 32 Table 17: Projected Skills Gap for Computer and Information Systems
Workers ..................................................................................................... 33 Table A1: Wisconsin's Total Employment by Industry ........................................ 37 Table B1: Percent Change in Employment by Industry (2001-2010) .................. 38

viii

ix
Foreword This report is the result of collaboration between the Robert M. La Follette School of Public Affairs at the University of Wisconsin–Madison and the Wisconsin Legislative Council. Our objective is to provide graduate students at La Follette the opportunity to improve their policy analysis skills while contributing to the capacity of the local and Wisconsin state governments to provide public services to their residents.
The La Follette School offers a two-year graduate program leading to a master’s degree in public affairs. Students study policy analysis and public management, and they can choose to pursue a concentration in a policy focus area. They spend the first year and a half of the program taking courses in which they develop the expertise needed to analyze public policies.
The authors of this report are all in the last semester of their degree program and are enrolled in Public Affairs 869: Workshop in Public Affairs. Although acquiring a set of policy analysis skills is important, there is no substitute for doing policy analysis as a means of learning policy analysis. Public Affairs 869 gives graduate students that opportunity.
This year the students in the workshop were divided into six teams, four under the direction of my La Follette School colleague Professor Andrew Reschovsky; I supervised two of the projects, including this one.
This study concerns the discussion that Wisconsin faces a “skills gap”—that there is a mismatch in the supply of and demand for workers with various skill levels. Typically, the “skills gap” refers to a perceived shortage of skilled or educated workers.
The students who did this study—Megan Loritz, Ben Nerad, Phil Sletten, and Jennifer Cunha—review current trends in employment and workforce development programs in Wisconsin. They then review recent academic and other literature relating to the skills gap. After presenting general economic indicators that do not suggest the presence of a skills gap, they present the results of their analysis of skill-specific potential demand and supply in Wisconsin projected over 2012 to 2020. This analysis does not indicate an aggregate shortage of labor educated at the associate’s, bachelor’s, or master’s degree levels in Wisconsin. After studying supply and demand conditions for a few key “high demand” occupations, the authors conclude that only a few occupations may see a skills shortage in coming years. The report then discusses the policy options relevant to the labor market trends found in their analysis.
The Wisconsin Legislative Council suggested this topic, and the help and support of members of Council staff—especially, Scott Grosz, Rachel Letzing, and Anne Sappenfield—are acknowledged.
The report also benefited greatly from the support of the staff of the La Follette School. Cindy Manthe and Marjorie Matthews contributed logistic support; and
x
Karen Faster, the La Follette publications director, managed production of the final bound and online document.
By involving La Follette students in the tough issues confronting the public sector in Wisconsin, I hope they not only have learned a great deal about doing policy analysis but have gained an appreciation of the complexities and challenges facing public officials in Wisconsin and elsewhere. I also hope that this report will contribute to the development of a deeper understanding of the operation of the labor market in Wisconsin, and the possibility of imbalances in that market.
Robert Haveman John Bascom Emeritus Professor of Economics and Public Affairs
May 2013 Madison, Wisconsin
xi
Acknowledgments We would like to thank Professors Robert Haveman and Andrew Reschovsky for their counsel and encouragement throughout the development of this report. We are also grateful to Scott Grosz, Rachel Letzing, and Anne Sappenfield at the Wisconsin Legislative Council for their guidance. Finally, we would like to thank Karen Faster for her editorial support. Any errors or omissions are our own.

xii
xiii
Executive Summary This report reviews the issue of a possible “skills gap” in Wisconsin. The term refers to the phenomenon in which, even as unemployment remains high relative to recent history, some employers report difficulty finding workers with sufficient skills for available positions. This situation suggests that the supply of skilled workers in the state does not sufficiently meet the demand. To address this issue, we first review current trends in employment and workforce development programs in Wisconsin. Following this, we review recent academic and other literature relating to the skills gap. In general, we find that the academic literature is skeptical of a persistent skills gap nationally, and anecdotal evidence often provides the primary support for a substantial skills gap in Wisconsin. We next review general economic indicators that may suggest the presence of a skills gap. These indicators include employment projections, the unemployment rate, and educational attainment rates. The indicators reviewed indicate no conclusive evidence that there is an economy-wide skills gap. In our primary analysis, we present estimates of skill-specific potential demand and supply in Wisconsin for 2012 through 2020. The analysis focuses on the available labor at different levels of educational attainment, based on schooling completion patterns at Wisconsin institutions, compared to the expected number of openings for specific occupations projected by the Department of Workforce Development. This analysis indicates a shortage of labor in Wisconsin for projected job openings that do not require post-secondary formal education, an excess of associate’s, bachelor’s, and master’s degree holders for the projected job openings, and a relatively small shortage of doctoral and professional degree holders. We then consider a few key occupations that the Department of Workforce Development projects will be in particularly high demand from 2012 to 2020. We use a similar projection methodology in our primary analysis to project skills gaps, or lack thereof, for several occupations. We project skills gaps in occupations related to computer science and information systems, human resources and training, and potentially in middle and high school education. The report then reviews policy options that legislators could pursue to address the labor market trends found in our analysis. We offer suggestions for the Department of Workforce Development to measure future skills gaps, a commission to explore methods of creating more demand for workers holding bachelor’s degrees in the state, and programs to ease and inform students’ transitions from high school to college to the workforce.

xiv
1
I. Introduction Persistent high unemployment presents a challenge to state policymakers seeking to boost local economies. Yet in this time of high unemployment, state governments hear that local businesses are having difficulty finding skilled labor to fill particular jobs. In this report, we examine the likely magnitude of this phenomenon, colloquially dubbed “the skills gap,” in Wisconsin’s near future. The skills gap rose to prominence as a public policy problem when employers continued to report difficulty finding skilled workers even with high unemployment. Both national and state-level analysts studied the skills gap, especially as it related to manufacturing, in the years before the Great Recession of 2007 to 2009 (National Association of Manufacturers 2005; Minnesota Department of Employment and Economic Development 2007). However, the persistence of reports of skills gaps from businesses despite the high unemployment has put the issue onto the agenda of state policymakers. These reports suggest that there is a structural skills mismatch in the economy, and that state public policy changes may be required to speed the closing of the skills gap (Lazear and Spletzer 2012; Sullivan 2012). State policymakers have limited tools at their disposal to create sweeping, macroeconomic changes in the labor force. However, education policy changes may be key to closing any skills gap that exists. Lawmakers can craft policies for aspects of public higher education in the state. With some exceptions, many skills required by employers may be learned through formal education. We examine the projected education levels of new workforce entrants in aggregate and in specific fields to explore the skills gap. We consider education the best proxy for skill in the labor force, recognizing that state policymakers would likely have less influence over other factors contributing to skills in the labor force.
II. Background We review the economic climate of the nation and Wisconsin to explain the potential sources of a skills gap and the climate in which one may exist. We review several likely causes of elevated unemployment, current Wisconsin policy regarding workforce development, recent state policy initiatives that seek to close any skills gap, key characteristics of Wisconsin’s workforce and industries, and the characteristics of the unemployed in Wisconsin.
A. Factors Causing High Unemployment in the United States and Wisconsin The most recent recession was the longest period of economic downturn since before World War II. The United States economy officially entered a recession in
2
December 2007 and exited in June 2009 (Business Cycle Dating Committee 2010). However, the recovery since June 2009 remains sluggish, both in Wisconsin and nationwide. Between the pre-recession peak in 2007 and the workforce employment rate’s trough in 2009, the U.S. economy shed nearly nine million jobs (Schmitt and Jones 2012). Since that nadir, employment has recovered to a moderate extent. The U.S. unemployment rate fell from the October 2009 high of 10.0 percent to 7.6 percent in March 2013 (United States Bureau of Labor Statistics 2013a). In Wisconsin, the unemployment rate dropped from a June 2009 high of 9.2 percent to 7.1 percent in March 2013 (United States Bureau of Labor Statistics 2013b). However, the absolute number of people employed in Wisconsin remains lower than it was in 2002, when the state was home to approximately 300,000 fewer people (United States Census Bureau 2013b; Wisconsin Legislative Reference Bureau 2003). Including only those employed or seeking employment, Wisconsin’s total labor force currently has fewer participants than it did in 2006 (United States Bureau of Labor Statistics 2013b). This high unemployment may persist due to several factors. Here, we outline four possible factors—including the skills gap—that have been raised in recent policy discussions. First, aggregate demand in the economy remains low and is growing slowly. Gross product estimates provide a standard measure for the size of an economy. Real U.S. gross domestic product in late 2012 rose about $300 billion, or less than 2 percent, above its late 2007 peak. Real gross state product in Wisconsin was still lower in 2011 than it was in 2006 (United States Bureau of Economic Analysis 2013). Income levels are also important indicators for the health of the economy. Real personal income (excluding transfers) at the end of 2012 remained lower than peak personal income levels in early 2008 (United States Bureau of Economic Analysis 2013). Thus, aggregate demand remains a problem, and employers facing weak demand are unlikely to hire more workers. Second, persistent high unemployment may be due to the extensions of unemployment insurance funded by the federal government in response to the recession. With unemployment insurance extended up to 99 weeks, many individuals may not have sufficient incentive to seek work as quickly as they might have if the extensions were not enacted. Recent studies suggest that the extension of unemployment insurance benefits may have increased the unemployment rate between 0.4 and 1.8 percent during the height of the Great Recession. However, researchers suggest that these effects are likely temporary (Burtless 2012; Valetta 2013; Elsby et al. 2011). Third, the long-term unemployed may be facing discrimination from employers who prefer to have workers with recent work experience. Through 2010 and 2011, more than 40 percent of all unemployed U.S. workers had been without work for
3
longer than 27 weeks (Schmitt and Jones 2012). In 2013, the average length of unemployment was 38 weeks (Valetta 2013). This persistent unemployment suggests that employers may be discriminating against long-term unemployed workers due to their lack of recent employment experience (Schmitt and Jones 2012). Employers may not want to incur higher retraining costs for those who have not been working recently and may have allowed skills to lapse (Burtless 2012). According to a New York Times analysis, many employers specifically ask for currently or recently employed applicants (Burtless 2012). Although prospects may be improving for the long-term unemployed, rapid growth in employment, which could put the long-term unemployed back into the workforce, remains elusive (Valetta 2013). Fourth, unemployment may persist due to a mismatch between the skills available in the labor force and those demanded by employers. Job offerings may go unfilled because the supply of labor is not sufficiently skilled, even though openings are substantial in total numbers. This mismatch may be due to education, training, slow changes in (or “sticky”) wages, or geographic separation between the skilled labor and the job openings. For example, employers may be unable to offer higher wages to entice employees due to contractual agreements or other limitations. Additionally, individual financial constraints may prevent workers from relocating quickly (Şahin et al. 2012). Our report focuses on the likelihood and magnitude of this cause, specifically considering the skills-based mismatches.
B. Current Wisconsin Programs Related to Workforce Development Wisconsin’s workforce development programs fall into two categories. First, there are programs directly tied to fostering employment or the skills required for employment. These are administered by state agencies such as the Department of Children and Families (DCF) and the Department of Workforce Development (DWD) or by local workforce training organizations. Second, there are numerous institutions that provide high school, technical college, two- or four-year college, and post-baccalaureate university degrees. Employment-focused programs tend to serve lower-skilled workers, while Wisconsin’s universities and colleges train higher-skilled workers. i. Employment and Job Skills Programs The DCF administered the majority of workforce development funds tied to employment and job skills in state fiscal year 2012. The largest program operated by the DCF is the Wisconsin Works (W-2) program, which receives funding from the federal Temporary Assistance for Needy Families program. W-2 provides skills training and financial assistance for families with minor children who live below 115 percent of the federal poverty line (Wisconsin Department of Children and Families n.d.). Participants receive casework services aimed at career planning and job placement and, in some cases, can receive direct cash assistance (Public Policy Forum 2012). Non-profit
4
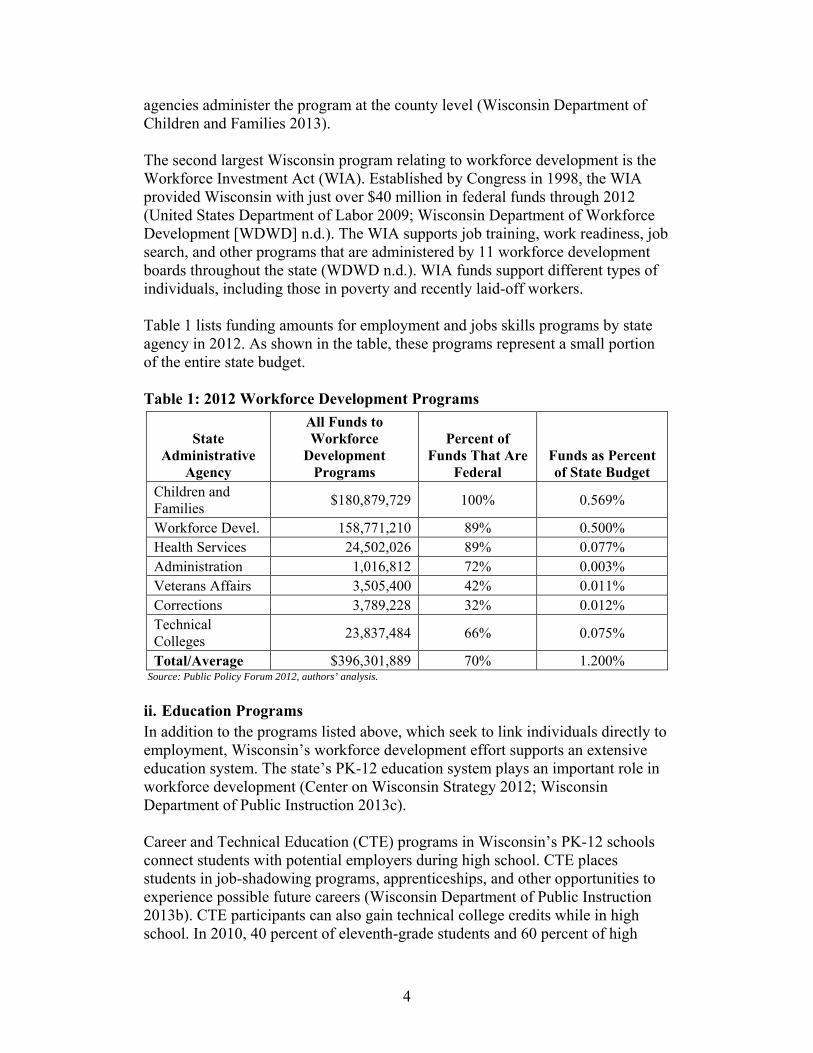
agencies administer the program at the county level (Wisconsin Department of Children and Families 2013). The second largest Wisconsin program relating to workforce development is the Workforce Investment Act (WIA). Established by Congress in 1998, the WIA provided Wisconsin with just over $40 million in federal funds through 2012 (United States Department of Labor 2009; Wisconsin Department of Workforce Development [WDWD] n.d.). The WIA supports job training, work readiness, job search, and other programs that are administered by 11 workforce development boards throughout the state (WDWD n.d.). WIA funds support different types of individuals, including those in poverty and recently laid-off workers. Table 1 lists funding amounts for employment and jobs skills programs by state agency in 2012. As shown in the table, these programs represent a small portion of the entire state budget. Table 1: 2012 Workforce Development Programs
State Administrative
Agency
All Funds to Workforce
Development Programs
Percent of Funds That Are
Federal Funds as Percent of State Budget
Children and Families
$180,879,729 100% 0.569%
Workforce Devel. 158,771,210 89% 0.500% Health Services 24,502,026 89% 0.077% Administration 1,016,812 72% 0.003% Veterans Affairs 3,505,400 42% 0.011% Corrections 3,789,228 32% 0.012% Technical Colleges
23,837,484 66% 0.075%
Total/Average $396,301,889 70% 1.200% Source: Public Policy Forum 2012, authors’ analysis.
ii. Education Programs In addition to the programs listed above, which seek to link individuals directly to employment, Wisconsin’s workforce development effort supports an extensive education system. The state’s PK-12 education system plays an important role in workforce development (Center on Wisconsin Strategy 2012; Wisconsin Department of Public Instruction 2013c). Career and Technical Education (CTE) programs in Wisconsin’s PK-12 schools connect students with potential employers during high school. CTE places students in job-shadowing programs, apprenticeships, and other opportunities to experience possible future careers (Wisconsin Department of Public Instruction 2013b). CTE participants can also gain technical college credits while in high school. In 2010, 40 percent of eleventh-grade students and 60 percent of high
5
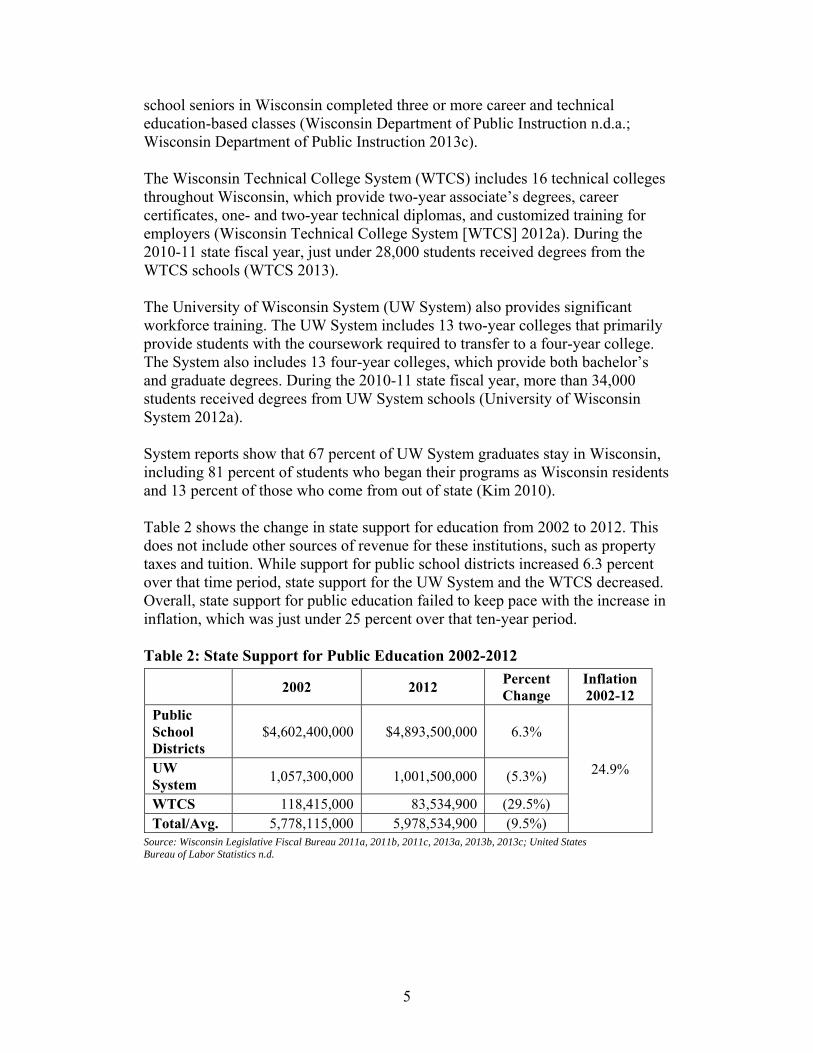
school seniors in Wisconsin completed three or more career and technical education-based classes (Wisconsin Department of Public Instruction n.d.a.; Wisconsin Department of Public Instruction 2013c). The Wisconsin Technical College System (WTCS) includes 16 technical colleges throughout Wisconsin, which provide two-year associate’s degrees, career certificates, one- and two-year technical diplomas, and customized training for employers (Wisconsin Technical College System [WTCS] 2012a). During the 2010-11 state fiscal year, just under 28,000 students received degrees from the WTCS schools (WTCS 2013). The University of Wisconsin System (UW System) also provides significant workforce training. The UW System includes 13 two-year colleges that primarily provide students with the coursework required to transfer to a four-year college. The System also includes 13 four-year colleges, which provide both bachelor’s and graduate degrees. During the 2010-11 state fiscal year, more than 34,000 students received degrees from UW System schools (University of Wisconsin System 2012a). System reports show that 67 percent of UW System graduates stay in Wisconsin, including 81 percent of students who began their programs as Wisconsin residents and 13 percent of those who come from out of state (Kim 2010). Table 2 shows the change in state support for education from 2002 to 2012. This does not include other sources of revenue for these institutions, such as property taxes and tuition. While support for public school districts increased 6.3 percent over that time period, state support for the UW System and the WTCS decreased. Overall, state support for public education failed to keep pace with the increase in inflation, which was just under 25 percent over that ten-year period. Table 2: State Support for Public Education 2002-2012
2002 2012
Percent Change
Inflation 2002-12
Public School Districts
$4,602,400,000 $4,893,500,000 6.3%
24.9% UW System
1,057,300,000 1,001,500,000 (5.3%)
WTCS 118,415,000 83,534,900 (29.5%) Total/Avg. 5,778,115,000 5,978,534,900 (9.5%)
Source: Wisconsin Legislative Fiscal Bureau 2011a, 2011b, 2011c, 2013a, 2013b, 2013c; United States Bureau of Labor Statistics n.d.
6
C. Recent Policy Initiatives Relating to Workforce Development Recent reports and newspaper articles indicate that Wisconsin employers and policymakers are increasingly focused on the issue of a skills mismatch (Competitive Wisconsin 2012; Sullivan 2012; Zervakis 2013). In response to this attention, administrative agencies and policymakers have proposed initiatives to address workforce development. In February 2013, Wisconsin Governor Scott Walker introduced his 2013-15 biennial budget proposal, which contained a number of provisions related to workforce development (Wisconsin State Legislature 2013b). For example, the WTCS receives additional funding that will be distributed based on two key performance measures: the provision of educational programs and the placement of students in high-demand fields. The budget bill also proposes to give the WTCS added discretion over funds already provided in order to establish additional training programs in high-demand areas. Also included in the Governor’s budget proposal is new state and federal funding that provides employment assistance and job training to individuals receiving FoodShare nutritional funds (Wisconsin Department of Administration 2013). In March 2013, Governor Walker signed legislation that provides state funds for grants to private and public organizations in order to provide workforce training for both new and existing employees of Wisconsin businesses (Wisconsin State Legislature 2013a). The legislature appropriated a total of $15 million in fiscal years 2013-15 for the grants, along with $5 million to create new administrative positions to oversee the administration of the grants (Wisconsin State Legislature 2013a). The legislation also requires the DWD to create a Labor Market Information System, which will track job vacancies, link the unemployed to these vacancies, and provide information on labor market demand to key individuals, such as high school counselors, for the purposes of informing students’ employment decisions (Wisconsin Legislative Council 2013; WDWD 2013).
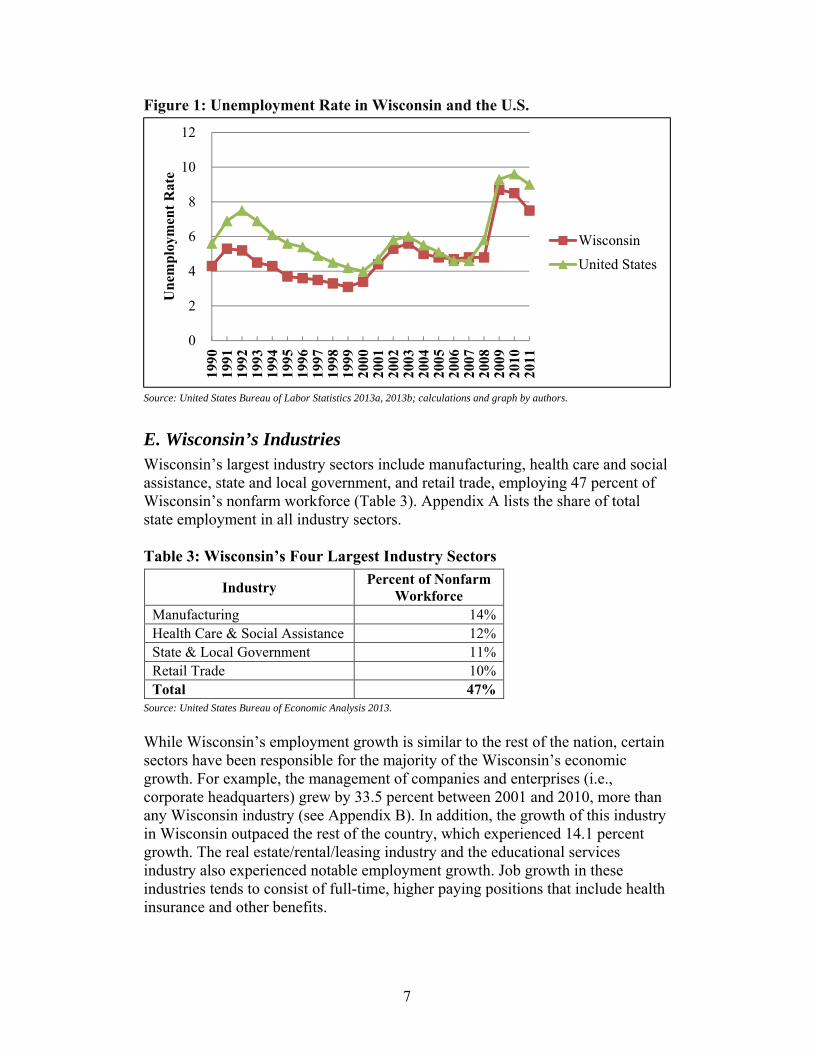
D. Wisconsin’s Workforce and Unemployment For most of the last 20 years, Wisconsin’s unemployment rate has varied from the rest of the nation. From 1990 through 2000, Wisconsin’s unemployment rate was significantly lower than the national rate. However, between 2001 through 2008, Wisconsin’s unemployment rate converged with the national rate. Since 2010, Wisconsin’s unemployment rate has decreased faster than the United States as a whole (Figure 1) (United States Bureau of Labor Statistics 2013a, 2013b).
7
Figure 1: Unemployment Rate in Wisconsin and the U.S.
Source: United States Bureau of Labor Statistics 2013a, 2013b; calculations and graph by authors.
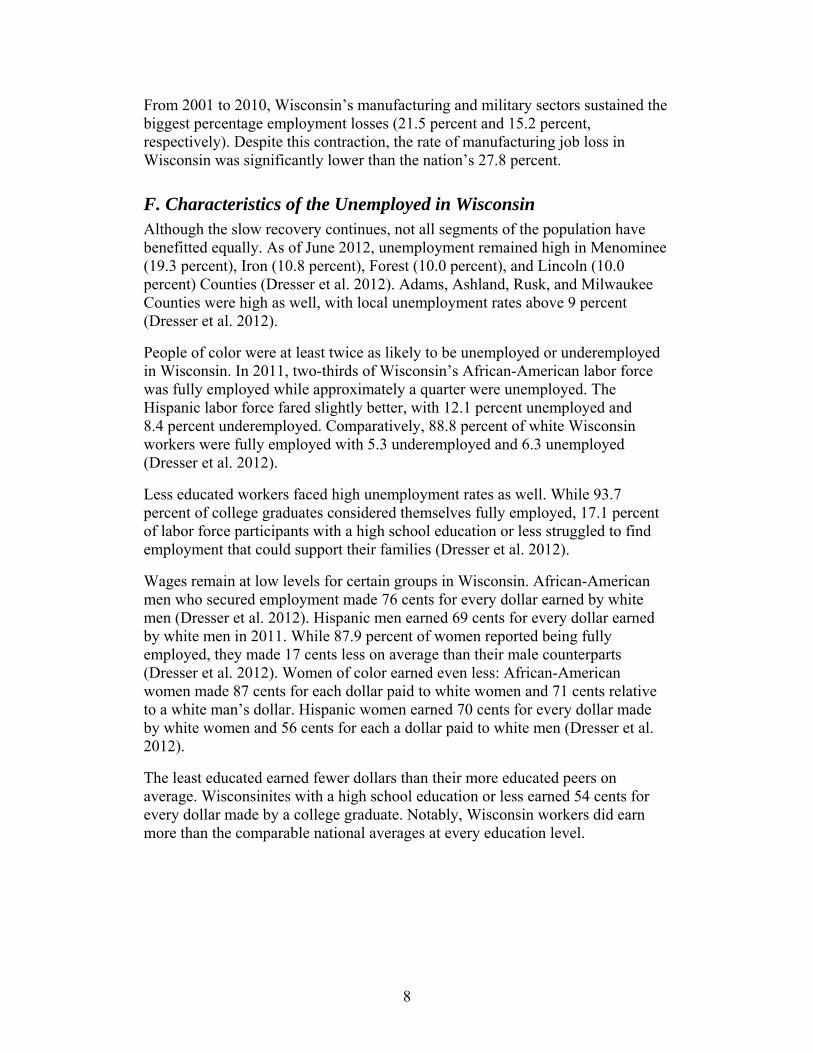
E. Wisconsin’s Industries Wisconsin’s largest industry sectors include manufacturing, health care and social assistance, state and local government, and retail trade, employing 47 percent of Wisconsin’s nonfarm workforce (Table 3). Appendix A lists the share of total state employment in all industry sectors. Table 3: Wisconsin’s Four Largest Industry Sectors
Industry Percent of Nonfarm Workforce
Manufacturing 14%Health Care & Social Assistance 12%State & Local Government 11%Retail Trade 10%Total 47%
Source: United States Bureau of Economic Analysis 2013.
While Wisconsin’s employment growth is similar to the rest of the nation, certain sectors have been responsible for the majority of the Wisconsin’s economic growth. For example, the management of companies and enterprises (i.e., corporate headquarters) grew by 33.5 percent between 2001 and 2010, more than any Wisconsin industry (see Appendix B). In addition, the growth of this industry in Wisconsin outpaced the rest of the country, which experienced 14.1 percent growth. The real estate/rental/leasing industry and the educational services industry also experienced notable employment growth. Job growth in these industries tends to consist of full-time, higher paying positions that include health insurance and other benefits.
0
2
4
6
8
10
12
1990
1991
1992
1993
1994
1995
1996
1997
1998
1999
2000
2001
2002
2003
2004
2005
2006
2007
2008
2009
2010
2011
Un
emp
loym
ent
Rat
e
Wisconsin
United States
8
From 2001 to 2010, Wisconsin’s manufacturing and military sectors sustained the biggest percentage employment losses (21.5 percent and 15.2 percent, respectively). Despite this contraction, the rate of manufacturing job loss in Wisconsin was significantly lower than the nation’s 27.8 percent.
F. Characteristics of the Unemployed in Wisconsin Although the slow recovery continues, not all segments of the population have benefitted equally. As of June 2012, unemployment remained high in Menominee (19.3 percent), Iron (10.8 percent), Forest (10.0 percent), and Lincoln (10.0 percent) Counties (Dresser et al. 2012). Adams, Ashland, Rusk, and Milwaukee Counties were high as well, with local unemployment rates above 9 percent (Dresser et al. 2012).
People of color were at least twice as likely to be unemployed or underemployed in Wisconsin. In 2011, two-thirds of Wisconsin’s African-American labor force was fully employed while approximately a quarter were unemployed. The Hispanic labor force fared slightly better, with 12.1 percent unemployed and 8.4 percent underemployed. Comparatively, 88.8 percent of white Wisconsin workers were fully employed with 5.3 underemployed and 6.3 unemployed (Dresser et al. 2012).
Less educated workers faced high unemployment rates as well. While 93.7 percent of college graduates considered themselves fully employed, 17.1 percent of labor force participants with a high school education or less struggled to find employment that could support their families (Dresser et al. 2012).
Wages remain at low levels for certain groups in Wisconsin. African-American men who secured employment made 76 cents for every dollar earned by white men (Dresser et al. 2012). Hispanic men earned 69 cents for every dollar earned by white men in 2011. While 87.9 percent of women reported being fully employed, they made 17 cents less on average than their male counterparts (Dresser et al. 2012). Women of color earned even less: African-American women made 87 cents for each dollar paid to white women and 71 cents relative to a white man’s dollar. Hispanic women earned 70 cents for every dollar made by white women and 56 cents for each a dollar paid to white men (Dresser et al. 2012).
The least educated earned fewer dollars than their more educated peers on average. Wisconsinites with a high school education or less earned 54 cents for every dollar made by a college graduate. Notably, Wisconsin workers did earn more than the comparable national averages at every education level.
9
III. Statement of Problem In this report, we explore the possibility of a skills gap in Wisconsin for the Wisconsin Legislative Council, a non-partisan research and information service for legislators. Specifically, we seek to determine the extent to which a mismatch between the human capital supplied by employees and the demands for labor made by hiring employers may exist in the future. We conclude by suggesting strategies for state policymakers to alleviate any unemployment in Wisconsin caused by a skills gap. The skills gap presents a potentially substantial problem, as Wisconsin may fail to recover as quickly as the rest of the country if the state suffers from high levels of structural unemployment. State policymakers may be able to efficiently alleviate some of the structural barriers in the economy and ease unemployment through policies specifically focused on any skills gap.
IV. Literature Review In this section, we summarize the most relevant Wisconsin and national studies regarding the skills gap to familiarize the reader with existing research. We indicate the common themes in the literature before reviewing specific key sources. We then discuss the methodologies and conclusions of these sources.
A. Dominant Narratives Explaining the Skills Gap The skills gap discussion presents challenges for those seeking to rigorously define and measure the extent to which this phenomenon exists. Often, anecdotal evidence dominates the analysis and commentary. Reports on the skills gap acknowledge at least one of three competing explanatory narratives. Two of these narratives provide theoretical support for the existence of a skills gap in some form. The third narrative offers an alternative explanation for the economic symptoms ascribed to the skills gap. The first of these narratives suggests that companies face a current shortage of appropriately trained workers. Potential employers in Wisconsin tell policymakers that despite the high unemployment, they cannot find qualified workers. Specifically, employers in manufacturing and the production industry have repeatedly reported trouble finding qualified workers in Wisconsin (Taschler 2012). Some of these employers have contended that schools and other industries may be supplying too few qualified employees (Sullivan 2012). The second narrative focuses on the wage levels offered by potential employers seeking workers, suggesting that the mismatch between supply and demand of labor skills may be corrected if companies offered higher wages associated with these unfilled positions (Holzer 2013). This narrative suggests that the relatively
10
low wages offered by employers for existing openings provides evidence that job seekers will find alternative employment rather than remain in occupations with slow-growing or declining real wages (Autor 2010; Davidson 2012; Capelli 2012). Other analysts identify the continuing macroeconomic impacts of the recent recession as an alternative explanation for employer’s unfilled positions. These skills gap skeptics blame high unemployment on weak aggregate demand (Baker 2012). If demand for products and services is not sufficient to strain current organizational capacity, employers have little incentive to hire additional employees. Those employers willing to hire may be excessively selective, seeking solely job applicants who already possess specific skills the employer considers necessary for working at the particular firm. These employees would not require additional training expenditures, but may be in short supply in the labor force (Levine 2013; Capelli 2012). As these competing narratives demonstrate, analysts have not developed a definitive measure of the skills gap. We compiled a detailed literature review of both Wisconsin-based and national research, including various metrics of the skills gap used by researchers.
B. Examinations of the Skills Gap in Wisconsin A number of recent reports have considered the skills gap in Wisconsin specifically. This research yields a mixed set of conclusions. The resources below are organized chronologically, with the most recent listed first. In each summary in this review, we first discuss the methodology and then provide the conclusion. Levine, 2013 Professor Marc Levine of the University of Wisconsin-Milwaukee uses a variety of economic indicators to evaluate Wisconsin’s skills gap. Levine compares point-estimates for the number of current and projected job openings in the state, trends in wages by industry and hours worked by employees, and educational attainment of workers in low-skill occupations. He also reviews past studies of the skills gap to present evidence collected by other authors. Levine compares workforce indicators and applies economic theory to draw conclusions regarding the existence of the skills gap. He finds no evidence, either in his analysis of relevant economic data in the state or in his review of the national literature, that the skills gap exists. Levine concludes that Wisconsin is not facing a skills gap, but instead faces a lack of job opportunities for increasingly highly-educated workers. Of the three major reports on the Wisconsin skills gap released in 2012 and early 2013, Levine’s report makes the most comprehensive use of economic data. Levine supports the narrative that current labor market challenges primarily stem from a lack of demand. He also expresses skepticism about the Be Bold 2 and Sullivan reports (discussed below).
11
Competitive Wisconsin, 2012 The Be Bold 2 report, authored by the group called Competitive Wisconsin, reviews contemporary workforce development issues in Wisconsin. This report compares data on unemployment insurance claimants to the number of jobs available in Wisconsin and highlights global and statewide surveys of employers. The central component of Be Bold 2’s analysis is a “skills cluster” modeling of the present and future employment situation in Wisconsin focusing on five key sets of occupations. The analysis projects that, in 2021, Wisconsin will face shortages of workers with system and network software skills, accounting and financial analysis skills, nursing and health training, mechanical engineering skills, and metal manufacturing training. The report then provides recommendations to state policymakers. Competitive Wisconsin’s report does not provide enough information to replicate the analysis. Its report advances the narrative that a skills gap exists and needs to be addressed through state policy. Sullivan, 2012 Special Consultant to the Governor on Economic, Workforce and Education Development Tim Sullivan, a former business executive, prepared this report to examine the skills gap in Wisconsin. Sullivan compares statistics on low graduation rates, demographics, wage rates, and workforce development funding in Wisconsin, as well as similar national and global statistics. Sullivan concludes that Wisconsin faces a skills gap due to an aging population, fewer replacement workers, and inadequate educational attainment in the state. He then provides recommendations for state policymakers. Sullivan’s report supports the narrative that the skills gap exists and contends that it should be alleviated with state policy. Sullivan’s report does not attempt to numerically measure the skills gap. Skills2Compete-Wisconsin, 2009 This report projects a continuing demand for middle-skill jobs in Wisconsin. The organizations involved are all members of the advocacy group Skills2Compete, based locally and nationally. They define middle-skill jobs as those requiring “more than a high school diploma but less than a four-year college degree” (Skills2Compete-Wisconsin 2009). The report analyzes wage data, contemporary employment data, and occupation demand projections data to conclude that Wisconsin will likely face a skills gap in middle-skill jobs in the decade following the report’s publication. Skills2Compete-Wisconsin contends that a skills gap exists in middle-skill jobs and suggests that the gap will become more prevalent over the coming decade. The report’s analysis is partially based on an academic study, and while additional information would be required to replicate the analysis, the authors outline the methodology in some detail.
12
C. Examinations of the Skills Gap in the United States Other scholars and advocacy groups have examined the skills gap on a national level. Their work provides insights into the magnitude of the problem nationally and the degree to which state policy may be able to address the issue. The literature reviewed here is a sampling of the most highly respected recent studies. Şahin, Song, Topa, and Violante, 2012 These Federal Reserve Bank branch researchers explore the causes of mismatch unemployment, considering both geographic and skill mismatches. They use a database of employment opportunity advertisements listed online to evaluate demand for jobs both by geography and occupation. The researchers then apply these data to a theoretical framework that compares the allocation of workers distributed by a hypothetical central planner to the allocation observed in reality. They conclude that geographic mismatches are negligible and the “structural” skills mismatch accounted for a small portion of the increase in unemployment as part of the Great Recession. Specifically, they calculate that the increase in unemployment due to a skills mismatch likely contributed between 0.75 and 1.5 percentage points to the unemployment rate at its peak after the Great Recession. However, the authors note that this unemployment increase due to mismatch appears strongly cyclical and will likely not be a permanent feature of the labor market. These economists display their methodology extensively in this report. They had also written on the skills gap before and after completing this paper. Their use of both broad industry classifications and occupation classifications suggests a thorough analysis. Although the 0.75 to 1.5 percentage points added to the total rise unemployment between 2006 and October 2009 due to a skills mismatch appears high, language used by the authors suggests that 1.5 percent may be a ceiling, and their comparison to the perfect allocation of a central planner makes this range more understandable. These authors suggest that there was a skills gap during the height of the recession but do not comment on its persistence. Lazear and Spletzer, 2012 Edward Lazear and James Spletzer, from Stanford University and the U.S. Census Bureau, respectively, assess a skills mismatch using national data on job openings and turnover, unemployment data, and a database of job vacancies posted online. They develop a theoretical definition of the skills mismatch and build an index of its magnitude by industry. Based on this index and historical data, they conclude that the mismatch during the Great Recession is likely a temporary, cyclical phenomenon. According to the authors, trends suggest that the mismatches between employer demands and worker skills will likely decline when overall unemployment declines as quickly as mismatch frequency rose in the recession. Lazear and Spletzer have a relatively simple methodology and support it with a plausible theoretical framework that likely gives their index some indicative value
13
as to the size of a skills gap. They also run several regressions comparing sets of variables across different years. These researchers suggest that the skills gap component of structural unemployment is closing. Elsby, Hobijn, Şahin, and Valletta, 2011 The authors—three work for Federal Reserve Bank branches and the fourth is at the University of Edinburgh—focus on long-term and structural unemployment through a meta-analysis of other recent work. The authors also update some of their own work. The report analyzes several factors, including aggregate demand, that may be contributing to the high levels and persistence of unemployment. The authors consider research on the skills mismatch, the geographic mismatch, and the extension of unemployment insurance. Using data on the inflows and outflows of recipients in the unemployment insurance program, the authors conclude that high levels of long-term structural unemployment due to a mismatch are unlikely and that aggregate demand is the likely cause for high unemployment. The researchers also review a range of existing literature estimates to determine the effects of any skills gap. From existing research, they conclude that the skills gap has likely contributed to a 1 percentage point increase in the unemployment rate. The authors find the effects of the geographic mismatch to be negligible and that the extension of emergency unemployment benefits has added 1 percentage point or less to the unemployment rate. These authors have contributed significantly to structural unemployment literature in recent years. This update of their work and the accompanying literature review likely provide key insights into the conventional wisdom in this subfield. However, their estimate of a 1 percentage point increase in unemployment due to the skills gap at the Great Recession’s peak is somewhat questionable. The authors looked at different studies and found a range of estimates from a 0.25 percentage point increase to a 1.75 percentage point increase in unemployment due to a skills mismatch. Their estimated 1 percent increase is exactly in the middle of that range, but they do not discuss how they reached that aggregate number. Regardless of the magnitude, the authors believe that a skills mismatch will likely be rendered negligible as the economy improves. Holzer, 2013 Professor Harry Holzer of Georgetown University reviews recent literature and applies new interpretations to data and arguments already provided by academic and advocacy organizations. He defines middle-skill jobs as those requiring some postsecondary education but not a full bachelor’s degree. He uses trends in shares of total employment by occupation to decipher the most meaningful definitions of a middle-skill job. He contends that the economy will likely generate strong demand for high-skill and middle-skill jobs as he defines them and that U.S. institutions have had trouble keeping the supply of middle-skill workers high
14
enough to meet demand. He recommends supplying more information to students about workforce training and stronger links between educational institutions and employers. Holzer is one of the more prolific authors in the field of labor force economics. Although his work is not as technical as many of the Federal Reserve Bank economists also studying this subfield, he is frequently cited by other authors considering this topic. This article is the most recent of several that he has produced on this topic. Holzer’s focus on middle-skill jobs has been publicly in opposition with the assessment of David Autor, who believes the economy is shedding middle-skill, middle-wage jobs in favor of high-skill and low-skill jobs (discussed below). Much of their disagreement appears to be over the definition of a middle-skill job. Autor, 2010 Professor David Autor of the Massachusetts Institute of Technology considers the growth and decline in employment by category of jobs. He broadly defines the categories as high-, middle-, and low-skill jobs, determined by the level of sophistication and prevalence of non-routine required tasks. Specifically, he defines middle-skill jobs as sales, office or administrative, production, and operation jobs. He also considers education levels, age, and gender in his analysis, and includes some regression analysis. Autor finds that the demand for highly educated workers to fill high-skill job vacancies will likely rise, but a lagging supply of these workers may generate higher levels of income inequality. He also notes that demand for middle-skill jobs, as he defines them, will likely decline. From this, he concludes that workers who leave school before obtaining some post-secondary education will likely not have as many opportunities as those of previous generations. Autor has written a substantial amount on this subject and the “hollowing out” of the U.S. labor market. Specifically, he focuses on the growth in demand for high- and low-skill jobs while the middle has been increasingly replaced by technology and overseas competition. Autor’s work is not as statistically rigorous as those papers of the Federal Reserve Bank economists, but his writing on this issue has appeared in several types of publications. He has public disagreements with Holzer over the trends that the U.S. labor market is experiencing, since Holzer believes that middle-skill jobs will become more important. Autor’s definitions of high-, middle-, and low-skill jobs are very broad, as are Holzer’s.
15
V. Analyzing the Skills Gap: Economic Indicators In this section, we use several economic indicators to analyze whether or not a skills gap exists in Wisconsin’s labor force. Economic indicators are typically used by economists to analyze the economy’s performance and makes predictions of future performance. We then discuss the top 20 occupations with the largest projected job growth.
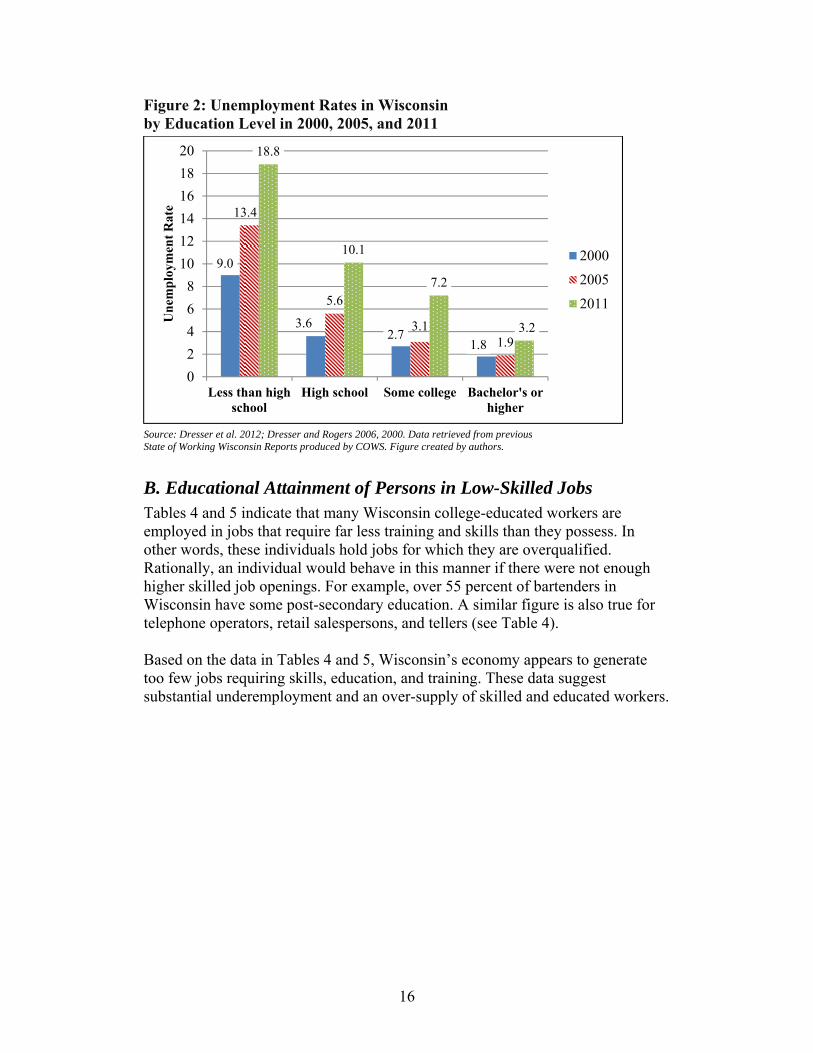
A. Unemployment Rates by Levels of Education Many Wisconsin businesses suggest that hiring remains slow in this economic recovery because they cannot find workers with the education and skills they need. An analysis of the data, however, shows little statistical evidence suggesting a shortage of educated workers in the current labor market. Figure 2 suggests a substantial job shortage relative to the pre-recession economy for all education levels. The unemployment rates for college graduates are illustrative. These are skilled workers who continue to have a difficult time finding a job. To avoid long-term unemployment, these more educated workers accept lower skilled jobs, changing employers’ perceptions of the “skills” necessary to perform the work and making it more difficult for less educated workers to find jobs (Rampell 2013). The result is an unemployment rate that increases as the education level is reduced. However, Wisconsin’s unemployment rate for college-educated, “skilled” workers persists at twice its pre-recession percentage. This higher percentage is more indicative of weaknesses in Wisconsin’s recovery than a lack of skilled workers. Overall unemployment in Wisconsin may be high because employers have not seen demand for their goods and services increase enough to justify making additional hires. This explanation suggests that Wisconsin’s unemployment rate remains high because of a lack of need for workers, rather than a mismatch between the skills needed by employers and those supplied by the labor force.
16
Figure 2: Unemployment Rates in Wisconsin by Education Level in 2000, 2005, and 2011
Source: Dresser et al. 2012; Dresser and Rogers 2006, 2000. Data retrieved from previous State of Working Wisconsin Reports produced by COWS. Figure created by authors.
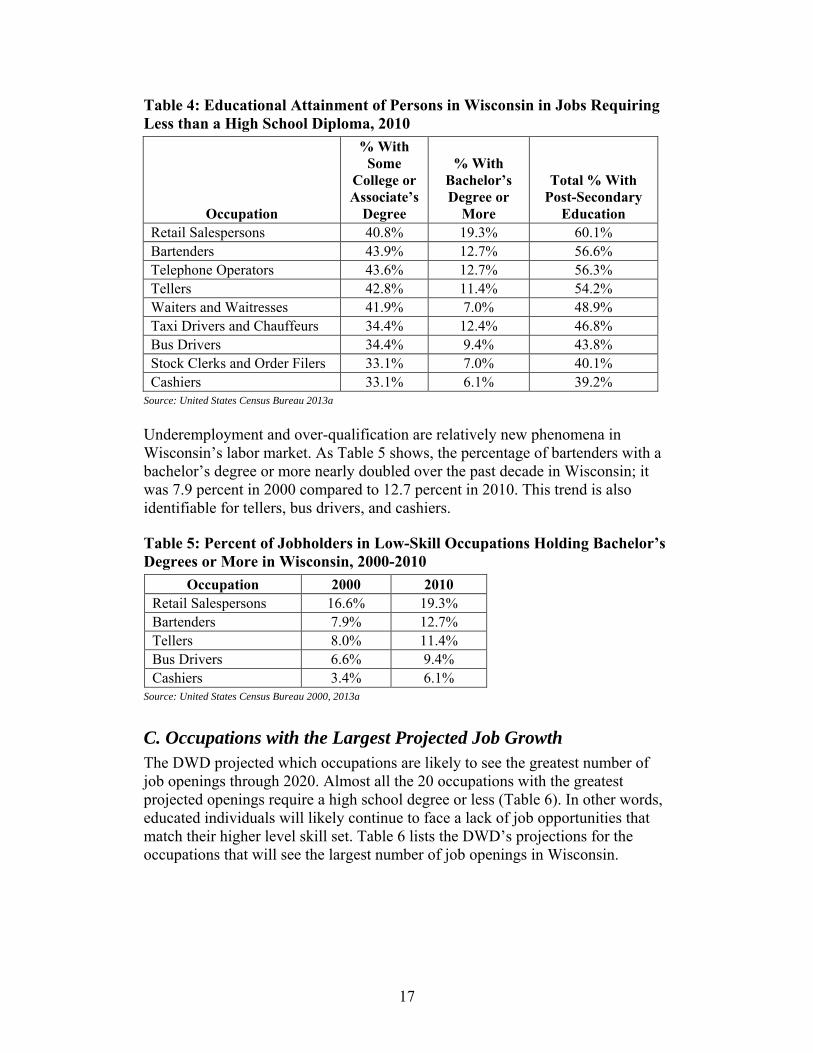
B. Educational Attainment of Persons in Low-Skilled Jobs Tables 4 and 5 indicate that many Wisconsin college-educated workers are employed in jobs that require far less training and skills than they possess. In other words, these individuals hold jobs for which they are overqualified. Rationally, an individual would behave in this manner if there were not enough higher skilled job openings. For example, over 55 percent of bartenders in Wisconsin have some post-secondary education. A similar figure is also true for telephone operators, retail salespersons, and tellers (see Table 4). Based on the data in Tables 4 and 5, Wisconsin’s economy appears to generate too few jobs requiring skills, education, and training. These data suggest substantial underemployment and an over-supply of skilled and educated workers.
9.0
3.62.7
1.8
13.4
5.6
3.11.9
18.8
10.1
7.2
3.2
0
2
4
6
8
10
12
14
16
18
20
Less than highschool
High school Some college Bachelor's orhigher
Un
emp
loym
ent
Rat
e
2000
2005
2011
17
Table 4: Educational Attainment of Persons in Wisconsin in Jobs Requiring Less than a High School Diploma, 2010
Occupation
% With Some
College or Associate’s
Degree
% With Bachelor’s Degree or
More
Total % With Post-Secondary
Education Retail Salespersons 40.8% 19.3% 60.1% Bartenders 43.9% 12.7% 56.6% Telephone Operators 43.6% 12.7% 56.3% Tellers 42.8% 11.4% 54.2% Waiters and Waitresses 41.9% 7.0% 48.9% Taxi Drivers and Chauffeurs 34.4% 12.4% 46.8% Bus Drivers 34.4% 9.4% 43.8% Stock Clerks and Order Filers 33.1% 7.0% 40.1% Cashiers 33.1% 6.1% 39.2%
Source: United States Census Bureau 2013a
Underemployment and over-qualification are relatively new phenomena in Wisconsin’s labor market. As Table 5 shows, the percentage of bartenders with a bachelor’s degree or more nearly doubled over the past decade in Wisconsin; it was 7.9 percent in 2000 compared to 12.7 percent in 2010. This trend is also identifiable for tellers, bus drivers, and cashiers. Table 5: Percent of Jobholders in Low-Skill Occupations Holding Bachelor’s Degrees or More in Wisconsin, 2000-2010
Occupation 2000 2010Retail Salespersons 16.6% 19.3%Bartenders 7.9% 12.7%Tellers 8.0% 11.4%Bus Drivers 6.6% 9.4%Cashiers 3.4% 6.1%
Source: United States Census Bureau 2000, 2013a
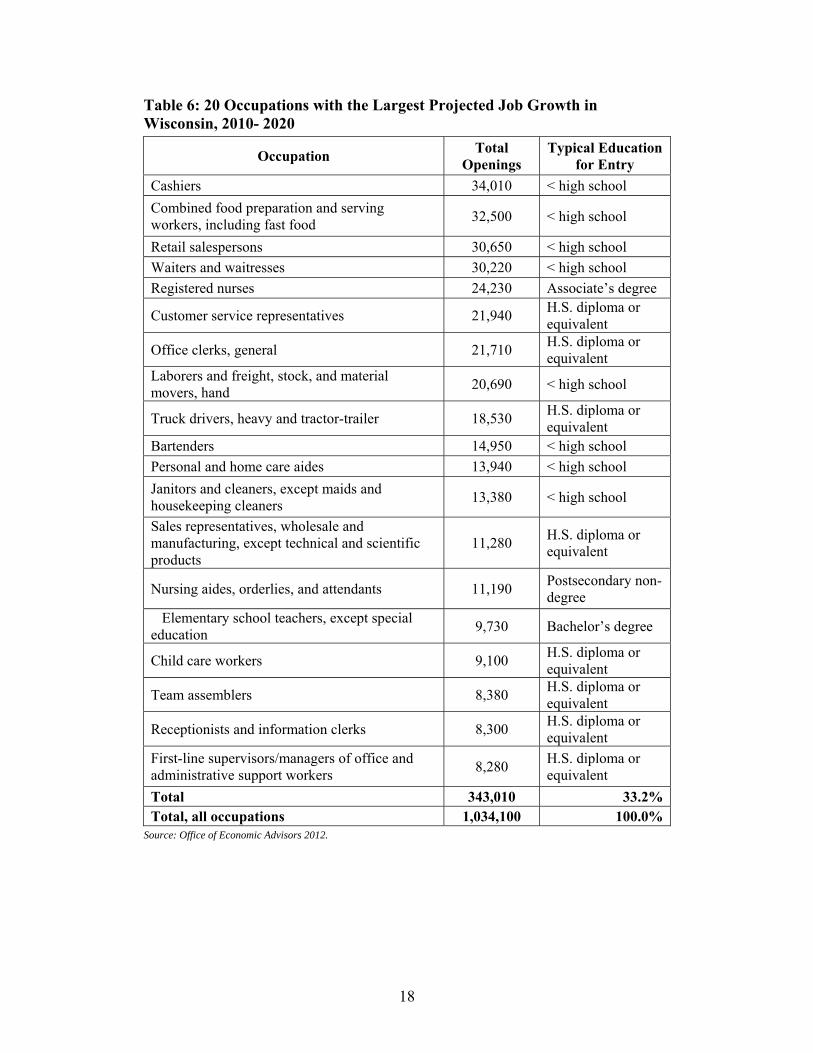
C. Occupations with the Largest Projected Job Growth The DWD projected which occupations are likely to see the greatest number of job openings through 2020. Almost all the 20 occupations with the greatest projected openings require a high school degree or less (Table 6). In other words, educated individuals will likely continue to face a lack of job opportunities that match their higher level skill set. Table 6 lists the DWD’s projections for the occupations that will see the largest number of job openings in Wisconsin.
18
Table 6: 20 Occupations with the Largest Projected Job Growth in Wisconsin, 2010- 2020
Occupation Total Openings
Typical Education for Entry
Cashiers 34,010 < high school
Combined food preparation and serving workers, including fast food 32,500 < high school
Retail salespersons 30,650 < high school Waiters and waitresses 30,220 < high school Registered nurses 24,230 Associate’s degree
Customer service representatives 21,940 H.S. diploma or equivalent
Office clerks, general 21,710 H.S. diploma or equivalent
Laborers and freight, stock, and material movers, hand 20,690 < high school
Truck drivers, heavy and tractor-trailer 18,530 H.S. diploma or equivalent
Bartenders 14,950 < high school Personal and home care aides 13,940 < high school
Janitors and cleaners, except maids and housekeeping cleaners 13,380 < high school
Sales representatives, wholesale and manufacturing, except technical and scientific products
11,280 H.S. diploma or equivalent
Nursing aides, orderlies, and attendants 11,190 Postsecondary non-degree
Elementary school teachers, except special education 9,730 Bachelor’s degree
Child care workers 9,100 H.S. diploma or equivalent
Team assemblers 8,380 H.S. diploma or equivalent
Receptionists and information clerks 8,300 H.S. diploma or equivalent
First-line supervisors/managers of office and administrative support workers 8,280 H.S. diploma or
equivalent Total 343,010 33.2%Total, all occupations 1,034,100 100.0%
Source: Office of Economic Advisors 2012.
19
VI. Analyzing the Skills Gap: Measuring Projected Supply and Demand The data that are currently available make it difficult to reliably determine whether there is a skills gap and, if one exists, accurately measure its magnitude. For this and other reasons, studies of the skills gap have reached substantially different conclusions as to whether a mismatch exists or its magnitude. In this section, we attempt to determine whether a skills gap might exist in Wisconsin’s near future. We examine both the supply and the demand for skilled labor in the state, using two primary data sets to explore this phenomenon.
Our approach compares the pattern of projected demand for workers of various levels of education attainment (skill) in Wisconsin with the pattern of projected supply of workers with these same educational attainment (skill) levels. The projection of skill demands rests on DWD projections of job openings between 2010 and 2020. Our projected supply of workers with various skills relies on data on new graduates of Wisconsin institutions of higher education, both public and private. Through this data, we examine trends in graduation volume at several educational attainment levels.
A. Conceptualizing a Skills Gap with Economic Theory To understand the effects of any skills gap on the economy, the market model provides a guide for conceptualizing the problems that a skills gap may create. A smoothly functioning market would not produce a skills gap. Our projection methods estimate the potential for skills gaps, given recent market trends and behavior. The labor market responds to differences in the demand for, and the supply of, skills in the labor force. The market should respond to these differences either immediately, with a lag, or through a secondary market. In a smoothly functioning market, wage rates adjust rapidly in response to any difference between demands and supplies of various skills. In this framework, a skills gap would represent a market failure, as the market is not adjusting to the mismatch between supply and demand. Thus, in a situation where the labor market is not smoothly functioning, wages may remain stagnant even though a skills gap exists. If a skills gap exists, then we cannot necessarily expect the market to correct it, and a policy intervention may help the market function more smoothly. Ideally, measurements of skills gaps would also gauge the willingness of employers to increase wage rates of those workers with skills in short supply and invest in training for new workers. In this case, under the assumption of a smoothly functioning market, relative patterns of skill-specific wage adjustments would indicate the extent and severity of the shortage. To our knowledge, no reliable data exist that indicate the extent to which employers are willing to pay to train new hires in Wisconsin. These data would provide us with key information
20
to evaluate the skills gap, as the willingness of employers to provide training may be a key indicator of the magnitude of any gap.
Other than basic wage and employment data, we also cannot predict the willingness of certain employees, with specific talents and skill levels, to accept employment at various compensation levels.
Finally, we are not able to measure the willingness of individuals to relocate for employment purposes. However, the literature suggests that geographic mismatch does not contribute substantially to unemployment. Appendices C, D, and E outline our assumptions in detail.
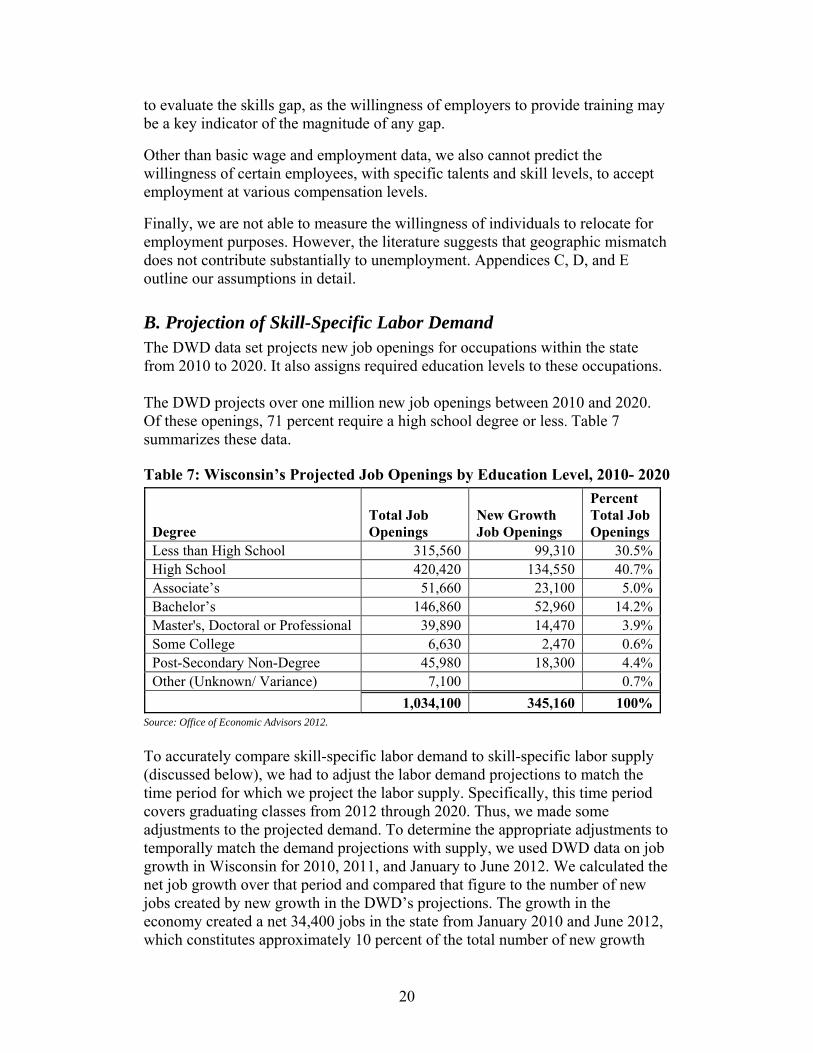
B. Projection of Skill-Specific Labor Demand The DWD data set projects new job openings for occupations within the state from 2010 to 2020. It also assigns required education levels to these occupations. The DWD projects over one million new job openings between 2010 and 2020. Of these openings, 71 percent require a high school degree or less. Table 7 summarizes these data. Table 7: Wisconsin’s Projected Job Openings by Education Level, 2010- 2020
Degree Total Job Openings
New Growth Job Openings
Percent Total Job Openings
Less than High School 315,560 99,310 30.5% High School 420,420 134,550 40.7% Associate’s 51,660 23,100 5.0% Bachelor’s 146,860 52,960 14.2% Master's, Doctoral or Professional 39,890 14,470 3.9% Some College 6,630 2,470 0.6% Post-Secondary Non-Degree 45,980 18,300 4.4% Other (Unknown/ Variance) 7,100 0.7% 1,034,100 345,160 100%
Source: Office of Economic Advisors 2012.
To accurately compare skill-specific labor demand to skill-specific labor supply (discussed below), we had to adjust the labor demand projections to match the time period for which we project the labor supply. Specifically, this time period covers graduating classes from 2012 through 2020. Thus, we made some adjustments to the projected demand. To determine the appropriate adjustments to temporally match the demand projections with supply, we used DWD data on job growth in Wisconsin for 2010, 2011, and January to June 2012. We calculated the net job growth over that period and compared that figure to the number of new jobs created by new growth in the DWD’s projections. The growth in the economy created a net 34,400 jobs in the state from January 2010 and June 2012, which constitutes approximately 10 percent of the total number of new growth
21
jobs projected by the DWD for 2010 to 2020. Therefore, we assumed that a 10 percent reduction in the total number of job openings projected between 2010 and 2020 yields the approximate number of job openings between June 2012 and 2020 (WDWD 2012a, 2012b, 2011, n.d.).
C. Projection of Skill-Specific Labor Supply Our projection of the skill-specific supply of potential workers is based on the historical trend in the pattern of such supplies. For postsecondary education, we used data from the Integrated Postsecondary Education Data System (IPEDS), an annual survey of postsecondary educational institutions nationwide conducted by the U.S. Department of Education’s National Center for Education Statistics (Institute for Education Sciences [IES] n.d.a). This dataset includes information on the number of new graduates from each institution in each year by degree type and focus field. To determine the number of high school diploma recipients, we used projections created by the Western Interstate Commission for Higher Education (University of Wisconsin System 2013). Using the IPEDS data, we projected the number of graduates by level of educational attainment using three primary projection methods. Our first projection used a simple ordinary least squares regression model of the existing dataset describing new potential labor market entrants between 2000 and 2011 by degree type (for example, associate’s, bachelor’s, or master’s). We then extrapolated this pattern to 2020. In our second projection, we averaged the annual percent change in the number of skill-specific potential labor market entrants for each year from 2000 to 2011. We then used this average as an annual percent increase to project the change in new potential labor market entrants of various skill levels for each year from 2012 to 2020. Third, we examined the data from 2000 to 2011 to determine which years might have seen an irregular pattern due to the Great Recession or the 2001 recession. We performed the regression and percentage change projections without those years in the dataset. Fourth, we pegged the projected percent changes in the number of new workforce entrants with bachelor’s degrees to the percent changes in the projected number of high school graduates. We included a four-year lag in this projection. This peg incorporates broader demographic changes into our projections for bachelor’s degrees, but was not completed for associate’s, master’s, doctoral or professional degrees, as those are assumed to be more independent of demographics than bachelor’s degree graduates. High school graduate projections were provided by the Western Interstate Commission for Higher Education. From these projection methods, we created two different sets of projections, accounting for some of the uncertainty in our projections. The “upper bound”
22
estimates used the projection methods that yielded larger numbers of graduates. The “lower bound” estimates were more cautious and assumed more dependence on broader demographic changes in the state. Additionally, our upper and lower bounds incorporated different labor force participation rates and in-state retention rates for graduates where applicable. To account for students leaving Wisconsin after they earn their degrees, we estimated the percent retention rate for associate’s degrees, bachelor’s degrees, and advanced degrees. We based these estimates on data from the public college and university systems. For more information and a list of assumptions, please see Appendices C, D, and E. The WTCS reports suggest that about 84 percent of its graduates find work in Wisconsin immediately after graduating, based on an average of 2008 to 2012 survey data of recent graduates (WTCS 2012b; WTCS 2011; WTCS 2010; WTCS 2009; WTCS 2008).1 Similar data are not publicly available for graduates of all private institutions. To account for this missing data, we adjusted our estimate of the percent of new potential labor market entrants remaining in Wisconsin downward to provide a conservative projection. However, 84 percent of all bachelor’s degrees, 65 percent of all master’s and doctoral degrees, and 10 percent of all associate’s degrees earned in Wisconsin between 2004 and 2011 were awarded by the UW System. Additionally, over 87 percent of all associate’s degrees and certificate-earning graduates were awarded by the WTCS (IES n.d.b). These high percentages suggest that small downward revisions adjusting for private colleges and universities in the model projections for bachelor’s, master’s, and doctoral graduates are appropriate. In particular, we reduced the percentages for the lower bound of bachelor’s, all master’s, and all doctoral degrees to 60 percent of their totals and retained the 84 percent rate for associate’s and certificate graduates. For more information, see Appendices C and D. Our estimate of skill-specific potential labor market entrants also sought to account for the propensity of new potential labor market entrants to, in fact, enter the labor market. According to a United States Bureau of Labor Statistics (BLS) report, the labor force participation rate for recent college graduates averaged 84.5 percent from 2007 to 2011. For recent advanced degree graduates, the labor force participation rate averaged 90.4 percent over the same time period (Spreen 2013). Although the recent recession market may be pushing this labor force participation rate lower than the corresponding rates for earlier years, we adjusted our projection models according to these indicators. This method likely provides a conservative estimate when estimating any skills gap, as it may understate the
1 The UW System reports that 67 percent of UW System alumni stay in the state (Kim 2010). Between 2004 and 2011, about 3.9 percent of the UW System’s graduates earned associate’s degrees, 75.0 percent earned bachelor’s degrees, and 21.1 percent earned master’s or doctoral degrees (IES n.d.b).
23
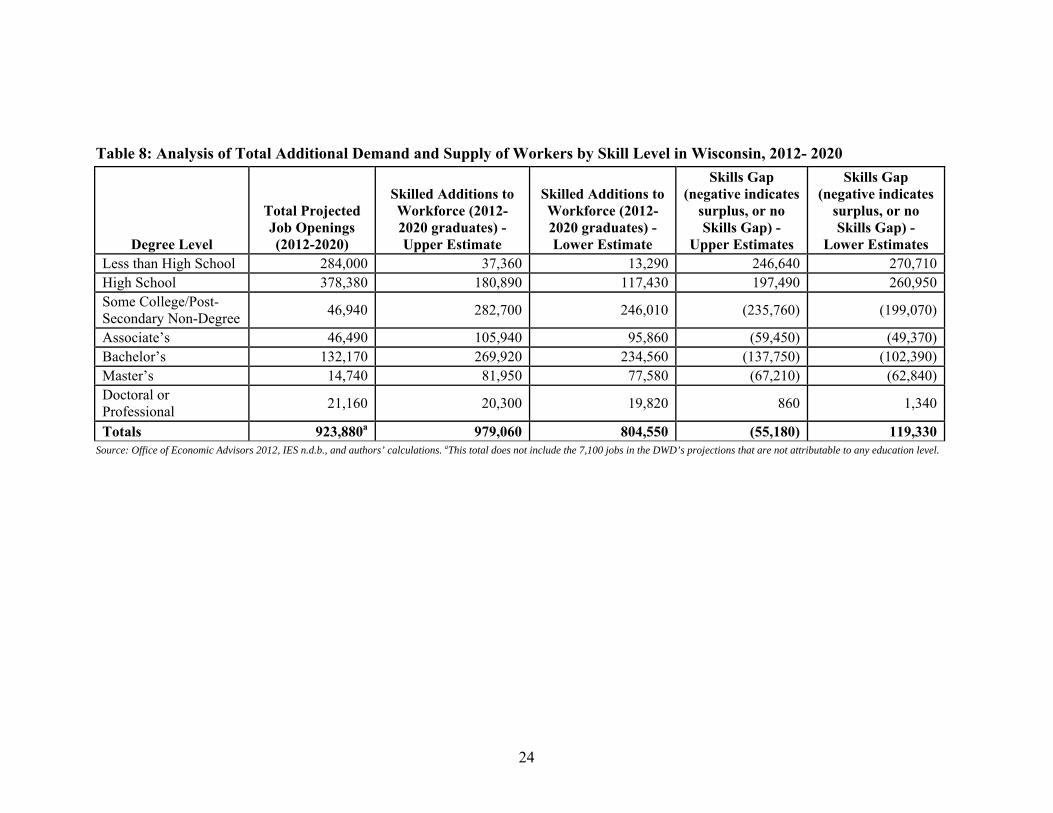
supply of labor. Drawing from these data, we reduced our estimate of the number of new college graduates who remain in the Wisconsin workforce by 15.5 percent. We reduced the number of new advanced degree graduates who remain in Wisconsin by 9.6 percent. For more information, see Appendix C. Although the BLS data do not address the labor force participation rate for those with associate’s degrees, some college, certificates, or no more than a high school diploma, the Federal Reserve Bank of St. Louis (2013) publishes BLS economic data on the participation rates of those groups that are age 25 or older. As these data do not focus only on recent graduates, may include retirees, and may not include some recent graduates younger than 25 years of age, they are not precisely comparable to the BLS data on recent graduates.2 To adjust these averages and estimate the labor force participation rate in the years immediately following graduation, we used the BLS report on recent bachelor’s and advanced degree students as a benchmark for our adjustments. We used the percent change in the labor force participation rate between the two sources to revise the estimate for all degree levels upward, which likely reflects the higher labor force participation rate of more recent graduates relative to the population as a whole. This methodology results in an upward revision of about 11 percent. For more information, see Appendix D. Using data from the U.S. Census Bureau, we also estimated the number of total inflows and outflows of residents to the state each year. Between 2005 and 2011, Wisconsin had net emigration of about 6,500 residents each year. We compared the annual inflows and outflows of migrants to our projected number of graduates leaving the state. We then added enough immigrants back into Wisconsin’s workforce, with skill levels distributed in the same manner as those that left the state, to bring the net emigration figure to 6,500 annually (United States Census Bureau 2013c). This methodology assumes that net outmigration would remain roughly the same for 2012-2020 as it was for 2005-2011 and that individuals with similar educational attainment levels have similar levels of migration. In Table 8, we present our estimates of the demand for and supply of new workers of various skill levels from 2012 to 2020. Table 8 shows the upper bound and lower bound estimates for each level of educational attainment.
2 We note that recent post-secondary school completers may be likely to participate in the labor force at higher rates in an effort to support themselves after schooling. These recent and younger completers may not have higher levels of employment, but their labor force participation rate may still be higher than those of their older and less recently graduated counterparts.
24
Table 8: Analysis of Total Additional Demand and Supply of Workers by Skill Level in Wisconsin, 2012- 2020
Degree Level
Total Projected Job Openings (2012-2020)
Skilled Additions to Workforce (2012-2020 graduates) - Upper Estimate
Skilled Additions to Workforce (2012-2020 graduates) - Lower Estimate
Skills Gap (negative indicates
surplus, or no Skills Gap) -
Upper Estimates
Skills Gap (negative indicates
surplus, or no Skills Gap) -
Lower Estimates Less than High School 284,000 37,360 13,290 246,640 270,710High School 378,380 180,890 117,430 197,490 260,950Some College/Post-Secondary Non-Degree
46,940 282,700 246,010 (235,760) (199,070)
Associate’s 46,490 105,940 95,860 (59,450) (49,370)Bachelor’s 132,170 269,920 234,560 (137,750) (102,390)Master’s 14,740 81,950 77,580 (67,210) (62,840)Doctoral or Professional
21,160 20,300 19,820 860 1,340
Totals 923,880a 979,060 804,550 (55,180) 119,330Source: Office of Economic Advisors 2012, IES n.d.b., and authors’ calculations. aThis total does not include the 7,100 jobs in the DWD’s projections that are not attributable to any education level.
25
If our assumptions and projections are accurate, Table 8 indicates that Wisconsin will likely experience a surplus of bachelor’s, master’s, and associate’s degree holders over the coming eight years. The projected additions of non-degree holders with some post-secondary education far exceed the projected number of job openings that require those levels of education. However, projected openings in occupations that typically require only a high school degree or less substantially exceed the number of graduates likely to enter the workforce at that level. These projections suggest that those with higher levels of education may have to seek employment at a lower skill level. This phenomenon has several potential implications. First, employers could adjust their hiring qualification standards to higher levels of education without an actual change in the job descriptions. As more skilled workers are available, a bachelor’s degree may be expected for more jobs that did not previously require one. Similarly, those with bachelor’s degrees, associate’s degrees, and some post-secondary experience may crowd out the high school graduates for jobs, causing higher unemployment in a subset of the population with generally fewer employment options. The projections also suggest that a higher skill level may not be necessary for a significant portion of the population that is going to college, given these workforce projections. Some of those who expend resources to attend college, and especially those who then drop out of college, might be more economically fortunate if they entered the workforce without going to college immediately. However, potential college attendees likely consider many other factors beyond short-term economic gain. Notably, we project a slight deficit of doctoral and professional degrees, suggesting a skills gap at this high level of education. The DWD projects the occupations with the most openings at this education level will be physicians and surgeons, lawyers, pharmacists, and physical therapists (OEA 2012). Another noteworthy figure on the table is the total of the skills gap estimates. This number estimates the total gap between the quantity of workers in the state and the quantity of open occupations. These numbers suggest that the overall number of workers in Wisconsin between 2012 and 2020 may not be enough to meet demand, as the lower bounds project an overall shortage larger than the surplus in the upper bound. Some have suggested that this potential problem is attributable to baby boomers entering retirement, and relatively fewer young workers entering the workforce (Winters et al. 2009).
26
VII. Analyzing the Skills Gap: Individual Occupations Although the Wisconsin work force’s educational attainment would likely provide enough associate’s and bachelor’s degree holders on an aggregate level, some individual occupations may not have a sufficient supply of trained workers. For example, if the projected growth in Wisconsin occupations requiring bachelor’s degrees was disproportionally copy editors and journalists, but most of the growth in new degrees in the state came from chemistry and physics majors, then we would still face a skills gap even though we have sufficient bachelor’s degrees in total. To explore this issue, we selected all the occupations requiring a bachelor’s degree, an associate’s degree, or a post-secondary certificate that the DWD projected to have more than 5,000 openings between 2010 and 2020. We used both linear regression and historical average percent changes to project the number of graduates in each field from 2012 to 2020, and then averaged the two totals to find a projection. We adjusted each projection to account for migration and workforce participation, as explained in Appendix D. We compared this projection to the projected 2012 to 2020 demand, adjusted from the DWD’s figures, and calculated the projected skills gap. To recognize the uncertainty in our projections, we also projected the skills gap under two theoretical scenarios. In one scenario, the number of graduates remained the same each year from 2011 to 2020. In the second scenario, we projected the skills gap if the number of graduates in that field declined by two percent each year. The sections below provide our projections for some key occupations.
A. Registered Nurses According to the DWD, nurses are projected to be in very high demand, with 24,230 job openings between 2010 and 2020. Registered nurses require at least an associate’s degree, with some earning a bachelor’s degree (OEA 2012). Table 9 displays the result of our analysis for this occupation. Appendix F details exactly which degrees and majors were included in our calculations for projecting registered nurses and which adjustments we made to the figures.
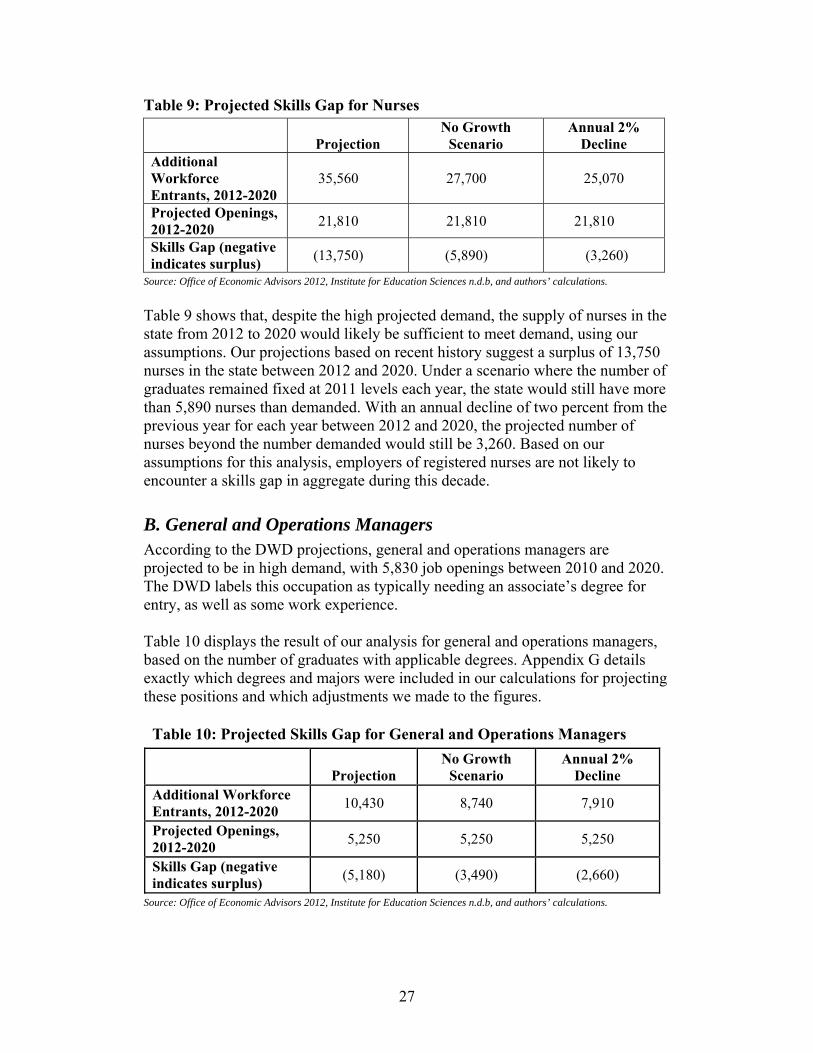
27
Table 9: Projected Skills Gap for Nurses
ProjectionNo Growth
ScenarioAnnual 2%
Decline Additional Workforce Entrants, 2012-2020
35,560 27,700 25,070
Projected Openings, 2012-2020 21,810 21,810 21,810
Skills Gap (negative indicates surplus) (13,750) (5,890) (3,260)
Source: Office of Economic Advisors 2012, Institute for Education Sciences n.d.b, and authors’ calculations.
Table 9 shows that, despite the high projected demand, the supply of nurses in the state from 2012 to 2020 would likely be sufficient to meet demand, using our assumptions. Our projections based on recent history suggest a surplus of 13,750 nurses in the state between 2012 and 2020. Under a scenario where the number of graduates remained fixed at 2011 levels each year, the state would still have more than 5,890 nurses than demanded. With an annual decline of two percent from the previous year for each year between 2012 and 2020, the projected number of nurses beyond the number demanded would still be 3,260. Based on our assumptions for this analysis, employers of registered nurses are not likely to encounter a skills gap in aggregate during this decade.
B. General and Operations Managers According to the DWD projections, general and operations managers are projected to be in high demand, with 5,830 job openings between 2010 and 2020. The DWD labels this occupation as typically needing an associate’s degree for entry, as well as some work experience. Table 10 displays the result of our analysis for general and operations managers, based on the number of graduates with applicable degrees. Appendix G details exactly which degrees and majors were included in our calculations for projecting these positions and which adjustments we made to the figures.
Table 10: Projected Skills Gap for General and Operations Managers
ProjectionNo Growth
ScenarioAnnual 2%
Decline Additional Workforce Entrants, 2012-2020 10,430 8,740 7,910
Projected Openings, 2012-2020 5,250 5,250 5,250
Skills Gap (negative indicates surplus) (5,180) (3,490) (2,660)
Source: Office of Economic Advisors 2012, Institute for Education Sciences n.d.b, and authors’ calculations.
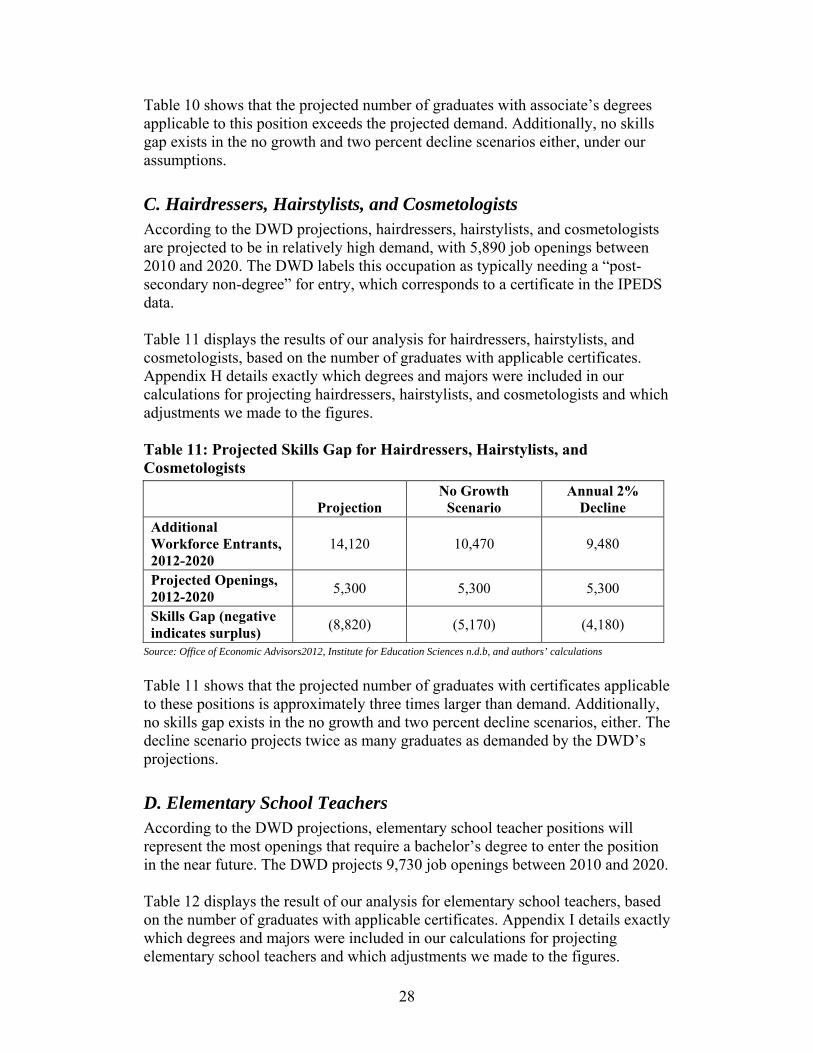
28
Table 10 shows that the projected number of graduates with associate’s degrees applicable to this position exceeds the projected demand. Additionally, no skills gap exists in the no growth and two percent decline scenarios either, under our assumptions.
C. Hairdressers, Hairstylists, and Cosmetologists According to the DWD projections, hairdressers, hairstylists, and cosmetologists are projected to be in relatively high demand, with 5,890 job openings between 2010 and 2020. The DWD labels this occupation as typically needing a “post-secondary non-degree” for entry, which corresponds to a certificate in the IPEDS data. Table 11 displays the results of our analysis for hairdressers, hairstylists, and cosmetologists, based on the number of graduates with applicable certificates. Appendix H details exactly which degrees and majors were included in our calculations for projecting hairdressers, hairstylists, and cosmetologists and which adjustments we made to the figures. Table 11: Projected Skills Gap for Hairdressers, Hairstylists, and Cosmetologists
ProjectionNo Growth
ScenarioAnnual 2%
Decline Additional Workforce Entrants, 2012-2020
14,120 10,470 9,480
Projected Openings, 2012-2020 5,300 5,300 5,300
Skills Gap (negative indicates surplus) (8,820) (5,170) (4,180)
Source: Office of Economic Advisors2012, Institute for Education Sciences n.d.b, and authors’ calculations
Table 11 shows that the projected number of graduates with certificates applicable to these positions is approximately three times larger than demand. Additionally, no skills gap exists in the no growth and two percent decline scenarios, either. The decline scenario projects twice as many graduates as demanded by the DWD’s projections.
D. Elementary School Teachers According to the DWD projections, elementary school teacher positions will represent the most openings that require a bachelor’s degree to enter the position in the near future. The DWD projects 9,730 job openings between 2010 and 2020. Table 12 displays the result of our analysis for elementary school teachers, based on the number of graduates with applicable certificates. Appendix I details exactly which degrees and majors were included in our calculations for projecting elementary school teachers and which adjustments we made to the figures.
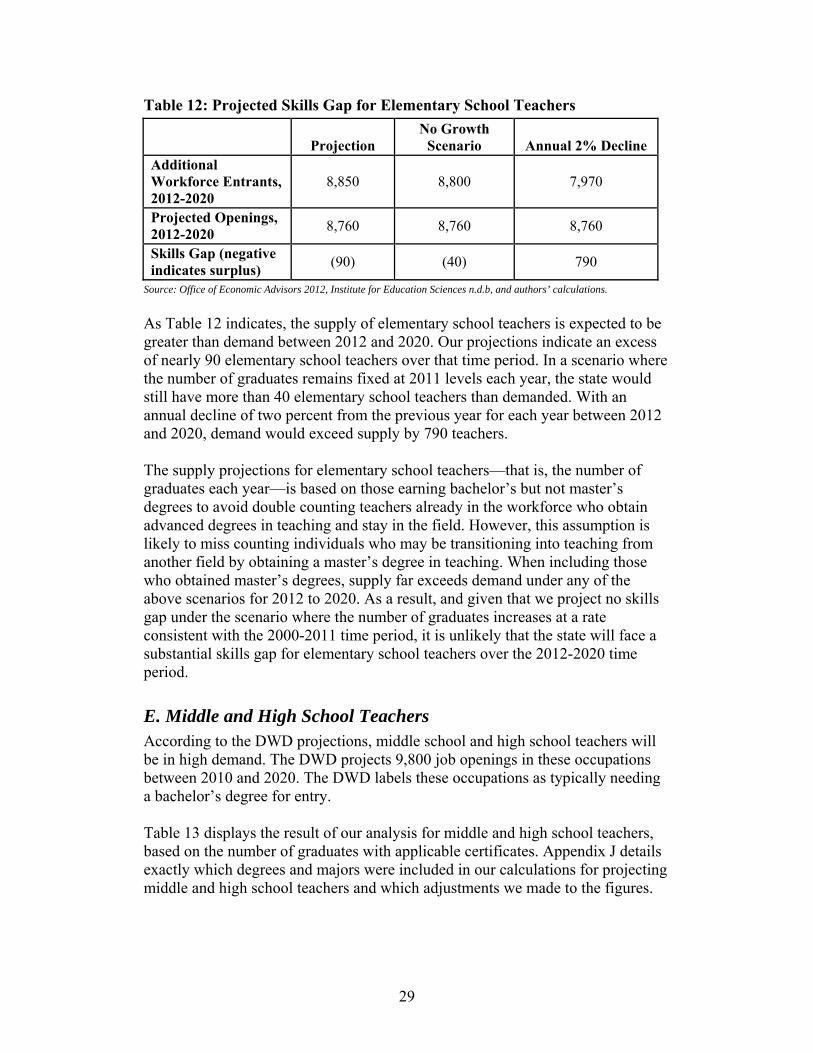
29
Table 12: Projected Skills Gap for Elementary School Teachers
ProjectionNo Growth
Scenario Annual 2% Decline Additional Workforce Entrants, 2012-2020
8,850 8,800 7,970
Projected Openings, 2012-2020 8,760 8,760 8,760
Skills Gap (negative indicates surplus) (90) (40) 790
Source: Office of Economic Advisors 2012, Institute for Education Sciences n.d.b, and authors’ calculations.
As Table 12 indicates, the supply of elementary school teachers is expected to be greater than demand between 2012 and 2020. Our projections indicate an excess of nearly 90 elementary school teachers over that time period. In a scenario where the number of graduates remains fixed at 2011 levels each year, the state would still have more than 40 elementary school teachers than demanded. With an annual decline of two percent from the previous year for each year between 2012 and 2020, demand would exceed supply by 790 teachers. The supply projections for elementary school teachers—that is, the number of graduates each year—is based on those earning bachelor’s but not master’s degrees to avoid double counting teachers already in the workforce who obtain advanced degrees in teaching and stay in the field. However, this assumption is likely to miss counting individuals who may be transitioning into teaching from another field by obtaining a master’s degree in teaching. When including those who obtained master’s degrees, supply far exceeds demand under any of the above scenarios for 2012 to 2020. As a result, and given that we project no skills gap under the scenario where the number of graduates increases at a rate consistent with the 2000-2011 time period, it is unlikely that the state will face a substantial skills gap for elementary school teachers over the 2012-2020 time period.
E. Middle and High School Teachers According to the DWD projections, middle school and high school teachers will be in high demand. The DWD projects 9,800 job openings in these occupations between 2010 and 2020. The DWD labels these occupations as typically needing a bachelor’s degree for entry. Table 13 displays the result of our analysis for middle and high school teachers, based on the number of graduates with applicable certificates. Appendix J details exactly which degrees and majors were included in our calculations for projecting middle and high school teachers and which adjustments we made to the figures.
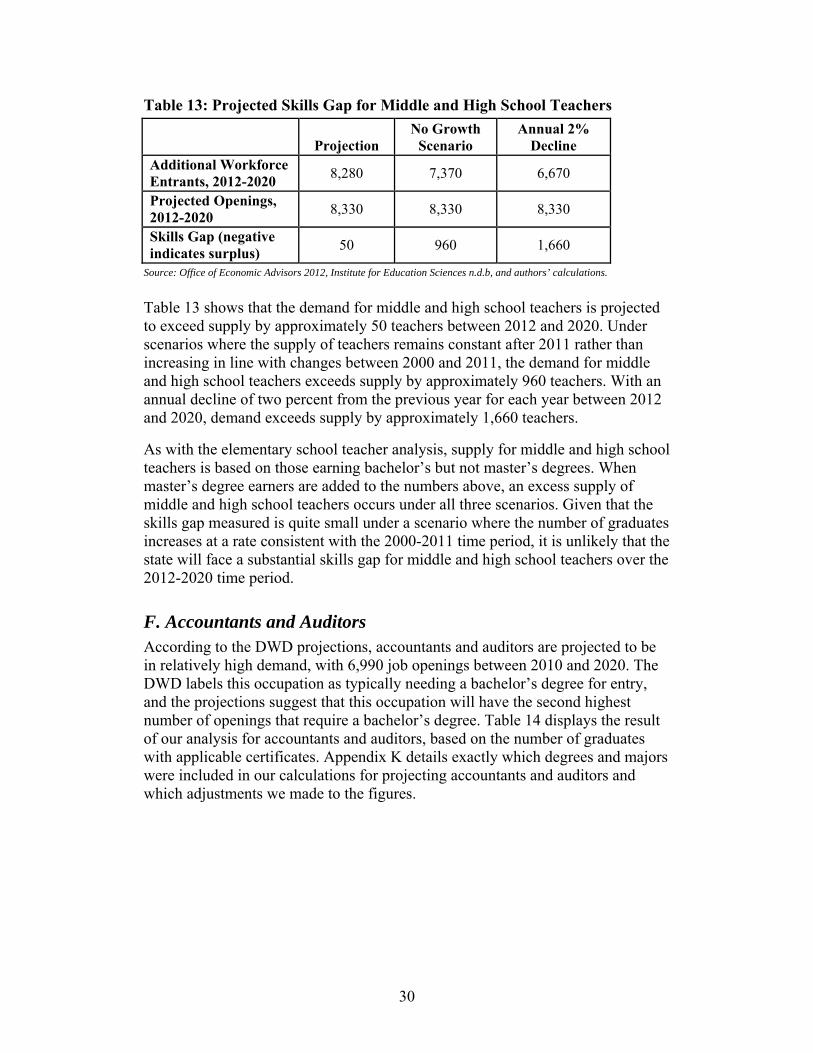
30
Table 13: Projected Skills Gap for Middle and High School Teachers
ProjectionNo Growth
ScenarioAnnual 2%
Decline Additional Workforce Entrants, 2012-2020 8,280 7,370 6,670
Projected Openings, 2012-2020 8,330 8,330 8,330
Skills Gap (negative indicates surplus) 50 960 1,660
Source: Office of Economic Advisors 2012, Institute for Education Sciences n.d.b, and authors’ calculations.
Table 13 shows that the demand for middle and high school teachers is projected to exceed supply by approximately 50 teachers between 2012 and 2020. Under scenarios where the supply of teachers remains constant after 2011 rather than increasing in line with changes between 2000 and 2011, the demand for middle and high school teachers exceeds supply by approximately 960 teachers. With an annual decline of two percent from the previous year for each year between 2012 and 2020, demand exceeds supply by approximately 1,660 teachers.
As with the elementary school teacher analysis, supply for middle and high school teachers is based on those earning bachelor’s but not master’s degrees. When master’s degree earners are added to the numbers above, an excess supply of middle and high school teachers occurs under all three scenarios. Given that the skills gap measured is quite small under a scenario where the number of graduates increases at a rate consistent with the 2000-2011 time period, it is unlikely that the state will face a substantial skills gap for middle and high school teachers over the 2012-2020 time period.
F. Accountants and Auditors According to the DWD projections, accountants and auditors are projected to be in relatively high demand, with 6,990 job openings between 2010 and 2020. The DWD labels this occupation as typically needing a bachelor’s degree for entry, and the projections suggest that this occupation will have the second highest number of openings that require a bachelor’s degree. Table 14 displays the result of our analysis for accountants and auditors, based on the number of graduates with applicable certificates. Appendix K details exactly which degrees and majors were included in our calculations for projecting accountants and auditors and which adjustments we made to the figures.
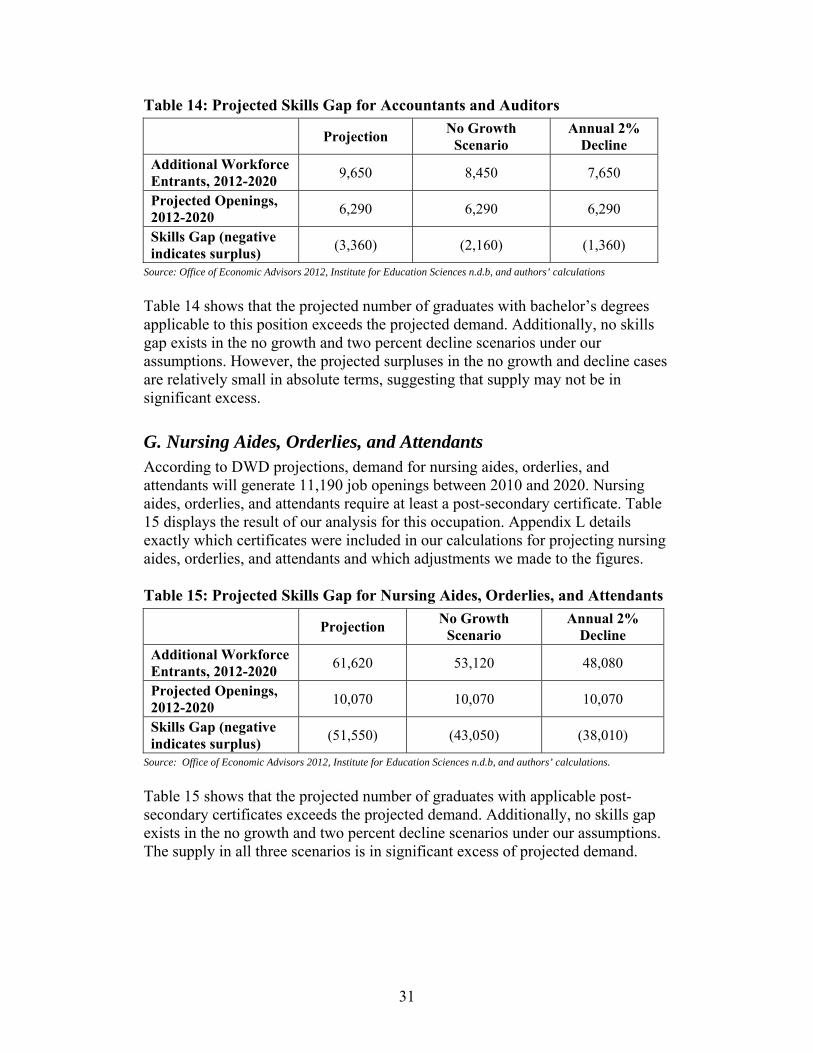
31
Table 14: Projected Skills Gap for Accountants and Auditors
Projection No Growth
ScenarioAnnual 2%
Decline Additional Workforce Entrants, 2012-2020 9,650 8,450 7,650
Projected Openings, 2012-2020 6,290 6,290 6,290
Skills Gap (negative indicates surplus) (3,360) (2,160) (1,360)
Source: Office of Economic Advisors 2012, Institute for Education Sciences n.d.b, and authors’ calculations
Table 14 shows that the projected number of graduates with bachelor’s degrees applicable to this position exceeds the projected demand. Additionally, no skills gap exists in the no growth and two percent decline scenarios under our assumptions. However, the projected surpluses in the no growth and decline cases are relatively small in absolute terms, suggesting that supply may not be in significant excess.
G. Nursing Aides, Orderlies, and Attendants According to DWD projections, demand for nursing aides, orderlies, and attendants will generate 11,190 job openings between 2010 and 2020. Nursing aides, orderlies, and attendants require at least a post-secondary certificate. Table 15 displays the result of our analysis for this occupation. Appendix L details exactly which certificates were included in our calculations for projecting nursing aides, orderlies, and attendants and which adjustments we made to the figures. Table 15: Projected Skills Gap for Nursing Aides, Orderlies, and Attendants
Projection No Growth
ScenarioAnnual 2%
Decline Additional Workforce Entrants, 2012-2020 61,620 53,120 48,080
Projected Openings, 2012-2020 10,070 10,070 10,070
Skills Gap (negative indicates surplus) (51,550) (43,050) (38,010)
Source: Office of Economic Advisors 2012, Institute for Education Sciences n.d.b, and authors’ calculations.
Table 15 shows that the projected number of graduates with applicable post-secondary certificates exceeds the projected demand. Additionally, no skills gap exists in the no growth and two percent decline scenarios under our assumptions. The supply in all three scenarios is in significant excess of projected demand.
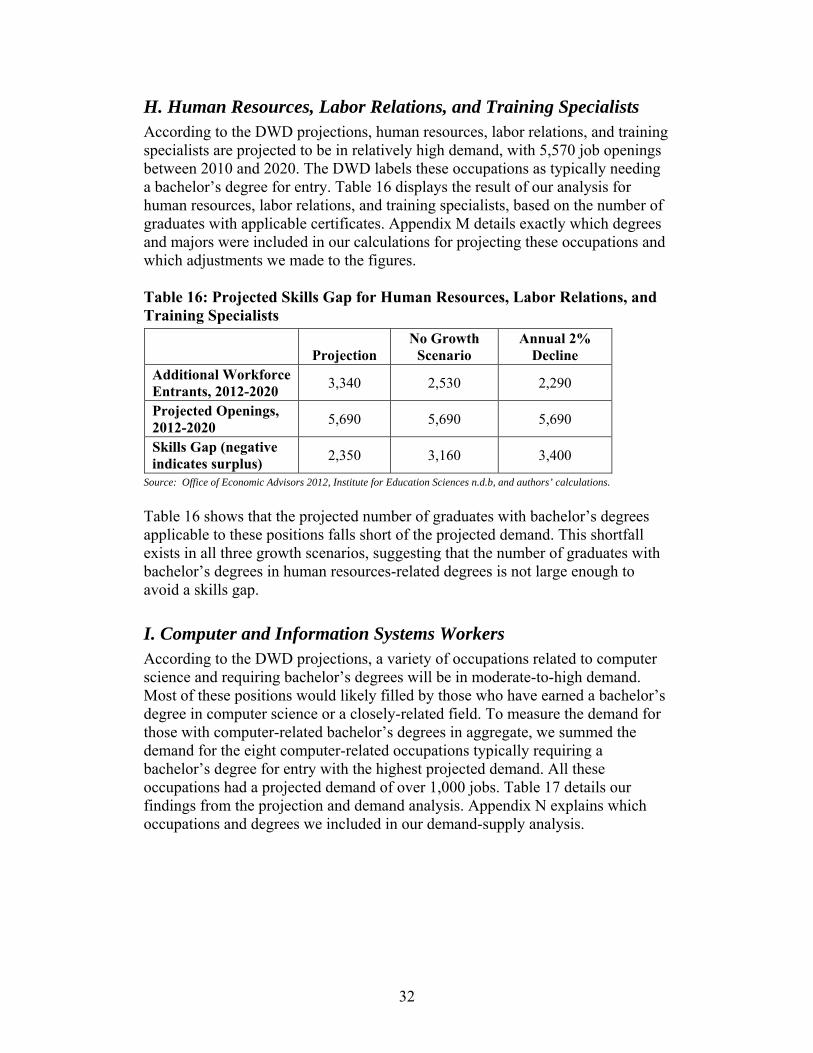
32
H. Human Resources, Labor Relations, and Training Specialists According to the DWD projections, human resources, labor relations, and training specialists are projected to be in relatively high demand, with 5,570 job openings between 2010 and 2020. The DWD labels these occupations as typically needing a bachelor’s degree for entry. Table 16 displays the result of our analysis for human resources, labor relations, and training specialists, based on the number of graduates with applicable certificates. Appendix M details exactly which degrees and majors were included in our calculations for projecting these occupations and which adjustments we made to the figures. Table 16: Projected Skills Gap for Human Resources, Labor Relations, and Training Specialists
ProjectionNo Growth
ScenarioAnnual 2%
Decline Additional Workforce Entrants, 2012-2020 3,340 2,530 2,290
Projected Openings, 2012-2020 5,690 5,690 5,690
Skills Gap (negative indicates surplus) 2,350 3,160 3,400
Source: Office of Economic Advisors 2012, Institute for Education Sciences n.d.b, and authors’ calculations.
Table 16 shows that the projected number of graduates with bachelor’s degrees applicable to these positions falls short of the projected demand. This shortfall exists in all three growth scenarios, suggesting that the number of graduates with bachelor’s degrees in human resources-related degrees is not large enough to avoid a skills gap.
I. Computer and Information Systems Workers According to the DWD projections, a variety of occupations related to computer science and requiring bachelor’s degrees will be in moderate-to-high demand. Most of these positions would likely filled by those who have earned a bachelor’s degree in computer science or a closely-related field. To measure the demand for those with computer-related bachelor’s degrees in aggregate, we summed the demand for the eight computer-related occupations typically requiring a bachelor’s degree for entry with the highest projected demand. All these occupations had a projected demand of over 1,000 jobs. Table 17 details our findings from the projection and demand analysis. Appendix N explains which occupations and degrees we included in our demand-supply analysis.
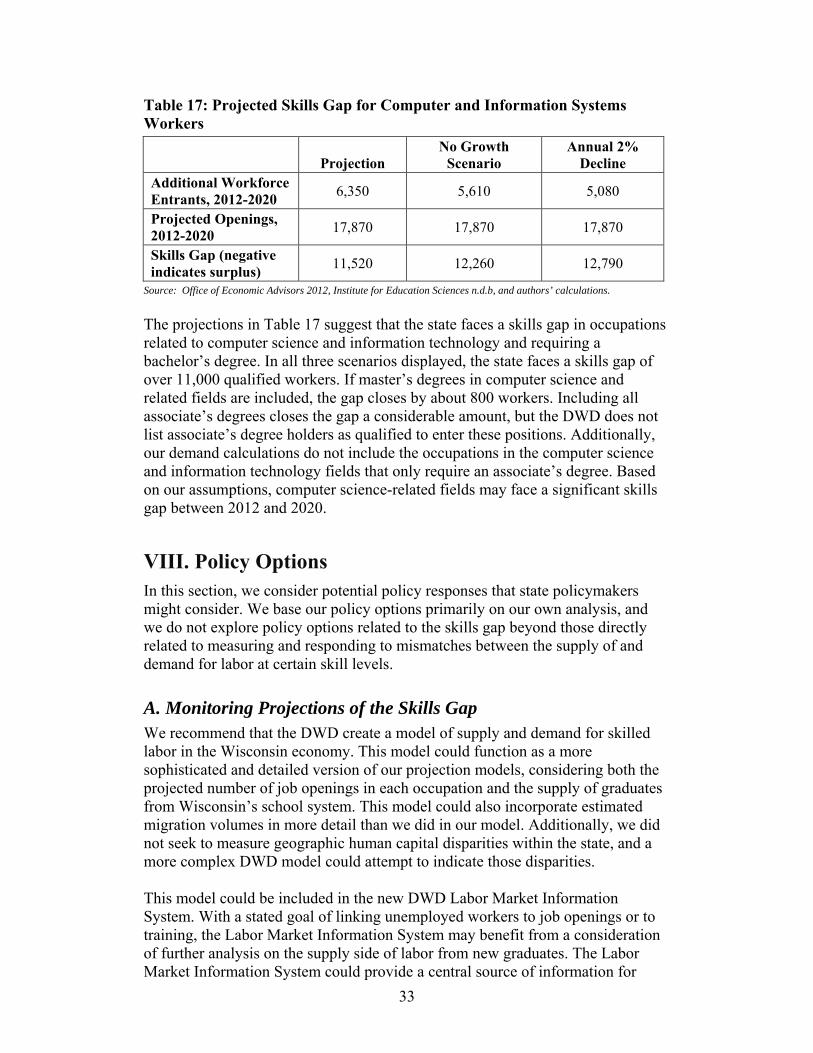
33
Table 17: Projected Skills Gap for Computer and Information Systems Workers
ProjectionNo Growth
ScenarioAnnual 2%
Decline Additional Workforce Entrants, 2012-2020 6,350 5,610 5,080
Projected Openings, 2012-2020 17,870 17,870 17,870
Skills Gap (negative indicates surplus) 11,520 12,260 12,790
Source: Office of Economic Advisors 2012, Institute for Education Sciences n.d.b, and authors’ calculations.
The projections in Table 17 suggest that the state faces a skills gap in occupations related to computer science and information technology and requiring a bachelor’s degree. In all three scenarios displayed, the state faces a skills gap of over 11,000 qualified workers. If master’s degrees in computer science and related fields are included, the gap closes by about 800 workers. Including all associate’s degrees closes the gap a considerable amount, but the DWD does not list associate’s degree holders as qualified to enter these positions. Additionally, our demand calculations do not include the occupations in the computer science and information technology fields that only require an associate’s degree. Based on our assumptions, computer science-related fields may face a significant skills gap between 2012 and 2020.
VIII. Policy Options In this section, we consider potential policy responses that state policymakers might consider. We base our policy options primarily on our own analysis, and we do not explore policy options related to the skills gap beyond those directly related to measuring and responding to mismatches between the supply of and demand for labor at certain skill levels.
A. Monitoring Projections of the Skills Gap We recommend that the DWD create a model of supply and demand for skilled labor in the Wisconsin economy. This model could function as a more sophisticated and detailed version of our projection models, considering both the projected number of job openings in each occupation and the supply of graduates from Wisconsin’s school system. This model could also incorporate estimated migration volumes in more detail than we did in our model. Additionally, we did not seek to measure geographic human capital disparities within the state, and a more complex DWD model could attempt to indicate those disparities. This model could be included in the new DWD Labor Market Information System. With a stated goal of linking unemployed workers to job openings or to training, the Labor Market Information System may benefit from a consideration of further analysis on the supply side of labor from new graduates. The Labor Market Information System could provide a central source of information for
34
educational institutions, employers, the DWD, and students, helping all parties plan for future job market changes (WDWD 2013).
B. Promote a High-Skill Economy Our analysis of current occupational projections suggests that Wisconsin faces a shortage of high-skill jobs. This deficiency may prompt high-skill workers to take jobs for which they are overeducated and overqualified or to leave for employment in other states. One potential response to this problem calls for crafting policies to cultivate employers of high-skill workers to Wisconsin. Policies that encourage entrepreneurship and the creation of firms likely to employ high-skill individuals may address this need. Venture capital tends to attract businesses that employ high-skilled workers. Legislators should consider ways to promote entrepreneurship, such as increasing funding for start-up businesses. As of this writing, a bill that addresses this need has just been introduced in the legislature. The Wisconsin legislature should also consider appointing a high-level expert commission to study the prospects for growth in Wisconsin’s high-skill sectors. Such a commission could explore policies that would increase the number of firms employing high-skill individuals and encourage higher wages. Our analysis suggests that there may be an impending skills gap in jobs requiring a bachelor’s degree in computer science and information technology, human resource and training, and potentially in middle and high school teachers. Targeted programming designed to encourage adults and high school seniors to enter these fields may help to reduce the size of these gaps. Of occupations affected by the projected gaps, computer science and related fields face the largest shortfall of skilled workers. Despite this projected demand, Wisconsin computer science professionals also face a significant wage disparity compared to national averages, receiving $12,000 less in average income in the state (United States Bureau of Labor Statistics 2013c, 2013d). As long as this disparity persists, investing in education may encourage continued emigration once these candidates receive their degrees. Additional efforts to encourage students to earn a bachelor’s degree for occupations expecting to face a skills gap, such as computer science, may help alleviate labor shortages in those areas. However, we project that there will be an aggregate excess of bachelor’s degree holders in Wisconsin’s economy, regardless of their area of study. Recognizing the continued interest in higher education and obtaining bachelor’s degrees in the population, Wisconsin should work to reorient the economy to make efficient use of these workers’ skills.
35
C. Easing the Transition to College and the Workforce Despite the potential value of an emphasis on bachelor’s degree holders, our analysis does find a shortage of workers to perform labor requiring fewer specific education-based skills through 2020. The DWD projects that occupations requiring a high school diploma or less will account for most of the job growth in Wisconsin’s economy. Absent action to increase the number of employers demanding employees with advanced education, individuals making up the surplus of bachelor’s degree earners shown in our analysis may find themselves overqualified for available job opportunities. Some of the mismatch, with an excess of high-skill workers and a shortage of low-skill workers, may be due to students not having the necessary information to make education choices that are likely to lead to employment opportunities at their anticipated skill level. The U.S. Department of Education’s recently developed College Scorecard and the DWD’s forthcoming Labor Market Information System represent strong first steps toward reducing this lack of information for potential consumers of post-secondary education. While on average bachelor’s degree holders earn more than those with less education, the projected excess of high-skill individuals may suggest that some high school students would be better off financially by pursuing job opportunities in occupations that do not require a bachelor’s degree. These students may incur the costs associated with higher education without also benefiting from higher wages following graduation. To address this situation, policymakers could encourage school districts, potentially through relatively small grant programs, to expand their experiential learning initiatives. These programs could include expanded vocational for-credit classes, field trips to worksites, job-shadowing, and apprenticeship programs. These programs could also be part of a larger effort to support certain career pathways that may include planned returns to higher education and incrementally increasing skills. Employer sponsors may be able to help fund such programs, either through direct financial support or in-kind contributions. Policymakers could also consider programs that would ease pathways to college for individuals reentering education after spending time in the workforce. Scheduling flexibility and curriculum style changes may reduce the costs associated with transitioning back to part-time or full-time schooling from the workforce. These changes might reduce the added incentives for high school graduates to immediately enter college, allowing some to enter the workforce for some time before deciding whether to enroll in college. Policymakers could craft additional programs that would reduce both monetary and opportunity costs for those seeking to enter a higher education program after spending time in the workforce.
36
IX. Conclusion In this report, we sought to explore, and if possible quantify, a skills gap in Wisconsin. Our analysis of the economic indicators does not provide evidence that a skills gap exists large enough to be detected by those indicators. Our projections suggest that a skills gap may exist in a few key areas of Wisconsin’s economy between now and 2020, most notably in occupations typically requiring formal education in computer science and information technology. However, we did not project an educational attainment-based skills gap in the Wisconsin economy in aggregate in the near future. Although Wisconsin may face a small shortage of doctoral graduates, recent trends suggest that the Wisconsin workforce may be substantially more educated than the projected job openings typically require for entry. State policymakers should craft policies to correct this imbalance, which could include publicly available economic modeling to project future skills gaps with information about Wisconsin graduates; exploring policies to incentivize market demand for high-skill labor; and easing transitions between high school, college, and employment.
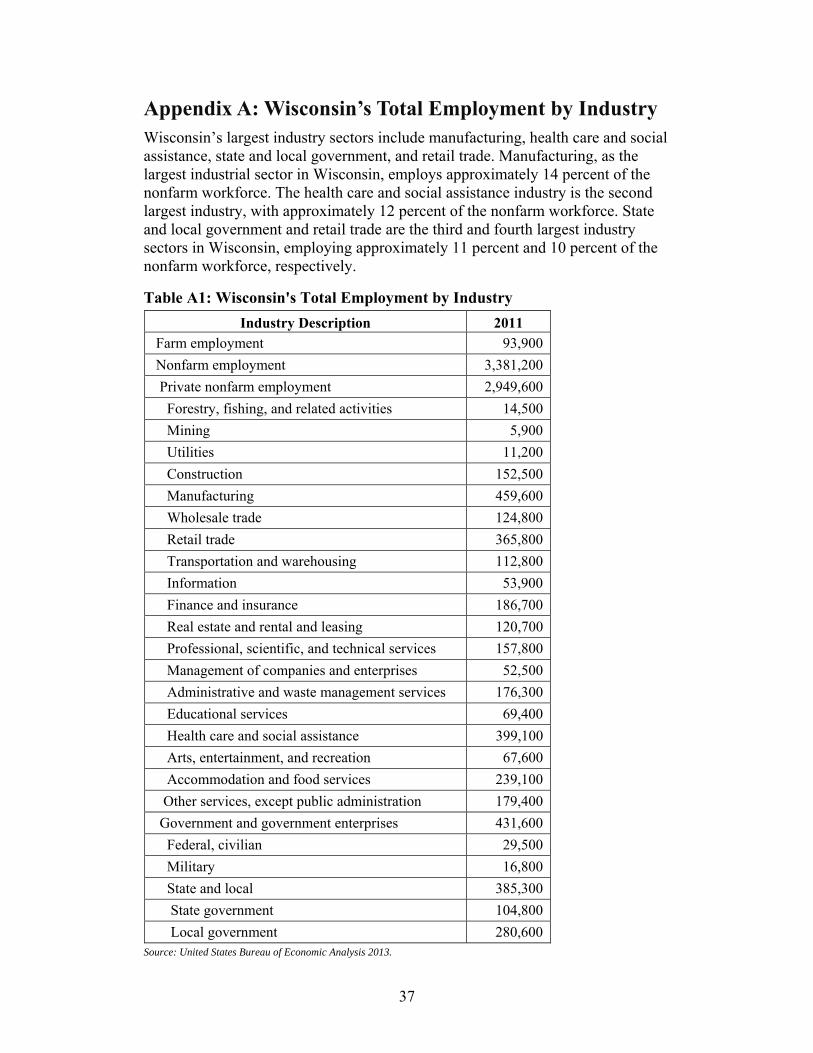
37
Appendix A: Wisconsin’s Total Employment by Industry Wisconsin’s largest industry sectors include manufacturing, health care and social assistance, state and local government, and retail trade. Manufacturing, as the largest industrial sector in Wisconsin, employs approximately 14 percent of the nonfarm workforce. The health care and social assistance industry is the second largest industry, with approximately 12 percent of the nonfarm workforce. State and local government and retail trade are the third and fourth largest industry sectors in Wisconsin, employing approximately 11 percent and 10 percent of the nonfarm workforce, respectively.
Table A1: Wisconsin's Total Employment by Industry
Industry Description 2011 Farm employment 93,900
Nonfarm employment 3,381,200
Private nonfarm employment 2,949,600
Forestry, fishing, and related activities 14,500
Mining 5,900
Utilities 11,200
Construction 152,500
Manufacturing 459,600
Wholesale trade 124,800
Retail trade 365,800
Transportation and warehousing 112,800
Information 53,900
Finance and insurance 186,700
Real estate and rental and leasing 120,700
Professional, scientific, and technical services 157,800
Management of companies and enterprises 52,500
Administrative and waste management services 176,300
Educational services 69,400
Health care and social assistance 399,100
Arts, entertainment, and recreation 67,600
Accommodation and food services 239,100
Other services, except public administration 179,400
Government and government enterprises 431,600
Federal, civilian 29,500
Military 16,800
State and local 385,300
State government 104,800
Local government 280,600 Source: United States Bureau of Economic Analysis 2013.
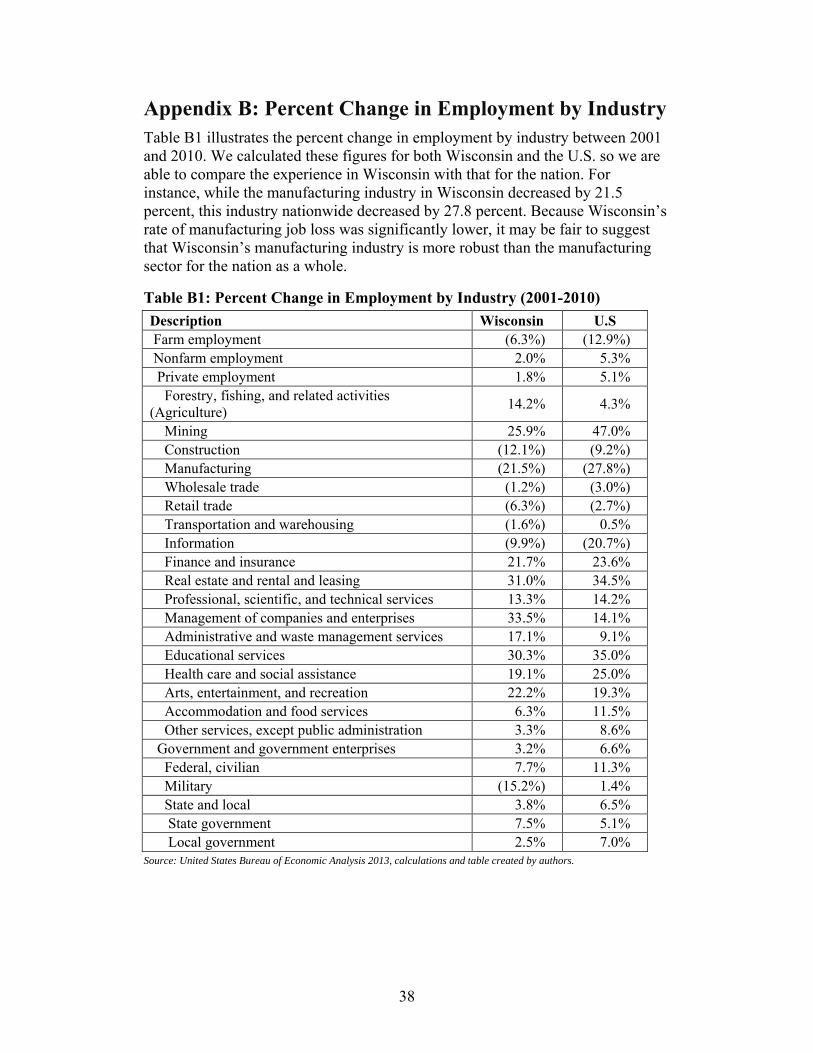
38
Appendix B: Percent Change in Employment by Industry Table B1 illustrates the percent change in employment by industry between 2001 and 2010. We calculated these figures for both Wisconsin and the U.S. so we are able to compare the experience in Wisconsin with that for the nation. For instance, while the manufacturing industry in Wisconsin decreased by 21.5 percent, this industry nationwide decreased by 27.8 percent. Because Wisconsin’s rate of manufacturing job loss was significantly lower, it may be fair to suggest that Wisconsin’s manufacturing industry is more robust than the manufacturing sector for the nation as a whole.
Table B1: Percent Change in Employment by Industry (2001-2010)
Description Wisconsin U.S Farm employment (6.3%) (12.9%) Nonfarm employment 2.0% 5.3% Private employment 1.8% 5.1% Forestry, fishing, and related activities (Agriculture) 14.2% 4.3%
Mining 25.9% 47.0% Construction (12.1%) (9.2%) Manufacturing (21.5%) (27.8%) Wholesale trade (1.2%) (3.0%) Retail trade (6.3%) (2.7%) Transportation and warehousing (1.6%) 0.5% Information (9.9%) (20.7%) Finance and insurance 21.7% 23.6% Real estate and rental and leasing 31.0% 34.5% Professional, scientific, and technical services 13.3% 14.2% Management of companies and enterprises 33.5% 14.1% Administrative and waste management services 17.1% 9.1% Educational services 30.3% 35.0% Health care and social assistance 19.1% 25.0% Arts, entertainment, and recreation 22.2% 19.3% Accommodation and food services 6.3% 11.5% Other services, except public administration 3.3% 8.6% Government and government enterprises 3.2% 6.6% Federal, civilian 7.7% 11.3% Military (15.2%) 1.4% State and local 3.8% 6.5% State government 7.5% 5.1% Local government 2.5% 7.0%
Source: United States Bureau of Economic Analysis 2013, calculations and table created by authors.
39
Appendix C: Supply Projection Methodology: Bachelor’s and Advanced Degrees To project the number of bachelor’s degrees awarded, we used several different methods to account for some of the variation and uncertainties in our projections. We used basic projection methodologies for our upper bound projections, and used projections for high school graduates in Wisconsin to calculate our lower bound projections.
A. Bachelor’s and Advanced Degree Projections We used two different projections to estimate the upper bound of the number of bachelor’s degree holders. First, we used IPEDS data on existing aggregate numbers of graduates across Wisconsin institutions to create an ordinary least squares regression line. We used this regression line to identify likely numbers of graduates for each of the years 2012-2020 and then summed those values to find a total projected increase in graduates from 2012-2020. Second, we used the IPEDS data to calculate the percent change relative to the year before for each of the years 2001-2011. We then calculated the average percent change over those years, and used that average to project forward to 2012-2020. We summed these alternative projections to find another value for the total projected increase in supply from 2012-2020. Finally, we averaged these two summations to find a reasonable point estimate for the total supply of bachelor’s degree graduates. Our projections appear roughly in line with the University of Wisconsin’s goal to award 33,700 bachelor’s degrees in 2025, so we consider our upper bound projection methodology feasible (University of Wisconsin System 2010). We repeated this methodology for master’s and doctoral/professional degrees. However, we used the regression and percentage methods separately, assigning the upper bound to the higher projection and the lower bound to the smaller projection. In both cases, the percentage-based projections were higher than the regression projections, so those served as the upper bounds. To project the lower bound of bachelor’s degrees, we calculated the percentage annual change in projected high school graduates in the state and matched the projected percent changes in bachelor’s degrees to the high school percent changes with a time lag of four years. The Western Interstate Commission for Higher Education projects the number of high school graduates from both public and private schools in Wisconsin (University of Wisconsin System 2013). These projections show a relative decline in the short term, leading to a substantial drop in high school graduates before leveling off and recovering closer to 2020. Thus, linking changes in in-state bachelor’s degrees to these estimates provides a lower estimate than continuing to project growth based on historical data. Although times to bachelor’s degree completion vary, we time-lagged the percent changes for high school graduates by four years.
40
B. Bachelor’s and Advanced Degree Workforce Adjustments To adjust for the actual number of graduates who enter the workforce, we consulted a 2013 study of recent college graduates in the U.S. Bureau of Labor Statistics’ Monthly Labor Review to find labor force participation rates of recent college graduates from 2007 to 2011 (Spreen 2013). We multiplied our graduate projections by the average labor force participation rate for recently graduated bachelor’s and advanced degree holders. For recent bachelor’s degree earners, the average labor force participation rate was 84.5 percent, while the rate was 90.4 percent for advanced (master’s and doctoral/professional) degrees. We additionally used estimates from the University of Wisconsin to determine a likely geographic retention rate for students graduating from Wisconsin institutions. The UW System reports that 67 percent of its graduates stay in Wisconsin (Kim 2010). Although we do not have data for the number of private college graduates who remain in Wisconsin, we determined that 84 percent of all bachelor’s degrees, 65 percent of all advanced degrees, and 10 percent of all associate’s degrees awarded in Wisconsin between 2004 and 2011 were from the UW System (IES n.d.b.). Using UW System numbers may be somewhat skewed across the degree levels relative to all statewide graduates, so we rounded to a 60 percent Wisconsin retention rate to provide a conservative estimate for bachelor’s and advanced degrees from both public and private institutions for our lower bound estimates. To calculate the upper bound estimates, we increased the retention rate to 67 percent for bachelor’s degrees and retained 60 percent for advanced degrees.
C. Key Assumptions To perform these analyses, we made several important assumptions:
We assumed that skill level increases with formal education. We assumed for our upper bound projections that data from recent history
is an accurate indicator of trends for 2012-2020. We assumed for our lower bound projections that the rate of bachelor’s
degree graduates in the state is tied to the time-lagged rate of change in high school graduates. We assumed that master’s and doctoral degrees are independent of changes in high school graduation rates. This assumption implies that the declines in state high school graduation rates are not counterbalanced by the increased attraction of out-of-state students or increased college attendance rates.
We assumed that 60 percent of bachelor’s and advanced degree graduates from Wisconsin institutions remain in the state in our lower bound estimates. For our upper bound estimates, we assumed that 67 percent of bachelor’s and 60 percent of advanced degree students remain in the state. However, we also assumed that the people immigrating into the state have a similar educational distribution to the migration of people out of the state. Thus, although the total figure for in-state graduates is lower (as the state is experiencing net emigration), most of these losses (an average of about 77 percent) are counterbalanced by immigration.
41
Appendix D: Supply Projection Methodology: Associate’s Degrees and Non-Degree Certificates To project the number of associate’s degrees and non-degree certificates awarded, we used several different methods to account for some of the variation and uncertainties in our projections. We used basic projection methodologies for our upper bound projections, and used projections that did not include spikes in enrollment during and immediately after recessions in our lower bound projections.
A. Associate’s Degree and Non-Degree Certificate Projections We developed four different projection models for our upper and lower bounds projections for associate’s degree holders. First, we used IPEDS data, aggregating the total number of graduates across Wisconsin institutions, to create an ordinary least squares regression line. We used this regression line to identify likely values for each of the years 2012-2020 and then summed those values to find a total projected increase in supply from 2012-2020. Second, we found the percent change relative to the year before for each year from 2001-2011. We then calculated the average percent change over each of those years, and used that average to project to 2012-2020. The projection results from these two methods provided our upper bound. In our third method, we removed the year 2011 as likely disproportionately affected by the Great Recession from the regression dataset and completed another ordinary least squares regression. This model assumes that the 2011 spike in associate’s degree recipients was due largely to people, facing a lack of employment opportunities, leaving the workforce and seeking training in disproportionately large numbers. Thus, this model assumes the 2011 increase is an anomaly and is likely larger than we will see in coming years with greater economic stability. Fourth, we built another percentage change model but excluded 2011 for the same reasons we excluded the year in the third model. We averaged these summations for total new graduates for 2012-2020 from the latter two projection methods to find a lower bound estimate for total supply of associate’s degree graduates. We repeated these models to determine the upper and lower bounds for certificate-earning graduates. However, we removed more data than we did for associate’s degrees to smooth out the influence of recent recessions for our lower bound projections. We used the years 2004 to 2009 in our projections for the lower bound.
42
B. Associate’s Degree and Non-Degree Certificate Workforce Adjustments Data on the labor force participation rate for recent graduates and certificate awardees is not available. However, the BLS, via the Federal Reserve Bank of St. Louis, provides monthly estimates for associate’s degree and some college labor force participation for those 25 years old and older. This measure is less applicable to our target population than the measures used for bachelor’s and advanced degrees, as it includes no one younger than 25 and the elderly, some of whom are retired. However, it serves as a baseline for estimating a reasonable proxy. To find the appropriate upward revision, we used the known difference between the relevant participation rates for bachelor’s degrees or higher as a proxy. We found the percent difference between the BLS labor force participation rate for those 25 years old and older with bachelor’s degrees or higher and the labor force participation rate for recent graduates with bachelor’s and advanced degrees. We adjusted our participation rate upwards for associate’s degrees, certificates, and those with some college education based on this percent difference (approximately 11 percent). The average rate for 2007 to 2011 was 71.0 percent for 25 years or older, but after our percent increase adjustment, the participation rate was 79.0 percent (Federal Reserve Bank of St. Louis 2013). We then multiplied our estimate for the number of graduates participating in the labor force by this figure for an appropriate reduction in the total number of labor added into the force. We estimated the fraction of graduates who stay in Wisconsin based on survey data from the WTCS. The WTCS graduated more than 87 percent of all new Wisconsin associate’s degree graduates and certificate earners between 2004 and 2011 (IES n.d.b). According to WTCS survey data of its graduates between 2007 and 2011, about 84 percent found work in the state a year after their graduation. A sizable portion of those surveyed did not respond or did not supply their specific location (WTCS 2012a; WTCS 2011; WTCS 2010; WTCS 2009; WTCS 2008). Some of these responses could be from people who are in-state but did not specifically identify that on the survey. This lack of information suggests that the 84 percent figure may be an underestimate and understate the supply of labor at the associate’s degree level.
C. Key Assumptions To perform these analyses, we made several important assumptions:
We assumed that skill level increases with formal education. We assumed for our upper bound projections that data from recent history
is an accurate indicator of trends for 2012-2020. We assumed for our lower bound projections that dramatic changes in the
graduation rates are the result of individuals seeking more training to specialize during economic recession and are not necessarily indicative of
43
broader, long-term trends in the numbers of graduates from educational programs.
We assumed that the WTCS surveys are an accurate representation of the actual percentage of recent graduates who remain in the state after acquiring their associate’s degrees or certificates.
We assumed that the labor force participation rate for recently graduated workforce entrants is higher than that for all civilians at that education level who are 25 years of age or older. Specifically, we assumed that the labor force participation rate increases relative to the broader 25 years or older rate by the same percentage (11 percent) that bachelor’s and advanced degree labor force participation increases for recent graduates relative to the 25 years or older metric for the same group. As a result of this assumption, we were able to calculate the increased workforce participation rates for all recent graduates at all degree levels. The average BLS labor force participation rate for high school graduates was 61.9 percent from 2007 to 2011. Our adjustments to the labor force participation rate revised this estimate to 68.9 percent. For those holding associate’s degrees or having some college training, the broader data suggested that the labor force participation rate was 71.0 percent over the same time period, and our adjustments increased the rate to 79 percent. For those with no high school diploma, the labor force participation rate was 46.4 percent, and our recent-graduate adjustment increased the rate to 51.7 percent (Federal Reserve Bank of St. Louis 2013). We used these percentages to adjust our projections for the number of entrants into the labor force downward from the full count of all graduates, reflecting those graduates who chose to remain outside the labor force.
44
Appendix E: Supply Projection Methodology: Less Than High School, High School, and Some College Completion To project the number of high school graduates, high school dropouts, and those who have dropped out of college who are entering the workforce, we used several different methods to account for some of the variation and uncertainties in our projections. We used existing projections for the total number of high school graduates in Wisconsin, and we used several different methodologies to determine the upper and lower bound projections for the number immediately entering the workforce, the number going on to college and then dropping out, and the number dropping out of high school.
A. Less Than High School Completion To calculate our upper bound projections, we used data and projections from the Western Interstate Commission for Higher Education. We multiplied the aggregate number of graduates by the average high school dropout rate in Wisconsin between 2004 to 2010 (Wisconsin Department of Public Instruction 2013d; University of Wisconsin System 2013). For our upper bound projections, we assumed that this population would remain in the state or that inflows from other states will counterbalance any outflows of this population. To calculate our lower bound projections, we regressed the increasing graduation rate over 2004 to 2010 to project an improved graduation rate. We let the rate increase until 2016, where we capped the graduation rate at 96.7 percent to avoid unreasonably high graduation rate estimates. We then revised statistics on labor force participation rates of high school dropouts to match the participation rate of recent graduates (see Appendix D for more on this revision) and to determine the proportion of this population that would enter the Wisconsin labor force. For our lower bound projections, we assumed that the proportion of all 18- and 19-year-olds that leave the state each year relative to the statewide population of 18- and 19-year-olds is the emigration rate for recent high school graduates and dropouts, which is 5.5 percent (United States Census Bureau 2011). This assumption may be flawed, as some of this emigration might be continuing students attending school in other states. However, this conservative estimate may serve well as a lower bound.
B. High School Completion We used the Western Interstate Commission for Higher Education projections and Department of Public Instruction (DPI) information on the graduation plans of students to project the number of students who would directly enter the workforce from high school (Wisconsin Department of Public Instruction n.d.b.). In our projections, we included students who planned to have a job, look for a job, or enter job training immediately after high school.
45
For our upper bound projections, we assumed that this population would remain in the state or that inflows from other states would counterbalance outflows of this population. For our lower bound projections, we assumed that the proportion of all 18- and 19-year-olds that leave the state each year relative to the statewide population of 18- and 19-year-olds is the emigration rate for recent high school graduates, which is 5.5 percent (United States Census Bureau 2011). Again, this assumption may be flawed, but it is likely to produce a more conservative estimate. In our lower bound projections, we assumed the labor force participation rate for this group was 68.9 percent, which we revised upward from the BLS’s broader 25 years or older estimate of 61.9 percent to account for the recently graduated status of these individuals (see Appendix D for more details on this assumption). We also added in the group of students who did not have any specific plans or had miscellaneous plans, assuming they would enter the workforce at the same labor participation rate as the broad 25 years or older high school dropouts measure. Using data from a study of the Wisconsin GED program, we assumed that 7,500 GED credentials would be issued in Wisconsin each year (Quinn and Pawasarat 2011). The GED projections were then adjusted by the immediate expected labor force participation rate. According to the GED Academy, 60 percent of GED test takers plan to go on to college (GED Academy 2011). For our lower bound projection, we assumed that 60 percent go to college and do not immediately enter the workforce. To build our upper bound projections, we assumed that those who identified themselves as going into employment, seeking employment, or going into job training would all enter the labor force. We also assumed that the labor force participation rate of those high school graduates who report no plans or miscellaneous plans enter the workforce at the same rate as other high school graduates. For our upper bound estimate of GED credential holders, we assumed that 25 percent continue on to college and the rest enter the workforce.
C. College Dropouts We were able to project the number of college dropouts (categorized as “some college” in the final projections) by examining the completion rates for students in the UW System and the WTCS (University of Wisconsin System 2012a; The Chronicle of Higher Education n.d.). We time-lagged UW System data to project the number of students likely to drop out of college and enter the workforce each year, based on when they graduated from high school and the workforce participation rate for “some college.” We revised this workforce participation rate upward to match our rates for associate’s degrees and those with certificates (see Appendix D for details). We assumed that college dropouts remain in the state at the same rate as high school graduates. By examining recent retention rates for bachelor’s degrees from the UW System, we built a simple model to reintroduce college dropouts into the workforce in the
46
years after they entered college. The model treats Wisconsin high school students who enter college and drop out as part of the “some college” population. Between their first and second years of college, 15 percent of students drop out. We modeled a one-year lag of 15 percent of Wisconsin high school students who entered a four-year college. Between their second and third years, another 8 percent of students drop out. Another 4 percent drop out before their senior year. We modeled these two steps using their respective lags. We then added the remaining 2 percent of students who have not graduated by their sixth year or re-enrolled for their seventh year to the group of dropouts with a six-year lag. We assume all of these dropouts participate at the same rate as associate’s degree and certificate holders, revised upward from the 25 years and older measure (see Appendix D). Less detailed data were available for associate’s degree dropout rates. The Chronicle of Higher Education suggests that in recent years 68.7 percent of enrollees do not complete their associate’s degree in 150 percent of the time slated to complete the program (Chronicle of Higher Education n.d.). We assumed for our upper bound of labor force entrants that 10 percent remain after 150 percent of the time to complete the program. For the lower bound estimates, we assumed that 25 percent continue in the program. We assumed that the difference between the observed and projected volume of graduates from Wisconsin high schools going to four-year colleges and the number of four-year college graduates produced in the state is due to out-of-state high school graduates entering Wisconsin to attend school. In 2012, approximately 14 percent, or about 3,800, students entering the UW System were from out of state (Herzog 2012).
47
Appendix F: Registered Nurses Projections 2010 CIP Codes Applied to Nursing Supply – IPEDS Data, First and Second Major, All Wisconsin Institutions Bachelor’s Degrees 51.3801 – Registered Nursing/Registered Nurse 51.3818 – Nursing Practice 51.3899 – Registered Nursing- Nursing Administration- Nursing Research and Clinical Nursing Associate’s Degrees 51.3801 – Registered Nursing/Registered Nurse 51.3899 – Registered Nursing- Nursing Administration- Nursing Research and Clinical Nursing Post- Baccalaureate Certificate, Master’s, or Professional Degrees 51.3803 – Adult Health Nurse/Nursing 51.3805 – Family Practice Nurse/Nursing 51.3818 – Nursing Practice 51.3813 – Clinical Nurse Specialist 51.3802 – Nursing Administration In years using older versions of the CIP codes, we adapted the categories to match the set of 2010 CIP code majors and degrees in the most logical manner. Using the total number of degrees awarded for these comparable CIP codes, we adjusted the included CIP codes and the projections to account for any changes in included majors. To determine the workforce participation rate, we averaged the participation rate for recent bachelor’s degrees (84.5 percent) and the estimated workforce participation rate for recent associate’s degrees (79.0 percent). We decided to average these two rates because the number of registered nurses entering the workforce with bachelor’s and associate’s degrees was roughly the same across the 2000 to 2011 dataset. Compared to these two groups, the number of nurses entering the workforce with a post-baccalaureate, master’s, or professional degree was relatively small, and some may have been double-counted if they graduated and entered the workforce with a bachelor’s degree earlier in the examined time period. Keeping the participation rate down may help counterbalance the influence of any double-counting. We used two methods to develop our final projection estimate. First, we built a regression model on 2000 to 2011 data and extrapolated using that equation. Second, we determined the average percent change between each year from 2000 to 2011 and used that average percent change to project from 2012 to 2020. We then averaged the values of those two methods to determine the final estimate.
48
Appendix G: General and Operations Managers Projections 2010 CIP Codes Applied to General and Operations Managers Supply – IPEDS Data, First and Second Major, All Wisconsin Institutions Associate’s Degrees 52.02 – Business Administration-Management and Operations In years using older versions of the CIP codes, we adapted the categories to match the set of 2010 CIP code majors and degrees in the most logical manner. Using the total number of degrees awarded for these comparable CIP codes, we adjusted the included CIP codes and the projections to account for any changes in included majors. To build our projections for general and operations managers, we used a workforce participation rate of 79 percent, which corresponds to our adjusted workforce participation rate for all associate’s degrees. For our projected number of graduates with the relevant associate’s degrees, we averaged four measures of projections. We first projected the total number of graduates for 2012 to 2020 using an ordinary least squares regression line based off the 2000 to 2011 data set. Second, we averaged the percent changes between each year from 2000 to 2011, and applied that average to 2012 to 2020. Third, we projected the number of graduates without including the historical data that might have been influenced by the Great Recession, which could have encouraged more workers to seek a degree. Specifically, we projected using a regression model that was built without including the years 2009, 2010, and 2011, which appear to have a significantly higher number of graduates than previous years. Fourth, we projected the number of graduates using the average percentage method, but not including the percentage changes from 2009, 2010, and 2011 in our average. Finally, we averaged the results of these four projection methods.
49
Appendix H: Hairdressers, Hairstylists, and Cosmetologists Projections 2010 CIP Codes Applied to Hairdressers, Hairstylists, and Cosmetologists Supply – IPEDS Data, First and Second Major, All Wisconsin Institutions Pre-Baccalaureate, Non-Degree Awards of Less Than One Academic Year, of At Least One But Less Than Two Academic Years, and of At Least Two But Less Than Four Academic Years 12.04 – Cosmetology and Related Personal Grooming Services In years using older versions of the CIP codes, we adapted the categories to match the set of 2010 CIP code majors and degrees in the most logical manner. Using the total number of degrees awarded for these comparable CIP codes, we adjusted the included CIP codes and the projections to account for any changes in included majors. To build our projections for hairdressers, hairstylists, and cosmetologists, we used a workforce participation rate of 79 percent, which corresponds to our adjusted workforce participation rate, based on BLS data on those with some college and associate’s degrees. For our projected number of graduates with the relevant certificates, we averaged four measures of projections. We first projected the total number of graduates for 2012 to 2020 using an ordinary least squares regression line based off the 2000 to 2011 data set. Second, we averaged the percent changes between each year from 2000 to 2011, and applied that average to 2012 to 2020. Third, we projected the number of graduates without including the historical data that may have included slightly different certificate programs before the newer CIP codes. Specifically, the number of graduates increased significantly between 2002 and 2003 for the CIP codes that corresponded, so we also projected growth without using those data points. Fourth, we projected the number of graduates using the average percentage method, but not including the percentage changes from 2009, 2010, and 2011 in our average. Finally, we averaged the results of these four projection methods.
50
Appendix I: Elementary School Teachers Projections 2010 CIP Codes Applied to Elementary School Teacher Supply – IPEDS Data, First Major, All Wisconsin Institutions Bachelor’s Degrees 13.1202 – Elementary Education and Teaching Master’s Degrees 13.1202 – Elementary Education and Teaching In years using older versions of the CIP codes, we adapted the categories to match the set of 2010 CIP code majors and degrees in the most logical manner. Using the total number of degrees awarded for these comparable CIP codes, we adjusted the included CIP codes and the projections to account for any changes in included majors. To determine the workforce participation rate, we used the participation rate for recent bachelor’s degrees (84.5 percent). Master’s degree earners are not included in Table 11 because of concern that these individuals might be double counted. That is, those earning master’s degrees may already be elementary school teachers in Wisconsin. However, we did calculate and project master’s degree earners for the purpose of sensitivity analysis. Our projections were developed using two methods. First, we built a regression model on 2000 to 2011 data and extrapolated using that equation. Second, we determined the average percent change between each year from 2000 to 2011 and used that average percent change to project forward into the years 2012 to 2020. We then averaged the values of those two projection methods to determine the final projection estimate.

51
Appendix J: Middle and High School Teachers Projections 2010 CIP Codes Applied to Elementary School Teacher Supply – IPEDS Data, First Major, All Wisconsin Institutions Bachelor’s Degrees 13.1205 – Secondary Education and Teaching 13.1206 – Teacher Education, Multiple Levels 13.1331 – Speech Teacher Education 13.1330 – Spanish Language Teacher Education 13.1318 – Social Studies Teacher Education 13.1317 – Social Science Teacher Education 13.1205 – Secondary Education and Teaching 13.1316 – Science Teacher Education/General Science Teacher Education 13.1310 – Sales & Marketing Oper/Marketing & Distribution Teacher Education 13.1335 – Psychology Teacher Education 13.1314 – Physical Education Teaching and Coaching 13.1312 – Music Teacher Education 13.1311 – Mathematics Teacher Education 13.1203 – Junior High/Intermediate/Middle School Education and Teaching 13.1328 – History Teacher Education 13.1307 – Health Teacher Education 13.1326 – German Language Teacher Education 13.1325 – French Language Teacher Education 13.1305 – English/Language Arts Teacher Education 13.01 – Education-General 13.1324 – Drama and Dance Teacher Education 13.1321 – Computer Teacher Education 13.1323 – Chemistry Teacher Education 13.1322 – Biology Teacher Education 13.02 – Bilingual, Multilingual, and Multicultural Education 13.1302 – Art Teacher Education Master’s Degrees 13.1205 – Secondary Education and Teaching 13.1316 – Science Teacher Education/General Science Teacher Education 13.1315 – Reading Teacher Education 13.1312 – Music Teacher Education 13.1311 – Mathematics Teacher Education 13.1307 – Health Teacher Education 13.01 – Education-General 13.1304 – Driver and Safety Teacher Education 13.1321 – Computer Teacher Education 13.1302 – Art Teacher Education
In years using older versions of the CIP codes, we adapted the categories to match the set of 2010 CIP code majors and degrees in the most logical manner. Using
52
the total number of degrees awarded for these comparable CIP codes, we adjusted the included CIP codes and the projections to account for any changes in the included majors. To determine the workforce participation rate, we used the participation rate for recent bachelor’s degrees (84.5 percent). Master’s degree earners are not included in Table 11 because of concern that these individuals might be double counted. That is, those earning master’s degrees may already be elementary school teachers in Wisconsin. However, we did calculate and project master’s degree earners for the purpose of sensitivity analysis. Our projections were developed using two methods. First, we built a regression model on 2000 to 2011 data and extrapolated using that equation. Second, we determined the average percent change between each year from 2000 to 2011 and used that average percent change to project forward into the years 2012 to 2020. We then averaged the values of those two projection methods to determine the final projection estimate.
53
Appendix K: Accountants and Auditors Projections 2010 CIP Codes Applied to Accountants and Auditors Supply – IPEDS Data, First and Second Major, All Wisconsin Institutions Bachelor’s Degrees 52.03 – Accounting and Related Services In years using older versions of the CIP codes, we adapted the categories to match the set of 2010 CIP code majors and degrees in the most logical manner. Using the total number of degrees awarded for these comparable CIP codes, we adjusted the included CIP codes and the projections to account for any changes in included majors. To build our projections for accountants and auditors, we used a workforce participation rate of 84.5 percent, which corresponds to the workforce participation rate of recent graduates with bachelor’s degrees. Our projections were developed using two methods. First, we built a regression model on 2000 to 2011 data and extrapolated using that equation. Second, we determined the average percent change between each year from 2000 to 2011 and used that average percent change to project forward into the years 2012 to 2020. We then averaged the values of those two projection methods to determine the final projection estimate.
54
Appendix L: Nursing Aides, Orderlies, and Attendants Projections 2010 CIP Codes Applied to Nursing Aides, Orderlies, and Attendants Supply – IPEDS Data, First and Second Major, All Wisconsin Institutions Award of Less Than One Academic Year 51.26 – Health Aides/Attendants/Orderlies 51.3902 – Nursing Assistant/Aide and Patient Care Assistant/Aide In years using older versions of the CIP codes, we adapted the categories to match the set of 2010 CIP code majors and degrees in the most logical manner. Using the total number of degrees awarded for these comparable CIP codes, we adjusted the included CIP codes and the projections to account for any changes in the included majors. A complete list is available on request. To build our projections for nursing aides, orderlies, and attendants, we used a workforce participation rate of 79.0 percent, which is our estimated participation rate for recent graduates with associate’s degrees or some college. For our projected number of graduates with the relevant post-secondary certificates, we averaged four measures of projections. We first projected the total number of graduates for 2012 to 2020 using an ordinary least squares regression line based off the 2000 to 2011 data set. Second, we averaged the percent changes between each year from 2000 to 2011 and applied that average increase to 2012 to 2020. Third, we projected the number of graduates without including the historical data that may have been influenced by the recessions on either end of the 2000 to 2011 decade, which may have encouraged more workers to seek a degree. Specifically, we projected using a regression model which was built without including the years 2000 to 2002 and 2009 to 2011. Fourth, we projected the number of graduates using the average percentage method but not including the years 2000 to 2002 and 2009 to 2011 in our average. Finally, we averaged the results of these four projection methods.
55
Appendix M: Human Resources, Labor Relations, and Training Specialists Projections 2010 CIP Codes Applied to Human Resources, Labor Relations, and Training Specialists Supply – IPEDS Data, First and Second Major, All Wisconsin Institutions Bachelor’s Degrees 52.10 – Human Resources Management and Services In years using older versions of the CIP codes, we adapted the categories to match the set of 2010 CIP code majors and degrees in the most logical manner. Using the total number of degrees awarded for these comparable CIP codes, we adjusted the included CIP codes and the projections to account for any changes in the included majors. To build our projections for human resources, labor relations, and training specialists, we used a workforce participation rate of 84.5 percent, which corresponds to the workforce participation rate of recent graduates with bachelor’s degrees. Our projections were developed using two methods. First, we built a regression model on 2000 to 2011 data and extrapolated using that equation. Second, we determined the average percent change between each year from 2000 to 2011 and used that average percent change to project forward into the years 2012 to 2020. We then averaged the values of those two projection methods to determine the final projection estimate.
56
Appendix N: Computer and Information Systems Workers Projections 2010 CIP Codes Applied to Computer and Information Systems Workers Supply – IPEDS Data, First and Second Major, All Wisconsin Institutions Bachelor’s Degrees 11.01 – Computer and Information Sciences- General 11.02 – Computer Programming 11.04 – Information Science/Studies 11.05 – Computer Systems Analysis 11.07 – Computer Science 11.08 – Computer Software and Media Applications 11.09 – Computer Systems Networking and Telecommunications 11.10 – Computer/Information Technology Administration and Management Occupations included in demand calculations, listed by DWD title:
Computer systems analysts Network and computer systems architects and administrators Software developers, applications Computer programmers Information security analysts, web developers, and computer network
architects Computer and information systems managers Database administrators Software developers, systems software
In years using older versions of the CIP codes, we adapted the categories to match the set of 2010 CIP code majors and degrees in the most logical manner. Using the total number of degrees awarded for these comparable CIP codes, we adjusted the included CIP codes and the projections to account for any changes in included majors. We assumed a workforce participation rate of 84.5 percent, which is the estimated participation rate for recent graduates holding a bachelor’s degree. Our projections were developed using two methods. First, we built a regression model on 2000 to 2011 data and extrapolated using that equation. Second, we determined the average percent change between each year from 2000 to 2011 and used that average percent change to project forward into the years 2012 to 2020. We then averaged the values of those two projection methods to determine the final projection estimate.
57
References Autor, David. 2010, April. The Polarization of Job Opportunities in the U.S. Labor Market. Washington, DC: The Center for American Progress and The Hamilton Project. Retrieved from http://economics.mit.edu/files/5554 Baker, Dean. 2012, October. The Problem with Structural Unemployment in the U.S. Issue Brief. Washington, DC: Center for Economic and Policy Research. Retrieved from http://www.cepr.net/documents/publications/structural-unemployment-2012-10.pdf Business Cycle Dating Committee. 2010, September 20. Cambridge, MA: National Bureau of Economic Research. Retrieved from http://www.nber.org/cycles/sept2010.html Burtless, Gary. 2012. Long-Term Unemployment: Anatomy of the Scourge. The Milken Institute Review, third quarter 2012. Retrieved from http://www.brookings.edu/research/articles/2012/07/longterm-unemployment-burtless Capelli, Peter. 2012, October 24. Why Companies Aren’t Getting the Employees They Need. The Wall Street Journal. Retrieved from http://online.wsj.com/article/SB10001424052970204422404576596630897409182.html Center on Wisconsin Strategy. 2012, March. Wisconsin Jobs and Low-Income Working Families: Toward Stronger Standards, Skills, and Supports. University of Wisconsin-Madison. Retrieved from http://www.cows.org/wisconsin-jobs-and-low-income-working-families Chronicle of Higher Education. n.d. College Completion: Wisconsin Public Colleges (2-year). Washington, D.C. Retrieved from http://collegecompletion.chronicle.com/state/#state=wi§or=public_two Competitive Wisconsin. 2012, October. Be Bold 2: Growing Wisconsin’s Talent Pool. Retrieved from http://www.competitivewi.com/wp-content/uploads/2012/10/BeBold2_Study_October2012.pdf Davidson, Adam. 2012, November 20. Skills Don’t Pay the Bills. The New York Times. Retrieved from http://www.nytimes.com/2012/11/25/magazine/skills-dont-pay-the-bills.html?pagewanted=all&_r=0 Dresser, Laura and Joel Rogers. 2001, September 2. Working Wisconsin: Update 2001. University of Wisconsin-Madison. Retrieved from http://www.cows.org/_data/documents/988.pdf
58
Dresser, Laura and Joel Rogers. 2006, September 2. The State of Working Wisconsin, 2006. University of Wisconsin-Madison. Retrieved from http://www.cows.org/_data/documents/1068.pdf
Dresser, Laura, Joel Roger, Edo Navot, and Matías Cociña. 2012, September 2. The State of Working Wisconsin, 2012. University of Wisconsin-Madison. Retrieved from http://www.cows.org/the-state-of-working-wisconsin-2012
Elsby, Michael W.L., Bart Hobijn, Ayşegül Şahin, and Robert G. Valletta. 2011, October 24. The Labor Market in the Great Recession: An Update. Federal Reserve Bank of San Francisco Working Paper Series, No. 2011-29. Retrieved from http://www.frbsf.org/publications/economics/papers/2011/wp11-29bk.pdf
Federal Reserve Bank of St. Louis. 2013. Economic Data: FRED Graph. Retrieved from http://research.stlouisfed.org/fred2/graph/?id=LNS11327662,LNS11327660,LNS11327689,LNS11327659,# in March 2013
GED Academy. 2011. Wisconsin GED Testing. Corvallis, OR: Essential Education Corporation. Retrieved from http://www.passged.com/WI-GED-Testing.php
Herzog, Karen. 2012, October 5. Out-of-state students keep UW system enrollment level. The Milwaukee Journal-Sentinel. Retrieved from http://www.jsonline.com/news/education/outofstate-students-keep-uw-system-enrollment-level-li74hur-172926901.html
Holzer, Harry J. 2013, January. Good Workers for Good Jobs: Improving Education and Workforce Systems in the US. Madison, WI: Institute for Research on Poverty Discussion Paper 1404-13. Retrieved from http://www.irp.wisc.edu/publications/dps/pdfs/dp140413.pdf
Institute for Education Sciences (IES). n.d.a. About IPEDS. National Center for Education Statistics. Washington, DC: U.S. Department of Education. Retrieved from http://nces.ed.gov/ipeds/about/
Institute for Education Sciences (IES). n.d.b . Download Custom Data Files. IPEDS Data Center. National Center for Education Statistics. Washington, DC: U.S. Department of Education. Retrieved from http://nces.ed.gov/ipeds/datacenter/InstitutionByName.aspx
Kim, Heather. 2010, November 4. University of Wisconsin System Alumni. Presentation slides. Madison, WI: University of Wisconsin System. Retrieved from http://www.wisconsin.edu/news/2010/11-2010/UW_System-Alumni.pdf
Lazear Edward P., and James R. Spletzer. 2012, September 1. The United States Labor Market: Status Quo or A New Normal? Presented at the Federal Reserve Bank of Kansas City Jackson Hole Symposium. Retrieved from http://www.kansascityfed.org/publicat/sympos/2012/el-js.pdf
59
Levine, Marc. 2013, February. The Skills Gap and Unemployment in Wisconsin: Separating Fact from Fiction. Milwaukee, WI: University of Wisconsin-Milwaukee Working Paper. Retrieved from http://www4.uwm.edu/ced/publications/skillsgap_2013-2.pdf
Minnesota Department of Employment and Economic Development. 2007. Understanding the Worker Needs of Manufacturers: The 2007 Skills Gap Survey. Retrieved from http://www.positivelyminnesota.com/Data_Publications/Data/Research_Reports/Manufacturing_Skills_Gap_Surveys/2007_Minnesota_Skills_Gap_Survey_Full_Report.pdf
National Association of Manufacturers. 2005. 2005 Skills Gap Report – A Survey of the American Manufacturing Workforce. Washington, DC: Deloitte Development. Retrieved from http://www.themanufacturinginstitute.org/~/media/738F5D310119448DBB03DF30045084EF/2005_Skills_Gap_Report.pdf
National Skills Coalition. 2013, February. Disinvesting in the Skills of Wisconsin’s Workforce. Retrieved from http://www.nationalskillscoalition.org/resources/reports/state-by-state-sequester-reports/nsc_sequestration-state-issue_51.pdf
Office of Economic Advisors (OEA). 2012, September. Wisconsin’s WORKnet Occupation Projections. Madison, WI: Department of Workforce Development, Wisconsin. Retrieved from
http://worknet.wisconsin.gov/worknet/datablelist.aspx?menuselection=da Public Policy Forum. 2012. Wisconsin’s Workforce Development System. Retrieved from http://publicpolicyforum.org/sites/default/files/2012WorkforceMap.pdf Quinn, Lois M. and John Parasawat. 2011. Attempted Reform of the GED Credential in Wisconsin. Milwaukee, WI: University of Wisconsin-Milwaukee Employment Training Institute. Retrieved from http://www4.uwm.edu/eti/2011/WisconsinChapter2011.pdf Rampell, Catherine. 2013, February 19. It Takes a B.A. to Find a Job as a File Clerk. The New York Times. Retrieved from http://www.nytimes.com/2013/02/20/business/college-degree-required-by-increasing-number-of-companies.html Şahin, Ayşegül, Joseph Song, Giorgio Topa, and Giovanni Violante. 2012, September. Mismatch Unemployment. Federal Reserve Bank of New York. Retrieved from http://www.newyorkfed.org/research/economists/sahin/USmismatch.pdf
60
Schmitt, John and Janelle Jones. 2012, March. Long-term Hardship in the Labor Market. Center for Economic and Policy Research. Retrieved from http://www.cepr.net/documents/publications/long-term-hardship-2012-03.pdf
Skills2Compete-Wisconsin. 2009, October. Wisconsin’s Forgotten Middle-Skills Jobs. The Workforce Alliance, The Center on Wisconsin Strategy, The Workforce Development Board of South Central Wisconsin. Retrieved from http://www.cows.org/_data/documents/1132.pdf
Spreen, Thomas Luke. 2013, February. Recent college graduates in the U.S. labor force: data from the Current Population Survey. Monthly Labor Review, 136, 2. United States Bureau of Labor Statistics. Retrieved from http://www.bls.gov/opub/mlr/2013/02/art1full.pdf
Sullivan, Tim. 2012, August. The Road Ahead: Restoring Wisconsin’s Workforce Development. Special Consultant to the Governor on Economic, Workforce and Education Development. Retrieved from http://doa.wi.gov/secy/documents/sullivanreport.pdf
Taschler, Joe. 2012, January 25. Marketing campaign aims to recruit factory workers. The Milwaukee Journal Sentinel. Retrieved from http://www.jsonline.com/business/marketing-campaign-aims-to-recruit-factory-workers-fv3ukjp-138056848.html
United States Bureau of Economic Analysis. 2013, March 27. Regional Economic Information System. Washington, DC: United States Department of Commerce. Retrieved from http://www.bea.gov/regional/index.htm on April 27, 2013
United States Bureau of Labor Statistics. n.d. Consumer Price Index. Washington, DC: United States Department of Labor. Retrieved from http://www.bls.gov/cpi/#data
United States Bureau of Labor Statistics. 2013a. Labor Force Statistics from the Current Population Survey, Series Id: LNS14000000. Washington, DC: United States Department of Labor. Retrieved from http://data.bls.gov/timeseries/LNS14000000
United States Bureau of Labor Statistics. 2013b. Local Area Unemployment Statistics, Series Id: LASST55000003. Washington, DC: United States Department of Labor. Retrieved from http://data.bls.gov/timeseries/LASST55000003
United States Bureau of Labor Statistics. 2013c, March 29. May 2012 State Occupational Employment and Wage Estimates, Wisconsin. Washington, DC: United States Department of Labor. Retrieved from http://www.bls.gov/oes/current/oes_wi.htm#15-0000
United States Bureau of Labor Statistics. 2013d, March 29. Occupational Employment and Wages, May 2012. Washington, DC: United States Department of Labor. Retrieved from http://www.bls.gov/oes/current/oes150000.htm
61
United States Census Bureau. 2000. Equal Opportunity Employment Tabulations, 2000. Retrieved from http://www.census.gov/mp/www/cat/decennial_census_2000/census_2000_special_equal_employment_opportunity_eeo_tabulation.html
United States Census Bureau. 2011. American Community Survey. American FactFinder: 2007-2011 American Community Survey 5-year Estimates, Geographical Mobility In The Past Year By Age For Residence 1 Year Ago In The United States. Retrieved from http://factfinder2.census.gov/faces/tableservices/jsf/pages/productview.xhtml?pid=ACS_11_5YR_B07401&prodType=table
United States Census Bureau. 2013a. Equal Opportunity Employment Tabulations, 2006-2010. Retrieved from http://www.census.gov/people/eeotabulation/data/eeotables20062010.html in March 2013
United States Census Bureau. 2013b. State & County QuickFacts: Wisconsin. Retrieved from http://quickfacts.census.gov/qfd/states/55000.html on April 27, 2013
United States Census Bureau. 2013c. State-to-State Migration Flows. Retrieved from http://www.census.gov/hhes/migration/data/acs/state-to-state.html
United States Department of Labor. 2009, October. Workforce Investment Act Laws and Regulations. Washington, DC. Retrieved from http://www.doleta.gov/usworkforce/wia/act.cfm
University of Wisconsin System. 2010, April 5. UW System aims to provide More Graduates for Wisconsin. News Release. Retrieved from http://www.wisconsin.edu/news/2010/r100405.htm
University of Wisconsin System. 2012a, November. Informational Memorandum: Retention and Graduation, 2011-2012. Retrieved from http://www.uwsa.edu/opar/orb-im/im/ret_grad/rg11-12.pdf
University of Wisconsin System. 2012b. Investing in Wisconsin’s Future: UW System’s Growth Agenda Accountability Report, 2011-12. Madison, WI. Retrieved from http://www.uwsa.edu/opar/accountability/invest12/sys.pdf
University of Wisconsin System. 2013. Wisconsin High School Graduate Projections. Office of Policy Analysis and Research. Retrieved from http://www.wisconsin.edu/opar/reports/projections/
Valetta, Rob. 2013, February 4. Long-term Unemployment: What Do We Know? Federal Reserve Bank of San Francisco Economic Letter 2013-03. Retrieved from http://www.frbsf.org/publications/economics/letter/2013/el2013-03.html
62
Winters, Dennis, Beverly Gehrke, Eric Grosso, and Victoria Udalova. 2009, December. The Impact of Population Aging on Wisconsin’s Labor Force. Madison, WI: Office of Economic Advisors, Wisconsin Department of Workforce Development. Retrieved from http://worknet.wisconsin.gov/worknet_info/articles/impact_of_aging_population_paper12-2009.pdf
Wisconsin Department of Administration. 2013. Governor’s Budget Recommendations Department of Health Services. Retrieved from http://www.doa.state.wi.us/debf/docview.asp?budid=76
Wisconsin Department of Children and Families. n.d. Wisconsin Works (W-2) Agency Locator Home. Retrieved from http://dcf.wisconsin.gov/w2/locator/w2locator.htm
Wisconsin Department of Children and Families. 2013. Wisconsin Works (W-2) and Other Programs Home Page. Retrieved from http://dcf.wisconsin.gov/w2/
Wisconsin Department of Public Instruction. n.d.a. CTE Data Resources. Retrieved from http://cte.dpi.wi.gov/cte_dataresources
Wisconsin Department of Public Instruction. n.d.b. What are Students’ Postgraduation Plans? Retrieved from http://data.dpi.state.wi.us/data/PostGradIntentPage.aspx?GraphFile=BlankPageUrl&SCounty=47&SAthleticConf=45&SCESA=05&OrgLevel=st&Qquad=performance.aspx
Wisconsin Department of Public Instruction. 2013a, January. 2012 Wisconsin Statewide Summary of Post High School Outcomes Survey of 2010-2011 Exiters with Disabilities. Retrieved from http://www.posthighsurvey.org/documents/2012/2012_WPHSOS_StatewideSummaryReport_10Jan2013.pdf
Wisconsin Department of Public Instruction. 2013b, February. Learning that Works for Wisconsin CTE. Retrieved from http://cte.dpi.wi.gov/files/cte/pdf/ctebrochure.pdf
Wisconsin Department of Public Instruction. 2013c, February. Why Career and Technical Education? Retrieved from http://cte.dpi.wi.gov/files/cte/pdf/whycte.pdf
Wisconsin Department of Public Instruction. 2013d, January 24. Wisconsin a leader in public high school graduation rate. News release. Retrieved from http://dpi.wi.gov/files/eis/pdf/dpinr2013_15.pdf
Wisconsin Department of Workforce Development (WDWD). n.d. Wisconsin WIA Administration by Workforce Development Area (WDA)/Workforce Investment Board Number. Retrieved from http://dwd.wisconsin.gov/dwdwia/pdf/wda_list.pdf
63
Wisconsin Department of Workforce Development (WDWD). 2011, March 9. January Jobs, Unemployment Numbers Announced; Labor Demand Increasing. Press Release. Retrieved from http://dwd.wisconsin.gov/dwd/newsreleases/2011/unemployment/110309_january_state.pdf
Wisconsin Department of Workforce Development (WDWD). 2012a, August 16. Wisconsin Employment & Unemployment Estimates Announced: June Revised, July Preliminary. Press Release. Retrieved from http://dwd.wisconsin.gov/dwd/newsreleases/2012/unemployment/120816_july_state.pdf
Wisconsin Department of Workforce Development (WDWD). 2012b, January 19. Wisconsin December Unemployment Rate Drops To 7.1 Percent. Press Release. Retrieved from http://dwd.wisconsin.gov/dwd/newsreleases/2012/unemployment/120119_december_state.pdf
Wisconsin Department of Workforce Development (WDWD). 2013, March. Governor Walker Addressing Skills Gap, Making Strategic Workforce Investments to Help Workers Join Ranks of Nation’s Most Prosperous. Press Release. Retrieved from http://dwd.wisconsin.gov/dwd/newsreleases/2013/130306_addressing_skills_gap.pdf
Wisconsin Legislative Council. 2013, February. Amendment Memo, 2013 Assembly Bill 14, Assembly Amendment 1. Retrieved from https://docs.legis.wisconsin.gov/2013/related/lcamendmemo/ab14
Wisconsin Legislative Fiscal Bureau. 2011a, January. University of Wisconsin System Overview. Informational Paper 35. Retrieved from http://legis.wisconsin.gov/lfb/publications/Informational-Papers/Documents/2011/35_UW%20Overview.pdf
Wisconsin Legislative Fiscal Bureau. 2011b, January. Wisconsin Technical College System. Informational Paper 34. Retrieved from http://legis.wisconsin.gov/lfb/publications/Informational-Papers/Documents/2011/34_Wisconsin%20Technical%20College%20System.pdf
Wisconsin Legislative Fiscal Bureau. 2011c, July. 2011-13 Budget Summary Information. Retrieved from http://legis.wisconsin.gov/lfb/publications/budget/2011-13-Budget/Documents/2011_07_05%20tables%20and%20charts.pdf
Wisconsin Legislative Fiscal Bureau. 2013a, January. State Aid to School Districts. Retrieved from http://legis.wisconsin.gov/lfb/publications/Informational-Papers/Documents/2013/24_State%20Aid%20to%20School%20Districts.pdf
64
Wisconsin Legislative Fiscal Bureau. 2013b, January. University of Wisconsin System Overview. Retrieved from http://legis.wisconsin.gov/lfb/publications/Informational-Papers/Documents/2013/33_UW%20overview.pdf
Wisconsin Legislative Fiscal Bureau. 2013c, January. Wisconsin Technical College System. Retrieved from http://legis.wisconsin.gov/lfb/publications/Informational-Papers/Documents/2013/32_WTCS.pdf
Wisconsin State Legislature. 2013a. 2013 Assembly Bill 14. Retrieved from https://docs.legis.wisconsin.gov/2013/related/proposals/ab14
Wisconsin State Legislature. 2013b. 2013 Assembly Bill 40. Retrieved from https://docs.legis.wisconsin.gov/2013/related/proposals/ab40
Wisconsin Technical College System [WTCS]. 2008. Graduate Report. Retrieved from: http://marketingresources.witechcolleges.org/advocacy_tools/grad_Report.pdf
Wisconsin Technical College System [WTCS]. 2009. 2008 Graduate Follow-Up Report. Retrieved from: http://www.wtcsystem.edu/reports/data/graduate/pdf/complete_report_2008.pdf
Wisconsin Technical College System [WTCS]. 2010. 2009 Graduate Follow-Up Report. Retrieved from: http://www.wtcsystem.edu/reports/data/graduate/pdf/complete_report_2009.pdf
Wisconsin Technical College System [WTCS]. 2011. 2010 Graduate Follow-Up Report. Retrieved from: http://www.wtcsystem.edu/reports/data/graduate/pdf/complete_report_2010.pdf
Wisconsin Technical College System. 2012a. What We Do. Retrieved from http://www.wtcsystem.edu/do.htm
Wisconsin Technical College System. 2012b. 2011 Graduate Follow-Up Report. Retrieved from: http://www.wtcsystem.edu/reports/data/graduate/pdf/complete_report.pdf
Zervakis, Pete. 2013, January 20. Wisconsin Dems, GOP Agree on Need to Close “Skills Gap.” WXOW. Retrieved from http://www.wxow.com/story/20636363/2013/01/20/wisconsin-dems-gop-agree-on-need-to-close-skills-gap