Embed Size (px)
Citation preview

Solid Earth, 7, 311–321, 2016
www.solid-earth.net/7/311/2016/
doi:10.5194/se-7-311-2016
© Author(s) 2016. CC Attribution 3.0 License.
Examining the fixation kinetics of chelated and non-chelated
copper and the applications to micronutrient management
in semiarid alkaline soils
T. K. Udeigwe1, M. B. Eichmann1,2, M. C. Menkiti3, and N. Y. O. Kusi1
1Department of Plant and Soil Science, Texas Tech University, Lubbock, Texas 79409, USA2Albrecht Daniel Thaer-Institut für Agrar- und Gartenbauwissenschaften, Humboldt University Berlin,
Unter den Linden 6, 10099 Berlin, Germany3Department of Chemical Engineering, Nnamdi Azikiwe University, Awka, Nigeria
Correspondence to: T. K. Udeigwe ([email protected])
Received: 11 September 2015 – Published in Solid Earth Discuss.: 15 October 2015
Revised: 30 December 2015 – Accepted: 12 January 2016 – Published: 24 February 2016
Abstract. This study examined and compared the fixation
and fixation kinetics of copper (Cu) in chelated (ethylene di-
amine tetraacetic acid, EDTA) and non-chelated mixed sys-
tems of micronutrients in the semiarid soils of the Southern
High Plains, USA, using findings from Cu extraction studies
and kinetic models. Approximately, 22 % more Cu was fixed
in the non-chelated system compared to the chelated within
the first 14 days with only 7 % difference between the two
systems by day 90. Findings suggest a decrease in the effec-
tiveness of chelated micronutrients over time, highlighting
the significance of timing even when chelated micronutri-
ents are used. The strengths of the relationship of change in
available Cu with respect to other micronutrients (iron (Fe),
manganese (Mn), and zinc (Zn)) were higher in the non-
chelated system (R2: 0.68–0.94), compared to the chelated
(R2: 0.42–0.81), with slopes of 0.40 (Cu–Fe), 0.31 (Cu–Mn),
and 1.04 (Cu–Zn) in the non-chelated system and 0.26 (Cu–
Fe), 0.22 (Cu–Mn), and 0.90 (Cu–Zn) in the chelated system.
Reduction in the amount of available Cu was best described
by the power function model (R2= 0.91, SE= 0.081) in
the non-chelated system and second-order model (R2= 0.95,
SE= 0.010) in the chelated system. The applications gener-
ated from this study could be used as tools for improved mi-
cronutrient management and also provide baseline data for
future work in other semiarid/arid alkaline soils of the world.
Findings are also more applicable to field settings, an im-
provement over related previous studies.
1 Introduction
Malnutrition resulting from lack of adequate micronutrients
in foods, a situation that could be partly attributed to the ease
of micronutrient fixation in soil systems, contributes signif-
icantly to the global burden of disease (WHO, 2000). The
fate of the plant-available portion of micronutrients is con-
trolled by a number of soil factors including soil pH, or-
ganic matter (OM), texture, aeration status, calcium carbon-
ate (CaCO3), iron (Fe) oxides, and interaction with other mi-
cronutrients, etc. (Havlin et al., 2013; Fernández-Calviño et
al., 2013). Plant availability of micronutrients could be a big-
ger challenge in calcareous or alkaline soils due to their high
pH (Rashid and Ryan, 2004; Alloway, 2008). High soil pH
leads to decreased solubility and increased fixation of most
micronutrients such as copper (Cu), zinc (Zn), Fe, and man-
ganese (Mn) in such soils, leading to reduction in the plant-
available portion (Sparks, 2003; Havlin et al., 2013). For Cu,
apart from pH, reduction in availability resulting from its
interaction with OM functional groups, particularly in soils
treated with organic amendments such as animal manure and
biosolids, has also been well documented (De Schamphe-
laere et al., 2004; Pinto et al., 2004). Its availability has also
been reported to increase with soil OM (under moderate OM
level) and clay content, and to decrease with an increase in
pH and CaCO3 (Alloway, 2008). Interactions among nutri-
ents resulting in antagonism are also common (Dimkpa et
al., 2013; Havlin et al., 2013; Bindraban et al., 2015), for
instance, plant uptake of Cu is shown to be reduced by ele-
Published by Copernicus Publications on behalf of the European Geosciences Union.
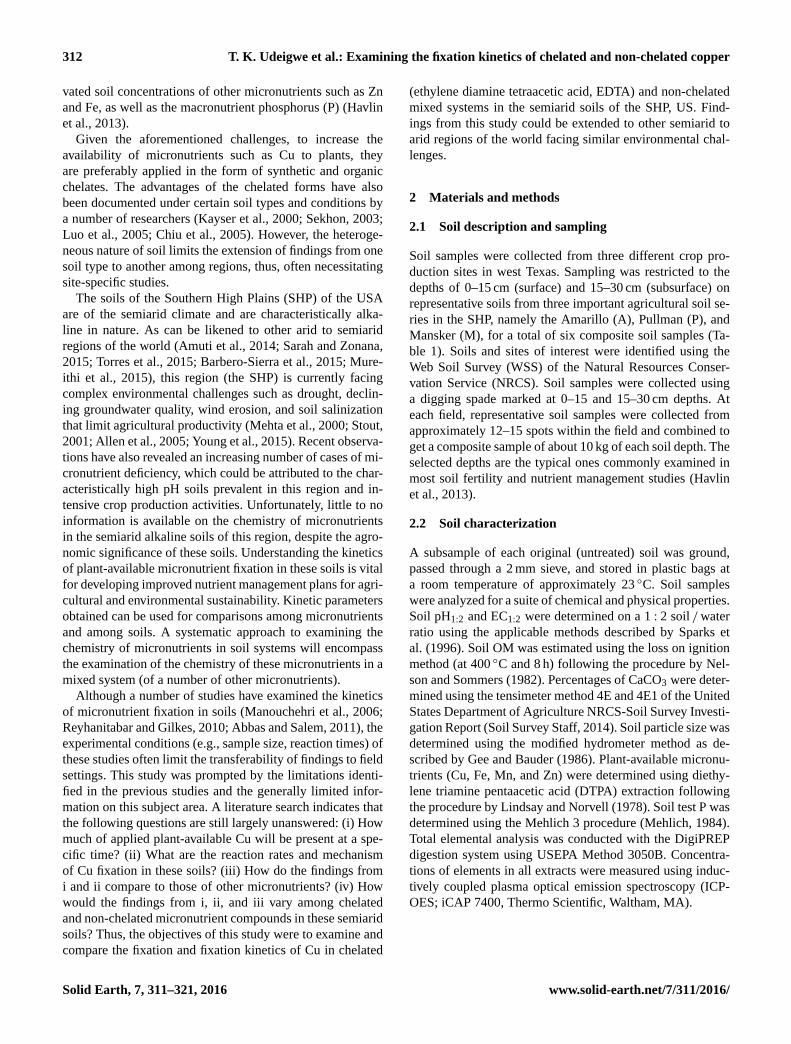
312 T. K. Udeigwe et al.: Examining the fixation kinetics of chelated and non-chelated copper
vated soil concentrations of other micronutrients such as Zn
and Fe, as well as the macronutrient phosphorus (P) (Havlin
et al., 2013).
Given the aforementioned challenges, to increase the
availability of micronutrients such as Cu to plants, they
are preferably applied in the form of synthetic and organic
chelates. The advantages of the chelated forms have also
been documented under certain soil types and conditions by
a number of researchers (Kayser et al., 2000; Sekhon, 2003;
Luo et al., 2005; Chiu et al., 2005). However, the heteroge-
neous nature of soil limits the extension of findings from one
soil type to another among regions, thus, often necessitating
site-specific studies.
The soils of the Southern High Plains (SHP) of the USA
are of the semiarid climate and are characteristically alka-
line in nature. As can be likened to other arid to semiarid
regions of the world (Amuti et al., 2014; Sarah and Zonana,
2015; Torres et al., 2015; Barbero-Sierra et al., 2015; Mure-
ithi et al., 2015), this region (the SHP) is currently facing
complex environmental challenges such as drought, declin-
ing groundwater quality, wind erosion, and soil salinization
that limit agricultural productivity (Mehta et al., 2000; Stout,
2001; Allen et al., 2005; Young et al., 2015). Recent observa-
tions have also revealed an increasing number of cases of mi-
cronutrient deficiency, which could be attributed to the char-
acteristically high pH soils prevalent in this region and in-
tensive crop production activities. Unfortunately, little to no
information is available on the chemistry of micronutrients
in the semiarid alkaline soils of this region, despite the agro-
nomic significance of these soils. Understanding the kinetics
of plant-available micronutrient fixation in these soils is vital
for developing improved nutrient management plans for agri-
cultural and environmental sustainability. Kinetic parameters
obtained can be used for comparisons among micronutrients
and among soils. A systematic approach to examining the
chemistry of micronutrients in soil systems will encompass
the examination of the chemistry of these micronutrients in a
mixed system (of a number of other micronutrients).
Although a number of studies have examined the kinetics
of micronutrient fixation in soils (Manouchehri et al., 2006;
Reyhanitabar and Gilkes, 2010; Abbas and Salem, 2011), the
experimental conditions (e.g., sample size, reaction times) of
these studies often limit the transferability of findings to field
settings. This study was prompted by the limitations identi-
fied in the previous studies and the generally limited infor-
mation on this subject area. A literature search indicates that
the following questions are still largely unanswered: (i) How
much of applied plant-available Cu will be present at a spe-
cific time? (ii) What are the reaction rates and mechanism
of Cu fixation in these soils? (iii) How do the findings from
i and ii compare to those of other micronutrients? (iv) How
would the findings from i, ii, and iii vary among chelated
and non-chelated micronutrient compounds in these semiarid
soils? Thus, the objectives of this study were to examine and
compare the fixation and fixation kinetics of Cu in chelated
(ethylene diamine tetraacetic acid, EDTA) and non-chelated
mixed systems in the semiarid soils of the SHP, US. Find-
ings from this study could be extended to other semiarid to
arid regions of the world facing similar environmental chal-
lenges.
2 Materials and methods
2.1 Soil description and sampling
Soil samples were collected from three different crop pro-
duction sites in west Texas. Sampling was restricted to the
depths of 0–15 cm (surface) and 15–30 cm (subsurface) on
representative soils from three important agricultural soil se-
ries in the SHP, namely the Amarillo (A), Pullman (P), and
Mansker (M), for a total of six composite soil samples (Ta-
ble 1). Soils and sites of interest were identified using the
Web Soil Survey (WSS) of the Natural Resources Conser-
vation Service (NRCS). Soil samples were collected using
a digging spade marked at 0–15 and 15–30 cm depths. At
each field, representative soil samples were collected from
approximately 12–15 spots within the field and combined to
get a composite sample of about 10 kg of each soil depth. The
selected depths are the typical ones commonly examined in
most soil fertility and nutrient management studies (Havlin
et al., 2013).
2.2 Soil characterization
A subsample of each original (untreated) soil was ground,
passed through a 2 mm sieve, and stored in plastic bags at
a room temperature of approximately 23 ◦C. Soil samples
were analyzed for a suite of chemical and physical properties.
Soil pH1:2 and EC1:2 were determined on a 1 : 2 soil /water
ratio using the applicable methods described by Sparks et
al. (1996). Soil OM was estimated using the loss on ignition
method (at 400 ◦C and 8 h) following the procedure by Nel-
son and Sommers (1982). Percentages of CaCO3 were deter-
mined using the tensimeter method 4E and 4E1 of the United
States Department of Agriculture NRCS-Soil Survey Investi-
gation Report (Soil Survey Staff, 2014). Soil particle size was
determined using the modified hydrometer method as de-
scribed by Gee and Bauder (1986). Plant-available micronu-
trients (Cu, Fe, Mn, and Zn) were determined using diethy-
lene triamine pentaacetic acid (DTPA) extraction following
the procedure by Lindsay and Norvell (1978). Soil test P was
determined using the Mehlich 3 procedure (Mehlich, 1984).
Total elemental analysis was conducted with the DigiPREP
digestion system using USEPA Method 3050B. Concentra-
tions of elements in all extracts were measured using induc-
tively coupled plasma optical emission spectroscopy (ICP-
OES; iCAP 7400, Thermo Scientific, Waltham, MA).
Solid Earth, 7, 311–321, 2016 www.solid-earth.net/7/311/2016/

T. K. Udeigwe et al.: Examining the fixation kinetics of chelated and non-chelated copper 313
Table 1. Soil classification and identification of selected semiarid alkaline soils of the Southern High Plains, USA.
Soil series Sample Depth Sampling pH EC OM CaCO3 Clay Sand Silt Textural
(classification) ID (cm) location (dS m−1) (%) class
Amarillo
(fine-loamy, mixed, Aa 0–15 33.6058◦ N; 8.07 0.24 1.05 2.41 17.8 74.9 7.40 SL
superactive, thermic Ab 15–30 101.9073◦W 8.35 0.22 0.93 5.59 24.0 64.2 11.8 SCL
Aridic Paleustalfs)
Mansker
(coarse-loamy, Ma 0–15 34.1261◦ N; 8.12 0.27 1.63 0.98 27.9 56.5 15.6 SCL
carbonatic, thermic Mb 15–30 101.5899◦W 8.20 0.25 1.24 0.13 41.9 40.9 17.2 C
Calcidic Paleustolls)
Pullman (fine, mixed, Pa 0–15 34.05901◦ N; 7.52 0.22 1.56 2.34 32.8 39.9 27.3 CL
superactive, thermic Pb 15–30 101.4773◦W 8.02 0.24 1.57 4.16 33.0 38.7 28.3 CL
Torrertic Paleustolls)
SCL: sandy clay loam; SL: sandy loam; CL: clay loam; C: clay; EC: electrical conductivity; OM: organic matter.
2.3 Sample preparation and treatment application
Each composite soil sample was thoroughly mixed and a rep-
resentative portion taken to fill a 4 L plastic pot. Sorghum
(Sorghum bicolor) was then planted and grown over a pe-
riod of 35 days in the greenhouse with no nutrients added.
This practice was optional and primarily aimed at deplet-
ing the original micronutrient level of the soils prior to
treatment application. Following this practice, samples were
crushed, air dried, thoroughly mixed, ground, and passed
through a 2 mm sieve. Two sets of 250 g samples were
weighed from each soil. One set was treated with a mix-
ture of chelated (EDTA) micronutrients and the other with
a mixture of non-chelated micronutrients, using 80 mL solu-
tion of each fertilizer compound’s mixture, prepared in or-
der to add 5 mg of each micronutrient (Cu, Mn, Zn, and
Fe) to 1 kg of soil. The non-chelated micronutrient com-
pounds used were CuSO4.5H2O, MnSO4
.H2O, ZnSO4.H2O,
and FeSO4.7H2O, and the chelated compounds were Cu-
EDTA, Mn-EDTA, Zn-EDTA, and Fe-EDTA. There were a
total of six soil samples and two sets of micronutrient amend-
ments for a total of 12 soil-fertilizer treatments, each repli-
cated twice. Subsamples were taken from each treated sam-
ple at 2, 5, 7, 14, 21, 28, 35, 49, 63, 77, and 90 days af-
ter treatment and analyzed for plant-available micronutrients
using a DTPA extraction technique (Lindsay and Norvell,
1978). After each subsampling event, the remaining soil sam-
ples were wetted with water to approximately field capacity.
Within the first 7 days, the soils were wetted after each sub-
sampling; however, after the first 7 days, sampling was con-
ducted at 7–14 days intervals, so the soil samples were wa-
tered every 7 days. The periodic wetting of the soil was to
simulate the wetting and drying cycle obtainable under field
conditions and also provide a medium to facilitate chemical
reactions in the soil.
2.4 Extraction procedure
The preparation of DTPA extractant and the extraction
procedure followed the method described by Lindsay and
Norvell (1978), the most commonly used technique for ex-
tracting available micronutrient cations such as Fe, Mn, Cu,
and Zn (Liang and Karamanos, 1993). Briefly, 10 g of air-
dried soil were placed in a 50 mL plastic tube and 20 mL of
DTPA extracting solution was added. The tubes were placed
on a reciprocal shaker for 2 h at approximately 25 ◦C and
180 oscillations per minute. After shaking, samples were
centrifuged for 10 min at 4000 rpm, and the resulting solu-
tions were filtered into 16 mm borosilicate glass tubes us-
ing Whatman® 2 filter paper. Soil extraction was conducted
in duplicate. All filtrates were analyzed for Fe, Cu, Zn,
and Mn using ICP-OES (iCAP 7400, Thermo Scientific,
Waltham, MA) following USEPA Method 200.7 (USEPA-
ICP Users Group, 1982). Instrument calibration was per-
formed using standard reference materials and checked using
second source standards from a different vendor. Check sam-
ples were inserted after every 20–25 samples. The relative
percentage difference between duplicates was also examined
and 10 % was set as the acceptance standard.
2.5 Statistical analyses
Statistical analyses were performed using statistical analysis
software (SAS 9.4; SAS Institute, Cary, NC, USA). Where
applicable, differences among means were examined using
PROC GLM, and a mean comparison was conducted us-
ing Fisher’s Least Significance Difference test at α level of
0.05. The data obtained from the kinetic studies were fitted
to selected kinetic models (Table 6) to derive the needed pa-
rameters using the PROC NLIN procedure. Single linear re-
gression analyses used in examining changes in available Cu
www.solid-earth.net/7/311/2016/ Solid Earth, 7, 311–321, 2016

314 T. K. Udeigwe et al.: Examining the fixation kinetics of chelated and non-chelated copper
Table 2. Soil total element analysis of the studied semiarid alkaline soils (in mgkg−1) of the Southern High Plains, USA.
Series Soil ID Al B Ca Cu Fe K Mg Mn Mo P Pb Zn
Amarillo Aa 17 187 30.9 1823 5.50 11 946 2848 2537 170 1.00 375 41.1 44.5
Ab 13 823 31.7 4307 5.60 9623 2791 2205 144 0.90 197 34.8 41.6
Mansker Ma 13 808 35.1 21 008 6.10 9552 3004 2341 135 6.80 186 33.7 51.5
Mb 16 840 35.1 11 584 7.10 11 856 3554 3103 202 7.00 158 41.5 59.1
Pullman Pa 11 571 33.8 7252 6.10 8191 2926 2015 128 0.70 196 32.1 42.8
Pb 12 943 33.7 14 433 6.00 8964 3029 2199 130 0.70 215 33.4 41.6
Mean 14 362 33.4 10 068 6.07 10 022 3025 2400 152 2.85 221 36.1 46.9
Standard deviation 2215 1.74 7073 0.57 1544 274 386 29.1 3.14 77.6 4.12 7.05
with respect to other micronutrients were conducted using
the PROC REG procedure.
3 Results and discussions
3.1 Soil characteristics
Selected chemical and physical properties of the studied soils
are summarized in Table 1. Average soil pH was 8.05. Soil
pH was generally higher in the 15–30 cm depth by 0.08, 0.28,
and 0.50 pH units for the Mansker, Amarillo, and Pullman
soil series, respectively. The average soil OM content was
1.33 %, falling within a range of 0.93 to 1.57 % among soil
depths. These values are typical of the semiarid alkaline soils
of the SHP. Average soil EC value was 0.24 dS m−1, falling
within a narrow range of 0.22–0.27 dS m−1. The observed
soil EC values indicate that these agricultural soils are not
salt impacted. Calcium carbonate content varied from 0.13
to 5.59 % among depths and were almost twofold higher in
the 15–30 cm depth in the Amarillo and Pullman soils. Av-
erage clay contents within the 0–15 and 15–30 cm depths
were 26.2 and 32.9 %, respectively, with a difference of 0.24,
6.2, and 14.1 % for Pullman, Amarillo, and Mansker, re-
spectively. Accordingly, the textural classes vary from sandy
loam (Amarillo) to clay (Mansker) as presented in Table 1.
The soil properties discussed here are typical of those of soils
of the semiarid climates (Chesworth, 2008).
The results of the total elemental analysis are presented
in Table 2. The concentrations of elements such as Ca, Mg,
Na, K, and P in these semiarid soils are typical of those of
most agricultural soils (Adriano, 2001; Udeigwe et al., 2009),
particularly those not receiving any form of organic amend-
ments. Likewise, the concentrations of heavy metals such as
Fe, Cu, Mn, and Zn were within the typical background lev-
els found in most non-polluted agricultural soils (Adriano,
2001; Kabata-Pendias, 2010). No one soil was consistently
higher in all the elements measured and there was no consis-
tent trend in the concentration of the elements with depth in
each soil series.
The initial background levels of available nutrients are
shown in Table 3. Means of the DTPA-extractable Fe, Mn,
Cu, and Zn are 5.30, 5.01, 0.81, and 0.38 mg kg−1, respec-
tively. These concentrations indicate an insufficient level of
these nutrients and are typical of most semiarid soils (Havlin
et al., 2013). Soil test P varied more widely, ranging from
8.93 to 123 mg kg−1, and was generally higher in the top soil,
suggesting a possible P input to some of these soils through
fertilization.
3.2 Copper fixation pattern (short- and long-term
examination)
Percent estimates of fixed Cu determined after the first
14 days (designated as the short term), and 90 days (the long
term) are presented in Table 4. The result is presented as
the averages for all soils within each depth examined be-
cause the examination of individual soils showed no jus-
tifiable difference or pattern among the soils that is worth
discussing. Comparison was made between the chelated and
non-chelated micronutrient treatments. Average values from
the three soil series examined revealed that within the non-
chelated system, approximately 32 and 39 % of the added Cu
was fixed in the 0–15 and 15–30 cm depths, respectively, af-
ter the first 14 days. When compared to the chelated system,
approximately 13.7 and 14.1 % of the added Cu were fixed
in the 0–15 and 15–30 cm depths, respectively. The averages
for both depths after the first 14 days were 35.5 and 13.9 %
for non-chelated and chelated systems, respectively. These
numbers strongly suggest that chelating with EDTA reduced
the fixation of Cu by soil constituents (Chiu et al., 2005),
rendering Cu more available in these semiarid alkaline soils.
Copper fixation after 90 days (long-term fixation) was also
examined. Approximately 48 and 56 % of available Cu was
fixed after 90 days in the non-chelated system within the 0–
15 and 15–30 cm depths, respectively. These numbers com-
pared to the chelated system were 43.2 and 47.2 % for the
0–15 and 15–30 cm depths, respectively. Average fixations
for both depths (all soils) after 90 days were 52.1 % for the
non-chelated system and 45.2 % for the chelated system. The
Solid Earth, 7, 311–321, 2016 www.solid-earth.net/7/311/2016/

T. K. Udeigwe et al.: Examining the fixation kinetics of chelated and non-chelated copper 315
Table 3. Selected plant-available nutrients (in mgkg−1) in the studied semiarid alkaline soils of the Southern High Plains, USA.
Series Sample ID FeDTPA MnDTPA CuDTPA ZnDTPA PM3
Amarillo A2a 9.73 4.53 0.97 0.96 123
A2b 3.32 3.25 0.54 0.20 58.7
Mansker Ma 6.83 5.92 0.99 0.20 33.4
Mb 3.14 7.09 0.89 0.19 8.93
Pullman Pa 3.79 4.97 0.59 0.56 28.1
Pb 4.97 4.29 0.85 0.17 11.6
Mean 5.30 5.01 0.81 0.38 44.0
Standard deviation 2.57 1.34 0.19 0.32 42.7
Abbreviations: DTPA: diethylene triamine pentaacetic acid; M3: Mehlich 3.
Table 4. Average percentage (with standard deviation) of plant-
available copper fixed after 14 and 90 days in the non-chelated and
chelated systems of the semiarid alkaline soils of the Southern High
Plains, USA.
Percentage fixed after
Cu system Depth (cm) 14 days 90 days
Non-chelated 0–15 (n= 3) 32.0 (6.0)a 48.4 (12.1)a
15–30 (n= 3) 39.1 (9.8)a 55.9 (2.7)a
All (n= 6) 35.5 (2.2)A 52.1 (7.3)A
Chelated 0–15 (n= 3) 13.7 (9.2)a 43.2 (0.4)a
15–30 (n= 3) 14.1 (11.9)a 47.2 (7.4)a
All (n= 6) 13.9 (10.4)B 45.2 (3.5)A
Mean values within a column in a given Cu system with the same lowercase letter and
mean values within a column for the Cu systems with the same upper case letter are not
statistically different (Fisher’s LSD α = 0.05).
findings indicated a narrower difference of approximately
7 % between the non-chelated and chelated systems in the
long term (90 days) compared to the 22 % observed in the
short term (14 days). This could possibly be attributed to the
fact that the strength of the chelate decreases with time; thus,
more Cu is fixed by other soil constituents over time. The
findings here are partly supported by the study of Meers et
al. (2005), who estimated a half life of 39 to 59 days for
EDTA in doses of 0.8 to 1.6 mmol experimented in a heavy
metal phytoextraction study, suggesting that the effectiveness
of EDTA on micronutrient mobilization in soil systems will
decrease over time. The slightly higher fixation of Cu in the
subsurface soil could be partly attributed to its higher clay
content. Strong soil-clay–heavy-metal interactions have pre-
viously been documented in soils of this region (Udeigwe et
al., 2015) and such interactions could reduce the amount of
plant-extractable Cu.
3.3 Changes in available Cu with respect to other
micronutrients
The changes in the concentration of available Cu over the ex-
perimental period of 90 days were compared to those of other
micronutrients in the mixture. Relationships within individ-
ual soils were examined, but this did not show findings worth
focusing the discussion on; thus the findings summarized are
averages for the soils at each depth and for both depths com-
bined (Table 5). Regression analyses were used to evaluate
the strengths of the relationships and to further examine the
gradient of the change between Cu and each of the other mi-
cronutrient elements. In each depth, the amount of available
Cu positively and significantly changes with each of the other
micronutrients, although to varying degrees.
Overall, the strengths of the relationships were higher in
the non-chelated systems (R2: 0.68–0.94) compared to the
chelated (R2: 0.42–0.81). For each of the relationships ex-
amined, the slope was generally higher in the non-chelated
systems, suggesting that more Cu will be fixed for each unit
of the other micronutrients fixed in the non-chelated system.
The findings indicate that in each depth, the change in avail-
able Cu with respect to change in Zn (Cu–Zn) was higher
than those of Cu–Fe, and Cu–Mn in both the non-chelated
and chelated systems, as evidenced from the slope of the
equations. When both depths were combined for each ele-
ment, within the non-chelated system, the slopes were 0.40
(Cu–Fe), 0.31 (Cu–Mn), and 1.04 (Cu–Zn), and 0.26 (Cu–
Fe), 0.22 (Cu–Mn), and 0.90 (Cu–Zn) for the chelated sys-
tem. Within the non-chelated system, the findings suggest
that a 1 mg kg−1 change in the concentration of available Fe,
Mn, and Zn, is associated with a 0.40, 0.31, and 1.04 mg kg−1
change in available Cu, respectively, in these semiarid al-
kaline soils of the SHP. The information obtained here has
not previously been reported for these soils and provides a
good approximation of how Cu changes in respect to other
micronutrients in both chelated and non-chelated systems in
these semiarid alkaline soils.
www.solid-earth.net/7/311/2016/ Solid Earth, 7, 311–321, 2016

316 T. K. Udeigwe et al.: Examining the fixation kinetics of chelated and non-chelated copper
Table 5. Changes in available copper with respect to other micronutrient elements (Fe, Mn, and Zn) in the non-chelated and chelated systems
of the studied semiarid alkaline soils of the Southern High Plains, USA (n= 9).
Fe Mn Zn
Non-chelated
0–15 y = 0.35x− 0.17 0.91b y = 0.25x+ 1.95 0.77b y = 0.92x+ 0.80 0.92b
15–30 y = 0.45x− 0.04 0.84c y = 0.38x+ 1.20 0.68b y = 1.14x+ 0.95 0.94c
All y = 0.40x− 0.13 0.90c y = 0.31x+ 1.59 0.77b y = 1.04x+ 0.83 0.93c
Chelated
0–15 y = 0.24x+ 1.41 0.74b y = 0.17x+ 3.29 0.52a y = 0.86x+ 0.87 0.78b
15–30 y = 0.27x+ 2.45 0.78b y = 0.30x+ 2.76 0.59a y = 0.64x+ 2.43 0.42a
All y = 0.26x+ 1.89 0.81c y = 0.22x+ 3.14 0.56a y = 0.90x+ 1.05 0.65b
a significant at α = 0.05; b significant at α = 0.01; c significant at α = 0.001.
Table 6. Kinetic models used for the study of copper fixation in selected semiarid alkaline soils of the Southern High Plains, USA.
Kinetic model Equation Parameter
Zero-order qt = q0− k0t k0, zero-order rate constant (mgkg−1 d−1)
First-order lnqt = lnq0− k1t k1, first-order rate constant (d−1)
Second-order 1/qt = 1/q0− k2t k2, second-order rate constant (mgkg−1)−1
Power function qt = abt a, initial reaction magnitude constant (mgkg−1 (h−1)b)
and b, reaction rate constant (mgkg−1)−1
q0 and qt are the amount of micronutrients at time zero and t , respectively.
Figure 1. Amount of diethylene triamine pentaacetic acid (DTPA)-extractable copper over the long term (90 days) in the non-chelated system
fitted to (a) zero-order, (b) first-order, (c) second-order, and (d) power function models (qt denotes the amount remaining at time t (mg kg−1);
error bars are for standard errors computed from six data points).
Solid Earth, 7, 311–321, 2016 www.solid-earth.net/7/311/2016/

T. K. Udeigwe et al.: Examining the fixation kinetics of chelated and non-chelated copper 317
Figure 2. Amount of diethylene triamine pentaacetic acid (DTPA)-extractable copper over the long term (90 days) in the chelated system
fitted to (a) zero-order, (b) first-order, (c) second-order, and (d) power function models (qt denotes the amount remaining at time t (mg kg−1);
error bars are for standard errors computed from six data points).
Table 7. Experimental data from copper kinetic studies fitted to zero-, first-, and second-order models, and power function models.
Copper Depth Zero First Second Power
system (cm) R2 SE R2 SE R2 SE R2 SE
90
day
s
Non-chelated 0–15 (n= 3) 0.64 0.705 0.71 0.148 0.75 0.035 0.89 0.091
15–30 (n= 3) 0.56 0.828 0.68 0.155 0.77 0.029 0.89 0.083
All (n= 6) 0.61 0.751 0.71 0.145 0.79 0.030 0.91 0.081
Chelated 0–15 (n= 3) 0.79 0.477 0.83 0.09 0.85 0.019 0.84 0.087
15–30 (n= 3) 0.88 0.337 0.92 0.057 0.94 0.011 0.78 0.095
All (n= 6) 0.88 0.348 0.92 0.057 0.95 0.057 0.86 0.078
35
day
s
Non-chelated All (n= 6) 0.71 0.671 0.78 0.145 0.85 0.030 0.96 0.081
Chelated All (n= 6) 0.82 0.327 0.85 0.054 0.87 0.009 0.87 0.049
SE: standard error of regression line.
3.4 Kinetics of copper fixation
Copper fixation in the chelated and non-chelated systems
were further examined by fitting the data obtained from ki-
netic experiments to various kinetic models. A number of ki-
netic models (Table 6) were examined based on the experi-
mental conditions of this study and evidence gathered from
previous studies (Dang et al., 1994; Reyhanitabar and Gilkes,
2010; Rajashekhar Rao, 2015). Coefficient of determination
(R2) and standard error (SE) were employed as criteria for
evaluating the best fit among the models examined (Dang et
al., 1994; Reyharitabar and Gilkes, 2010). Fixation kinetics
were studied within soils and depths. However, the individual
examination of soils did not show justifiable reasons to focus
the discussion on the comparison among them as earlier in-
tended. Thus, for further examination, average data points for
all three soils were used, an approach that also enhanced the
statistical evaluations.
Experimental data from kinetic studies were fitted to zero-,
first-, and second-order models, as well as to power func-
tion models, and findings are summarized in Table 7. In all
the models, qt represents the amount of DTPA-extractable
(plant-available) Cu remaining at time t , in days. Close ex-
amination reveals a comparable trend between the depths of
0–15 and 15–30 cm and hence there were no findings among
www.solid-earth.net/7/311/2016/ Solid Earth, 7, 311–321, 2016

318 T. K. Udeigwe et al.: Examining the fixation kinetics of chelated and non-chelated copper
Figure 3. Amount of diethylene triamine pentaacetic acid (DTPA)-extractable copper over the short term (35 days) in the non-chelated
system fitted to (a) zero-order, (b) first-order, (c) second-order, and (d) power function models (qt denotes the amount remaining at time t
(mg kg−1); error bars are for standard errors computed from six data points).
Figure 4. Amount of diethylene triamine pentaacetic acid (DTPA)-extractable copper over the short term (35 days) in the chelated system
fitted to (a) zero-order, (b) first-order, (c) second-order, and (d) power function models (qt denotes the amount remaining at time t (mg kg−1);
error bars are for standard errors computed from six data points).
depths worth discussing. As a result, discussions will be con-
centrated on models derived using the average values of all
soils and depths. It was evident that fixation of available Cu
was poorly described by the zero-, first-, and second-order
models (R2: 0.61–0.79, SE: 0.030–0.751) but slightly better
by the power function model (R2= 0.91, SE= 0.081). A bet-
ter fit to the power function model suggests that the fixation
of plant-available Cu in this mixed system of non-chelated
micronutrients is somewhat nonlinear over the 90 days’ ex-
perimental period (Fig. 1), an indication of a more com-
Solid Earth, 7, 311–321, 2016 www.solid-earth.net/7/311/2016/

T. K. Udeigwe et al.: Examining the fixation kinetics of chelated and non-chelated copper 319
plex reaction type. This finding was similar to that obtained
when Cu was examined in a single system (data not shown).
Within the chelated system, the finding was somewhat differ-
ent (Fig. 2) as Cu fixation was better described by the second-
order model (R2= 0.95, SE= 0.010) compared to the other
models (R2: 0.86–0.92). This better fit to the second-order
model could imply that the reaction rate depends on the con-
centration of two reactants (Evangelou, 1998; Sparks, 2003),
i.e., Cu and another soil constituents, for e.g., other micronu-
trients such as Fe, Mn, or Zn. In retrospect, a better fit to
the zero-order model implies that the rate of reaction does
not depend on the concentration of the reactant (Cu), while a
better fit to the first-order model will imply that the rate of re-
action is dependent on the concentration of only one reactant
(e.g., Cu) (Evangelou, 1998; Sparks, 2003).
Further examination of the data points suggests a possi-
ble discontinuity in the slope or pattern of the data distribu-
tion before and after day 35, suggesting a likely difference
in the mechanisms of Cu fixation before and after the first
35 days. These sets of data points were further separated and
examined (Fig. 3 and Table 7). Within the non-chelated sys-
tem, Cu fixation in the first 35 days was better described by
the power function model (R2= 0.96, SE= 0.081) (Fig. 3).
When compared to the chelated system, Cu fixation followed
the second-order and power function models more closely at
about the same degree (R2= 0.87) (Fig. 4). The findings re-
vealed that the reduction in the amount of available Cu oc-
curred at a slower pace in the chelated system compared to
the non-chelated system as evidenced from the reaction rate
constants of 0.104 and 0.192 mg kg−1 day−1, respectively.
3.5 Significance of findings to copper management
The adherence of the fixation of non-chelated Cu in the ex-
amined semiarid soils to the power function model is an in-
dication of a more complex reaction type when compared
to the chelated Cu which followed the second-order model.
Findings substantiate the need to apply Cu micronutrient in
the chelated form on these semiarid soils as significantly less
chelated Cu was fixed, particularly within the first 14 days.
Findings further suggest the significance of timing, given that
about 68 % of the total Cu fixed was in the first 14 days
and that the effectiveness of the chelated compound tended
to decrease over time, leading to a narrower difference be-
tween chelated and non-chelated compounds. The relation-
ships developed from the examination of the change in avail-
able Cu with respect to other micronutrients could be used
as predictive tools. The reaction rate constants obtained from
this study could be used to approximate how much of added
Cu micronutrient will be available at a specific point in time
in both chelated and non-chelated systems in these semiarid
soils. A very important application of the findings from this
study will be for the comparison of the fixation pattern of
Cu to those of other micronutrients within these semiarid
soils. Reaction rate constants could be compared to those ob-
tained for Cu in other soils. The applications developed from
this study provide a basis for a more mechanistic approach
to evaluating the effectiveness of commercial micronutri-
ent products and comparisons among products by examining
their fixation patterns and kinetic parameters. A database of
the reaction rate constants derived for different chelated and
non-chelated Cu compounds can be compared among them-
selves and used as a tool for making a more informed deci-
sion on Cu management on these semiarid soils.
4 Conclusions
Kinetic models could be used to further our understanding
and examine Cu fixation in soils of the semiarid to arid cli-
mates. The reduction of plant-available Cu more closely fol-
lowed the power function and second-order models in the
non-chelated and chelated systems, respectively. The find-
ings substantiate the need for the use of chelated compounds
and the importance of timing in Cu management in these
semiarid soils. Reaction rate constants obtained from this
study could be used for the comparison of the fixation pat-
tern of Cu to those of other micronutrients within these semi-
arid soils, and for comparisons among soils, and also provide
a more mechanistic basis for evaluating the effectiveness of
different Cu compounds. Results from this study have much
practical significance.
Acknowledgements. The authors acknowledge the College of Agri-
cultural Sciences and Natural Resources, Texas Tech University,
for providing the research enhancement funds that partly supported
this study.
Edited by: A. Jordán
References
Abbas, M. H. and Salem, H. M.: Kinetics of iron retention by typic
torriorthent and typic haplocalcid soils supplied with some mi-
cronutrients, Ann. Agric. Sci. Moshtohor, 49, 301–311, 2011.
Adriano, D. C.: Trace Elements in Terrestrial Environments: Bio-
geochemistry, Bioavailability, and Risks of Metals, Springer Sci-
ence and Business Media, New York, USA, 2001.
Allen, V. G., Brown, C. P., Kellison, R., Segarra, E., Wheeler, T.,
Dotray, P. A., Conkwright, J. C., Green, C. J., and Acosta-
Martinez, V.: Integrating cotton and beef production to reduce
water withdrawal from the Ogallala Aquifer in the Southern High
Plains, Agron. J., 97, 556–567, 2005.
Alloway, B. J. (Ed.): Micronutrient Deficiencies in Global Crop
Production, Springer Science and Business Media, Berlin, Ger-
many, 2008.
Amuti, T. and Luo, G.: Analysis of land cover change and its driving
forces in a desert oasis landscape of Xinjiang, northwest China,
Solid Earth, 5, 1071–1085, doi:10.5194/se-5-1071-2014, 2014.
www.solid-earth.net/7/311/2016/ Solid Earth, 7, 311–321, 2016

320 T. K. Udeigwe et al.: Examining the fixation kinetics of chelated and non-chelated copper
Barbero-Sierra, C., Marques, M. J., Ruiz-Pérez, M., Escadafal, R.,
and Exbrayat, W.: How is desertification research addressed in
Spain? Land versus soil approaches, Land Degrad. Develop., 26,
423–432, 2015.
Bindraban, P. S., Dimkpa, C., Nagarajan, L., Roy, A., and Rab-
binge, R.: Revisiting fertilisers and fertilization strategies for im-
proved nutrient uptake by plants, Biol. Fertil. Soils, 51, 1–15,
doi:10.1007/s00374-015-1039-7, 2015.
Chesworth, W. (Ed.): Encyclopedia of Soil Science, Springer Sci-
ence and Business Media, Berlin, Germnay, 2008.
Chiu, K. K., Ye, Z. H., and Wong, M. H.: Enhanced uptake of As,
Zn, and Cu by Vetiveria zizanioides and Zea mays using chelat-
ing agents, Chemosphere, 60, 1365–1375, 2005.
Dang, Y. P., Dalal, R. C., Edwards, D. G., and Tiller, K. G.: Kinetics
of zinc desorption from vertisols, Soil Sci. Soc. of Am. J., 58,
1392–1399, 1994.
De Schamphelaere, K. A., Vasconcelos, F. M., Tack, F. M.,
Allen, H. E., and Janssen, C. R.: Effect of dissolved organic mat-
ter source on acute copper toxicity to Daphnia magna, Environ.
Toxicol. Chem., 23, 1248–1255, 2004.
Dimkpa, C. O., Latta, D. E., McLean, J. E., Britt, D. W., Boy-
anov, M. I., and Anderson, A. J.: Fate of CuO and ZnO nano and
micro particles in the plant environment, Environ Sci. Technol.,
47, 4734–4742, 2013.
Evangelou, V. P.: Environmental Soil and Water Chemistry: Princi-
ples and Applications, Wiley, New York, USA, 1998.
Fernández-Calviño, D., Garrido-Rodríguez, B., López-Periago, J.
E., Paradelo, M., and Arias-Estévez, M.: Spatial distribution of
copper fractions in a vineyard soil, Land Degrad. Dev., 24, 556–
563, 2013.
Gee, G. W. and Bauder. J. W.,: Particle-size analysis, in: Methods
of Soil Analysis, Part 1 – Pyhiscal and Mineralogical Methods,
edited by: Klute, A., Soil Sci. Soc. of Am., Madison, WI, USA,
383–411, 1986.
Havlin, J. L. T., Nelson, S. L., and Beaton, J. D.: Soil fertility
and fertilizers: an introduction to nutrient management, 8th edn.,
Pearson, Upper Saddle River, New Jersey, USA, 2013.
Kabata-Pendias, A.: Trace Elements in Soils and Plants, 3rd edn.,
Google eBook, CRC Press, Boca Raton, Florida, USA, 2000.
Kayser, A., Wenger, K., Keller, A., Attinger, W., Felix, H. R.,
Gupta, S. K., and Schulin, R.: Enhancement of phytoextraction
of Zn, Cd, and Cu from calcareous soil: the use of NTA and sul-
fur amendments, Environ. Sci. Technol., 34, 1778–1783, 2000.
Liang, J. and Karamanos, R. E.: DTPA-extractable Fe, Mn, Cu
and Zn, in: Soil Sampling and Methods of Analysis, edited by:
Carter, M. R., CRC Press, Boca Raton, Florida, USA, 1993.
Lindsay, W. and Norvell, W. A.: Development of a DTPA soil test
for zinc, iron, manganese, and copper, Soil Sci. Soc. of Am. J.,
42, 421–428, 1978.
Luo, C., Shen, Z., and Li, X.: Enhanced phytoextraction of Cu,
Pb, Zn and Cd with EDTA and EDDS, Chemosphere, 59, 1–11,
2005.
Manouchehri, N., Besancon, S., and Bermond, A.: Major and trace
metal extraction from soil by EDTA: equilibrium and kinetic
studies, Anal. Chim. Acta, 559, 105–112, 2006.
Meers, E., Ruttens, A., Hopgood, M. J., Samson, D., and
Tack, F. M. G.: Comparison of EDTA and EDDS as potential
soil amendments for enhanced phytoextraction of heavy metals,
Chemosphere, 58, 1011–1022, 2005.
Mehlich, A.: Mehlich 3 soil test extractant: a modification of
Mehlich 2 extractant, Commun. Soil Sci. Plant Anal., 15, 1409–
1416, 1984.
Mehta, S., Fryar, A. E., and Banner, J. L.: Controls on the regional-
scale salinization of the Ogallala aquifer, Southern High Plains,
Texas, USA. Appl. Geochm., 15, 849–864, 2000.
Mureithi, S. M., Verdoodt, A., Njoka, J. T., Gachene, C. K. K., and
Van Ranst, E.: Benefits derived from rehabilitating a degraded
semi-arid rangeland in communal enclosures, Kenya, Land De-
grad. Develop., doi:10.1002/ldr.2341, 2015.
Nelson, D. W. and Sommers, L. E.: Total carbon, organic carbon,
and organic matter, Methods of soil analysis – Part 2, Chem-
ical and microbiological properties, (methodsofsoilan2), 539–
579, 1982.
Pinto, A. P., Mota, A. M., De Varennes, A., and Pinto, F. C.: Influ-
ence of organic matter on the uptake of cadmium, zinc, copper
and iron by sorghum plants, Sci. Total Environ., 326, 239–247,
2004.
Rajashekhar Rao, B. K.: Kinetics of potassium release in sweet
potato cropped soils: a case study in the highlands of Papua
New Guinea, Solid Earth, 6, 217–225, doi:10.5194/se-6-217-
2015, 2015.
Rashid, A. and Ryan, J.: Micronutrient constraints to crop produc-
tion in soils with Mediterranean-type characteristics: a review, J.
Plant Nutr., 27, 959–975, 2004.
Reyhanitabar, A. and Gilkes, R. J.: Kinetics of DTPA extraction of
zinc from calcareous soils, Geoderma, 154, 289–293, 2010.
Sarah, P. and Zonana, M.: Livestock redistribute runoff and sed-
iments in semi-arid rangeland areas, Solid Earth, 6, 433–443,
doi:10.5194/se-6-433-2015, 2015.
Sekhon, B. S.: Chelates for micronutrient nutrition among crops,
Resonance, 8, 46–53, 2003.
Soil Survey Staff: Kellogg Soil Survey Laboratory Methods Man-
ual. Soil Survey Investigations Report No. 42, Version 5.0.,
edited by: Burt, R. and Soil Survey Staff, US Department of
Agriculture, Natural Resources Conservation Service, Lincoln,
NE, USA, 2014.
Sparks, D. L.: Environmental Soil Chemistry, 2nd edn., Academic
Press, California, USA, 2003.
Sparks, D. L., Page, A. L., Helmke, P. A., Loeppert, R. H., Soltan-
pour, P. N., Tabatabai, M. A., and Sumner, M. E.: Methods of soil
analysis, Part 3-Chemical methods, Soil Sc. Soc. of Am. Inc.,
Madison, WI, USA, 1996.
Stout, J. E.: Dust and environment in the southern high plains of
North America, J. Arid Environ., 47, 425–441, 2001.
Torres, L., Abraham, E. M., Rubio, C., Barbero-Sierra, C., and
Ruiz-Pérez, M.: Desertification research in Argentina, Land De-
grad. Develop., 26, 433–440, 2015.
Udeigwe, T. K., Wang, J. J., and Zhang, H.: Effectiveness of bauxite
residues in immobilizing contaminants in manure-amended soils,
Soil Sci., 174, 676–686, 2009.
Udeigwe, T. K., Young, J., Kandakji, T., Weindorf, D. C., Mah-
moud, M. A., and Stietiya, M. H.: Elemental quantification,
chemistry, and source apportionment in golf course facilities
in a semi-arid urban landscape using a portable X-ray fluores-
cence spectrometer, Solid Earth, 6, 415–424, doi:10.5194/se-6-
415-2015, 2015.
United States Environmental Protection Agency-Inductively
Coupled Plasma (USEPA-ICP) Users Group: Method 200.7,
Solid Earth, 7, 311–321, 2016 www.solid-earth.net/7/311/2016/

T. K. Udeigwe et al.: Examining the fixation kinetics of chelated and non-chelated copper 321
available at: http://www.nmenv.state.nm.us/gwb/documents/
DairyRegs/NOIAttachment9-Exhibits/3224Exhibits/3224-1.
pdf (last access: 3 September 2015), 1982.
World Health Organization (WHO): Guidelines on food fortifica-
tion with micronutrients, available at: http://whqlibdoc.who.int/
publications/2006/9241594012_eng.pdf?ua=1&ua=1 (last ac-
cess: 3 September 2015), 2000.
Young, J., Udeigwe, T. K., Weindorf, D. C., Kandakji, T., Gau-
tam, P., and Mahmoud, M. A.: Evaluating management-induced
soil salinization in golf courses in semi-arid landscapes, Solid
Earth, 6, 393–402, doi:10.5194/se-6-393-2015, 2015.
www.solid-earth.net/7/311/2016/ Solid Earth, 7, 311–321, 2016