Embed Size (px)
Citation preview

doi:10.1093 / poq / nfj001© The Author 2006. Published by Oxford University Press on behalf of the American Association for Public Opinion Research. All rights reserved. For permissions, please e-mail: [email protected].
Public Opinion Quarterly, Vol. 70, No. 1, Spring 2006, pp. 23–47
EXAMINING VARIANCE IN PRESIDENTIAL APPROVALTHE CASE OF FDR IN WORLD WAR II
DOUGLAS L. KRINER
Abstract Despite the substantive growth and increasing method-ological sophistication of the presidential approval literature over thelast four decades, almost all analyses continue to focus exclusively onthe mean of the approval distribution—the percentage of Americanswho approve of the president at a given moment. However, changes inthe variance of popular support for the president may be as politicallyand substantively important as shifts in the mean. To illustrate how afocus on variance can enrich our understanding of changes in the presi-dent’s public standing, this analysis examines the effects of the econ-omy and World War II on the variance in popular support for FranklinD. Roosevelt. At the aggregate level, the study shows that high peace-time unemployment and mounting casualties increased the volatility ofFDR’s standing among federal relief recipients, erstwhile his mostconsistent base of support. At the individual level, the analysis demon-strates that individuals with conflicting partisan, economic, and war-related considerations for evaluating the president were more variable intheir approval of Roosevelt than were other respondents. Exporting asimilar focus on variance to other lines of research across the publicopinion subfield could produce a richer understanding of the complexprocesses driving opinion change over time.
Introduction
Since the development of modern polling techniques in the mid-twentieth century,few time series have attracted as much public and scholarly attention as Gallupmeasures of popular support for the president. Scores of analyses have docu-mented the influence of a host of factors, from the economy or perceptions of
DOUGLAS L. KRINER is a doctoral candidate in the Department of Government, Harvard University.The author would like to thank Matt Baum, Barry Burden, Dan Carpenter, William Howell,Kosuke Imai, Gary King, Liam Schwartz, Jasjeet Sekhon, the members of the Harvard AmericanPolitics Research Workshop, and several anonymous reviewers for their most valuable commentsand suggestions. All remaining errors are the author’s own. Address correspondence to theauthor; e-mail: [email protected].

24 Kriner
it (Clarke and Stewart 1994; MacKuen, Erikson, and Stimson 1992; Monroe1978) to major national and world events (Brace and Hinckley 1991; Edwardsand Swenson 1997) to American combat casualties (Gartner and Segura 1998;Mueller 1973), on popular evaluations of the president’s job performance.Moreover, while linear regression remains the most popular lens into thedynamics governing presidential support, scholars have recently brought anincreasingly sophisticated array of methodological tools to bear on theapproval series (e.g., Beck 1991; Burden and Mughan 2003; Lebo 2000;Wood 2000; and see Gronke and Newman 2003 for a review).
Despite the field’s maturity, most analyses nevertheless continue to focusexclusively on the mean of the approval distribution—the percentage ofAmericans who approve of the president at a given time. Only recently havescholars begun to explore the factors underlying the variance in presidentialapproval, both at the aggregate (Gronke and Brehm 2002) and individualresponse level (Gronke 1999). With a few notable exceptions (Alvarez andBrehm 1995, 1997, 2002), this lack of attention to variance pervades much ofthe public opinion literature (Braumoeller 2003).
Yet, for policymakers and academics alike, changes in variance can be assubstantively important as changes in the mean. Take, for example, measuresof popular support for withdrawing American forces from Iraq. Pundits rou-tinely report and analyze the percentage of Americans who support with-drawal in the latest surveys, but the variance across polls is as politicallyimportant as the mean value reported in any given survey. A high estimateof aggregate support for withdrawal with low variance could spell politicaltrouble for the George W. Bush administration as stable support among thegeneral public for withdrawal could bring considerable public and politicalpressure to bear on the White House to change course and begin de-escalatingthe American military commitment in the Middle East. However, a high esti-mate of mean support for withdrawal with high variance presents fewer politi-cal difficulties for those committed to staying the course in Iraq. A largevariance estimate suggests that public opinion is volatile and susceptible todramatic sudden changes, even absent major new developments on the ground.This suggests that the next poll could show considerably fewer Americanssupporting withdrawal, which in turn would seriously undercut the politicalposition of the administration’s opponents.
To illustrate further how a focus on variance can shed new insights into thedynamics that drive changes in public opinion, this analysis presents two casestudies investigating the effect of the economy and World War II on the vari-ance in popular support for Franklin D. Roosevelt. Beginning with a reanaly-sis of Baum and Kernell’s (2001) study of Roosevelt’s popular supportdisaggregated by economic class, the first case study explores the effect of theeconomy and World War II on both the mean and variance of FDR’s supportamong the poor. Through a multiplicative heteroscedastic linear regression,the study will show that peacetime unemployment, the onset of war, and rising

Variance in Presidential Approval 25
American casualties greatly increased the volatility of indigent support forRoosevelt. Moreover, the revised model yields new estimates of the originalexplanatory variables’ effects on mean approval that show relief respondents,like other socioeconomic groups, adjusted their approval of FDR in responseto changes in unemployment and presidential public appeals.
The second case study shifts the analysis to the individual level to investi-gate the microfoundations underlying increased variance among many ofFDR’s most ardent supporters during wartime. Heteroscedastic probit modelssuggest that individuals with conflicting partisan, economic, and war-relatedconsiderations for evaluating the president had greater ambiguity underlyingtheir approval choice and hence were more variable in their support ofRoosevelt than were other respondents.
Why Study the Variance of Presidential Approval?
Mean presidential approval—the percentage of Americans who approve of thepresident at a given time—is one of the most anxiously watched quantities inpolitics. For fellow Washingtonians, a president’s approval rating is a criticalbenchmark of his political capital (Kernell 1997; Neustadt 1990). Yet, infor-mation about the stability of the president’s popular support and its potentialvolatility also critically affects the strategic calculus of other political actorswith whom the president must interact.
For example, a president with a stable 60 percent approval rating is a formi-dable political adversary. Low variance around the approval mean suggests aconsistent base of popular support that the president can leverage against otherpolitical actors; absent an exogenous shock, repeated queries should yieldsimilar percentages approving within the bounds of sampling error. In con-trast, when the general public is less confident of its assessment and morelikely to change its evaluation at a whim, the variance around the president’smean approval rating is high. While his average approval might be 60 percent,different polls may show widely varying results. Political adversaries may beable to seize upon unfavorable polls both to rally their base and cast doubt onthe strength of a president’s well of support among the public.
President Bill Clinton’s political resilience throughout the Monica Lewinskyscandal further illustrates how the variance in presidential approval can be justas important as its mean level. Throughout the impeachment process, Clinton’saverage approval rating hovered in the low sixties. But perhaps even more sur-prising than this mean level of support was the tremendous stability in his poll-ing numbers over time (Miller 1999; Sonner and Wilcox 1999). If there hadbeen higher variance in public support for the president—for example, ifrepeated measures of approval ranged between 50 percent and 70 percentinstead of being tightly clustered around a mean value of 60 percent—individuallower ratings may have generated opportunities for Clinton’s partisan adversaries

26 Kriner
to go on the offensive and build political momentum in support of impeach-ment. However, because President Clinton enjoyed a stable level of strong pub-lic support for his job performance, he succeeded in reprising Ronald Reagan’srole as the “Teflon president” and remained a formidable political force, evenin an era of divided government, until his last day in office.
Analysis of variance at the individual level also affords politically signifi-cant insights into the degree of certainty with which respondents approve ordisapprove of the president. Individual-level variance does not necessarilytranslate into greater volatility in approval at the aggregate level. For example,if all respondents are so uncertain about their evaluations of a president’s jobperformance that they essentially flip a coin every time they are surveyed,individual variance will be high and yet the average number of people whoapprove of the president from survey to survey should hover around 50 percent.In a less severe case, if a core of interested political observers has relativelystable political opinions while the rest of the country does not, the aggregatetrend will reflect the stable views of the politically informed as the randomnoise from uninformed and highly variable respondents cancels out (Erikson,MacKuen and Stimson 2002; Page and Shapiro 1992; Stimson 1990). How-ever, response variability among at least some segment of the public is a neces-sary, if not sufficient, condition for higher variance at the aggregate level.
Substantively, models of individual-level variance yield important insightsinto the factors that render individuals’ responses to the approval questionmore or less stable over repeated queries. For example, the president’s corepartisan supporters should have lower variance, ceteris paribus, as they aremore certain of their support for a president of their own party. However, ifpoor economic conditions or controversial new policy initiatives providealternative bases to party loyalty on which individuals base their approvalchoices, the variance underlying their responses should increase, causing theirsupport to become less predictable than in the past. Presidents must be warylest their actions inject greater uncertainty or ambivalence into the minds ofvoters, particularly their supporters and independents crucial to their electoralprospects.
A focus on the sources of individual-level variance provides a new perspec-tive on why White House strategists are constantly trying to keep an adminis-tration “on message,” while opposition leaders attempt to introduce newissues to the political agenda. These actions may be crafted to increase ordecrease the variance of popular support for the president as much as they aredesigned to effect immediate changes in the mean. For the White House, highvariance translates into uncertainty about the president’s true well of popularsupport at a given moment. This greater uncertainty over the president’s levelof support among the public can diminish the political leverage he can bring tobear on other political actors. By crafting a message of reinforcing policy pro-posals and accomplishments, presidential strategists attempt to minimize thenumber of potentially conflicting considerations on which the public might

Variance in Presidential Approval 27
draw when evaluating the president’s job performance, thereby decreasing thevariance in their approval choices and increasing the stability of the presi-dent’s level of political support.
In contrast, the opposition party has strong incentives to bring new issues tothe fore that might introduce competing policy considerations on which thepublic will evaluate the president’s job performance. For example, if the econ-omy is strong, the opposition may try to refocus the tenor of national debateonto rising health care costs or foreign policy concerns—in short, to otherissues on which popular judgments of the president may conflict with supportfor his handling of the economy. Such a strategy may help erode the meanlevel of support for the president directly, but its greatest impact may bethrough increasing the variance of individuals’ evaluations of the president,thus rendering less certain estimates of popular support.
Methods of Modeling Variance at the Aggregate and Individual Levels
Although scholarly concern with response instability reaches back at least asfar as Converse (1964), statistical analysis of variance in public opinion datais a relatively recent phenomenon. Franklin (1991) demonstrated a direct linkbetween campaign tactics and the certainty of voter perceptions of a candi-date’s positions, while Alvarez and Brehm (1995, 1997) employed hetero-scedastic probit models to explore volatility in individuals’ response attitudesto survey questions on issues from affirmative action to abortion. Gronke andBrehm (2002) exported this methodological focus on variance to the study ofaggregate presidential approval by using a heteroscedastic linear regression.Whereas Gronke and Brehm employ a modified first-order autoregressiveconditional heteroscedastic model (ARCH-MH) that includes both substantiveexplanatory variables and an autoregressive term, in the current contextLagrange multiplier tests showed no evidence of serial correlation in the errorterm (Harvey 1990).1 As a result, this study employs the simpler multiplica-tive heteroscedastic model that excludes autoregressive effects and focusessolely on the impact of substantive variables (Zt) on the variance (Davidianand Carroll 1987; King 1998):2
1. For the relief respondent series, the test yields a χ2 (1 df ) of 1.96 and a resulting p-value of .16.2. As a robustness check, model 3 of table 1 was re-estimated with an ARCH term. WhileSTATA had difficulty converging with some variance specifications, replications of model 3show identical positive effects for unemployment and wartime casualties on variance, even aftercontrolling for the autoregressive error term.
Approval: N ~ ( , )μ σ2

28 Kriner
Following Alvarez and Brehm (1995, 1997, 2002) and Gronke (1999), theanalysis also uses heteroscedastic probit models to explore variance andresponse instability at the individual level. The traditional probit model has asimple systematic component, π, which is the normal distribution’s cumula-tive density function (Φ) of a linear combination of chosen independent vari-ables (Xβ) divided by an assumed homoscedastic unitary variance. Underthese conditions, the expected value of the distribution is simply π:
To model for heteroscedasticity, the constant unitary variance is replaced bythe multiplicative heteroscedastic specification used in the linear regressionmodel above. The revised probit model becomes:
The Indigent and FDR: A Reanalysis
Since the pioneering work of John Mueller (1970, 1973), the relationshipbetween war and public opinion, particularly in the Korean and Vietnam eras,has been of paramount importance to studies of presidential approval.Although scholars have examined various responses to these conflicts andsubtleties in popular reactions over time (Page and Shapiro 1988), the domin-ant finding is that support for the president gradually waned as Americancombat casualties mounted (Mueller 1973; Schwarz 1994; Wittkopf 1990; butsee Burk 1999; Larson 1996). Substantial evidence for this basic trend existsat both the national level using aggregate Gallup polling data (Gartner andSegura 1998; Hibbs, Rivers, and Vasilatos 1982; Kernell 1978, Ragsdale1987) and at the local level using individual data (Gartner and Segura 2000;Gartner, Segura, and Wilkening 1997). Indeed, the generalization from thisand similar data that the public, who ultimately bears the human costs of war,will temper militaristic government policies is the conceptual heart of manydemocratic peace theories (Morgan and Campbell 1991; Ray 1995; Russett1990).
World War II, however, appears to buck this trend, as support for the warand Roosevelt remained high, even in the wake of American casualty ratesunparalleled in all subsequent military actions. Because most analyses beginin the post–World War II era (though see Berinsky 2004a; Larson 1996),
σ α γt tZ20= +exp( )
E Y X( ) ( )= =π βΦ
E Y X Z0 t( ) ( / exp( ))= = +π β α γ* Φ
Variance in Presidential Approval 29
scholars have missed an important opportunity to study the full range ofdynamics relating war and public opinion.
An important exception is Baum and Kernell’s (2001) analysis of FDR’smean Gallup approval ratings disaggregated by economic class, which showshow Pearl Harbor and America’s subsequent war effort united the country andbridged class disparities in popular evaluations of the president. While thisresearch is an important contribution as one of the first studies to examine sys-tematically how World War II affected American public opinion, it sheds littlelight on the forces driving the opinion of the poorest 10 percent of Americanssurveyed, those receiving federal relief.
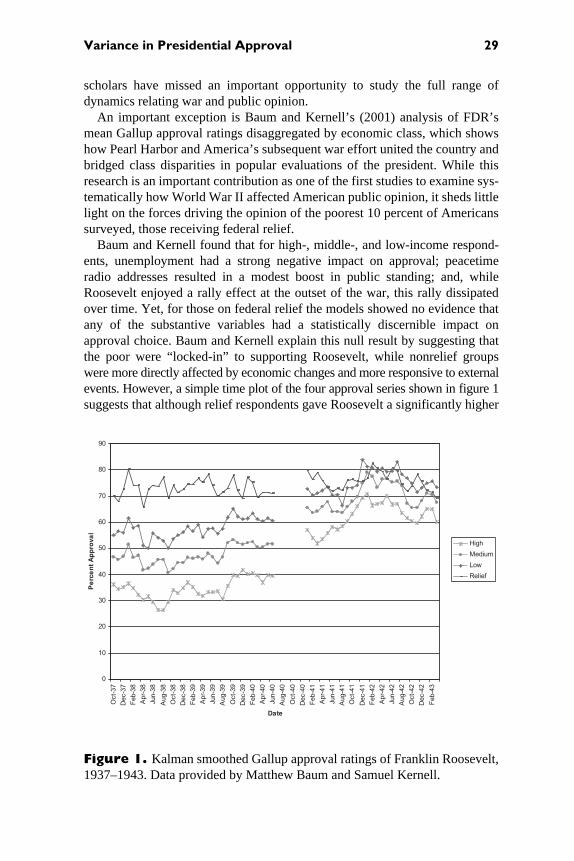
Baum and Kernell found that for high-, middle-, and low-income respond-ents, unemployment had a strong negative impact on approval; peacetimeradio addresses resulted in a modest boost in public standing; and, whileRoosevelt enjoyed a rally effect at the outset of the war, this rally dissipatedover time. Yet, for those on federal relief the models showed no evidence thatany of the substantive variables had a statistically discernible impact onapproval choice. Baum and Kernell explain this null result by suggesting thatthe poor were “locked-in” to supporting Roosevelt, while nonrelief groupswere more directly affected by economic changes and more responsive to externalevents. However, a simple time plot of the four approval series shown in figure 1suggests that although relief respondents gave Roosevelt a significantly higher
Figure 1. Kalman smoothed Gallup approval ratings of Franklin Roosevelt,1937–1943. Data provided by Matthew Baum and Samuel Kernell.
0
10
20
30
40
50
60
70
80
90
Oct-
37
Dec-3
7
Feb-3
8
Apr-
38
Jun-3
8
Aug-3
8
Oct-
38
Dec-3
8
Feb-3
9
Apr-
39
Jun-3
9
Aug-3
9
Oct-
39
Dec-3
9
Feb-4
0
Apr-
40
Jun-4
0
Aug-4
0
Oct-
40
Dec-4
0
Feb-4
1
Apr-
41
Jun-4
1
Aug-4
1
Oct-
41
Dec-4
1
Feb-4
2
Apr-
42
Jun-4
2
Aug-4
2
Oct-
42
Dec-4
2
Feb-4
3
Date
Pe
rce
nt
Ap
pro
va
l
High
Medium
Low
Relief

30 Kriner
base level of support, the peacetime fluctuations in the series seem to trackthose of the other groups rather well. This suggests that some common factorsmight be driving responses for all four socioeconomic groups.
A second curiosity is relief respondents’ reaction to U.S. involvement inWorld War II. No longer did the poor consistently support Roosevelt at a sig-nificantly higher rate than any other group; in fact, for several months FDR’sstanding among the indigent was lower than it was with medium- and low-income Americans.3 Nevertheless, none of the statistical measures shows anysystematic impact of the war on relief recipients’ approval. To seek newinsights into the full impact of the economy and the tides of war on relief opinion,this study investigates the influence of these factors on the variance, as well asthe mean, of presidential approval.
The model for the mean employed here is exactly the same as that used byBaum and Kernell (2001). It is a linear function of peacetime unemployment,whether or not there was a peacetime radio address that month, the number ofnations involved in World War II, the difference in logged casualties over thepreceding two months, the difference in logged casualties multiplied by thenumber of months since Pearl Harbor, and lagged approval:
The variance model then tests for the effects of unemployment, World War II,and presidential radio addresses on the variance in relief approval:
While the theoretical expectations for the components of the mean modelare straightforward, exactly how war, unemployment, and presidential addressesmight impact variance merits elaboration.4 First, high unemployment should
3. This reversal is due primarily to other socioeconomic groups greatly increasing their level ofsupport for Roosevelt, and not from any downward trend in relief support. However, the subse-quent analyses will suggest that higher wartime variance in relief support may also have contrib-uted by increasing the volatility of indigent approval.4. First, a caveat: the error variance in a heteroscedastic linear regression yields insights into thevolatility of the presidential approval series or how “labile and changeable” public opinion is at agiven time (Gronke and Brehm 2002, p. 426). To explain how various factors contributed to thesefluctuations in volatility, the argument shifts to the individual level and hypothesizes how changesin these variables might make relief recipients more or less confident and steadfast in their evalu-ation of Roosevelt. Such ecological inferences about the motivations behind individual behavior drawnfrom aggregate observations are tenuous at best. To improve our confidence that the hypothesized
Mean Approval Approval Peacetime unemployment1 t 2= + ++α β β
β−1
33 4
5
Peacetime radio address Nations at war ln U.S.
++
ββ Δ { ccasualties ln U.S. casualtiesMonths of war
t 6
t
} [ { }]
−
−
β1 +×
Δ11
Variance Unemployment War Radio addresses0 1 2 3= + + +exp( )α β β β

Variance in Presidential Approval 31
increase the variance of relief recipients’ approval of FDR. The indigent gaveRoosevelt an extraordinary base level of support, which reflected both the NewDeal’s vigorous pursuit of economic reform and Roosevelt’s unique position asthe initiator of the federal assistance on which they depended. However, contin-ued economic troubles could have weakened the strength of conviction withwhich the poor approved of FDR and his policies. When evaluating Roosevelt’sjob performance in light of continued economic troubles, the poor had to balancetheir faith in the president’s commitment to economic recovery with tangiblesigns of persistent economic hardships. The presence of these conflicting framesof analysis should render their approval of Roosevelt less stable, even if highunemployment results in no direct change in the average level of their support.
The war, likewise, provided an alternative basis on which to judge the pres-ident, one that has the potential to kindle conflicting emotions and varyingevaluations of the government’s performance. For many relief respondentswho were troubled by the war or America’s war progress, this frame con-flicted with their strong predispositions to support the president. Because ofthis potential for internal conflict, we should expect the indigent’s evaluationof the commander in chief to be more volatile in war than in peacetime.
Finally, by giving a national address on a policy issue, presidents prime thepublic with a new frame according to which they might be evaluated (Druckmanand Holmes 2004; Miller and Krosnick 1996). If a president only tends tomake public appeals for already popular issues (Canes-Wrone 2001), the variancein his support should remain unchanged or perhaps even decrease after theaddress. However, Roosevelt used his peacetime radio addresses in the periodexamined, 1937–41, to champion a number of controversial issues such ascourt packing and increased aid to Britain—policies that raised eyebrows evenamong his core partisan supporters. Thus, by injecting new, controversial con-siderations on which supporters might evaluate him, FDR’s radio addressesshould lead to greater ambivalence in his core supporters’ perceptions of hisactions and greater variance in their evaluation of his job performance.
Results and Discussion
The results of the mean and variance analyses are reported in table 1.5 Column 1replicates Baum and Kernell’s (2001) original homoscedastic analysis. Under
microfoundations underlying these relationships between the war, the economy, and approvalvolatility are indeed correct, analysis at the individual level is required. It is to this task that thestudy later turns with the analysis of individual-level data from two Gallup surveys conducted in1941 and 1942.5. The dependent variable for all models reported in table 1 is the Kalman filtered and smootheddata used by Baum and Kernell (2001). While Kalman filtering is particularly appropriate for therather choppy Roosevelt approval series, all models were re-estimated using unfiltered andunsmoothed data as a robustness check. Both the size and significance levels were virtually iden-tical for all specifications.

32 Kriner
this specification, only the constant and lagged approval terms reach any con-ventional level of statistical significance. The first variance model adds peace-time unemployment and a dummy variable for all observations after Pearl
Table 1. Presidential Approval among Relief Recipients
NOTE.—All significance tests are two-tailed; all models report robust standard errors (SE) andvariance-weighted least squares R2 values.
* p < .10.** p < .05.*** p < .01.
Baum/Kernell Model
Variance Model 1
Variance Model 2
Variance Model 3
Coefficient (SE)
Coefficient (SE)
Coefficient (SE)
Coefficient (SE)
Independent VariablesLagged Approval .328*** .472*** .425*** .431***
(.105) (.074) (.076) (.081)Peacetime
Unemployment–.206 –.329*** –.289** –.286***(.197) (.126) (.138) (.136)
Peacetime Radio Addresses
.636 1.442*** 1.346*** 1.036**(.551) (.304) (.334) (.428)
Nations at War –.086 –.183 −.144 –.181(.194) (.149) (.157) (.150)
Δ Log Casualties .229 .242* .114 .113(.161) (.131) (.106) (.109)
Δ Log Casualties ×Months of War
–.060 –.049 –.064** –.063**(.053) (.049) .032) (.032)
Constant 52.428*** 43.161*** 45.893*** 46.098***(9.678) (6.475) (6.596) (7.013)
VarianceConstant 2.21*** –1.157* –.761 –.841
(.226) (.647) (.611) (.614)Peacetime
Unemployment— .221*** .193*** .159***
(.043) (.041) (.042)War (1,0) — 3.390*** — —
(.761)Logged Casualties — — .426*** .438***
(.103) (.103)Peacetime
Radio Address— — — .574**
(.282)N 58 58 58 58VWLS R2 .24 .46 .42 .43Log-Likelihood –146.477 –140.117 –140.192 –138.844

Variance in Presidential Approval 33
Harbor into the variance equation. Likelihood ratio tests confirm that we canreject the restricted homoscedastic model with 99 percent confidence.
The link between high unemployment and approval volatility is unam-biguous: poor economic conditions significantly raised the variance inrelief approval. Although the indigent were predisposed to supportRoosevelt, the guarantor of the welfare state, rising unemployment seemsto have caused more uncertainty or ambiguity surrounding their evaluationof his job performance.
Perhaps more interestingly, while the World War II variables seem tohave had little systematic effect on approval’s mean value, the war had astrong, positive impact on the variance of relief recipients’ approval.Although the indigents’ support for FDR remained high throughout the con-flict, the model suggests that the fierce, sustained struggle weakened thestrength of their conviction concerning Roosevelt’s job performance andmade the president’s standing among the poor more volatile and susceptibleto sudden change.6
The second variance function model reported in column 3 of table 1replaces the crude World War II dummy variable with the logged number ofcombat casualties in the month preceding each poll. Here again, the war had asignificant positive effect on variance, while the size and significance levelsof the coefficient for unemployment remained virtually unchanged.
Finally, the third variance model adds the peacetime radio address variableto the mix. The strong positive coefficient suggests that when FDR took themicrophone for a radio address in peacetime, the variance of relief recipients’approval also increased. This finding reminds us that despite the extensiveliterature on presidential exploitation of “going public” techniques (Barrett 2004;Mouw and MacKuen 1992; Peterson 1990; Tulis 1987), even the president’sstaunchest supporters can have a diverse set of reactions to presidentialspeeches, particularly when they deal with controversial policy proposals suchas Roosevelt’s court-packing plan and programs to expand aid to Britain.Because these new policy proposals can establish conflicting considerations insupporters’ minds, speeches can introduce more volatility into some groups’approval of the president.
First, differences provide insight into the magnitude of each effect onthe error variance. For example, raising unemployment from 5 percent to 15percent in peacetime would increase the standard deviation of the approvaldistribution by 1.43 percentage points. A presidential radio address wouldincrease it by a half point. In wartime, raising the number of combat casualtiesfrom 100 to 1,000 would elevate the distribution’s standard deviation by 1.23percentage points.7
6. These results echo the suggestive finding of Gronke and Brehm (2002, p. 438) that throughoutthe postwar era enemy-initiated foreign conflicts generally have a positive (albeit in their modelstatistically insignificant) impact on the variance of aggregate approval.7. Standard deviations (obtained from simulations in GAUSS) are .45, .35 and .44, respectively.

34 Kriner
Illustrating the war’s effect on variance graphically, figure 2 shows thekernel density plots of 900 simulations of FDR’s approval among the indi-gent. The solid curve represents simulations estimating the model with 100casualties and the dashed curve with 2,000 casualties, with the other explana-tory variables held constant at their means.8 Each curve is essentially the dis-tribution of answers we might expect if we asked the approval question of 900different groups in identical political and economic environments. Each trialreports the percentage of respondents who approved of FDR, and the graphshows the frequency with which we observed each percentage across the 900simulations.
While increasing casualties had no effect on the distribution means, itgreatly influenced the spread of the two approval distributions. The solidcurve representing low casualties is tightly clustered around its mean, whilethe high-casualty dashed curve is more spread out about its mean value. The100 casualties distribution suggests that repeated polls are unlikely to show
8. The mean for monthly casualties during this period was 1,055 with a standard deviation ofalmost 2,000.
Figure 2. Kernel density of simulated approval ratings for FDR among theindigent. Solid line = 100 casualties; dashed line = 2,000 casualties.

Variance in Presidential Approval 35
FDR’s approval dropping below the low seventies. In contrast, the 2,000 casu-alties distribution suggests that observing a rating in the mid-sixties from aparticular survey is certainly not out of the question. Of course, repeated pollscould also return an estimate in the low eighties, greatly overstating supportfor the president. Thus, while increasing the number of casualties has littleeffect on mean approval, it does have a significant impact on the range of out-comes we might expect to observe if we asked the survey repeatedly, evenabsent any change in the other independent variables.
Modeling for systematic changes in the variance also yields new estimatesof the original explanatory variables’ impact on the mean of presidentialapproval. Consistent with the similarities in the peacetime approval trendsacross income groups in figure 1, all three heteroscedastic regressions suggestthat the indigent responded to changes in unemployment and presidentialradio addresses in the same manner as their wealthier compatriots.
Similarly, in the second and third variance models the negative coefficienton the war weariness variable (the logged change in monthly casualties multi-plied by the duration of the conflict) reaches statistical significance, at the .05and .10 levels, respectively. Casualties and the conflict’s duration may havehad some impact on relief recipients’ mean approval, though not to the degreethat it did with the other socioeconomic groups in Baum and Kernell’s (2001)original study.9 Instead, the primary mechanism through which the war shapedrelief recipients’ approval was by dramatically increasing the variance. Thishelps explain why the poor’s opinion of FDR remained high throughout thewar but still varied considerably and at times fell below the level of supportprovided by medium- and low-income Americans for the only time in theseries.10
Individual-Level Analysis
The aggregate-level analysis above strongly suggests that American involvementin World War II, specifically periods of high casualties, increased the volatility
9. For comparison, the coefficients of the variable for high-, medium-, and low-income respon-dents were .12, .15, and .13, respectively. The .06 coefficient for relief recipients in variancemodel 2 shows that even when the war weariness variable reached its maximum value, it resultedin only an approximate 1.5-point drop in mean approval.10. The dramatic changes in the mean coefficients for the model of relief recipients’ approvalafter adding a variance function raised the possibility that similar changes might occur in thehigh-, middle-, and low-income series if subjected to the same analysis. Re-estimating all threeseries with variance functions produced little change in any of the models for the mean. In severalof the variance equations, one of the variables reached statistical significance, but all such find-ings were highly sensitive to specification. While this absence of similar findings for the factorsdriving variance in the other series may at first seem surprising, it is less so when we consider theunusually high R2 values of Baum and Kernell’s models for these series, .98, .97, and .94, respec-tively (compared to .24 for the homoscedastic relief model). The residuals between the predictedand observed values of approval were so small that there was virtually no variance to explain.

36 Kriner
in Franklin Roosevelt’s standing among the poorest 10 percent of Americans.Similarly, high unemployment also appears to have induced instability amongRoosevelt’s most consistently ardent supporters. The previous section sug-gested microfoundations emphasizing the importance of conflicting consider-ations that could have driven these fluctuations in aggregate volatility. Thissection tests these hypotheses more explicitly using individual-level data fromtwo Gallup surveys, one before and one after the attack on Pearl Harbor.
As discussed previously, individual-level variance does not necessarily pro-duce greater approval volatility in the aggregate. Nevertheless, response vari-ability among at least some population subgroup is a necessary, if notsufficient, condition for higher variance at the aggregate level. Thus, this sec-tion endeavors to show that Democratic identifiers who disapproved ofRoosevelt’s conduct of the economy and war held conflicting considerationson which to evaluate the president and consequently had higher response vari-ability than the rest of their copartisans. This greater uncertainty in individualDemocrats’ evaluation of the president in turn could produce the greater vola-tility observed at the aggregate level among relief recipients, the most heavilyDemocratic of the four socioeconomic categories.11
Data and Models
Building on Zaller’s (1992; Zaller and Feldman 1992) conception of thesurvey response as a product of the varied values and considerations churningthrough a respondent’s head at the time the question is asked, Alvarez andBrehm (1995, 2002) have convincingly shown that respondents who drawon highly salient conflicting considerations when answering the question athand are more ambivalent and, consequently, have higher variance in theirresponses. Following Alvarez and Brehm and Gronke (1999), this studyuses a heteroscedastic probit model to analyze the differences in varianceacross groups of individuals in their evaluation of Franklin Roosevelt’s jobperformance.
11. Ideally, we would compare the individual-level findings with aggregate-level data broken outby partisanship instead of economic class; however, Gallup did not routinely ask a party identifi-cation question throughout the period, and so no such series exist. Given this, the heavily Demo-cratic relief recipient category is one of the best available approximations. For two primaryreasons the individual analysis does not limit itself to examining changes in variance among reliefrecipients. First, the hypothesized causal relationships for why the war and the economy shouldproduce changes in the variance underlying different individuals’ evaluations of Roosevelt do notdepend on the respondents’ class. Rather, they emphasize whether an individual draws on con-flicting frames when evaluating the president’s job performance. Those who have strong predis-positions to support Roosevelt—be they relief recipients or simply partisan Democrats—and yetalso hold conflicting economic or policy-specific considerations on which to judge the presidentshould be more variable in their responses. The purpose of this section is to test these micro-levelarguments, not to confirm directly the aggregate-level observations about changes in relief recipi-ents’ variance at an individual level. Practical considerations also led to the shift, given the rela-tively small number of relief recipients in each poll.

Variance in Presidential Approval 37
In his extensive analysis of Gallup data from the period, Adam Berinsky(2004b) identified two methodological problems with Gallup’s collectionprocedures that could bias statistical inferences: the use of population quo-tas instead of random sampling and the considerable discretion granted toGallup interviewers to select whom they surveyed within a quota category.Fortunately, Berinsky proposes two correctional procedures to account forthese biases. As a robustness check, all models were re-estimated with theappropriate controls, which yielded substantively identical results acrossspecifications.12
Like the heteroscedastic linear regression, the heteroscedastic probit modelincludes both a model of the mean, or choice model, which calculates thedirect effect of the explanatory variables on the probability of an individualapproving of the president, and a model of the variance, which describes sys-tematic changes in the size of the error term.13 The choice models differ acrossthe two polls because of variation in polling content. When possible, theyinclude measures of individuals’ partisan orientations, of whether theybelieved their personal economic fortunes had risen or declined over the pre-vious year, of their support or opposition to America’s current conduct of thewar, and demographic information.
Theoretical expectations are straightforward. Democrats should be predis-posed to support Roosevelt, while Republicans should be the least likely toapprove of his job performance. Respondents who approved of America’s wareffort and who perceived that their personal economic fortunes had improved
12. To account for systematic sample selection bias, Berinsky proposes controlling for the quotaselection variables. Therefore, all models were re-estimated including dummy variables for occu-pation, socioeconomic status, geographic region, and respondent age. Even with these controls,all mean and variance results remain substantively unchanged. To control for the possibility ofinterviewer-induced bias, Berinsky offers two suggestions: controlling for the education of therespondent, as this is an important predictor of the type of person interviewers targeted as “desir-able” subjects to interview, and including dummy variables for each interviewer to parse outinterviewer-specific effects. One of the polls analyzed had a measure of respondent education(USAIPO1942-0263) while the other (USAIPO1941-0238) gave interviewer identification num-bers for each respondent. All models were re-estimated including these controls, but the controlswere shown to have little or no impact on the substantive results. This is consistent with Berin-sky’s (2004b) finding that while including the interviewer-specific variables did improve thegoodness of fit, it had negligible impact on the substantive variables of interest.13. Unlike the heteroscedastic linear regression case in which only the mean model is needed todetermine the predicted level of approval, in heteroscedastic probit models the factors in both thechoice model (Xβ) and variance (Zγ) contribute to the final predicted probability of responding inthe affirmative: E(Y) = π = Φ( Xβ / exp(Zγ)). Because variables in both the choice and varianceequation affect the predicted probability, Achen (2002) warns that coefficients in the varianceequation for a variable not also included in the choice model may appear to be driving changes invariance when the explanatory variable actually directly affects the mean. In the models presentedin tables 2 and 3, all variables in the variance equation are also included in the choice equationexcept for the interaction variables, for which there were no theoretical expectations that recom-mended including them in the choice equation. However, this specification may leave open thepossibility that the coefficients for the interaction variables in the variance equation are acciden-tally capturing non-linearities in the choice function. As a robustness check, all models were re-estimated with the interactions included in the choice component; almost all of the relationshipsin the variance equations remained strongly in the expected direction and statistically significant.

38 Kriner
over the previous year should be more likely to support the commander inchief and steward of the national economy, while those who questionedAmerica’s war effort and believed they had regressed economically should beless likely to support FDR. Although most studies of the gender gap describeits emergence as a recent phenomenon (Gilens 1988; Kaufmann and Petrocik1999), even in the 1940s women may have been slightly more likely than mento approve of Roosevelt. Finally, given Roosevelt’s hesitant yet significantfirst steps in civil rights, African-Americans are hypothesized to be morelikely to support Roosevelt, ceteris paribus.
Turning to the variance, we expect response variability to be higher forindividuals who are torn between competing considerations when evaluatingRoosevelt. For example, while all Democrats had a strong partisan predisposi-tion to support Roosevelt, those concerned by economic trends or the conductof the war possessed conflicting bases on which to evaluate the president.These Democrats should have greater variability in their approval responsesthan those who approved of the war and felt their economic position wasimproving.
Results and Discussion
The first poll examined was conducted by the Gallup organization threemonths after Pearl Harbor in March 1942 (USAIPO1942-0263). This pollincluded questions on both the war and the economy, allowing us to testthe effect of both conditions on response variance. Results are presented intable 2.
The results for the choice model accord with theoretical expectations.Partisanship—measured in this poll by each respondent’s preference forwhich party should hold the majority in Congress—was the single mostimportant determinant of a respondent’s approval choice. Democratic support-ers were by far the most likely to approve of Roosevelt, followed by thosewho favored neither party, with those who favored the Republicans being theleast likely. African-Americans and women were also more supportive ofRoosevelt, all else being equal, than other groups. Furthermore, individuals’perception of their personal economic fortunes had a substantial impact, asrespondents who reported that their family incomes had risen in the previousyear were significantly more likely to approve of Roosevelt’s job performance.
The choice model also included three measures of public attitudes towardthe war, all of which suggest a strong relationship between popular reactionsto the conflict and respondents’ evaluation of the commander in chief.Respondents who believed the United States was doing “all it possibly couldto win the war” were more likely to approve of FDR than those who did not.The third of respondents who felt the war would be protracted and last over fiveyears were also significantly less likely to approve of the president. Similarly,

Variance in Presidential Approval 39
Table 2. Individual-Level Presidential Approval, March 1942
NOTE.— All significance tests are two-tailed; all models report robust standard errors (SE).* p < .10.** p < .05.*** p < .01.
Homoscedastic Model
Variance Model 1
Variance Model 2
Independent Variables Coefficient (SE) Coefficient (SE) Coefficient (SE)
Choice ModelDemocrat .779*** .862*** .898***
(.071) (.090) (.086)Republican –.575*** –.451*** –.491***
(.068) (.070) (.071)Economy better .228*** .183*** .222***
(.062) (.061) (.061)Economy worse –.047 –.039 –.016
(.079) (.061) (.071)All to win war .669*** .659*** .641***
(.110) (.105) (.104)Not all to win war .050 .079 .051
(.113) (.108) (.103)War will last 5+ years –.233** –.170*** –.173***
(.063) (.057) (.068)Keep troops on home front –.141** –.125*** –.133***
(.059) (.049) (.054)Female .110** .101** .108**
(.056) (.046) (.051)Black .536*** .427*** .455***
(.162) (.150) (.152)Constant .146 .083 .079
(.122) (.116) (.116)Variance Model
Economy worse — –.334** –.423***(.157) (.165)
Economy worse × Democrat — .490** .568***(.196) (.193)
Not all to win war — –.441** —(.199)
Not all to win × Democrat — .442* —(.231)
War will last 5+ years — — –.179(.146)
5+ years × Democrat — — .265*(.163)
N 2,986 2,986 2,986Log-Likelihood –1331.2 –1325.0 –1326.3

40 Kriner
the near third of respondents who believed the government should keep asmuch of the American armed forces in the United States as needed to assurehomeland defense approved of Roosevelt at a lower rate than those whoinstead favored sending the bulk of the nation’s forces to engage the enemyoverseas.
Column 2 presents a heteroscedastic probit model with an identical choicecomponent and a variance component designed to explore the interaction ofpartisanship, the economy, and the war on the variability in responses acrossindividuals. A likelihood ratio test suggests that we can reject the homosce-dastic model with 99 percent confidence.
First examining perceptions of the economy, the choice equation confirmsthat individuals who responded that their incomes had declined were lesslikely to support the president than those who believed their incomes hadrisen, and the negative coefficient in the variance equation suggests that theseindividuals were also more certain in their lower evaluation. For those respond-ents without a partisan predisposition to support the president, there was noconflict; if anything, the decline in personal economic fortunes could havereinforced predispositions against Roosevelt, partisan or otherwise, therebydecreasing variance. However, the positive coefficient for the lower incomeand Democratic interaction variable shows that Democrats whose incomeshad declined had higher variance and were less stable in their responses. Forthese Democrats, the evaluative frame of personal economic difficulties con-flicted with their partisan predisposition to approve of their fellow Democratin the White House. This conflict resulted in higher variance and less predict-ability in their survey responses.
Turning to the impact of World War II, the third of those surveyed whowere unsatisfied with the U.S. war effort and who were consequently lesslikely to approve of FDR’s job performance were also less variable in theirresponse. The exception again is Democrats. Not approving of the administra-tion’s conduct of the war decreased variance for Republican and independentidentifiers, but for Democrats it had a small positive net effect; more impor-tant, compared with other respondents who felt the administration could domore to win the war, Democrats were significantly more variable in theirapproval choice.14
As a robustness check, the second variance model in column 3 of table 2uses a different measure of public unease over World War II, the expectedduration of the conflict. Again, this model specification provides strong evi-dence that the economy and war, mediated through party attachments, greatlyinfluenced the variance of individual responses. The coefficients on thedeclining income and Democrat-declining income interaction variables are
14. USAIPO1942-0284 asked the same question on whether respondents believed the adminis-tration was doing all it could to win the war. Replicating a similar model on this poll also showedthat Democrats who thought the United States could be doing more to win the war had highervariance in their responses than non-FDR supporters who held the same views on the war.

Variance in Presidential Approval 41
virtually identical to those in the first variance model, as are the relationshipsbetween the alternative war support measures and approval variance. Republi-can and undecided respondents who feared a protracted war were less likely tosupport FDR and more steadfast in their lower opinion of him. However, forDemocrats, the fear of a protracted war both slightly decreased their probabil-ity of approving of Roosevelt and simultaneously increased the variance andunpredictability of their responses.
The analysis next turns to a second poll conducted before Pearl Harbor inMay 1941 (USAIPO1941-0238), the only poll found that asked surveyrespondents if they had heard a presidential radio address. This affords anopportunity both to test earlier conjectures for why radio addresses mightincrease the variability of FDR’s support among some listeners and to exam-ine how fears of impending U.S. involvement in hostilities in Europe and thePacific interacted with partisanship to drive changes in variance. Results aresummarized in table 3.
To supplement the standard party preference and demographic variables, allof which were in the expected direction, the choice model for the May 1941poll also included additional measures of public support for prospectiveAmerican involvement in World War II and a measure of each individual’seconomic status. Respondents who answered that America’s primary foreignpolicy goal should be to aid Great Britain in its struggle against Nazism weresignificantly more likely to approve of FDR, the driving force behind Lend-Lease. In contrast, those who replied that America’s foremost goal should bestaying out of the war were significantly less likely to approve of Roosevelt.Respondents were also asked whether, if put to the people, they would votefor a declaration of war against the Axis powers. As expected, those whoanswered affirmatively were also significantly more likely to approve of FDR.
Baum and Kernell (2001) showed a substantial class divide before PearlHarbor in support for Roosevelt, with the president’s standing among thewealthy being significantly lower than among the other socioeconomic groups.To account for this at an individual level, the model also includes a variablefor whether the individual was coded by the Gallup interviewer as wealthy orabove average. The coefficient is sharply negative and highly statistically sig-nificant, in accordance with Baum and Kernell’s aggregate-level finding.15
Finally, the choice model included a question asking whether each individ-ual heard all or part of Roosevelt’s May 27, 1941, radio address, in which hedeclared an unlimited national emergency and proclaimed that what hadbegun as a European war had become a “a world war for world domination.”While the speech had no impact in the choice equation, it did have a signifi-cant effect on the variance in individuals’ responses.
15. Including the income variable in table 2’s wartime models has no effect on the findings pre-sented, and the variable itself, as predicted by Baum and Kernell (2001), is substantively and sta-tistically insignificant.

42 Kriner
Table 3. Individual-Level Presidential Approval, May 1941
NOTE.— All significance tests are two-tailed; all models report robust standard errors (SE).* p < .10.** p < .05.*** p < .01.
Homoscedastic Model
Variance Model
Independent Variables Coefficient (SE) Coefficient (SE)
Choice ModelDemocrat .855*** 1.311***
(.069) (.162)Republican –.538*** –.398***
(.064) (.084)U.S. should aid Britain .381*** .314***
(.133) (.117)U.S. should stay out –.456*** –.298**
(.131) (.129)Vote to enter war .331*** .237***
(.073) (.069)Heard radio address .068 .081
(.057) (.064)Female .085 .079*
(.057) (.048)Black .436*** .461***
(.177) (.153)Wealthy –.385*** –.295***
(.078) (.076)Constant .320** .166
(.136) (.122)Variance Model
U.S. should stay out — .004(.206)
U.S. should stay out × — .429Democrat (.288)
Heard radio address — –.438***(.145)
Heard radio address × — .580***Democrat (.158)
N 3,127 3,127Log-Likelihood –1429.6 –1420.8

Variance in Presidential Approval 43
The variance equation presents suggestive evidence, even before PearlHarbor, of an interaction between war opposition and partisanship.16 Respondentswho held isolationist leanings were in general no more variable in theirresponses than those who supported FDR’s goal of aiding Britain. However,the large coefficient for the stay out/Democrat interaction variable, eventhough it narrowly fails to reach conventional levels of statistical significance,suggests that even before America entered the war, Democrats who opposedAmerican involvement were more internally conflicted in their evaluation ofRoosevelt.
The radio address variables and interaction produce a similar pattern. Mostrespondents did not favor U.S. involvement in World War II, and Roosevelt’saddress of May 27 only furthered their suspicions that the president wasslowly pushing the country to the brink of war. For these respondents, hearingRoosevelt’s speech decreased the variance in their responses. However,Democrats again are the exception, as those who heard the radio address actuallyhad greater response variability. By priming the public to consider the war andAmerica’s dangerous maneuverings on its periphery, the speech created analternative basis from which to judge FDR, one that for most Democraticrespondents, who opposed U.S. intervention, was in stark contrast to theirpartisan predispositions. Thus, while the choice model shows the speech didlittle to build or erode the mean level of public support for the president, thevariance equation suggests that the address, and the president’s war policies ingeneral, came at the cost of destabilizing support among the White House’score partisan supporters.
Conclusion
Most studies of war and public opinion have described the gradual waning ofpopular support for the president as casualties mount. Impressionistically,World War II seems an exception to the rule as the country rallied aroundRoosevelt after Pearl Harbor and remained steadfastly behind him, even as thenation suffered casualty rates that would dwarf those of all subsequent mili-tary actions. While the absolute level of support for Roosevelt remained highthroughout 1942 and into 1943, this study suggests that the war did take a tollon FDR’s public standing by increasing the volatility of his support amongcore partisan supporters.
The aggregate analysis shows that Roosevelt’s standing among those onfederal relief, previously his most reliable supporters, was substantially morevolatile during the war and in the wake of high casualties. Analyses at theindividual level confirm that the war undermined the depth of Roosevelt’ssupport, particularly among some members of his own party, the bedrock of
16. Again, a likelihood ratio test confirms that we can reject the restricted homoscedastic modelwith 99 percent confidence.

44 Kriner
his political base. Democrats who did not approve of the administration’s con-duct of the war still had a fairly high probability of approving of Roosevelt,but the heteroscedastic probit models suggest their responses were more vari-able than other Democrats who did not share similar concerns about the wareffort. For these partisans, fears concerning the war provided an alternate,conflicting basis on which they might judge Roosevelt, and the result washigher response variance. Thus, even World War II had modest negative con-sequences for the administration at the helm—it weakened the stability of itssupport among its partisan base.17
Expanding this methodological focus on variance to other areas of publicopinion research could yield similar new insights into long-studied questionsof opinion formation and change. For example, remaining within the contextof presidential approval, a variance analysis has the potential to shed new lighton the debate over public rallies in the wake of minor uses of force. Althoughsome scholars have questioned whether rallies exist at all (Lian and Oneal1993), most studies have found that the public does rally around the presidentafter a foreign crisis (Brace and Hinckley 1992; Mueller 1973; Ostrom andSimon 1985). Yet, these rallies have proven remarkably transient, and popularsupport for the president usually quickly dissipates back to previous levels. Avariance perspective offers two explanations for these dynamics. First, thesupport of those who previously opposed the president may be inherentlyunstable. In the immediate aftermath of an American military action, evenpartisan opponents or nonpartisans may rally around the flag and behind thecommander in chief (Baum 2002), but this wartime evaluative frame is in con-flict with their preexisting bent against the president. This internal conflictcreates greater variability underlying their responses, making such supportinherently unstable and subject to change. Additionally, building on Brody(1991; Brody and Shapiro 1989), when opposition elites vocally criticizeadministration policy, they trigger respondents’ preexisting reasons for disap-proving of the president and exacerbate the internal conflict within those who mayhave initially rallied behind the White House. By emphasizing alternativeframes through which these respondents might disapprove of the president, elitecriticism erodes both the level and stability of popular support for the president.
While variance models may not radically change our understanding,gleaned from 30 years of research, of the forces driving changes in aggregate
17. This finding provides a potential explanation for Gallup’s puzzling discontinuation of theapproval question in 1943. Baum and Kernell (2001, p. 203) speculate that Gallup stopped askingthe question, or at least stopped publicly announcing the results, for fear that declining support forRoosevelt would provide a propaganda victory for the Axis; yet, FDR’s approval rating was still72 percent in the last poll taken. (Gallup stopped reporting the latest approval numbers by pressrelease sometime in 1942. The last regularly taken poll was March 26–31, 1943. There does seemto have been another poll taken in December 1943 [66 percent approving], but this was an isolatedpoll and not included in Baum and Kernell’s analysis.) Perhaps the Gallup organization also per-ceived greater volatility in the popular mood and a wavering of support for the president, even ifthe rating itself had yet to fall substantially.

Variance in Presidential Approval 45
approval, they may help identify the factors that influence both the volatilityof this ubiquitous measure of a president’s political capital and the variabilityunderlying individuals’ responses to the Gallup survey question. Similarly,expanding traditional lines of research across the public opinion literature toinvestigate the factors driving changes in the variance of survey responsescould produce a richer understanding of the complex processes driving opin-ion change over time.
References
Achen, Christopher. 2002. “Toward a New Political Methodology: Microfoundations and ART.”Annual Review of Political Science 5:423–50.
Alvarez, R. Michael, and John Brehm. 1995. “American Ambivalence Towards Abortion Policy:Development of a Heteroscedastic Probit Model of Competing Values.” American Journal ofPolitical Science 39:1055–82.
———. 1997. “Are Americans Ambivalent Towards Racial Policies?” American Journal ofPolitical Science 41:345–74.
———. 2002. Hard Choices, Easy Answers: Values, Information, and American Public Opinion.Princeton, NJ: Princeton University Press.
Barrett, Andrew. 2004. “Gone Public: The Impact of Going Public on Presidential LegislativeSuccess.” American Politics Research 32:338–70.
Baum, Matthew. 2002. “The Constituent Foundations of the Rally-Round-the-Flag Phenome-non.” International Studies Quarterly 46:263–98.
Baum, Matthew, and Samuel Kernell. 2001. “Economic Class and Popular Support for FranklinRoosevelt in War and Peace.” Public Opinion Quarterly 65:198–229.
Beck, Nathaniel. 1991. “Comparing Dynamic Specifications: The Case of PresidentialApproval.” Political Analysis 3:51–88.
Berinsky, Adam. 2004a. “American Public Opinion and World War II: A Research Agenda andSome Preliminary Findings.” Working paper, Massachusetts Institute of Technology.
———. 2004b. “American Public Opinion in the 1930s and 1940s: The Analysis of Quota-Controlled Sample Survey Data.” Working paper, Massachusetts Institute of Technology.
Brace, Paul, and Barbara Hinckley. 1991. “The Structure of Presidential Approval.” Journal ofPolitics 53:993–1017.
———. 1992. Follow the Leader. New York: Basic Books.Braumoeller, Bear. 2003. “Explaining Variance: Rethinking Social Causation.” Working Paper,
Harvard University.Brody, Richard A. 1991. Assessing the President: The Media, Elite Opinion, and Public Support.
Stanford, CA: Stanford University Press.Brody, Richard, and Catherine Shapiro. 1989. “A Reconsideration of the Rally Phenomenon in
Public Opinion.” In Political Behavior Annual, ed. Samuel Long, pp. 77–102. Boulder, CO:Westview Press.
Burden, Barry, and Anthony Mughan. 2003. “International Economy and Presidential Approval.”Public Opinion Quarterly 67:555–78.
Burk, James. 1999. “Public Support for Peacekeeping in Lebanon and Somalia: Assessing theCasualties Hypothesis.” Political Science Quarterly 114:53–78.
Canes-Wrone, Brandice. 2001. “The President’s Legislative Influence from Public Appeals.”American Journal of Political Science 45(2):313–19.
Clarke, Harold, and Marianne Stewart. 1994. “Prospections, Retrospections, and Rationality: The‘Bankers’ Model of Presidential Approval Reconsidered.” American Journal of Political Sci-ence 38:1104–23.
Converse, Philip E. 1964. “The Nature of Belief Systems in Mass Publics.” In Ideology and Dis-content, ed. David Apter, pp. 206–61. New York: Free Press.
Davidian, M., and R. J. Carroll. 1987. “Variance Function Estimation.” Journal of the AmericanStatistical Association 82:1079–91.

46 Kriner
Druckman, James, and Justin Holmes. 2004. “Does Presidential Rhetoric Matter? Priming andPresidential Approval.” Presidential Studies Quarterly 34:755–78.
Edwards, George, and Tami Swensen. 1997. “Who Rallies? The Anatomy of a Rally Event.”Journal of Politics 59:200–212.
Erikson, Robert, Michael MacKuen, and James Stimson. 2002. The Macro Polity. New York:Cambridge University Press.
Franklin, Charles. 1991. “Eschewing Obfuscation? Campaigns and Perceptions of U.S. SenateIncumbents.” American Political Science Review 85:1193–214.
Gartner, Scott Sigmund, and Gary M. Segura. 1998. “War, Casualties, and Public Opinion.” Jour-nal of Conflict Resolution 42:278–300.
———. 2000. “Race, Casualties, and Opinion in the Vietnam War.” Journal of Politics62:115–46.
Gartner, Scott Sigmund, Gary M. Segura, and Michael Wilkening. 1997. “All Politics Are Local:Local Losses and Individual Attitudes toward the Vietnam War.” Journal of Conflict Resolu-tion 41:669–94.
Gilens, Martin. 1988. “Gender and Support for Reagan: A Comprehensive Model of PresidentialApproval.” American Journal of Political Science 32:19–49.
Gronke, Paul. 1999. “Policies, Prototypes, and Presidential Approval.” Paper presented at theannual meeting of the American Political Science Association, Atlanta, GA.
Gronke, Paul, and John Brehm. 2002. “History, Heterogeneity, and Presidential Approval: AModified ARCH Approach.” Electoral Studies 21:425–52.
Gronke, Paul, and Brian Newman. 2003. “From FDR to Clinton, From Mueller to ?: A FieldEssay on Presidential Approval.” Political Research Quarterly 56:501–12.
Harvey, Andrew C. 1990. The Econometric Analysis of Time Series. Cambridge, MA: MIT Press.Hibbs, Douglas A., Jr., R. Douglas Rivers, and Nicholas Vasilatos. 1982. “The Dynamics of Polit-
ical Support for American Presidents among Occupational and Partisan Groups.” AmericanJournal of Political Science 26:312–32.
Kaufmann, Karen, and John Petrocik. 1999. “The Changing Patterns of American Men: Under-standing the Sources of the Gender Gap.” American Journal of Political Science 43:864–87.
Kernell, Samuel. 1978. “Explaining Presidential Popularity. How Ad Hoc Theorizing, MisplacedEmphasis, and Insufficient Care in Measuring One’s Variables Refuted Common Sense andLed Conventional Wisdom Down the Path of Anomalies.” American Political Science Review72:506–22.
———. 1997. Going Public: New Strategies of Presidential Leadership. Washington, DC: CQ Press.King, Gary. 1998. Unifying Political Methodology: The Likelihood Theory of Statistical Infer-
ence. Ann Arbor: University of Michigan Press.Larson, Eric. 1996. Casualties and Consensus: The Historical Role of Casualties in Domestic
Support for U.S. Wars and Military Operations. Santa Monica, CA: RAND.Lebo, Matthew, ed. 2000. “Advances in the Analysis of Political Time Series.” Special volume of
Electoral Studies 19(1).Lian, Bradley, and John R. Oneal. 1993. “Presidents, the Use of Military Force, and Public Opin-
ion.” Journal of Conflict Resolution 37:277–300.MacKuen, Michael, Robert Erikson, and James Stimson. 1992. “Peasants or Bankers? The American
Electorate and the U.S. Economy.” American Political Science Review 86:596–611.Miller, Arthur. 1999. “Sex, Politics, and Public Opinion: What Political Scientists Learned from
the Clinton-Lewinsky Scandal.” PS: Political Science and Politics 32:721–29.Miller, Joanne, and Jon Krosnick. 1996. “News Media Impact on the Ingredients of Presidential
Evaluations: A Program of Research on the Priming Hypothesis.” In Political Persuasion andAttitude Change, ed. Diane Mutz, Paul Sniderman, and Richard Brody, pp. 79–99. Ann Arbor:University of Michigan Press.
Monroe, Kirsten. 1978. “Economic Influences on Presidential Popularity.” Public Opinion Quar-terly 42:360–69.
Morgan, Clifton, and Sally Campbell. 1991. “Domestic Structures, Decisional Constraints, andWar.” Journal of Conflict Resolution 35:187–211.
Mouw, Calvin, and Michael MacKuen. 1992. “The Strategic Configuration, Personal Influence,and Presidential Power in Congress.” Western Political Quarterly 45:579–608.
Mueller, John. 1970. “Presidential Popularity from Truman to Johnson.” American Political Sci-ence Review 64:18–34.

Variance in Presidential Approval 47
———. 1973. War, Presidents, and Public Opinion. New York: John Wiley and Sons.Neustadt, Richard. 1990. Presidential Power and the Modern Presidents. New York: Free Press.Ostrom, Charles, and Dennis Simon. 1985. “Promise and Performance: A Dynamic Model of
Presidential Popularity.” American Political Science Review 79:334–58.Page, Benjamin, and Robert Shapiro. 1988. “Foreign Policy and the Rational Public.” Journal of
Conflict Resolution 32:211–47.———. 1992. The Rational Public: Fifty Years of Trends in Americans’ Policy Preferences.
Chicago: University of Chicago Press.Peterson, Mark. 1990. Legislating Together: The White House and Capitol Hill from Eisenhower
to Reagan. Cambridge, MA: Harvard University Press.Ragsdale, Lyn. 1987. “Presidential Speechmaking and the Public Audience: Individual Presidents
and Group Attitudes.” Journal of Politics 49:704–36.Ray, James Lee. 1995. Democracy and International Conflict: An Evaluation of the Democratic
Peace Proposition. Columbia: University of South Carolina Press.Russett, Bruce. 1990. Controlling the Sword: The Democratic Governance of National Security.
Cambridge, MA: Harvard University Press.Schwarz, Benjamin. 1994. Casualties, Public Opinion and U.S. Military Intervention: Implica-
tions for U.S. Regional Deterrence Strategies. Santa Monica, CA: RAND.Sonner, Molly, and Clyde Wilcox. 1999. “Forgiving and Forgetting: Public Support for Bill Clinton
during the Lewinsky Scandal.” PS: Political Science and Politics 32:554–57.Stimson, James. 1990. “A Macro Theory of Information Flow.” In Information and Democratic
Processes, ed. John Freeman and James Kuklinski, pp. 345–68. Chicago: University ofChicago Press.
Tulis, Jeffrey. 1987. The Rhetorical Presidency. Princeton, NJ: Princeton University Press.Wittkopf, Eugene. 1990. Faces of Internationalism: Public Opinion and American Foreign Pol-
icy. Durham, NC: Duke University Press.Wood, B. Dan. 2000. “Weak Theories and Parameter Instability: Using Flexible Least Squares
to Take Time Varying Relationships Seriously.” American Journal of Political Science44:603–18.
Zaller, John. 1992. The Nature and Origins of Mass Opinion. New York: Cambridge UniversityPress.
Zaller, John, and Stanley Feldman. 1992. “A Simple Theory of the Survey Response:Answering Questions versus Revealing Preferences.” American Journal of Political Sci-ence 36(3):579–616.