Embed Size (px)
Citation preview

EXAMPLE 1 Graph y = b for 0 < b < 1x
Graph y =12
x
SOLUTION
STEP 1 Make a table of values
STEP 2 Plot the points from the table.
STEP 3 Draw, from right to left, a smooth curve that begins just above the x-axis, passes through the plotted points, and moves up to the left.

EXAMPLE 2 Graph y = ab for 0 < b < 1x
Graph the function.
a. Graph y = 214
x
SOLUTION
Plot (0, 2) and .Then,
from right to left, draw a curve that begins just above the x-axis, passes through the two points, and moves up to the left.
1, 12
a.

EXAMPLE 2 Graph y = ab for 0 < b < 1x
b. Graph y = –325
xGraph the function.
SOLUTION
Plot (0, –3) and .
Then,from right to left, draw a curve that begins just below the x-axis, passes through the two points,and moves down to the left.
b. 1, – 65

EXAMPLE 3 Graph y = ab + k for 0 < b < 1x – h
Graph y = 3 –2. State the domain and range.
12
x+1
SOLUTION
Begin by sketching the graph
of y = , which passes
through (0, 3) and . Then
translate the graph left 1 unit and down 2 units .Notice that the translated graph passes through (– 1, 1) and
312
x
32
1,
– 1 2
0,

EXAMPLE 3 Graph y = ab + k for 0 < b < 1x – h
The graph’s asymptote is the line y = –2. The domain is all real numbers, and the range is y > –2.

EXAMPLE 4 Solve a multi-step problem
• Write an exponential decay model giving the snowmobile’s value y (in dollars) after t years. Estimate the value after 3 years.
• Graph the model.
• Use the graph to estimate when the value of the snowmobile will be $2500.
A new snowmobile costs $4200. The value of the snowmobile decreases by 10% each year.
Snowmobiles

EXAMPLE 4 Solve a multi-step problem
The initial amount is a = 4200 and the percent decrease is r = 0.10. So, the exponential decay model is:
Write exponential decay model.
Substitute 4200 for a and 0.10 for r.
Simplify.
y = a(1 – r) t
= 4200(1 – 0.10)t
= 4200(0.90)t
When t = 3, the snowmobile’s value is y = 4200(0.90)3 = $3061.80.
SOLUTION
STEP 1

EXAMPLE 4 Solve a multi-step problem
The graph passes through the points (0, 4200) and (1, 3780).It has the t-axis as an asymptote. Plot a few other points. Then draw a smooth curve through the points.
Using the graph, you can estimate that the value of the snowmobile will be $2500 after about 5 years.
STEP 2
STEP 3

EXAMPLE 1 Simplify natural base expressions
Simplify the expression.
a. e2 e5 = e2 + 5
= e7
b. 12e4
3e3 = e4 – 34
= 4e
(5 )c. e –3x 2 = 52 (e –3x )2
= 25e –6x
= 25e6x

EXAMPLE 2 Evaluate natural base expressions
Use a calculator to evaluate the expression.
a. e4
b. e –0.09
Expression Keystrokes Display
54.59815003
0.9139311853
[ ]ex4
[ ]ex0.09

EXAMPLE 3 Graph natural base functions
Graph the function. State the domain and range.
a. y = 3e 0.25x
SOLUTION
Because a = 3 is positive and r = 0.25 is positive, the function is an exponential growth function. Plot the points (0, 3) and (1, 3.85) and draw the curve.
The domain is all real numbers, and the range is y > 0.
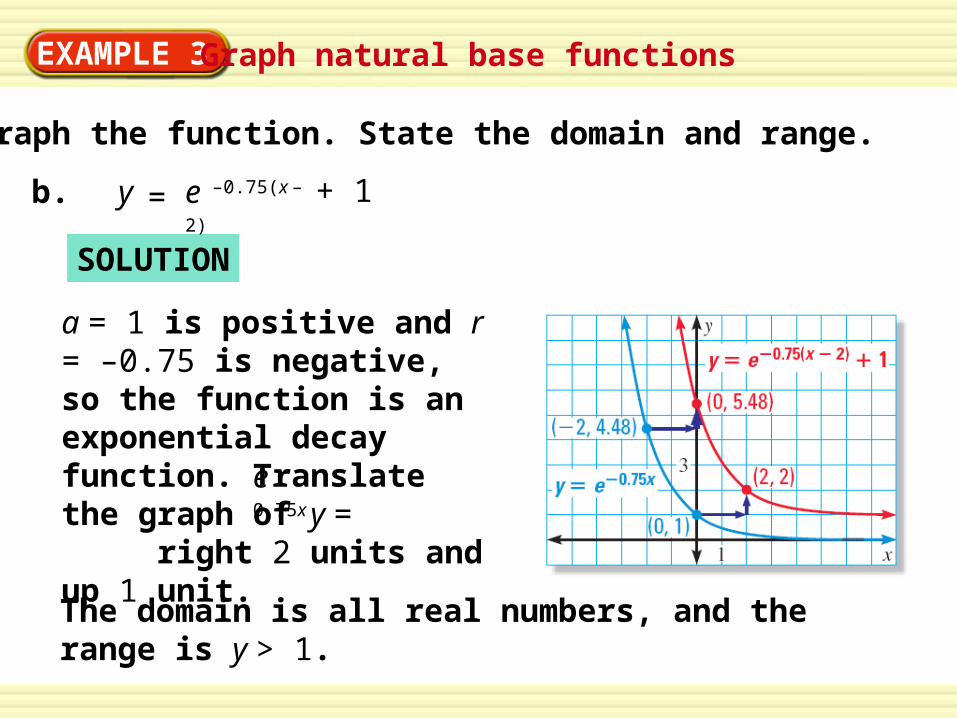
EXAMPLE 3 Graph natural base functions
Graph the function. State the domain and range.
SOLUTION
The domain is all real numbers, and the range is y > 1.
b. y = e –0.75(x – 2) + 1
a = 1 is positive and r = –0.75 is negative, so the function is an exponential decay function. Translate the graph of y = right 2 units and up 1 unit.
e –0.75x

EXAMPLE 4 Solve a multi-step problem
BiologyThe length l (in centimeters) of a tiger shark can be modeled by the function
e –0.178tl = 337 – 276
where t is the shark’s age (in years).
• Graph the model.
• Use the graph to estimate the length of a tiger shark that is 3 years old.
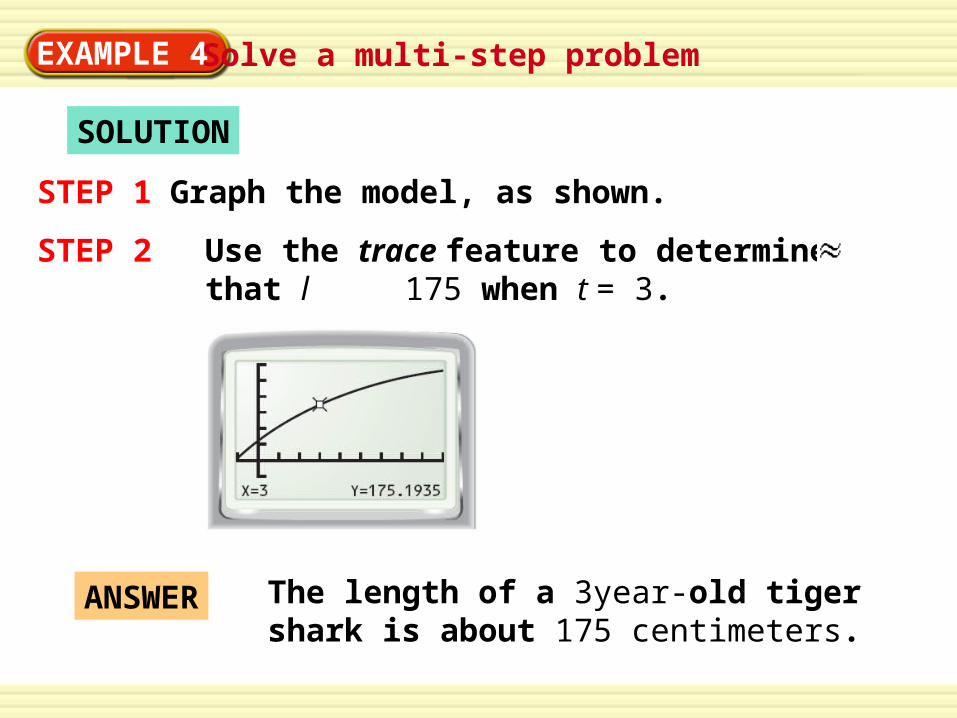
EXAMPLE 4 Solve a multi-step problem
SOLUTION
STEP 1 Graph the model, as shown.
STEP 2 Use the trace feature to determine that l 175 when t = 3.
The length of a 3year-old tiger shark is about 175 centimeters.
ANSWER

EXAMPLE 5 Model continuously compounded interest
A = Pert
SOLUTION
Finance
You deposit $4000 in an account that pays 6% annual interest compounded continuously. What is the balance after 1 year?
Use the formula for continuously compounded interest.
Write formula.
Substitute 4000 for P, 0.06 for r, and 1 for t.= 4000 e0.06(1)
4247.35 Use a calculator.
The balance at the end of 1 year is $4247.35.ANSWER

EXAMPLE 1 Rewrite logarithmic equations
Logarithmic Form Exponential Form
23 = 8a. =2
log 8 3
40 = 1b. 4
log 1 = 0
=c. 12
log 12 1
=d. 1/4
log –14
121 = 12
4=–11
4

EXAMPLE 2 Evaluate logarithms
4loga. 64
b. 5
log 0.2
Evaluate the logarithm.
blogTo help you find the value of y, ask yourself what
power of b gives you y.
SOLUTION
4 to what power gives 64?a. 4
log43 64, so= 3.=64
5 to what power gives 0.2?b. =5–1 0.2, so –1.0.25
log =

EXAMPLE 2 Evaluate logarithms
Evaluate the logarithm.
blogTo help you find the value of y, ask yourself what
power of b gives you y.
SOLUTION
=–31
5 125, so1/5
log 125 =–3.c. to what power gives 125?15
d. 36 to what power gives 6? 361/2 6, so36
log 6= =12
.
d. 36
log 6
c. 1/5
log 125

EXAMPLE 3 Evaluate common and natural logarithms
Expression Keystrokes Display
a. log 8
b. ln 0.3
Check
8
.3
0.903089987
–1.203972804
100.903 8
0.3e –1.204

EXAMPLE 4 Evaluate a logarithmic model
Tornadoes
The wind speed s (in miles per hour) near the center of a tornado can be modeled by
where d is the distance (in miles) that the tornado travels. In 1925, a tornado traveled 220 miles through three states. Estimate the wind speed near the tornado’s center.
93 log d + 65s =

EXAMPLE 4 Evaluate a logarithmic model
SOLUTION
= 93 log 220 + 65
Write function.
93(2.342) + 65
= 282.806
Substitute 220 for d.
Use a calculator.
Simplify.
The wind speed near the tornado’s center was about 283 miles per hour.
ANSWER
93 log d + 65s =

EXAMPLE 5 Use inverse properties
Simplify the expression.
a. 10log4 b. 5
log 25x
SOLUTION
Express 25 as a power with base 5.
a. 10log4 = 4
b. 5
log 25x = (52) x
5log
=5
log 52x
2x=
Power of a power property
blog xb = x
blog bx = x

EXAMPLE 6 Find inverse functions
Find the inverse of the function.
SOLUTION
b.
a. y = 6 x b. y = ln (x + 3)
a.
6log
From the definition of logarithm, the inverse ofy = 6 x is y = x.
Write original function.y = ln (x + 3)Switch x and y.x = ln (y + 3)
Write in exponential form.
Solve for y.
=ex (y + 3)
=ex – 3 y
ANSWER The inverse of y = ln (x + 3) is y = ex – 3.

EXAMPLE 7 Graph logarithmic functions
Graph the function.
SOLUTION
a. y =3
log x
Plot several convenient points, such as (1, 0), (3, 1), and (9, 2). The y-axis is a vertical asymptote.
From left to right, draw a curve that starts just to the right of the y-axis and moves up through the plotted points, as shown below.

EXAMPLE 7 Graph logarithmic functions
Graph the function.
SOLUTION
b. y =1/2
log x
Plot several convenient points, such as (1, 0), (2, –1), (4, –2), and (8, –3). The y-axis is a vertical asymptote.
From left to right, draw a curve that starts just to the right of the y-axis and moves down through the plotted points, as shown below.
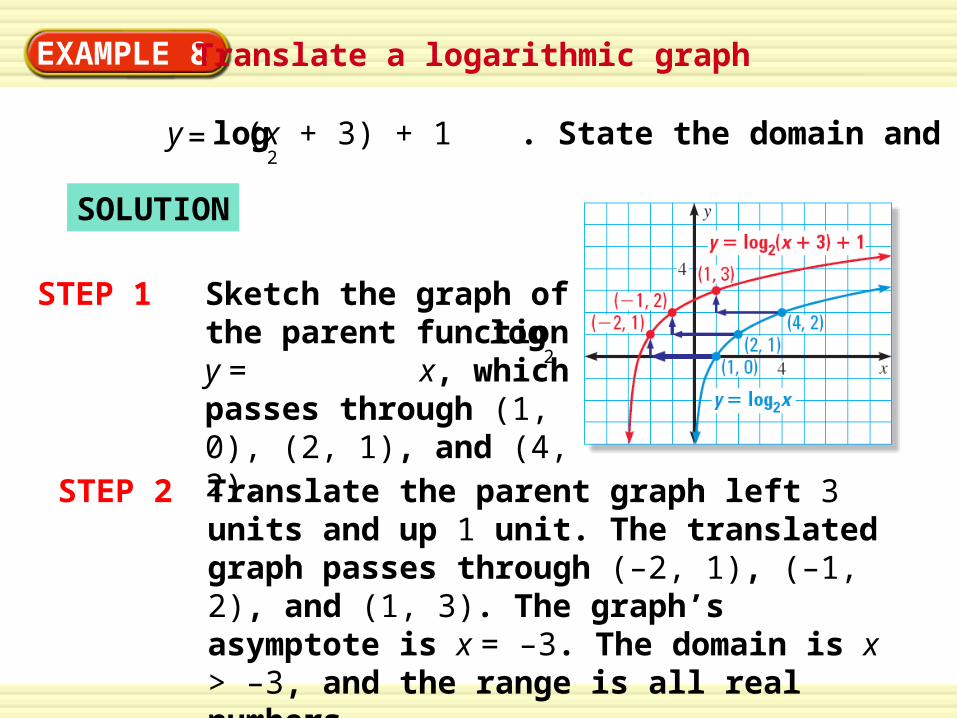
EXAMPLE 8 Translate a logarithmic graph
SOLUTION
STEP 1
Graph . State the domain and range.y =2
log (x + 3) + 1
STEP 2
Sketch the graph of the parent function y = x, which passes through (1, 0), (2, 1), and (4, 2).
2log
Translate the parent graph left 3 units and up 1 unit. The translated graph passes through (–2, 1), (–1, 2), and (1, 3). The graph’s asymptote is x = –3. The domain is x > –3, and the range is all real numbers.


![A Step-By-Step Guide to Building an Excel Graph [Quick Tip]](https://img.pdfslide.net/doc/110x75/577cd96c1a28ab9e78a37563/a-step-by-step-guide-to-building-an-excel-graph-quick-tip.jpg)