Embed Size (px)
Citation preview
APPENDIX 20
EXAMPLE OF CMBS DEAL STRUCTURE ATTHE HEIGHT OF THE PRE-FINANCIALCRISIS BOOM
As noted in the main body of Chapter 20, the CMBS industry suffered a tremendousshock during and in the aftermath of the financial crisis of 2008. The result willforever change the industry, including the regulatory environment in which it oper-
ates. Nevertheless, we feel it is educational to examine what a typical real world CMBS dealstructure was like before the crisis, at the peak of the boom of the mid-2000s decade. Thiscan be instructive in part because you can see some of the features of the industry that weresymptoms of, or even causes of, the weakness that actually underlay the deals being done atthe peak in 2006–2007 (although unbeknownst to many in the industry at that time). But aglimpse at a typical deal of that era can also be of interest because some of the features ofCMBS in those days were useful and may remain or again become characteristic of theindustry. This example can give you an idea about the richness and complexity of actualreal world CMBS deals, better than our simpler examples in the main text. In fact, thedeal we will show you here was not from the “worst” of the boom. It was from late in2005, just prior to the most aggressive lending and structuring and rating. See what youthink about it.
Exhibit 20A-1 shows the structure, including bond ratings and pricing, of a $1.5 billionCMBS transaction from 2005, derived from a pool of 210 commercial and multifamily mort-gage loans. Perhaps most striking to the new reader is how much more complex is this realworld deal than the simple stylized three-tranche numerical example introduced for pedagog-ical purposes in the main chapter. The illustrative deal here has a much larger number oftranches, with varying levels of subordination (credit support) ranging from AAA down tononrated (NR), including a variety of intermediate classes rated AA to BBB– that are oftencalled mezzanine tranches.1 Any loan principal repayments start at the top, going to the Atranches (sequentially to classes A-1 through A-J) until they are fully retired, then to the mez-zanine tranches (classes B through H) until they are fully retired, and then to the lower-ratedtranches. In contrast, all losses of par value due to default start at the bottom, going first tothe P tranche until it is retired, then to the O tranche until it is fully retired, and then to theN tranche until it is fully retired, and so forth. In addition, the most senior triple-A tranchesare differentiated by maturity (are “time-tranched”), having expected lives ranging fromabout 3 years to 10 years.2 The bulk of the pool par value, $1.367 billion (or 88 percent), issold as senior AAA-rated securities, at yields lower than those on the underlying whole loans.Less than 5 percent of the deal, bonds rated BB down to nonrated (NR, the first-loss tranche),
1CMBS structures had evolved significantly over the decade prior to 2005, and were by then much more complexthan they were earlier, or would be again shortly after the financial crisis. However, they became even larger andoften slightly more complex in 2006 and 2007 after this example 2005 deal that is described here.2Maturity tranching was first developed in collateralized mortgage obligations (CMO) securities based on residentialMBS. By concentrating and stratifying the maturity (and hence the interest rate risk) of a pool that contains individ-ual loans of varying maturity and prepayment risk, the usefulness of the securities is increased for certain types ofinvestors, such as those trying to implement maturity matching or immunization-oriented strategies. It also enablesthe bond issuer to price the various securities at different points along the yield curve.
1© 2014 OnCourse Learning. All Rights Reserved. May not be scanned, copied or duplicated, or posted to a publicly accessible website, in whole or in part.
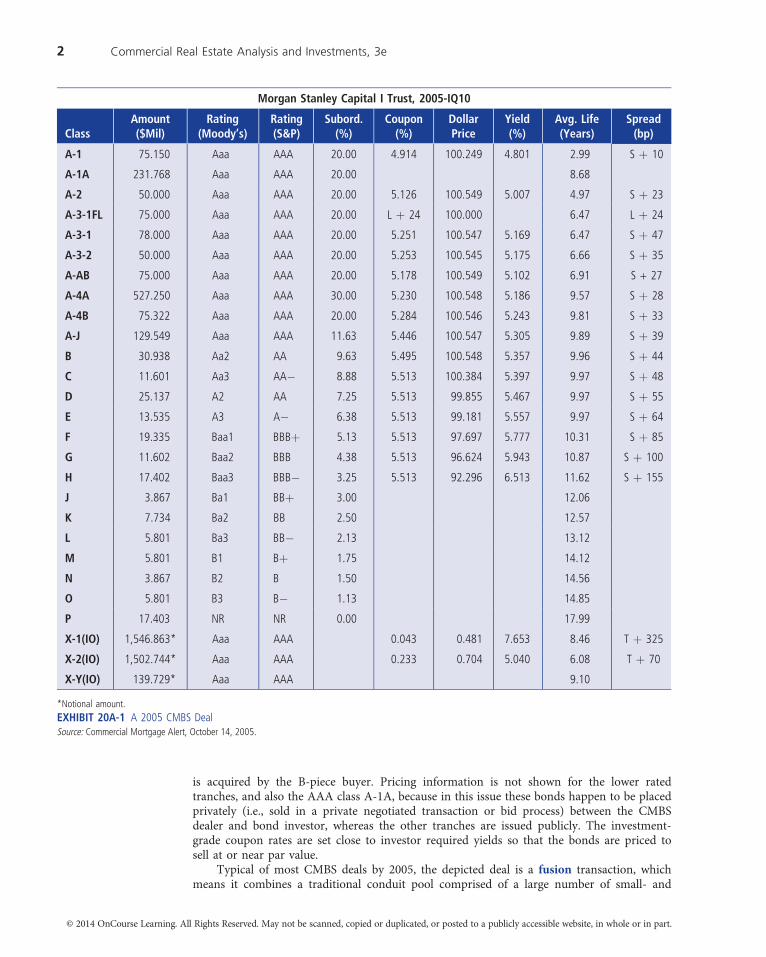
is acquired by the B-piece buyer. Pricing information is not shown for the lower ratedtranches, and also the AAA class A-1A, because in this issue these bonds happen to be placedprivately (i.e., sold in a private negotiated transaction or bid process) between the CMBSdealer and bond investor, whereas the other tranches are issued publicly. The investment-grade coupon rates are set close to investor required yields so that the bonds are priced tosell at or near par value.
Typical of most CMBS deals by 2005, the depicted deal is a fusion transaction, whichmeans it combines a traditional conduit pool comprised of a large number of small- and
Morgan Stanley Capital I Trust, 2005-IQ10
ClassAmount($Mil)
Rating(Moody’s)
Rating(S&P)
Subord.(%)
Coupon(%)
DollarPrice
Yield(%)
Avg. Life(Years)
Spread(bp)
A-1 75.150 Aaa AAA 20.00 4.914 100.249 4.801 2.99 S þ 10
A-1A 231.768 Aaa AAA 20.00 8.68
A-2 50.000 Aaa AAA 20.00 5.126 100.549 5.007 4.97 S þ 23
A-3-1FL 75.000 Aaa AAA 20.00 L þ 24 100.000 6.47 L þ 24
A-3-1 78.000 Aaa AAA 20.00 5.251 100.547 5.169 6.47 S þ 47
A-3-2 50.000 Aaa AAA 20.00 5.253 100.545 5.175 6.66 S þ 35
A-AB 75.000 Aaa AAA 20.00 5.178 100.549 5.102 6.91 S + 27
A-4A 527.250 Aaa AAA 30.00 5.230 100.548 5.186 9.57 S þ 28
A-4B 75.322 Aaa AAA 20.00 5.284 100.546 5.243 9.81 S þ 33
A-J 129.549 Aaa AAA 11.63 5.446 100.547 5.305 9.89 S þ 39
B 30.938 Aa2 AA 9.63 5.495 100.548 5.357 9.96 S þ 44
C 11.601 Aa3 AA� 8.88 5.513 100.384 5.397 9.97 S þ 48
D 25.137 A2 AA 7.25 5.513 99.855 5.467 9.97 S þ 55
E 13.535 A3 A� 6.38 5.513 99.181 5.557 9.97 S þ 64
F 19.335 Baa1 BBBþ 5.13 5.513 97.697 5.777 10.31 S þ 85
G 11.602 Baa2 BBB 4.38 5.513 96.624 5.943 10.87 S þ 100
H 17.402 Baa3 BBB� 3.25 5.513 92.296 6.513 11.62 S þ 155
J 3.867 Ba1 BBþ 3.00 12.06
K 7.734 Ba2 BB 2.50 12.57
L 5.801 Ba3 BB� 2.13 13.12
M 5.801 B1 Bþ 1.75 14.12
N 3.867 B2 B 1.50 14.56
O 5.801 B3 B� 1.13 14.85
P 17.403 NR NR 0.00 17.99
X-1(IO) 1,546.863* Aaa AAA 0.043 0.481 7.653 8.46 T þ 325
X-2(IO) 1,502.744* Aaa AAA 0.233 0.704 5.040 6.08 T þ 70
X-Y(IO) 139.729* Aaa AAA 9.10
Source: Commercial Mortgage Alert, October 14, 2005.
*Notional amount.EXHIBIT 20A-1 A 2005 CMBS Deal
2 Commercial Real Estate Analysis and Investments, 3e
© 2014 OnCourse Learning. All Rights Reserved. May not be scanned, copied or duplicated, or posted to a publicly accessible website, in whole or in part.

medium-sized loans, each of which might be rated BB or BB� as a stand-alone security, and asmall number of large loans that are typically investment-grade and often from high credit-worthy, experienced borrowers. The 10 largest loans in the pool range in size from $50 millionto $196 million and have an aggregate par value of $721 million, accounting for almost50 percent of the pool balance. The remaining 200 loans are relatively small, averagingabout $4 million each. The CMBS market began to move towards this model of mixing
LARGE LOANS IN CMBS POST 9/11: FUSION, A/B NOTES & PARI PASSU
We have used the term “conduit” loan rather loosely to describea commercial mortgage loan that is originated with the intent ofbeing securitized. In fact a traditional conduit CMBS deal wasactually narrowly defined as one with a large number of small- tomid-sized loans (usually in the $1 million to $20 million rangewith B to BB credit quality). Prior to the terrorist attacks onSeptember 11, 2001, it was common to see both traditionalconduit CMBS deals as well as CMBS bonds backed by single,large institutional-quality mortgage(s). After 9/11, single-borrower, large loan securitizations began to disappear due toinvestor concerns about lack of diversity and the resulting CMBStransaction structures. Issuers began to break large loans into“A/B note” structures, with the A-note or senior participation,included in a CMBS pool, with the B-note or junior participationtypically held outside of the trust. Issuers also began to split largeloans into multiple equal payment priority “pari passu notes”
By 2005, most CMBS deals were structured as fusion deals,which combined a traditional conduit loan structure with one ormore large institutional-grade loans, or pieces of them (“A” or“pari passu” notes).1 From bond investor and rating agency per-spectives, the fusion structure represented the combination oftwo separate components that had to be analyzed individuallyand then together as a package to quantify the net effectof the tradeoff between conduit diversity and large loan credit
that were then placed in a number of different CMBS deals (paripassu is Latin for “on equal footing” or “without partiality”),reducing the event risk of any one loan on the rest of the pool.Pari passu notes, while not necessarily all the same size, havean equal payment priority for the allocation of principal, inter-est, and losses. While the practice of spreading notes from asingle large mortgage loan across multiple securitizations hasadvantages, it also adds complexity to the CMBS structure andcreates uncertainty (or adds a layer of risk), especially forB-piece buyers and special servicers, with respect to the rightsof investors, and resolution time in the event of default in thecase of a loan workout. By 2005, the time of our example dealhere, this had become less of a concern as the average size ofCMBS transactions had increased significantly, so that dealerswere able to put more large loans into CMBS pools without firstsplitting them up.
CMBS Issuance by Deal Type (%) 2005* 2004 2003 2002
Conduit 3.1 6.8 18.3 33.1
Fusion 77.7 72.7 49.6 32.9
Single Borrower/Large Loan 7.7 5.5 8.8 6.6
Seasoned Collateral 1.2 0.3 3.4 5.7
Short-Term/ Floating Rate 10.3 14.1 18.7 20.2
Other 0.0 0.6 1.2 1.6
Average CMBS Deal Size ($Millions) 2005 2004 2003 2002
1,674 1,095 794 713
quality, in determining ratings and subordination levels. Theinclusion of the large loan(s) reduced the diversity of the loanpool, but improved the average credit quality of the overall fusiontransaction since large loans tended to be of investment-gradequality.
1An industry rule of thumb used to define a fusion deal was that the top10 sized loans accounted for at least 40 percent of the pool.
*As of the end of September.Source: Commercial Mortgage Alert, Morgan Stanley.
APPENDIX 20 EXAMPLE OF CMBS DEAL STRUCTURE AT THE HEIGHT 3
© 2014 OnCourse Learning. All Rights Reserved. May not be scanned, copied or duplicated, or posted to a publicly accessible website, in whole or in part.
large loans with a big pool of small loans following the terrorist attacks of September 2001 asa means of reducing concentration risk related to large loans (see the boxed feature, “LargeLoans in CMBS Post 9/11: Fusion, A/B Notes & Pari Passu”).
The structure in Exhibit 20A-1 contains a number of features that were relatively new toCMBS deals in 2005. These relate primarily to the creation of new types of AAA tranchesthat appealed to different investor clienteles and illustrate how the CMBS market continuedto evolve rapidly during the mid-2000s and develop new products to satisfy the demands of aheterogeneous investor base. We will not dive deeply into all of these here, but will focus onthe super-senior deal structure, the trend that had the biggest impact on the marketplace,and which was perhaps most symptomatic of the thinness of the limb out onto which theCMBS industry was crawling in the mid-2000s!3 (A few other features of interest will be dis-cussed briefly in a footnote for interested readers.4) As AAA subordination levels fell ratherdramatically from about 25 percent in 2000 to the mid-teens in 2004, many investors beganto express concern over the level of credit protection and potential “frothiness” of the CMBSmarket. In response, dealers began redistributing risk within the triple A-rated class, breakingit up into super-senior, senior, and “junior” or mezzanine pieces that, despite all having aAAA rating, offered varying levels of credit support (i.e., after tranching the mortgage poolinto a typical CMBS structure at the time that might have two AAA-rated classes that differonly in maturity, they further tranched these additional securities, thereby expanding the menufor bond investors). In Exhibit 20A-1, the super-senior class (A-4A) has 30 percent subordina-tion, while the senior classes (A-1, A-2, A-3-1, A-3-2, A-AB, and A-4B) each have 20 percentsubordination, and the mezzanine tranche (A-J) has 11.63 percent credit protection. Investorsworried that subordination levels were too low could purchase higher-rated tranches, whilethose that felt the lower subordination levels were warranted could buy the A-J bonds and berewarded with a slightly higher expected yield. Even with credit enhancement of 11.63 percent,the A-J tranche attains a AAA credit rating.5
Not surprisingly, the market yields that reflect the prices at which the securities sell arequite sensitive to the credit rating. Keep in mind, however, that bond ratings are related onlyto default, whereas market yields reflect both default and maturity considerations, the latterincluding both the yield curve as well as in some cases some amount of prepayment timingrisk. For example, the higher yield (and spread) on class A-2 bonds relative to A-1 bondsresults solely from the longer maturity. Fixed-payment bonds are typically quoted in termsof spreads over a similar-maturity benchmark, such as a Treasury bond, or the fixed ratepart of an interest rate swap especially for investment-grade bonds, as is the case in Exhibit20A-1 where the “S” indicates a swap yield off of which the bonds are priced. Swap spreadsemerged as the pricing benchmark following the liquidity shock to fixed income markets inthe fall of 1998. Lower-rated and IO tranches tend to be priced relative to a Treasury bench-mark, as can be seen with the “T” in the spreads on the IO bonds. In this 2005 IPO seniortranches are selling at swap yield spreads around 30 basis points, depending on average life,while intermediate tranches (so-called mezzanine debt) are at swap spreads ranging to over100 basis points.6 Subordinate tranches are selling at very large spreads to Treasuries, often700 to 1000 basis points, typical of high yield bonds. The most risky CMBS tranches, such as
3See section 20.4 in the main text, including the discussion of Exhibit 20-7 there.4Class A-1A is based on the multifamily loans in the pool and is privately placed with (sold to) Freddie Mac, the onlybuyer of this tranche in 2005. This tranche is credit protected by lower rated non-multifamily tranches; hence, it isnot based solely on multifamily loans. In early 2006, Fannie Mae announced its intention to start investing in themultifamily tranche of CMBS. A-3-1FL is a floating rate tranche with a variable rate coupon set at 24 basis pointsabove LIBOR. The A-AB class bonds are “wide-window” amortization bonds that are structured to capture all theamortization (principal) cash flow from the mortgage payments in between the mortgage balloon payments (typicallyat 5 and 10 years). With this class, the issuer can shorten the expected life on other AAA-rated classes, and thereforetranche by duration to a finer degree than is possible without it.5In the subsequent actual performance through the financial crisis and “Great Recession,” in fact very few if anysuper-senior CMBS bonds suffered any credit losses at all, even in deals issued at the peak.6Just a few years later, after the 2008 financial crisis, this level of pricing would seem like a distant dream for CMBS.
4 Commercial Real Estate Analysis and Investments, 3e
© 2014 OnCourse Learning. All Rights Reserved. May not be scanned, copied or duplicated, or posted to a publicly accessible website, in whole or in part.
first-loss pieces, are clearly more risky than the underlying property equity, even more riskythan some levered equity positions.7 This makes sense, for even if only a small fraction of themortgages in the pool default, the first-loss tranche will be worthless. In contrast, senior debtand unlevered equity positions will virtually never be completely worthless, for the underlyingasset will always have some value.8
KEY TERMS
mezzanine tranchesfusionsuper-senior
7Keep in mind, however, that the expected return on a bond investment that contains default risk is less than theyield-to-maturity of that bond, due to the effect of “yield degradation” (as discussed in Chapter 18).8See our discussion of “levered debt” in section 20.2.1 of the main chapter.
APPENDIX 20 EXAMPLE OF CMBS DEAL STRUCTURE AT THE HEIGHT 5
© 2014 OnCourse Learning. All Rights Reserved. May not be scanned, copied or duplicated, or posted to a publicly accessible website, in whole or in part.