Embed Size (px)
Citation preview
Example Presentation Name
Presentation Date
Interim results for the 6 months to 31 January 2016
Martin Hellawell, CEOGraham Charlton, CFO
17 March 2016
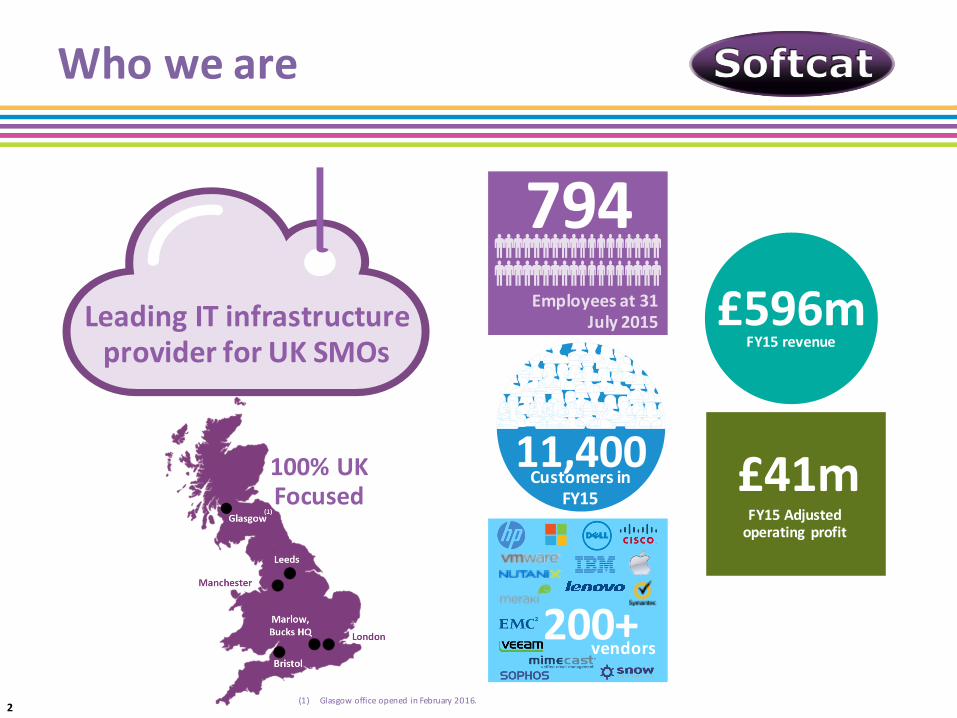
100% UK Focused
Who we are
£41mFY15 Adjusted operating profit
£596mFY15 revenue
11,400Customers in
FY15
Employees at 31 July 2015
794Leading IT infrastructure provider for UK SMOs
vendors200+
2(1) Glasgow office opened in February 2016.
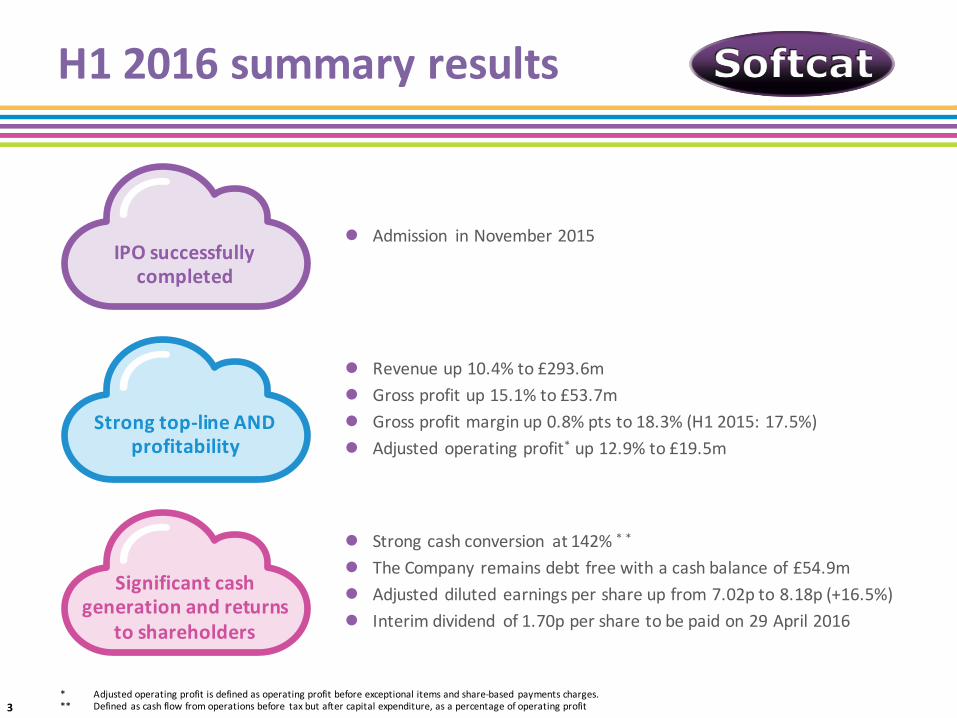
H1 2016 summary results
l Revenue up 10.4% to £293.6ml Gross profit up 15.1% to £53.7ml Gross profit margin up 0.8% pts to 18.3% (H1 2015: 17.5%)l Adjusted operating profit* up 12.9% to £19.5m
Strong top-‐line AND profitability
Significant cash generation and returns
to shareholders
l Strong cash conversion at 142% * *
l The Company remains debt free with a cash balance of £54.9ml Adjusted diluted earnings per share up from 7.02p to 8.18p (+16.5%)l Interim dividend of 1.70p per share to be paid on 29 April 2016
IPO successfully completed
* Adjusted operating profit is defined as operating profit before exceptional items and share-‐based payments charges.** Defined as cash flow from operations before tax but after capital expenditure, as a percentage of operating profit
l Admission in November 2015
3
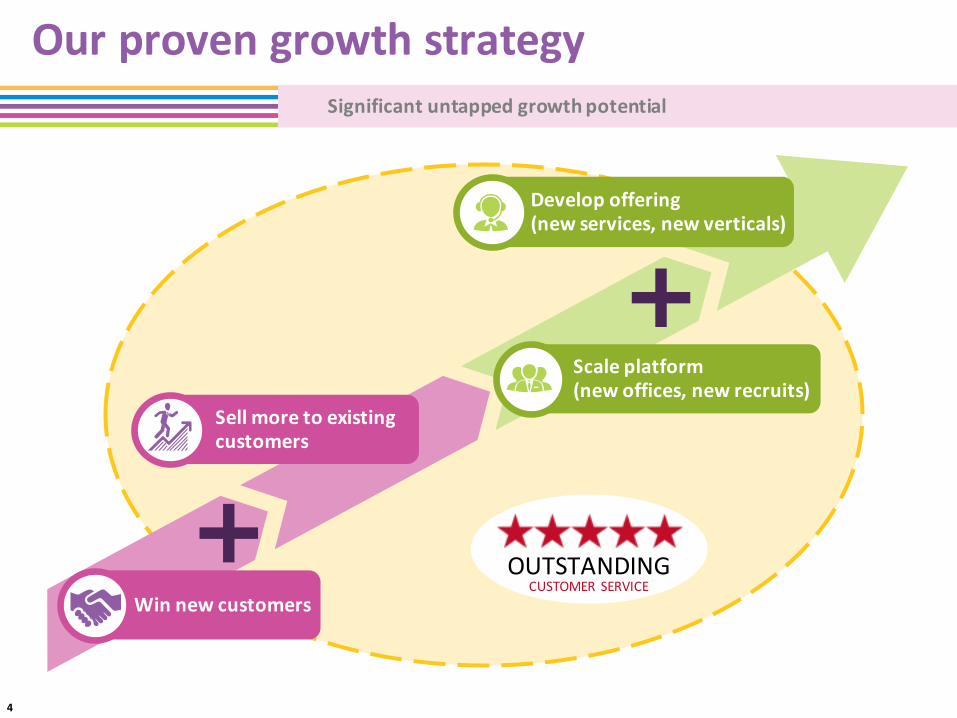
Our proven growth strategy
Scale platform(new offices, new recruits)
Develop offering(new services, new verticals)
Sell more to existing customers
Win new customers
Significant untapped growth potential
4
OUTSTANDINGCUSTOMER SERVICE
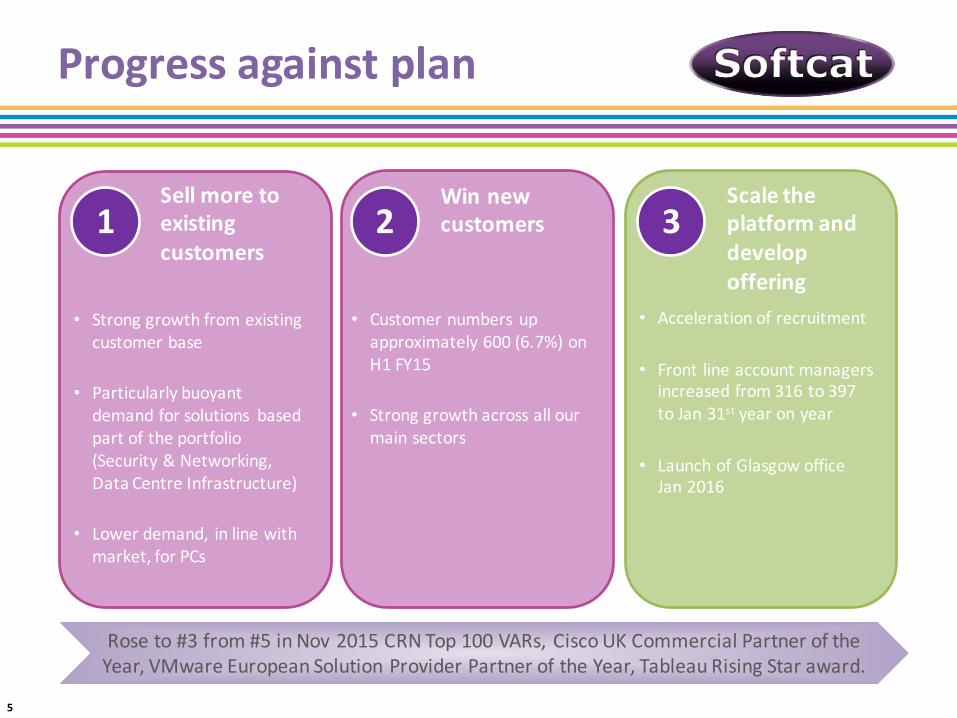
Progress against plan
1 2 3Sell more to existing customers
Win new customers
Scale the platform and develop offering
• Customer numbers up approximately 600 (6.7%) on H1 FY15
• Strong growth across all our main sectors
• Acceleration of recruitment
• Front line account managers increased from 316 to 397 to Jan 31st year on year
• Launch of Glasgow office Jan 2016
• Strong growth from existing customer base
• Particularly buoyant demand for solutions based part of the portfolio (Security & Networking, Data Centre Infrastructure)
• Lower demand, in line with market, for PCs
Rose to #3 from #5 in Nov 2015 CRN Top 100 VARs, Cisco UK Commercial Partner of the Year, VMware European Solution Provider Partner of the Year, Tableau Rising Star award.
5
H1 2016 financial review
Graham Charlton, CFO
£m H1 FY16 H1 FY15 Growth
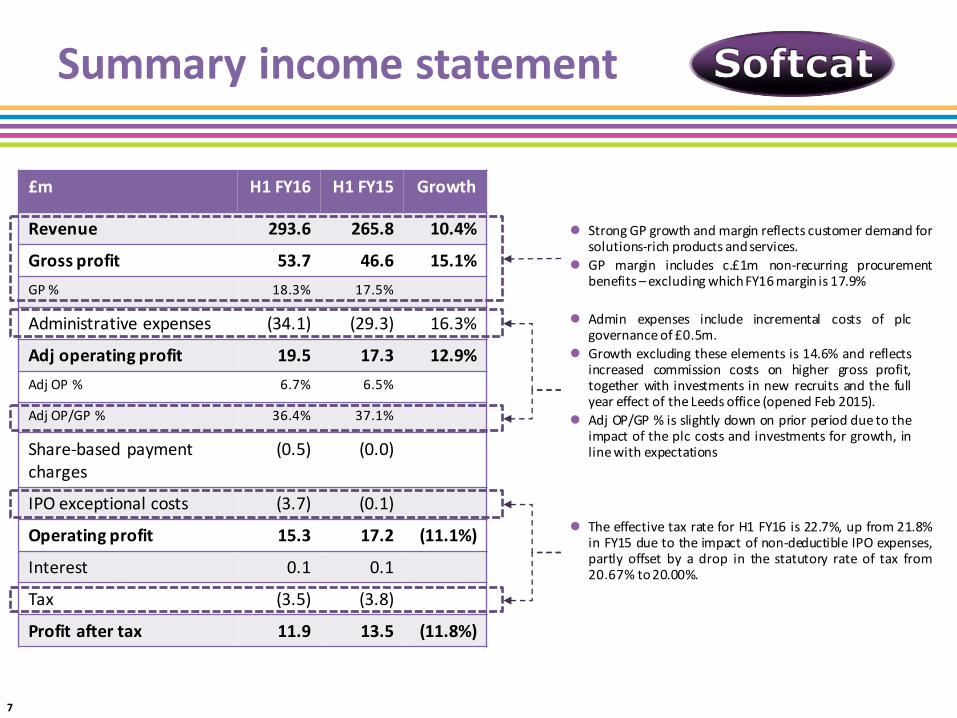
Revenue 293.6 265.8 10.4%
Gross profit 53.7 46.6 15.1%GP % 18.3% 17.5%
Administrative expenses (34.1) (29.3) 16.3%
Adj operating profit 19.5 17.3 12.9%Adj OP % 6.7% 6.5%
Adj OP/GP % 36.4% 37.1%
Share-‐based payment charges
(0.5) (0.0)
IPO exceptional costs (3.7) (0.1)
Operating profit 15.3 17.2 (11.1%)
Interest 0.1 0.1
Tax (3.5) (3.8)
Profit after tax 11.9 13.5 (11.8%)
Summary income statement
l StrongGP growth and margin reflects customer demand forsolutions-‐rich products andservices.
l GP margin includes c.£1m non-‐recurring procurementbenefits –excludingwhichFY16margin is 17.9%
l Admin expenses include incremental costs of plcgovernanceof £0.5m.
l Growth excluding these elements is 14.6% and reflectsincreased commission costs on higher gross profit,together with investments in new recruits and the fullyear effect of the Leeds office (opened Feb 2015).
l Adj OP/GP % is slightly down on prior period due to theimpact of the plc costs and investments for growth, inlinewith expectations
l The effective tax rate for H1 FY16 is 22.7%, up from 21.8%in FY15 due to the impact of non-‐deductible IPO expenses,partly offset by a drop in the statutory rate of tax from20.67% to20.00%.
7
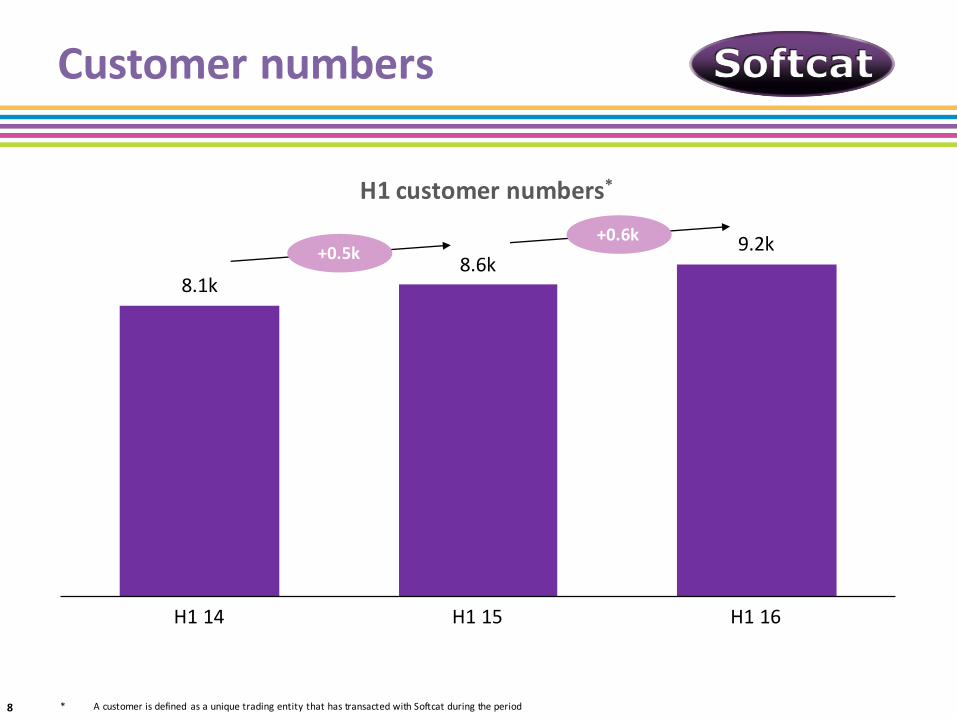
8.1k8.6k
9.2k
H1 14 H1 15 H1 16
H1 customer numbers*
Customer numbers
+0.5k+0.6k
* A customer is defined as a unique trading entity that has transacted with Softcat during the period8
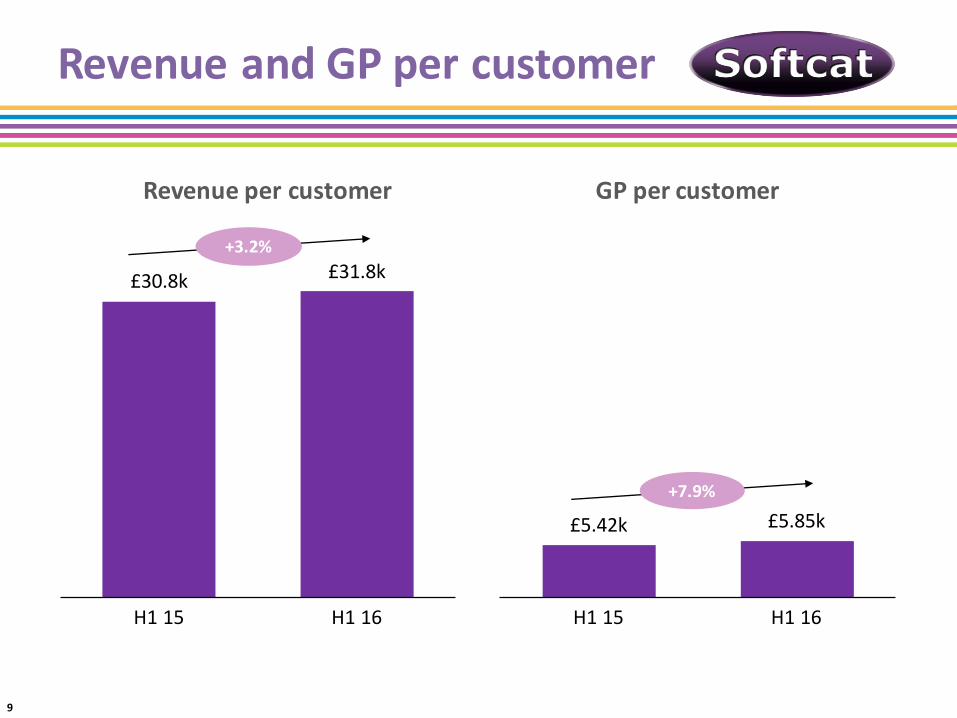
£30.8k £31.8k
H1 15 H1 16
Revenue per customer
Revenue and GP per customer
+3.2%
£5.42k £5.85k
H1 15 H1 16
GP per customer
+7.9%
9
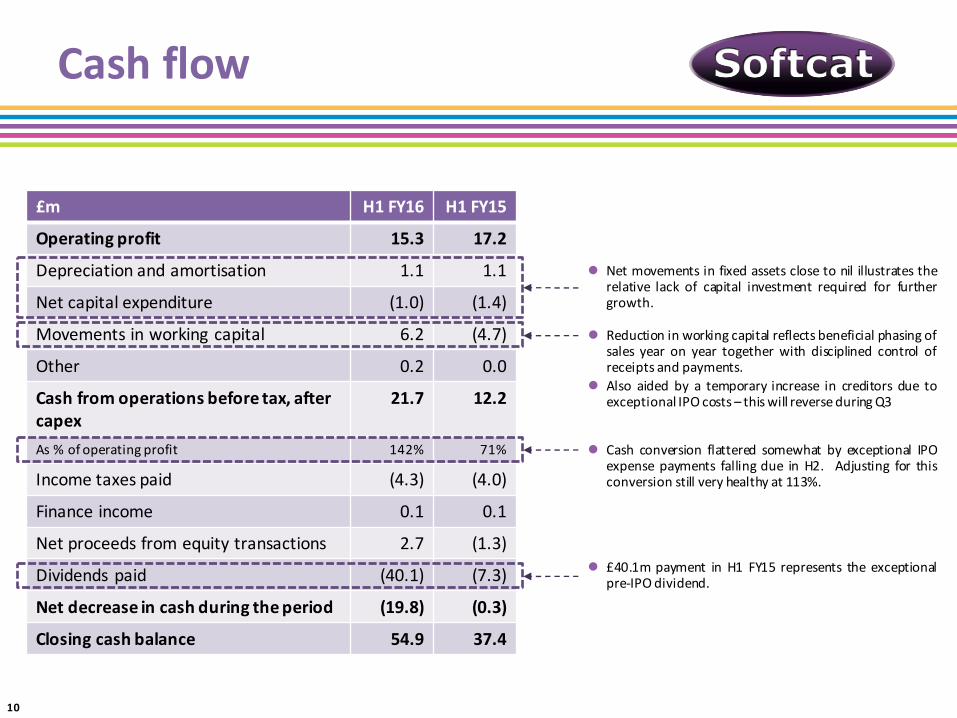
Cash flow
£m H1 FY16 H1 FY15
Operating profit 15.3 17.2
Depreciation and amortisation 1.1 1.1
Net capital expenditure (1.0) (1.4)
Movements in working capital 6.2 (4.7)
Other 0.2 0.0
Cash from operations before tax, after capex
21.7 12.2
As % of operating profit 142% 71%
Income taxes paid (4.3) (4.0)
Finance income 0.1 0.1
Net proceeds from equity transactions 2.7 (1.3)
Dividends paid (40.1) (7.3)
Net decrease in cash during the period (19.8) (0.3)
Closing cash balance 54.9 37.4
l Net movements in fixed assets close to nil illustrates therelative lack of capital investment required for furthergrowth.
l Reduction in working capital reflects beneficial phasing ofsales year on year together with disciplined control ofreceipts and payments.
l Also aided by a temporary increase in creditors due toexceptional IPO costs – thiswill reverseduringQ3
l Cash conversion flattered somewhat by exceptional IPOexpense payments falling due in H2. Adjusting for thisconversion still very healthy at 113%.
l £40.1m payment in H1 FY15 represents the exceptionalpre-‐IPOdividend.
10
Dividend
l A dividend of 1.70p per share will be paid on 29 April 2016 to shareholders on theregister at the close of 1 April 2016
l Total dividend payment will be £3.3m
l The shares will trade ex dividend on 31 March 2016
l For this first year the dividend payments will be pro rata to mirror the portion ofthe financial year that the Company has been listed
11
Closing remarks
Martin Hellawell, CEO
Summary
l Smooth transition to life as a public company
l OP and GP growth higher in Q2 than Q1
l Strong GP growth of 15%
l Increase in new customers and business from existing customers
l Good revenue growth at 10%
l Lower than GP growth due to positive shift inmix
l Increased gross profit margin to 18.3% from 17.5%
l Strong adjusted OP growth of 13%
l While investing significantly for future growth
l Strong cash conversion
13
Outlook
l Strong momentum in the business and a good start to Q3
l Well placed against competition
l Expect mix shift to maintain in H2
l Continued investment for future growth
l Mindful of economic and political uncertainty in H2
l Confident of meeting the Board’s profit expectations for the full year
14