Embed Size (px)
Citation preview
Abstract Research shows that for novices learning from worked examples is superior to unsupported problem solving. Additionally, several studies have shown that learning from examples results in faster learning in comparison to supported problem solving in Intelligent Tutoring Sys-tems. In a previous study, we have shown that alternating worked examples and problem solving was superior to using just one type of learning tasks. In this paper we present a study that compares learning from a fixed se-quence of alternating worked examples and tutored prob-lem solving to a strategy that adaptively decides how much assistance to provide to the student. The adaptive strategy determines the type of task (a worked example, a faded example or a problem to solve) based on how much assistance the student needed in the previous prob-lem. In faded examples, the student needed to complete one or two steps. The results show that students in the adaptive condition learned significantly more than their peers who were presented with a fixed sequence of worked examples and problems.
1 Introduction Learning from worked examples has been shown to be an effective learning strategy. Sweller and Cooper [1985] sug-gested presenting worked examples to novices, followed by problem solving once students have acquired enough knowledge. Examples are suitable for novices, since they reduce the cognitive load and increase initial learning. Sweller [2006] explained the worked-example effect based on the Cognitive Load Theory. Novices often have incom-plete knowledge which makes problem solving difficult due to the high cognitive load, but worked examples present step-by-step explanations of how problems are solved with associated knowledge.
Many studies have compared learning from examples to unsupported problem solving, and showed that learning
Copyright © 2015, Association for the Advancement of Artificial Intelligence (www.aaai.org). All rights reserved.
This paper was invited for submission to the Best Papers From Sister Conferences Track, based on a paper that appeared in User Modeling, Adaptation and Personalization (UMAP) 2014.
from examples is more effective for novices [Atkinson et al. 2000; van Gog and Rummel 2010; van Gog et al., 2011]. Intelligent Tutoring Systems (ITS) are different from unsupported problem solving as ITSs provide adaptive scaffolding in terms of feedback, problem selection and other types of help. Only recently several studies have compared learning from examples to learning with ITSs (e.g. [Schwonke et al. 2009; McLaren and Isotani 2011]). Salden et al. [2009] compared fixed faded worked-out examples with adaptive ones. They found that adaptive examples led to better learning and higher transfer. Kalyuga and Sweller [2005] proposed an adaptive model for using examples based on the Cognitive Efficiency (CE), which is calculated from students’ performance and self-reported cognitive load. Their study showed that the adaptive condition scored marginally significantly higher than a non-adaptive condition, and also showed significantly higher efficiency gains.
In our previous study, we compared learning from exam-ples only (EO), alternating examples and tutored problems (AEP), and tutored problems only (PO) in the area of speci-fying database queries in SQL [Najar and Mitrovic, 2013]. We scaffolded examples and problems with Self-Explanation (SE) prompts [Chi et al. 1994], requiring stu-dents to explain worked examples or how they solved prob-lems. The results showed that students benefitted the most from alternating examples and problems. In that study, we used a fixed sequence of examples and problems; therefore, it is possible that some students received either more or less information than they needed. This encouraged us to pro-pose a new adaptive learning strategy that decides what type of task to present to the learner. The learning tasks are prob-lem solving, 2-step faded examples, 1-step faded examples, and worked examples, with faded steps chosen based on the student’s performance.
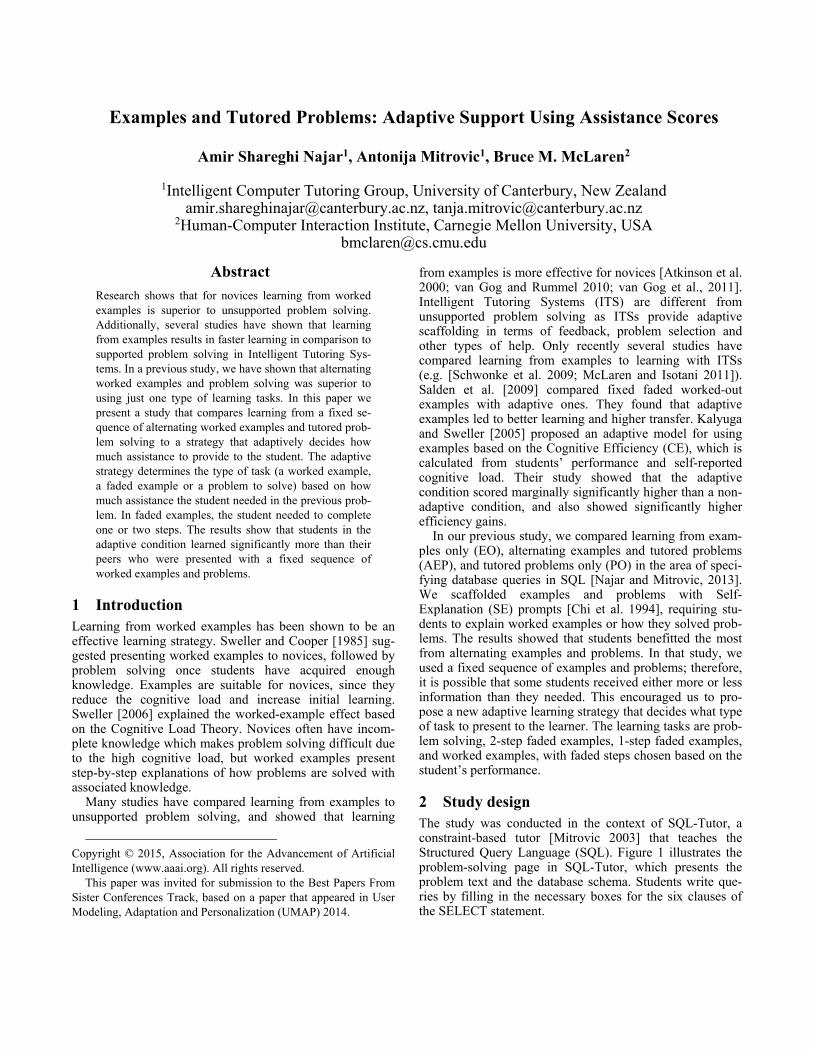
2 Study design The study was conducted in the context of SQL-Tutor, a constraint-based tutor [Mitrovic 2003] that teaches the Structured Query Language (SQL). Figure 1 illustrates the problem-solving page in SQL-Tutor, which presents the problem text and the database schema. Students write que-ries by filling in the necessary boxes for the six clauses of the SELECT statement.
Examples and Tutored Problems: Adaptive Support Using Assistance Scores
Amir Shareghi Najar1, Antonija Mitrovic1, Bruce M. McLaren2
1Intelligent Computer Tutoring Group, University of Canterbury, New Zealand [email protected], [email protected]
2Human-Computer Interaction Institute, Carnegie Mellon University, USA [email protected]
The level of feedback defines how much assistance is provided to the student. SQL-Tutor offers six levels of feed-back: positive/negative feedback, error flag, hint, all errors, partial solution and complete solution. Positive/negative feedback provides the lowest level of assistance, as it only informs students whether their answer is correct or not. The message also shows how many errors there are in the solu-tion. An error flag message identifies the clause which con-tains the error. More information about the type of error is provided when a hint-type feedback is requested (illustrated in Figure 1). A partial solution shows the correct content of the clause the student got wrong. Feedback of type all er-rors displays hint-type messages for all errors the student has made. At the maximum level, the complete solution simply reveals a pre-specified ideal solution for the current problem. When a student starts solving a new problem, the default feedback level is positive/negative, and the level is automatically increased for subsequent attempts. Students can also choose the level of feedback they receive.
The version of SQL-Tutor used in this study had four modes: problem solving, 2-step or 1-step faded example, and worked example. The problem-solving mode is similar to the original SQL-Tutor. The 2-step / 1-step faded exam-ple modes differ in that the student needs to complete two or just one clause. The worked example mode presents a com-plete solution and an explanation.
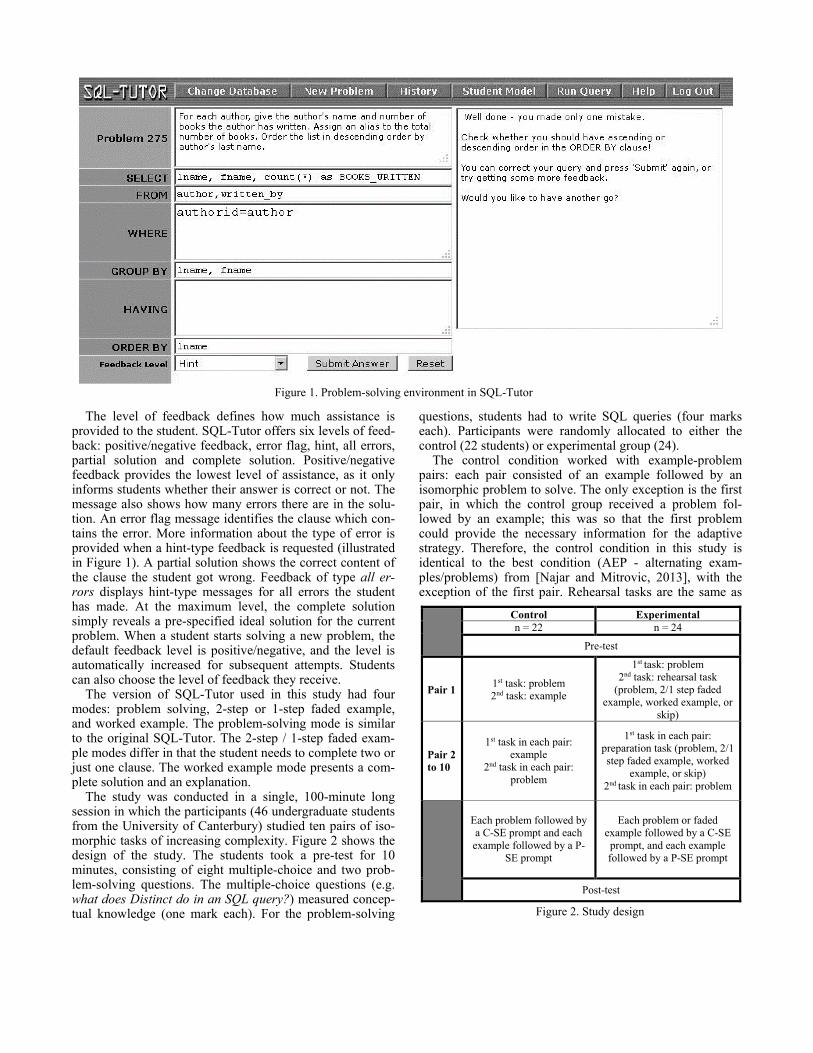
The study was conducted in a single, 100-minute long session in which the participants (46 undergraduate students from the University of Canterbury) studied ten pairs of iso-morphic tasks of increasing complexity. Figure 2 shows the design of the study. The students took a pre-test for 10 minutes, consisting of eight multiple-choice and two prob-lem-solving questions. The multiple-choice questions (e.g. what does Distinct do in an SQL query?) measured concep-tual knowledge (one mark each). For the problem-solving
questions, students had to write SQL queries (four marks each). Participants were randomly allocated to either the control (22 students) or experimental group (24).
The control condition worked with example-problem pairs: each pair consisted of an example followed by an isomorphic problem to solve. The only exception is the first pair, in which the control group received a problem fol-lowed by an example; this was so that the first problem could provide the necessary information for the adaptive strategy. Therefore, the control condition in this study is identical to the best condition (AEP - alternating exam-ples/problems) from [Najar and Mitrovic, 2013], with the exception of the first pair. Rehearsal tasks are the same as
Figure 1. Problem-solving environment in SQL-Tutor
Control Experimental n = 22 n = 24 Pre-test
Pair 1 1st task: problem 2nd task: example
1st task: problem 2nd task: rehearsal task
(problem, 2/1 step faded example, worked example, or
skip)
Pair 2 to 10
1st task in each pair: example
2nd task in each pair: problem
1st task in each pair: preparation task (problem, 2/1 step faded example, worked
example, or skip) 2nd task in each pair: problem
Each problem followed by a C-SE prompt and each example followed by a P-
SE prompt
Each problem or faded example followed by a C-SE prompt, and each example followed by a P-SE prompt
Post-test
Figure 2. Study design
preparation tasks. The adaptive strategy decided what type of preparation task to present.
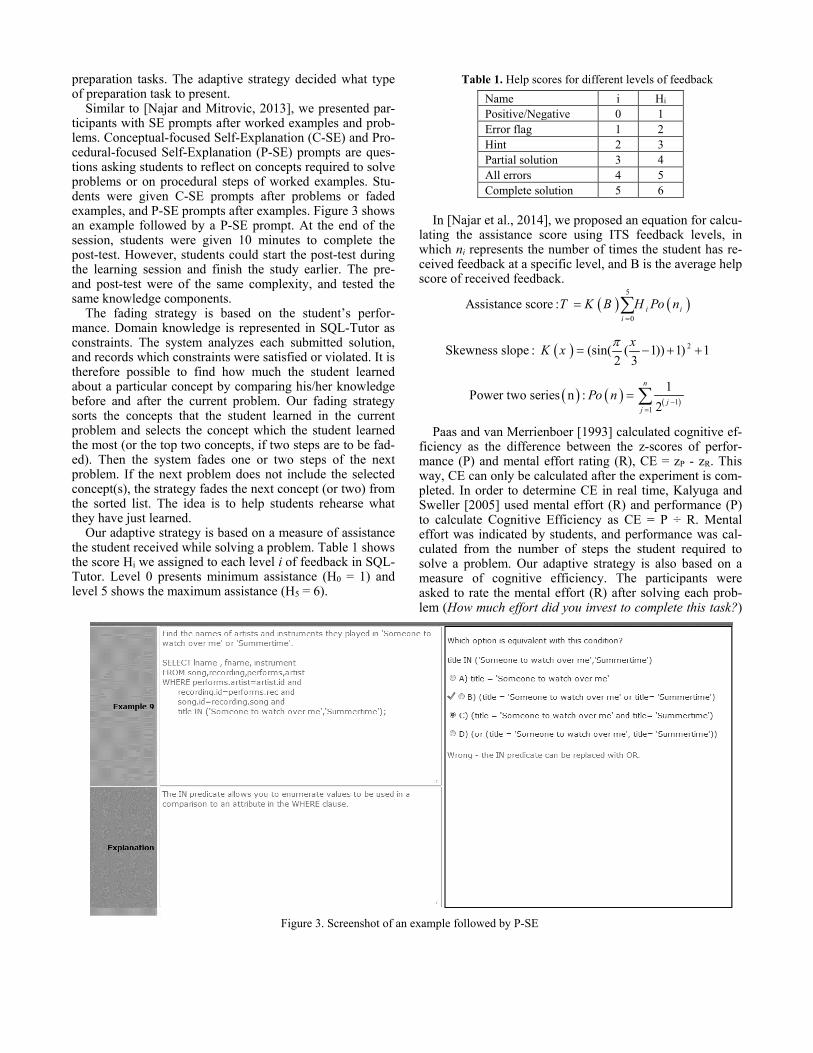
Similar to [Najar and Mitrovic, 2013], we presented par-ticipants with SE prompts after worked examples and prob-lems. Conceptual-focused Self-Explanation (C-SE) and Pro-cedural-focused Self-Explanation (P-SE) prompts are ques-tions asking students to reflect on concepts required to solve problems or on procedural steps of worked examples. Stu-dents were given C-SE prompts after problems or faded examples, and P-SE prompts after examples. Figure 3 shows an example followed by a P-SE prompt. At the end of the session, students were given 10 minutes to complete the post-test. However, students could start the post-test during the learning session and finish the study earlier. The pre- and post-test were of the same complexity, and tested the same knowledge components.
The fading strategy is based on the student’s perfor-mance. Domain knowledge is represented in SQL-Tutor as constraints. The system analyzes each submitted solution, and records which constraints were satisfied or violated. It is therefore possible to find how much the student learned about a particular concept by comparing his/her knowledge before and after the current problem. Our fading strategy sorts the concepts that the student learned in the current problem and selects the concept which the student learned the most (or the top two concepts, if two steps are to be fad-ed). Then the system fades one or two steps of the next problem. If the next problem does not include the selected concept(s), the strategy fades the next concept (or two) from the sorted list. The idea is to help students rehearse what they have just learned.
Our adaptive strategy is based on a measure of assistance the student received while solving a problem. Table 1 shows the score Hi we assigned to each level i of feedback in SQL-Tutor. Level 0 presents minimum assistance (H0 = 1) and level 5 shows the maximum assistance (H5 = 6).
Table 1. Help scores for different levels of feedback Name i Hi Positive/Negative 0 1 Error flag 1 2 Hint 2 3 Partial solution 3 4 All errors 4 5 Complete solution 5 6
In [Najar et al., 2014], we proposed an equation for calcu-
lating the assistance score using ITS feedback levels, in which ni represents the number of times the student has re-ceived feedback at a specific level, and B is the average help score of received feedback.
( ) ( )5
0
Assistance score : i ii
T K B H Po n=
= ∑
( ) 2Skewness slope : (sin( ( 1)) 1) 1 2 3
xK x π= − + +
( ) ( ) ( )11
1Power two series n : 2
n
jj
Po n−
=
= ∑
Paas and van Merrienboer [1993] calculated cognitive ef-ficiency as the difference between the z-scores of perfor-mance (P) and mental effort rating (R), CE = zP - zR. This way, CE can only be calculated after the experiment is com-pleted. In order to determine CE in real time, Kalyuga and Sweller [2005] used mental effort (R) and performance (P) to calculate Cognitive Efficiency as CE = P ÷ R. Mental effort was indicated by students, and performance was cal-culated from the number of steps the student required to solve a problem. Our adaptive strategy is also based on a measure of cognitive efficiency. The participants were asked to rate the mental effort (R) after solving each prob-lem (How much effort did you invest to complete this task?)
Figure 3. Screenshot of an example followed by P-SE
on a 9-point rating scale. We calculated the student’s per-formance P from the assistance score T:
P HighT T= −
When a student asks for a partial solution several times, effectively the student modifies the problem into a worked example. Examples provide maximum assistance; the assis-tance score for the situation when the student has seen par-tial solution several times corresponds to a high level of assistance which we refer to as THigh. Thus, using the assis-tance score equation, we calculate THigh to be 26 (H3 = 4; K(4) = 3.25). THigh corresponds to the situation when the student asked for partial solution (H3) four times, because SQL problems included in the study required students to specify at most four clauses. Therefore, performance P can be calculated as:
P 26 T= −
Please note that T can have a value greater than THigh. Be-cause THigh represents turning problems into examples, we set all the assistance scores greater than THigh to 26. There-fore, P never becomes negative.
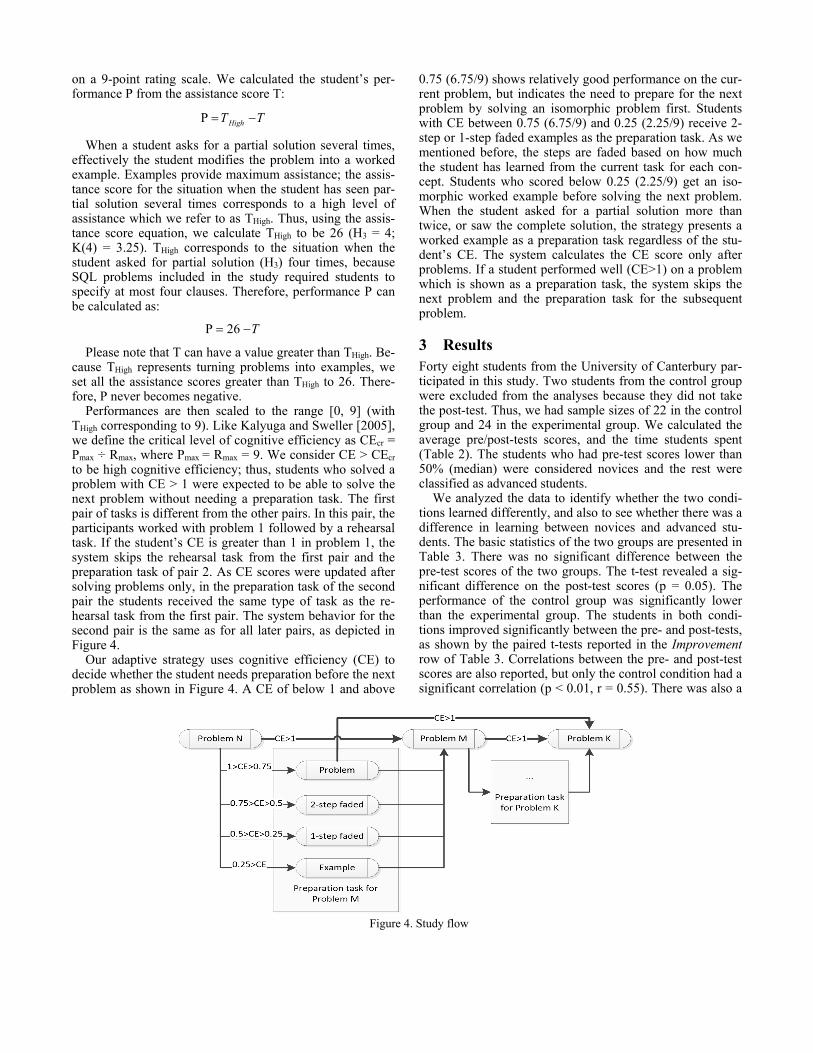
Performances are then scaled to the range [0, 9] (with THigh corresponding to 9). Like Kalyuga and Sweller [2005], we define the critical level of cognitive efficiency as CEcr = Pmax ÷ Rmax, where Pmax = Rmax = 9. We consider CE > CEcr to be high cognitive efficiency; thus, students who solved a problem with CE > 1 were expected to be able to solve the next problem without needing a preparation task. The first pair of tasks is different from the other pairs. In this pair, the participants worked with problem 1 followed by a rehearsal task. If the student’s CE is greater than 1 in problem 1, the system skips the rehearsal task from the first pair and the preparation task of pair 2. As CE scores were updated after solving problems only, in the preparation task of the second pair the students received the same type of task as the re-hearsal task from the first pair. The system behavior for the second pair is the same as for all later pairs, as depicted in Figure 4.
Our adaptive strategy uses cognitive efficiency (CE) to decide whether the student needs preparation before the next problem as shown in Figure 4. A CE of below 1 and above
0.75 (6.75/9) shows relatively good performance on the cur-rent problem, but indicates the need to prepare for the next problem by solving an isomorphic problem first. Students with CE between 0.75 (6.75/9) and 0.25 (2.25/9) receive 2-step or 1-step faded examples as the preparation task. As we mentioned before, the steps are faded based on how much the student has learned from the current task for each con-cept. Students who scored below 0.25 (2.25/9) get an iso-morphic worked example before solving the next problem. When the student asked for a partial solution more than twice, or saw the complete solution, the strategy presents a worked example as a preparation task regardless of the stu-dent’s CE. The system calculates the CE score only after problems. If a student performed well (CE>1) on a problem which is shown as a preparation task, the system skips the next problem and the preparation task for the subsequent problem.
3 Results Forty eight students from the University of Canterbury par-ticipated in this study. Two students from the control group were excluded from the analyses because they did not take the post-test. Thus, we had sample sizes of 22 in the control group and 24 in the experimental group. We calculated the average pre/post-tests scores, and the time students spent (Table 2). The students who had pre-test scores lower than 50% (median) were considered novices and the rest were classified as advanced students.
We analyzed the data to identify whether the two condi-tions learned differently, and also to see whether there was a difference in learning between novices and advanced stu-dents. The basic statistics of the two groups are presented in Table 3. There was no significant difference between the pre-test scores of the two groups. The t-test revealed a sig-nificant difference on the post-test scores (p = 0.05). The performance of the control group was significantly lower than the experimental group. The students in both condi-tions improved significantly between the pre- and post-tests, as shown by the paired t-tests reported in the Improvement row of Table 3. Correlations between the pre- and post-test scores are also reported, but only the control condition had a significant correlation (p < 0.01, r = 0.55). There was also a
Figure 4. Study flow
significant difference between the mean learning times of the two groups (p < 0.01). The experimental group spent significantly less time in the intervention than the control group.
Table 2. Overall results (standard deviations given in brackets) Number of students 46 Pre-test (%) 48 (17) Post-test (%) 82 (14) Learning time (min) 66 (19)
The experimental group had a significantly higher nor-malized learning gain1 than the control group (p = 0.01). However, there was no difference between the two groups on conceptual knowledge questions only. On the other hand, the normalized learning gain on procedural knowledge (questions 9 and 10) of the experimental group was signifi-cantly higher than the control group (p < 0.1).
Table 3 shows the experimental group participants solved marginally significantly more problems than the control group (p = 0.06), but the analysis involved faded examples. In order to solve faded examples, students had to fill in the faded steps. Therefore, we analyzed the number of problems solved excluding faded examples, and there was no signifi-cant difference between the two groups. We counted the number of 2-step and 1-step faded examples that the exper-imental group solved. The average number of 2-step faded examples solved by the experimental group was 0.8 and the average for 1-step faded examples was 0.9. The experi-mental group received significantly fewer examples than the control group (p < 0.01).
Table 3. Basic statistics for the two conditions Control (22) Exp. (24) p Pre-test (%) 50.3 (13.7) 45.3 (18.9) .31 Post-test (%) 77.8 (13.9) 85.7 (12.6) .05
Improvement p<.01, t=-9.9
p<.01, t=-10.5 Pre/post-test correla-
tion p<.01, r=0.55
p=.10, r=0.34
Learning time (min) 73.6 (16.3) 58.9 (19.0) <.01 Norm. learning gain 55.7 (25.2) 73.2 (19.5) .01 Solved problems (inc. faded) 7.0 (2.5) 8.6 (3.0) .06
Solved problems (excl. faded) 7.0 (2.5) 6.9 (2.4) .95
2-step faded 0.8 (1.2) 1-step faded 0.9 (1.2) Examples seen 7.9 (3.0) 1.8 (1.9) <.01 Attempts per problem 4.5 (2.0) 4.3 (1.7) .72 Max complexity level 13.4 (5.2) 14.0 (5.3) .71
There was no significant difference in the number of at-tempts per problem between the two conditions. The prob-lem complexity gradually increased from the first prob-
1 Normalized learning gain = (Post test - Pre test) / (Max score - Pre test)
lem/example (with complexity = 1) to the last problem (complexity = 20). There was no significant difference be-tween the average maximum complexity levels of problems the students in the two groups solved.
Students rated their mental effort (R) after they solved problems (not after examples and faded examples as we could calculate CE scores after problems only). The adap-tive strategy used the mental effort rating to calculate CE. Table 4 shows the averages and standard deviations for CE and mental effort ratings of the two groups.
As mental effort rating is specified on a 9-point scale, we used the Spearman’s rho test to investigate whether there is a correlation between the mental effort and the pre-test, or between the cognitive efficiency and the pre-test. We found a significant negative correlation between the pre-test scores and mental effort ratings for the control (p=0.03, r=-0.48) and experimental group (p=0.02, r=-0.48), as well as signif-icant correlations between the pre-test and cognitive effi-ciency in both groups (p < 0.001, r = 0.69; p = 0.03, r = 0.44 respectively). There was also significant negative correla-tions between the mental effort and cognitive efficiency in control/experimental groups (p = 0.001, r = -0.67; p < 0.001, r = -0.73 respectively). The significant negative correlations between mental effort and CE scores could be expected be-cause CE scores were calculated from the mental effort. The Mann-Whitney U test showed no significant difference be-tween the groups on the reported mental effort, but the ex-perimental group had marginally significantly higher CE scores (p = 0.09).
Table 4. Cognitive efficiency and mental effort Control Exp. p
CE 2.28 (2.29) 2.70 (1.85) .09 R 4.77 (1.71) 4.38 (1.20) .24
We calculated the effect size based on the normalized
learning gain and on the cognitive efficiency scores using Cohen’s d, with the following assumption: d >= 0.8 (large effect), d >= 0.5 (medium effect) and d >= 0.2 (small effect) [Cohen, 1988]. The results are reported in Table 5. The ef-fect size on normalized learning gain was medium, and the effect size on cognitive efficiency was small.
Table 5. The effect sizes
We were also interested to find how each preparation task
affected the cognitive efficiency on the following problem. We extracted CE scores from the previous problem (CEi) and from the following problem (CEj) of each preparation task. This gave us 262 pairs of (CEi, CEj) from four types of preparation tasks in the adaptive condition and one type of preparation tasks in the control condition. Because of the low number of instances, 1-step and 2-step faded examples were considered as one type, named faded examples. We also excluded data from the first pair in which students had
Effect size Normalized learning gain 0.75 Cognitive efficiency 0.21
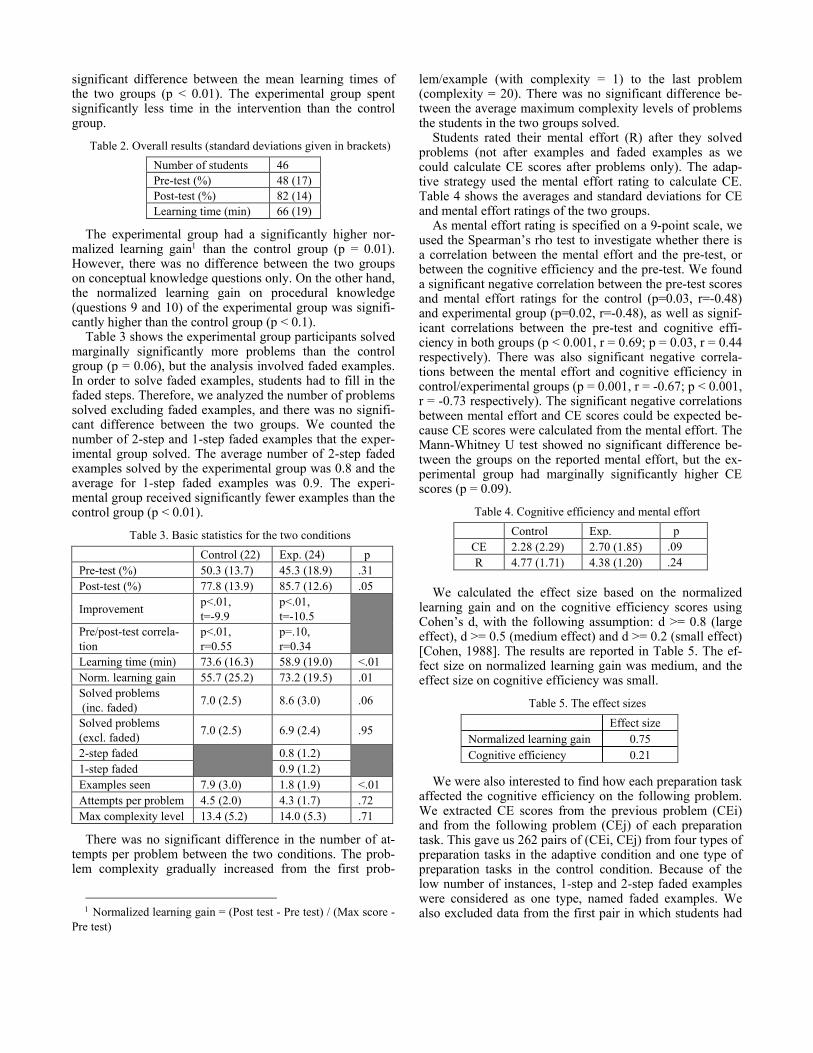
rehearsal tasks instead of preparation tasks. Note that in the Skip action students did not see any preparation task; there-fore, this condition is equal to not having preparation tasks. Table 6 shows the average CE scores before and after each preparation task. Figure 5 shows how average CE scores changed for different types of preparation tasks; the cogni-tive efficiency of students in experimental group improved after seeing worked examples, while the control group’s CE did not improve after studying examples. In the experi-mental group, only novices saw examples; however, in the control group all students saw examples which was detri-mental for advanced users.
Next, we conducted paired t-tests to investigate the change in CE scores from problems given before prepara-tion tasks to problems given after preparation tasks. Table 6 shows that CE scores of the experimental group students who had a preparation task significantly improved (p < 0.01 for examples; p = 0.02 for faded examples, p = 0.04 for problems). In the experimental group, CE scores of students who skipped preparation tasks significantly deteriorated. This could be expected as students were not prepared for the next problem. However, their average CE scores is still above 1 (mean=2.32), which shows that students had enough knowledge to solve the next problem. This can be considered a trade-off between spending time on the prepa-ration task that is not needed or skipping the preparation task and shortening the learning time.
Table 6 shows that CE scores of the control group did not significantly change by studying examples; however, we see that CE scores of the experimental group, when examples were studied, improved significantly. This shows that the provided preparation tasks, particularly examples, were more targeted for the experimental group than the control group. In the experimental group, students were given ex-amples when their CE scores were below 0.25. That is, the students who received worked examples were novices, while in the control group all students received examples before solving problems. When examples were provided as
preparation tasks, the average CE1 and CE2 scores of the control group (CE1 = 2.04, CE2 = 1.71) were greater than the those of the experimental group (CE1 = 0.03 (0.05), CE2 = 0.90 (1.78)), because students who had examples in the experimental group were only novices, while all students in the control group (including advanced and novices) had examples.
Table 6. CE for various preparation tasks
Action No CE1 CE2 P
Exp.
Example 35 0.03 (0.05)
0.90 (1.78)
p < .01, t = -2.94
Faded 15 0.50 (0.14)
2.06 (2.32)
p = .02, t = -2.61
Problem 9 0.90 (0.03)
2.88 (2.51)
p = .04, t = -2.37
Skip 73 4.01 (2.77)
2.32 (2.59)
p < .01, t = 3.81
Cont. Example 130 2.04 (2.37)
1.71 (2.21)
p = .14, t = 1.50
Overall, the results show that the experimental group par-
ticipants, who worked with the adaptive strategy, learned more than students who worked with a fixed alternating sequence of examples and problems. Moreover, the experi-mental group spent significantly less time working with the system than students in the control condition. The results clearly show the effectiveness of our adaptive strategy in comparison with the non-adaptive sequence.
4 Conclusions We have developed an adaptive strategy that decides what kind of tasks (examples or problems) to give to students based on their performance and help requests. This strategy was evaluated in an evaluation study using SQL-Tutor, an ITS that teaches students how to write SQL queries. The results show that students who worked with adaptive strate-gy learned more than students who were in a non-adaptive condition.
One of the limitations of our study is the relatively small sample size. We plan to perform additional studies with a larger set of participants. It is also important to evaluate the adaptive strategy in other types of instructional tasks in or-der to test its generality.
Using our approach, an ITS can use assistance scores to identify novices and advanced students. If the ITS knows that a student is novice or advanced, it could then provide additional advice to the student, for example to advise the student to study examples carefully, or to ask for specific types of feedback.
In future work, we plan to combine self-explanation scores and assistance scores to measure performance more accurately, which will result in improved cognitive efficien-cy scores. We also plan to evaluate such an improved per-formance measure and the adaptive strategy in other do-mains, including those with well-defined tasks.
Figure 5. Changes in CE for different preparation tasks
References [Atkinson et al., 2000] Robert K. Atkinson, Sharon J. Derry,
Alexander Renkl, and Donald Wortham. Learning from Examples: Instructional Principles from the Worked Ex-amples Research. Review of Educational Research, 70(2):181–214, 2000.
[Chi et al., 1994] Michelene Chi, Nicholas Leeuw, Mei-Hung Chiu, and Christian LaVancher. Eliciting self-explanations improves understanding. Cognitive Science, 18(3):439–477, 1994.
[Cohen, 1988] Jacob Cohen. Statistical power analysis for the behavioral sciences (2nd ed.), 1998. Hillsdale, NJ: Lawrence Erlbaum Associates.
[Kalyuga and Sweller, 2005] Slava Kalyuga and John Sweller. Rapid dynamic assessment of expertise to im-prove the efficiency of adaptive e-learning. Educational Technology Research and Development, 53(3):83–93, 2005.
[McLaren and Isotani, 2011] Bruce M. McLaren and Seiji Isotani. When Is It Best to Learn with All Worked Ex-amples? In G. Biswas, S. Bull, J. Kay, & A. Mitrovic (Eds.), Proceedings of 15th International Conference on Artificial Intelligence in Education, pages 222–229, 2011. Springer Berlin / Heidelberg.
[Mitrovic, 2003] Antonija Mitrovic. An Intelligent SQL Tutor on the Web. Artificial Intelligence in Education, 13(2-4): 173–197, 2003.
[Najar and Mitrovic, 2013] Amir Shareghi Najar and Anton-ija Mitrovic. Examples and Tutored Problems: How can Self-Explanation Make a Difference to Learning? In H. C. Lane, K. Yacef, J. Mostow, & P. Pavlik (Eds.), Pro-ceedings of 16th International Conference on Artificial Intelligence in Education, Vol. 7926, pages 339–348, 2013. Springer, Heidelberg
[Najar et al., 2014] Amir Shareghi Najar, Antonija Mitrovic, and Bruce M. McLaren. Adaptive Support versus Alter-nating Worked Examples and Tutored Problems: Which Leads to Better Learning? In Proceedings of the 22nd In-ternational Conference on User Modeling, Adaptation and Personalization, pages 171–182, 2014. Springer.
[Paas and van Merrienboer, 1993] Fred G. Paas and Jeroen J. G. van Merrienboer. The Efficiency of Instructional Conditions: An Approach to Combine Mental Effort and Performance Measures. Human Factors, 35:737–743, 1993.
[Salden et al., 2009] Ron Salden, Vincent Aleven, Alexan-der Renkl, and Rolf Schwonke. Worked Examples and Tutored Problem Solving: Redundant or Synergistic Forms of Support? Topics in Cognitive Science, 1(1):203–213, 2009.
[Schwonke et al., 2009] Rolf Schwonke, Alexander Renkl, Carmen Krieg, Jorg Wittwer, Vincent Aleven, and Ron Salden. The worked-example effect: Not an artefact of
lousy control conditions. Computers in Human Behav-ior, 25:258–266, 2009.
[Sweller, 2006] John Sweller. The worked example effect and human cognition. Learning and Instruction, 16(2):165–169, 2006.
[Sweller and Cooper, 1985] John Sweller and Graham A. Cooper. The Use of Worked Examples as a Substitute for Problem Solving in Learning Algebra. Cognition and Instruction, 2:59–89, 1985.
[Van Gog et al., 2011] Tamara van Gog, Liesbeth Kester and Fred G. Paas. Effects of worked examples, example-problem, and problem-example pairs on novices’ learning. Contemporary Educational Psychology, 36(3), 212–218.
[Van Gog and Rummel, 2010] Tamara van Gog, and Nikol Rummel. Example-Based Learning: Integrating Cogni-tive and Social-Cognitive Research Perspectives. Educa-tional Psychology Review, 22(2):155–174, 2010.


![CoChemEx: Supporting Conceptual Chemistry Learning via ...bmclaren/pubs/TsovaltziEtAl-CoChemEx-E… · that collaborative activities can improve conceptual learning [2, 3] and increase](https://img.pdfslide.net/doc/110x75/605aaa3417bab834f3783ced/cochemex-supporting-conceptual-chemistry-learning-via-bmclarenpubstsovaltzietal-cochemex-e.jpg)