Embed Size (px)
Citation preview
EXCAVABILITY INDEX
SEPTEMBER 2007 Tunnels & Tunnelling International
Over 500 case histories wereanalysed in two years to bring theRock Mass Excavability (RME)index to fruition and demonstrate
its effectiveness on five current projects. Itshould be emphasised that the RME indexdoes not replace the RMR or Q systems asused in tunnel design and construction;indeed one of the RME input parameters,the stand up time, is determined from theRMR. However, the approach reported hereintroduces a specialised tool relevant toTBM tunnel construction, featuring double-shield and open-type TBMs.
This is Part I of two articles on this topic.Part II will be published in a later issue ofT&TI and will include applications to single-shield TBMs as well as additional casehistories leading to further improvements asmore experience is gathered with predictingTBM excavability.
Previous investigationsIn the history of tunnelling technology, theemergence of modern TBMs stands out asthe major milestone which providedspectacular advantages and achievements,as well as complex challenges to designersand constructors who faced significantshortcomings in understanding theinteraction of rock mass conditions and TBMdesign and performance.
In fact, when Terzaghi introduced his rock-load idea in 1946, followed by Lauffer’sstand up time concept in 1958 and Deere’sRQD index in 1964, these designapproaches were directed to selection ofrock reinforcement for tunnel construction bydrill and blast. The equipment for tunnelexcavation was left to the discretion of thecontractor, with little input by the designer.Even the subsequent 'modern' rock massclassification methods, proposed in the1970s, by Wickham at al[1], Bieniawski[2]
and Barton[3] were predominantly directed
to drill and blast tunnels, independent ofTBM characteristics.
Today, this is no longer the case. TBMshave increased in power, size and type tosuch an extent that they directly influencetunnel design. Moreover, they can be thesource of tremendous satisfaction due to themachine’s increased safety provisions andhigher performance rates, as well as deepdespair when unexpected ground conditionsare encountered and the TBM may beimmobilised for months and sometimes hasto be rescued by old fashioned hand miningor drill and blast. In less drastic cases, TBMprogress in unfavourable conditions can bedisrupted and the output decreasedseverely.
In this situation, a significant problem hasemerged: how to assess effectively theinteraction between rock mass conditions,as described by the RMR or Q classificationsystems, and the design and performancecharacteristics of the TBM. Certainly, someattempts to solve this problem have beenmade, but the responsibility still rests on theTBM manufacturers and tunnel contractorswho must rely on their experience, ingenuityand even their will to battle adverseconditions.
The meaning of TBM excavabilityExcavability is defined as the rate ofexcavation expressed in machineperformance in meters per day. It wasinvestigated as early as 1982 by Kirsten[4].Pioneering work by Tarkoy[5], Nelson[6] andOzdemir[7] was performed on rock borebilityand disk cutting in the 1990s. TBM
excavability or performance predictionmodels were studied by a number ofresearchers since 2000: Barton[8], Alber[9],Blindheim[10], Sapigni at al[11] andPalmström and Broch[12]. Last year, at theITA Congress in Korea, based on casehistories from over 400 tunnel sections inSpain, the authors introduced the RockMass Excavability (RME) index[13]. This year,new case histories enabled further and morespecific applications for double-shield TBMswhich was presented at the RETC inToronto[14]. Since submission of the RETCpaper, over 100 tunnel sections wereanalysed from one tunnel in Spain and twotunnels in Ethiopia, forming the Gibe IIhydroelectric project (T&TI April).
Most of all, the timeliness of introducingthe RME was confirmed to date by anincreasing demand to be able to predictTBM advance rates based on both rockmass quality and machine performanceinteraction, because the current indicesbased solely on rock mass conditions haveproved insufficient[13].
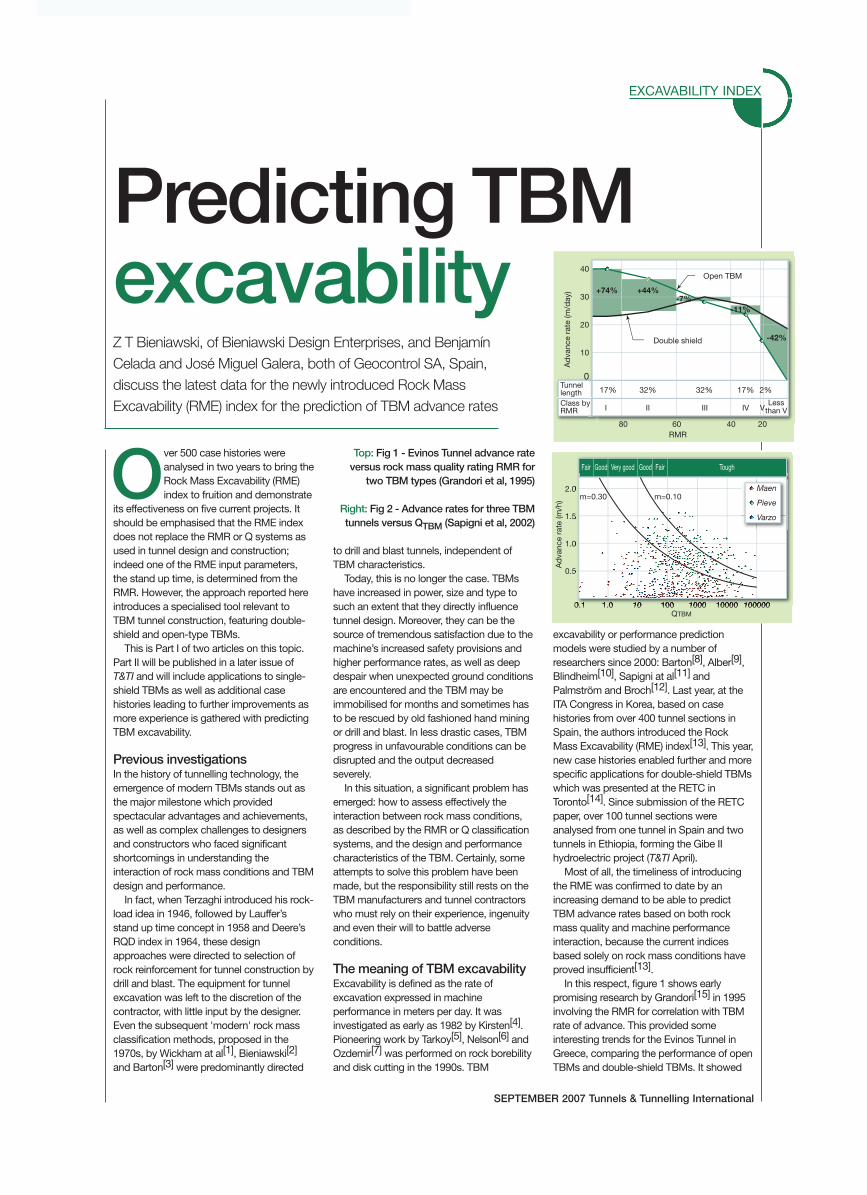
In this respect, figure 1 shows earlypromising research by Grandori[15] in 1995involving the RMR for correlation with TBMrate of advance. This provided someinteresting trends for the Evinos Tunnel inGreece, comparing the performance of openTBMs and double-shield TBMs. It showed
Predicting TBMexcavabilityZ T Bieniawski, of Bieniawski Design Enterprises, and BenjamínCelada and José Miguel Galera, both of Geocontrol SA, Spain,discuss the latest data for the newly introduced Rock MassExcavability (RME) index for the prediction of TBM advance rates
Ad
vanc
e ra
te (m
/h)
2.0
1.5
1.0
0.5
0.1 1.0 10 100QTBM
1000 10000 100000
Good GoodVery goodFair Fair Tough
m=0.30 m=0.10Maen
Pieve
Varzo
TunnellengthClass byRMR
Ad
vanc
e ra
te (m
/day
)
40
30
20
10
017% 17% 2%32%
Double shield
Open TBM
80 60 40 20RMR
32%
I II III IV VLess
than V
+74% +44%-7%
-11%
-42%
Top: Fig 1 - Evinos Tunnel advance rateversus rock mass quality rating RMR for
two TBM types (Grandori et al, 1995)
Right: Fig 2 - Advance rates for three TBMtunnels versus QTBM (Sapigni et al, 2002)

that RMR Class III provided a peak inproduction for double-shield TBMs, whilethey would not be recommended for neitherClass V (very poor) nor Class I (very good)rock masses. However, recent data reportedby Della Valle from Spain[16], showed thatan attempted correlation between the TBMrate of advance and the RMR resulted in aconsiderable scatter, although there was atrend similar to that discovered by Grandori.
Figure 2 shows the results from Norway ofan attempted correlation using the QTBMindex. It was found that the scatter of theresults was so large and QTBM so complex,by involving 21 parameters, that its use wasnot recommended in the technicalliterature[10,12]. We have also examinedQTBM as an option but could not make itwork for our case histories, for a number ofreasons, including the problem ofdetermining the rock mass strength.
It became clear from these and otheranalyses[13] that modifying the RMR or Qrock mass quality classifications forprediction of rock mass excavability - forwhich these indices were not intended - is
not the correct approach. Much bettercorrelations can be obtained with the newRME index. This is demonstrated in figure 3depicting the work on RME[14] presented inthe RETC proceedings.
RME input parametersThe database analysed includes thefollowing information collected for eachtunnel section (geo-structural region):
Geometrical data: tunnel location, lengthand diameter.
Rock mass data: RMR and its inputparameters, DRI, discontinuities data, andwater inflow.
TBM data: advance rate, utilisationcoefficient, penetration rate, rotation speed,torque, thrust, no. of cutters changed andthe specific energy of excavation[14].
It is important to note that a tunnel sectionstudied for RME is defined as a geologicalstructural region of the tunnel, that is, thesame section for which the RMR isdetermined, and within which uniformcharacteristics exist, such as discontinuityspacing and conditions, the same rock typelithology and the RMR not varying by morethan half-class (10 points). A section is notarbitrarily delineated by the number of fulldays tunnelled or by having only the samerock material. In fact, the section selectedshould be preferably longer than 40m, thetime of excavation should be given in daysto one decimal fraction and the TBMutilisation should not be less than 30%. All
these aspects are important for comparingdifferent tunnelling case histories.
Table 1 (above) shows the ‘record of dataform’ developed for two purposes; onexisting projects, for correlation between theRME index and the TBM parameters; and forplanned projects, to estimate the TBM rateof advance, and some machine parameters.Table 1 includes therefore both the rockmass quality parameters, as well as the TBMperformance parameters. While all the inputparameters are customary andstraightforward, it should be noted that theRMR is required to estimate the Stand-Up-Time parameter, while the Drilling Rate Index(DRI) is needed because it is significant intunnel boring construction. Here the DRI isdefined[17] in terms of the brittleness valueand the Sievers’ J-value. Both these testshave been standardised in the tunnellingindustry and are performed by commercialor university laboratories.
Figure 4 shows the RMR chart forestimation of the Stand-Up Time parameter.Since this chart was originally developed fordrill-and-blast tunnels, a correlation isavailable between the RMRD&B andRMRTBM based on work by Alber[9] forTBM tunnels. The following equation isapplicable:
RMRTBM = 0.8 x RMRD&B + 20
Construction by TBM generally results inhigher RMR values than for the same tunnel
Tunnels & Tunnelling International SEPTEMBER 2007
EXCAVABILITY INDEX
Above: Fig 3 - Correlation between RMEindex and the average rate of advancefor double-shield TBMs (Bieniawski etal., 2006). The colour symbols representindividual tunnels
Above: Fig 4 - Stand up time as afunction of RMR and unsupported tunnelspan (Bieniawski, 1989). Red squaresrepresent tunnelling cases, greensquares are mining data
60
50
40
30
20
10
0Ave
rage
rat
e of
ad
vanc
e (A
RA
T) (m
/day
)
0 10 20 30 40 50 60 70 80 90 100RME07
ARAT = 0.422RME07 – 11.61
R = 0.658
30
20
1086543
2
1
0
2
10-1 103 104 105 1061 10 100Stand-up time (hrs)
Uns
upp
orte
d r
oof s
pan
(m)
1d 1wk 1mo 1yr 10yr
20
20
30
30
40
40
50
50
60
60
70
70
80
80
90
Immediatecollapse
No supportrequired
Rock mass
rating
RMR
Name of Tunnel..............................................................................................................................Initial chainage of section............................... Final chainage of section...................................Length of section..............................m (should be > 40 m)Duration of excavation (days)............................................................ (number + 1 decimal)
Lithology...................................................................... Average depth....................mRock Mass Rating RMR: range................................... average....................
1) Uniaxial compressive strength of intact rock ( ): range...........................average.............MPa
2) Drilling Rate Index DRI: range.................................... average.................................
3) Type of homogeneity at excavtionn face..............................Nº of joints per meter.......................
Average speed of cutterhead rotation............................rpm Applied Thrust........................kN
Specific Penetration....................................mm/rev Torque.........................m. kN
Rate of Penetration........................................mm/min
Nº cutters changed:...................................... Rate of TBM utilization.............................%
Ex. in situ stress conditions, squeezing rock, rockbursts, etc......................................................
.......................................................................................................................................................
4) Stand up time.....................hours 5) Groundwater inflow at tunnel face..............liters/sec
Rock Mass Excavability RME range.....................................average.....................
ROCK MASS EXCAVABILITY PARAMETERS
TBM PERFORMANCE PARAMETERS
OTHER observations
RECORD of DATA Form for Rock Mass Excavability RME
Average Rate of Advance ARA = ......................m/day
Orientation of discontinuities with respect to tunnel axis
(perpendicular, parallel or oblique)................................................................
c
section excavated by drilling and blastingbecause of the favourable circular tunnelshape and lesser damage to the surroundingrock mass by the process of machineboring.
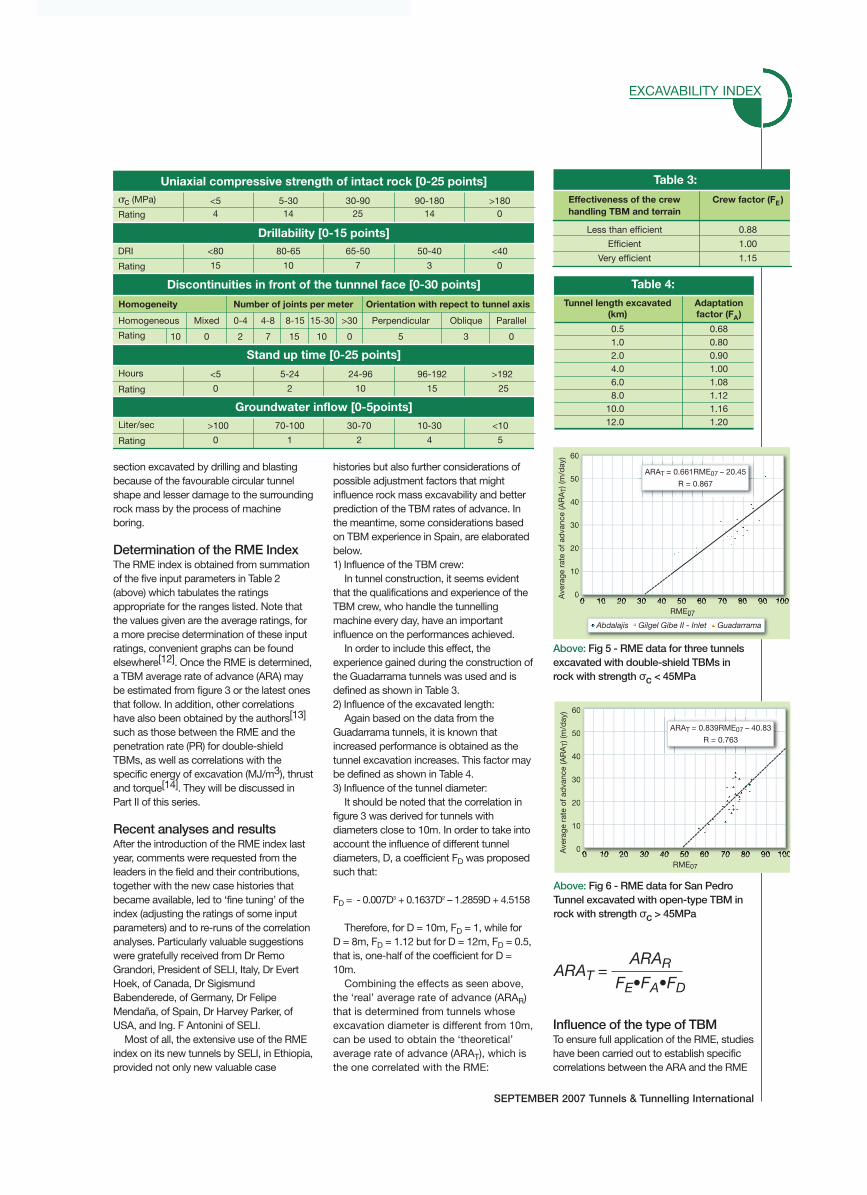
Determination of the RME IndexThe RME index is obtained from summationof the five input parameters in Table 2(above) which tabulates the ratingsappropriate for the ranges listed. Note thatthe values given are the average ratings, fora more precise determination of these inputratings, convenient graphs can be foundelsewhere[12]. Once the RME is determined,a TBM average rate of advance (ARA) maybe estimated from figure 3 or the latest onesthat follow. In addition, other correlationshave also been obtained by the authors[13]
such as those between the RME and thepenetration rate (PR) for double-shieldTBMs, as well as correlations with thespecific energy of excavation (MJ/m3), thrustand torque[14]. They will be discussed inPart II of this series.
Recent analyses and resultsAfter the introduction of the RME index lastyear, comments were requested from theleaders in the field and their contributions,together with the new case histories thatbecame available, led to ‘fine tuning’ of theindex (adjusting the ratings of some inputparameters) and to re-runs of the correlationanalyses. Particularly valuable suggestionswere gratefully received from Dr RemoGrandori, President of SELI, Italy, Dr EvertHoek, of Canada, Dr SigismundBabenderede, of Germany, Dr FelipeMendaña, of Spain, Dr Harvey Parker, ofUSA, and Ing. F Antonini of SELI.
Most of all, the extensive use of the RMEindex on its new tunnels by SELI, in Ethiopia,provided not only new valuable case
histories but also further considerations ofpossible adjustment factors that mightinfluence rock mass excavability and betterprediction of the TBM rates of advance. Inthe meantime, some considerations basedon TBM experience in Spain, are elaboratedbelow.1) Influence of the TBM crew:
In tunnel construction, it seems evidentthat the qualifications and experience of theTBM crew, who handle the tunnellingmachine every day, have an importantinfluence on the performances achieved.
In order to include this effect, theexperience gained during the construction ofthe Guadarrama tunnels was used and isdefined as shown in Table 3.2) Influence of the excavated length:
Again based on the data from theGuadarrama tunnels, it is known thatincreased performance is obtained as thetunnel excavation increases. This factor maybe defined as shown in Table 4.3) Influence of the tunnel diameter:
It should be noted that the correlation infigure 3 was derived for tunnels withdiameters close to 10m. In order to take intoaccount the influence of different tunneldiameters, D, a coefficient FD was proposedsuch that:
FD = - 0.007D3 + 0.1637D2 – 1.2859D + 4.5158
Therefore, for D = 10m, FD = 1, while forD = 8m, FD = 1.12 but for D = 12m, FD = 0.5,that is, one-half of the coefficient for D =10m.
Combining the effects as seen above,the ‘real’ average rate of advance (ARAR)that is determined from tunnels whoseexcavation diameter is different from 10m,can be used to obtain the ‘theoretical’average rate of advance (ARAT), which isthe one correlated with the RME:
Influence of the type of TBMTo ensure full application of the RME, studieshave been carried out to establish specificcorrelations between the ARA and the RME
EXCAVABILITY INDEX
SEPTEMBER 2007 Tunnels & Tunnelling International
Uniaxial compressive strength of intact rock [0-25 points]
Drillability [0-15 points]
Discontinuities in front of the tunnnel face [0-30 points]
(MPa)
Rating
<5 5-30 30-90 90-180 >1804 14 25 14 0
c
DRI
Rating
Rating 0 0 5 3 02 7 15 1010
Homogeneity
Homogeneous Mixed 0-4 4-8 8-15 15-30 >30 Perpendicular Oblique Parallel
Number of joints per meter Orientation with repect to tunnel axis
<80 80-65 65-50 50-40 <40
15 10 7 3 0
Rating
Hours <5 5-24 24-96 96-192 >192
0 2 10 15 25
Rating
Liter/sec >100 70-100 30-70 10-30 <10
0 1 2 4 5
Stand up time [0-25 points]
Groundwater inflow [0-5points]
ARAT =ARAR
FE•FA•FD
Table 3:
Effectiveness of the crewhandling TBM and terrain
Crew factor (FE)
Less than efficient
Efficient
Very efficient
0.88
1.00
1.15
Table 4:
Tunnel length excavated(km)
Adaptationfactor (FA)
0.51.02.04.06.08.0
10.012.0
0.680.800.901.001.081.121.161.20
60
50
40
30
20
10
0Ave
rage
rat
e of
ad
vanc
e (A
RA
T) (m
/day
)
0 10 20 30 40 50 60 70 80 90 100RME07
ARAT = 0.661RME07 – 20.45
R = 0.867
Abdalajis GuadarramaGilgel Gibe II - Inlet
60
50
40
30
20
10
0Ave
rage
rat
e of
ad
vanc
e (A
RA
T) (m
/day
)
0 10 20 30 40 50 60 70 80 90 100RME07
ARAT = 0.839RME07 – 40.83
R = 0.763
Above: Fig 5 - RME data for three tunnelsexcavated with double-shield TBMs inrock with strength σc < 45MPa
Above: Fig 6 - RME data for San PedroTunnel excavated with open-type TBM inrock with strength σc > 45MPa

for the typical hard rock TBMs, namely; openTBMs; single shield TBMs; and doubleshield TBMs.
We started with the analyses of the tunnelsections excavated by double shield TBMsbecause most of the case histories in thedatabase involved this type of machine.
Thus, for double-shield TBM construction,
figure 5 depicts the ARAT values, in m/day,for three tunnels. The correlation co-efficientof R=0.867 is significantly high. The datafrom one tunnel in Ethiopia has been kindlyprovided by Dr Remo Grandori of SELI.
For open-type TBM excavation of 49tunnel sections, figure 6 shows the ARATvalues for the San Pedro Tunnel in Spain,excavated in rock having a σc > 45MPa. Thecorrelation co-efficient of R=0.763 is alsohigh.
Analyses are not yet completed fortunnels excavated with single-shield TBMs.This will be featured in Part II of this series.
Double-shield and open TBMs It was found that improved correlations areobtained when one differentiates betweencase histories featuring rocks with theuniaxial compressive strength of the intactrock σc > 45MPa and those σc < 45MPa.This is due to an increasing and decreasingtrend in the ratings of the σc parameter,reaching the favourable average value forTBM excavability at 45MPa.
Figure 7 shows the regression lines whichwere obtained for the machines excavatingin ground with σc < 45MPa.
It is clear that in this case double shieldTBMs always give better results than openTBMs, if the intact rock strength is less than45MPa.
Figure 8 shows the regression lines for themachines operating in the ground with σc >
45MPa.In this case, in better exacavability
conditions, RME > 75, the use of openTBMs clearly gives better performance thanby double shield TBMs.
However, in terrains whose excavability isbetween 65 < RME < 75 both types oftunnelling machines provide similar results.
Finally, in terrains whose excavability isbetween 50 < RME < 65, double-shieldsallow better performance than open TBMs.
Future lines of researchTo complete this research it is proposed toanalyse correlation between RME and ARATfor single-shield TBMs, mainly in the tunnelsections excavated in low strength rocks, σc< 45MPa; where this kind of tunnellingmachines can provide better results.
For this task, data will be used fromsections excavated by single-shield TBMsas well as those excavated working withdouble-shield TBM working in single-shieldmode.
These aspects and further case historieswill be included in Part II of this series.
ConclusionIn closing, the case histories database forthe Rock Mass Excavability (RME) index hasbeen increased significantly since itsintroduction a year ago. The results obtainedto date are promising and we welcomecomments and suggestions to:[email protected] T&T
EXCAVABILITY INDEX
Tunnels & Tunnelling International SEPTEMBER 2007
1. GE Wickham, HR Tiederman, EH Skinner, 1972. “Support determination based on geologicprediction” RETC, New York, p432. ZT Bieniawski, 1989. “Engineering Rock Mass Classifications - a Complete Manual” Wiley 3. N Barton, 1988. “Rock mass classification using the Q-system” ASTM Tech Pub 9844. HAD Kirsten, 1982. “A classification for excavation in natural materials”. Civil Eng in S Africa. 5. PJ Tarkoy, 1991. “Determining total hardness for TBM boreability” Canadian Symp Rock Mech6. PP Nelson, 1993. “TBM performance analysis wrt rock properties” Comp Rock Eng, p2617. L Ozdemir, B. Nilsen, 1993. "Hard rock tunnel boring prediction". Proc. RETC, Boston, p.833. 8. N Barton, 2000. “TBM Tunneling in Jointed and Faulted Rock”. AA Balkema. 9. M Alber, 2000. “Advance rates for hard rock TBMs”. TUST 15 (1). 10. OT Blindheim, 2005. “A critique of QTBM”. T&TI, June ‘05.11. M Sapigni, M Berti, F Bethaz, A Bustillo, G Cardone, 2002. “TBM performance estimation usingrock mass classifications”. Int J Rock Mech Min Sci, 39, p77112. A Palmström, E Broch, 2006. “Use and misuse of QTBM”. TUST 21, p575 13. ZT Bieniawski, B Celada, JM Galera, M. Álvares, 2006. “Rock Mass Excavability (RME) index”ITA World Tunnelling Congress, Korea. 14. ZT Bieniawski, B Celada, JM Galera, 2007. “TBM Excavability: Prediction and Machine-Rock Interaction”, RETC, Toronto, p1118 15. R Grandori, M Jäger, F Antonini, L Vigl, 1995. “Evinos-Mormos Tunnel - Greece” RETC, SanFrancisco, p74716. N Dela Valle, 2006. “Barcelona’s new backbone tunnel”. TBM Tunnelling Symposium, Madrid17. www/drillability.com/13A-98eng.pdf “Rock tunnel boring: Drillability test methods”
REFERENCES
The authors wish to express their gratitudeto the Railway Infrastructure Corp in Spain(ADIF) for allowing the use of the informationfrom the Guadarrama, Abdalajís and SanPedro tunnels and to Dr Remo Grandori ofSELI, Italy for providing the data on tunnelsof hydroelectric complex Gilgel Gibe II, inEthiopia.
They also wish to thank the Spanishconstruction companies ACS, FCC,Ferrovial-Agroman and Vias yConstrucciones; SACYR and San PedroUTE for their collaboration in the acquisitionof data from Guadarrama, Abdalajís Westand San Pedro tunnels, respectively.
Finally, we wish to recognise thededicated contributions of the first tworecipients of the Bieniawski Scholarship fortunnelling research at the Superior School ofMines, Universidad Politécnica de Madrid:Doña María Álvarez Hernández - who wasinvolved in the first year of this research,and subsequently Don José CarballoRodrígez - who developed the statisticalanalysis of the data from the latest casehistories.
ACKNOWLEDGMENTS
60
50
40
30
20
10
0Ave
rage
rat
e of
ad
vanc
e (A
RA
T) (m
/day
)
0 10 20 30 40 50 60 70 80 90 100RME07
Double shield working withtelescopic shield
Open TBM
60
50
40
30
20
10
0Ave
rage
rat
e of
ad
vanc
e (A
RA
T) (m
/day
)
0 10 20 30 40 50 60 70 80 90 100RME07
Double shieldworking withtelescopicshield
Open TBM
Above: Fig 8 - Comparison of TBMperformance versus excavability indexRME for open TBMs and double-shieldTBMs in rock with strength σc > 45MPa
Left: Fig 7 - Comparison of TBMperformance versus excavability indexRME for open and double-shield TBMsboring in rock with strength σc < 45MPa