Embed Size (px)
Citation preview

EXCEL -
DATABASE FUNCTIONS

i
TABLE OF CONTENTS
USING EXCEL AS A DATABASE ......................................................................... 1
CREATING A DATABASE.................................................................................... 2
DATA RIBBON ........................................................................................................ 3
SORTING LISTS ....................................................................................................... 3
`SORTING IN ASCENDING/DESCENDING ORDER ........................................ 3
SORTING BY MORE THAN ONE COLUMN ...................................................... 6
ENABLING AUTOFILTER ..................................................................................... 7
CLEARING AUTOFILTER CRITERIA .................................................................. 9
CREATING A CUSTOM AUTOFILTER ............................................................10
DISABLING AUTOFILTER ................................................................................11
CREATING SUBTOTALS IN A LIST ...................................................................12
Using Outline View .............................................................................................14
REMOVING SUBTOTALS FROM THE LIST ....................................................15
USING THE DATA FORM TO DEFINE CRITERIA ...........................................16
ACCESSING THE DATA FORM ........................................................................17
Using the Form ...................................................................................................19
DEFINING THE CRITERIA ..................................................................................20
CREATING A CRITERIA RANGE .......................................................................22
CRITERIA RANGE .............................................................................................22
USING THE ADVANCED FILTER ....................................................................23
DATABASE FUNCTIONS .....................................................................................25
DSUM .................................................................................................................25

EXCEL - DATABASE FUNCTIONS 1
USING EXCEL AS A DATABASE
A database is a collection of information arranged in such a way as to make it easy
to access. For example, a telephone book is a static database arranged in
alphabetical order; however, because it is static, you cannot rearrange the
information. In the business world, you need the capability to manipulate a
database. This capability is known as database management. The computer makes
the concept of database management possible by enabling you to create, store, and
manipulate a database.
Excel has built-in database management capabilities. You can treat a worksheet or
portions of a worksheet as a database. Using an Excel database, you can enter, edit,
locate, sort, and analyze information.
In Excel, you can define any list as a database, since a list is simply a range of cells
made up of columns and rows. The columns contain the field data and the rows
contain the record data. Additional rows can be inserted as records are added to the
database. In Excel, any list can be used as a database. A valid list does not contain
any blank columns or rows.

EXCEL - DATABASE FUNCTIONS 2
CREATING A DATABASE
You can create an Excel database. Before creating a database, however, you must
consider the specific information you want to collect (that is, the fields or types of
information you want to track). You might, for example, need to track a client
name, address, city, state, zip code, telephone number, invoice number, date of
invoice, amount of invoice, and the sales representative's commission. You can
create one field for each type of information.
A field occupies a single column of a database and contains a single piece of
information in each record. For example, a Salary field might contain salary
information for each employee record. You can enter text, numbers, formulas,
dates, or functions into a field. A computed field contains formulas or functions.
Excel uses the top row of the list (the column labels) as the field names.
A little planning can save hours of additional work at a later date. For example, to
sort a database by last name, you must create two fields (one for the first name and
one for the last name). You cannot enter the first and last names in a single field if
you want to sort by last name.
Once you have entered the field names for a database, you can enter the records.
Each row of a database contains one record. A record contains all the information
related to one entry. For example, an employee record could contain the name,
address, telephone number, and salary information of a single employee. Although
each record contains all the fields in the database, you do not have to enter data
into every field.
You may want to start with a small model of your database to test its design and
usability. You can enter a few records and verify that you can store and retrieve the
data as needed.

EXCEL - DATABASE FUNCTIONS 3
DATA RIBBON
The Data Ribbon contains all the functions you need to manage your data:
GROUPS: Get External Data, Connections, Sort & Filter, Data Tools, Outline
Let’s take a look at some of those functions.
SORTING LISTS
You can arrange data in a list by the entries in a particular column. A list is a
range of cells organized with similar sets of data in each column. You can sort the
list alphabetically by name or numerically by a value.
Excel uses the following guidelines when sorting data:
1. Rows with duplicate items in the sort column remain in their original order.
2. Rows with blank cells in the sort column are placed last in the sorted list.
`

EXCEL - DATABASE FUNCTIONS 4
SORTING IN ASCENDING/DESCENDING ORDER
You can sort a list in either ascending or descending order. Ascending order sorts
a list from the lowest to highest value. Descending orders sorts a list from the
highest to lower value. Lists are sorted by the column that contains the active cell.
To sort by ascending order, click into the active cell of the column you want
to sort on (i.e. State):
Click the Sort Ascending Button on the Data Ribbon:
The list is now by State from A to Z.

EXCEL - DATABASE FUNCTIONS 5
NOTE: You can click on the Undo Button to return the data to the original
order.
To sort by descending order, click into the active cell of the column you
want to sort on (i.e. Member Since):
Click on the Sort Descending Button on Data Ribbon.
The list is now sorted by Membership Date from newest to oldest member.

EXCEL - DATABASE FUNCTIONS 6
SORTING BY MORE THAN ONE COLUMN
To sort by more than one column, click into cell A1 and then click the Sort
Button on the Data Tab:
The Sort dialog box appears and the entire worksheet is selected.
"My data has headers" (column headings) should be selected.
From the drop-down list, select the column you want to sort by first.
Click Add Level, and from the drop-down list, select the column you wat to
sort second.
The list is now sorted, first by State and then by Membership Date (newest
to oldest):

EXCEL - DATABASE FUNCTIONS 7
ENABLING AUTOFILTER
A list is a range of cells organized with similar sets of data in each column.
Column labels describe the data in the corresponding column, also known as a
field. The information displayed across each row is called a record.
When data is in an organized list, you can filter the data to display only selected
information. A filter is a set of conditions (criteria) that must be met. When you
enable a filter, only the rows (records) matching the filter conditions appear.
The AutoFilter feature allows you to easily create and change filters in a list. When
AutoFilter is enabled, AutoFilter arrows appear in the column label cells. You can
then select criteria from one or more fields. For example, you can select criteria
from two different fields to display only those members that are in a specific State
and have been a member after 2010.
Since AutoFilter adds drop-down lists to column label cells, the list must contain
column labels in order to use this feature.
To enable AutoFilter, click the Filter Button from the Data Ribbon.
AutoFilter arrows will now appear in the column label cells.

EXCEL - DATABASE FUNCTIONS 8
To display only those members that live in California, click the down arrow
next to Sate and deselect Select All and select CA:
Only those members that live in CA will appear:
The filtered field shows the filter icon.
EXCEL - DATABASE FUNCTIONS 9
CLEARING AUTOFILTER CRITERIA
You can clear AutoFilter criteria to remove a filter and display all rows in a list.
AutoFilter is flexible enough to allow you to display and hide records without the
fear of deleting data.
If you have filtered on multiple fields, you must select (All) from each AutoFilter
list to display all records. You can clear all filters at the same time by click the
Clear Button from the Data Ribbon.

EXCEL - DATABASE FUNCTIONS 10
CREATING A CUSTOM AUTOFILTER
An AutoFilter list displays all field values in that column. In addition to filtering by
one value on the list, you can use comparison criteria to create a custom filter.
Excel provides a number of conditions you can use to create a filter. For example,
you can use “is after” condition to view only those members who joined after
2008.
EXCEL - DATABASE FUNCTIONS 11
DISABLING AUTOFILTER
When you have finished using AutoFilter, you can disable it. Disabling AutoFilter
removes the AutoFilter arrows from the worksheet.
To toggle off the AutoFilter, click the Filter Button from the Data
Ribbon again.

EXCEL - DATABASE FUNCTIONS 12
CREATING SUBTOTALS IN A LIST
You can create subtotals for lists that are grouped. When a database is sorted by
the values in a field, records containing identical values are grouped together.
Therefore, when you sort a list by State, all records from the same State, such as
CA, are grouped together and appear consecutively in the list.
Once a list is grouped, you can calculate the subtotals of fields. For example,
summing the value of donations by State. Besides the SUM function, other
functions can be used for subtotal calculations, including COUNT, AVERAGE,
MIN, and MAX. Multiple fields can be subtotaled within a group.
When a list is subtotaled, Excel inserts a summary row under each group with the
group name and resulting subtotals, and a final grand total at the bottom of the list.
In addition, outlining is automatically applied to the list. Subtotaled groups appear
with outline symbols. Using the symbols, you can display or hide the group details.
NOTE: A list must be sorted first by the same field in which you want to report
grouped subtotals.
To create subtotals for each State:
First you will need to sort the State column in ascending order.
Click into an active cell in the State column, and click the Sort Ascending
Button on the Data Ribbon.
The list is now sorted in ascending order by State.

EXCEL - DATABASE FUNCTIONS 13
Click into cell A1, and select Subtotal from the Data Ribbon.
The Subtotal dialog box appears:
Under At each change in:, select State, under Use function:, select Sum,
and under Add subtotal to: select 2016 Donation. Click OK.
The total value for each State now appears:

EXCEL - DATABASE FUNCTIONS 14
Using Outline View
Click the “1” to view the Grand Total:
Click the “2” to view the totals for each State:
Click the “3” to view all the data with the subtotals below for each State:

EXCEL - DATABASE FUNCTIONS 15
REMOVING SUBTOTALS FROM THE LIST
You can remove the subtotals from a list when you no longer need the results.
Removing the subtotals also removes the outlining and grand total information.
Select a cell in the list containing the subtotals you want to remove.
Click Subtotal from the Data Ribbon:
Click Remove All.
EXCEL - DATABASE FUNCTIONS 16
USING THE DATA FORM TO DEFINE CRITERIA
You can define criteria to locate records in the data form. Criteria filters the
records so that you view only those records meeting the criteria. When you are
searching a long list of records, criteria can help to decrease the number of records
you must search.
You can search for records that meet a single criterion or multiple criteria. When
you specify multiple criteria, found records must match all the specified criteria.
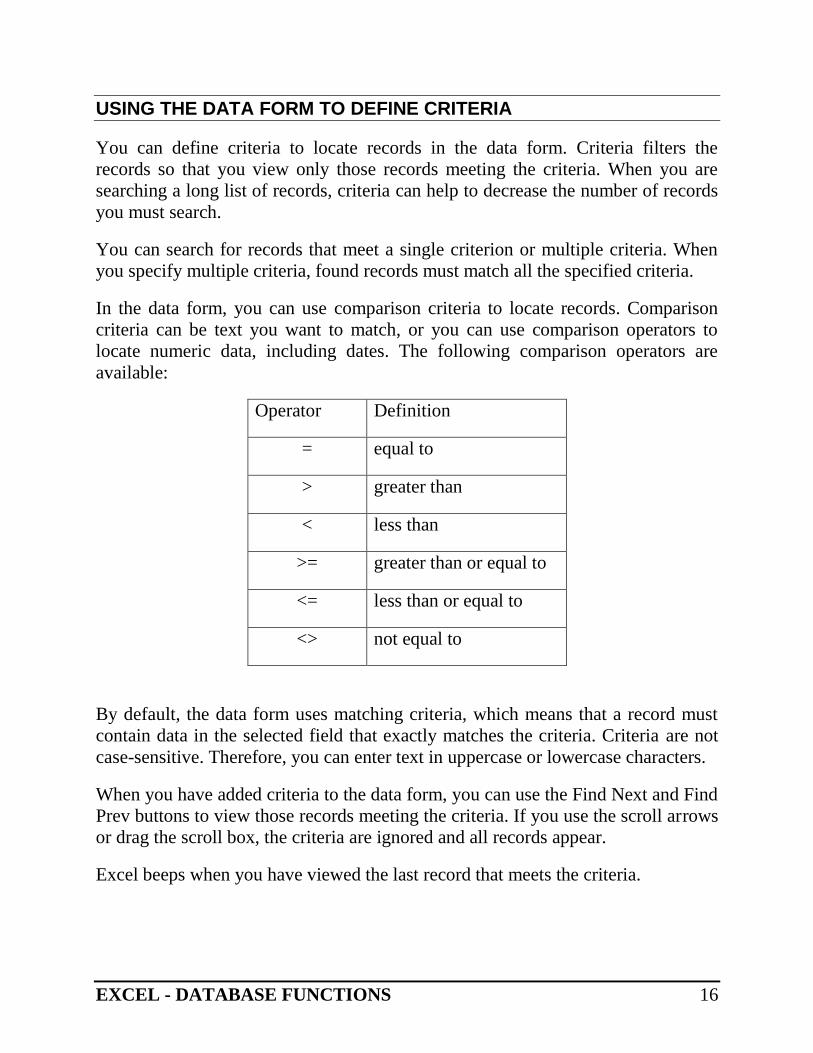
In the data form, you can use comparison criteria to locate records. Comparison
criteria can be text you want to match, or you can use comparison operators to
locate numeric data, including dates. The following comparison operators are
available:
Operator Definition
= equal to
> greater than
< less than
>= greater than or equal to
<= less than or equal to
<> not equal to
By default, the data form uses matching criteria, which means that a record must
contain data in the selected field that exactly matches the criteria. Criteria are not
case-sensitive. Therefore, you can enter text in uppercase or lowercase characters.
When you have added criteria to the data form, you can use the Find Next and Find
Prev buttons to view those records meeting the criteria. If you use the scroll arrows
or drag the scroll box, the criteria are ignored and all records appear.
Excel beeps when you have viewed the last record that meets the criteria.

EXCEL - DATABASE FUNCTIONS 17
ACCESSING THE DATA FORM
The Data Ribbon in Excel 2010 does not have the Form command. You must add
it as follows:
Click File – Options – Custom Ribbon:

EXCEL - DATABASE FUNCTIONS 18
From Main Tabs on the right, highlight Data and click New Group.
Rename the Group Forms.
Highlight Form from the list of popular commands and click Add.
The Form command has been added to the Data Ribbon:

EXCEL - DATABASE FUNCTIONS 19
Using the Form
Click into cell A1 and click Form from the Data Ribbon. A separate form will
appear for each record.
Click New to add a record and complete the data on the form:
Click close and th record will be added to the bottom of the list:

EXCEL - DATABASE FUNCTIONS 20
DEFINING THE CRITERIA
To define criteria, click on Criteria from the Data Form.
The Criteria dialog box appears:
To view records of members from a specific State (CA) where they donated
$1,000 or more, in the State field enter CA and in the 2016 Donation field
enter >=1000:

EXCEL - DATABASE FUNCTIONS 21
Click on the Find Next button to find the first record that meets the set
criteria.
Click the Find Next button again and the next record that meets the set
criteria will appear.
Click Close to return to the worksheet.

EXCEL - DATABASE FUNCTIONS 22
CREATING A CRITERIA RANGE
You can use advanced filters to create complicated conditions to filter out only
specific records that meet a certain criteria.
CRITERIA RANGE
To find records that match a specific criteria, you can use the column labels of a
worksheet and enter the criteria below.
In the ExcelData worksheet, select the column headings (A1 :H1).
Click the Copy button on the Home Ribbon.
Click into a blank cell in the worksheet (L1).
Click the Past button on the Home Ribbon.
These are the column labels for this worksheet:
You can now enter the criteria below each column label.
For only members before 2000 in the State of Florida (FL):

EXCEL - DATABASE FUNCTIONS 23
USING THE ADVANCED FILTER
In the Advanced Filter dialog box, you define the list and the criteria ranges. The
list range contains the fields and records and the criteria range contains the criteria
labels and the conditions for which you want to search.
If the active cell is positioned in the data list before you open the Advanced Filter
dialog box, Excel automatically defines the list range. Otherwise, you can
manually enter the list range by typing the range address or by selecting the range
in the worksheet.
To specify the List Range:
Click into Cell A1.
Select Advanced from the Data Ribbon.
The entire list is highlighted.
To specify the Criteria Range:
Click into the Criteria Range box.
Click to specify the Criteria Range.
Click into the first cell that contains the column labels from the worksheet
and drag to select all the column labels and criteria below.
Select L1 to S2 (Criteria Range).
Click .
EXCEL - DATABASE FUNCTIONS 24
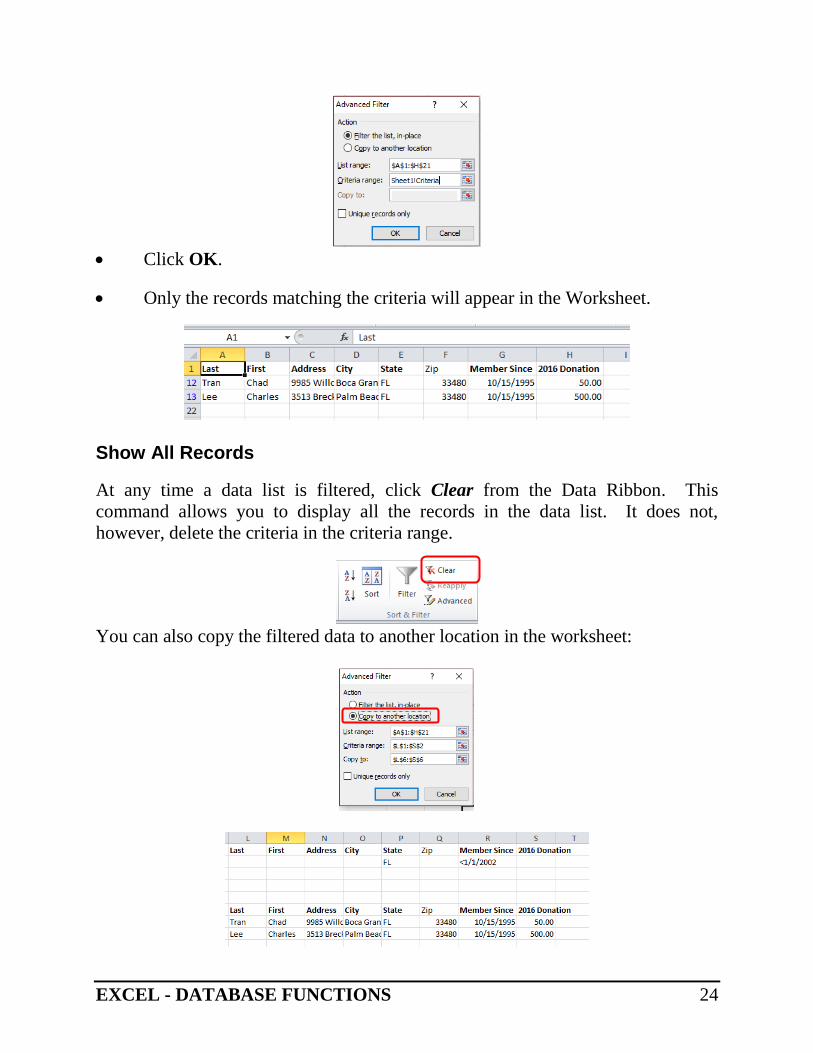
Click OK.
Only the records matching the criteria will appear in the Worksheet.
Show All Records
At any time a data list is filtered, click Clear from the Data Ribbon. This
command allows you to display all the records in the data list. It does not,
however, delete the criteria in the criteria range.
You can also copy the filtered data to another location in the worksheet:

EXCEL - DATABASE FUNCTIONS 25
DATABASE FUNCTIONS
DSUM
DSum is used to tally very specific information on a table. In the example below
we are using Dsum to calculate the total donations from members living in CA
who joined before 1/1/2002 as the Criteria Range:
Here are the parts for Dsum:
Database is the range being calculated (Entire Database - A1:H21). H1 (2016
Donataion) is the field you want it to apply the calculation to. L1:R2 (Criteria
Range) is the criteria range you specify that you want to use when deciding what
to calculate.
= 3,150.00