Embed Size (px)
Citation preview

Excel Power Tools
David Onder and Alison Joseph
NCAIR 2015 Conference

• 10,382 students
• Master’s Comprehensive
• Mountain location
• Residential and Distance
2

Why Pivot Tables
• Summarize large datasets
• Quickly add, remove, rearrange elements
• (Little to) No formula-writing
• Can be a basis for self-service data
• Can connect to a refreshable data source
3

Limitations of Pivot Tables
• Connected to only 1 table
• Formatting not maintained
• Calculated fields need to be created for each Pivot
Table
• Can’t count the way universities usually want to count
4

5
Displaying Data –Pivot Tables

Connecting to Data
6
Connecting to Data
7

Displaying Data – Pivot Tables
8

Displaying Data – Pivot Tables
9

Displaying Data – Pivot Tables
10
Sum
Count
Average
Max
Min
Product
Count Numbers
StdDev
StdDevp
Var
Varp

Displaying Data – Pivot Tables
11

12
Displaying Data –Power Pivot
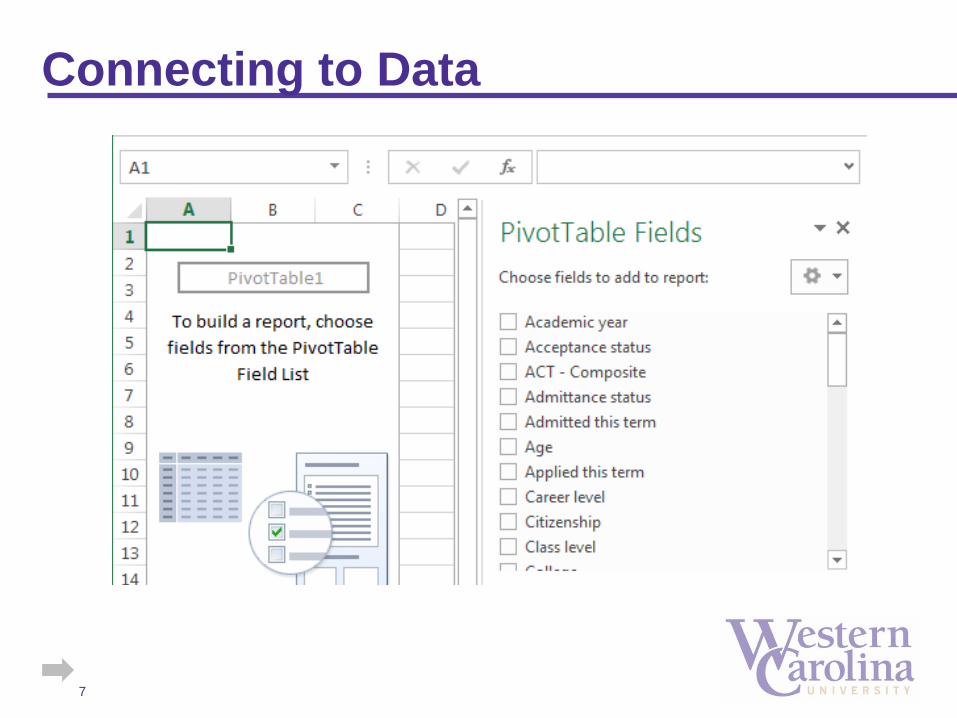
Displaying Data – Power Pivot
• Set-up
13
• Installed with Excel 2013
• Downloadable add-in for Excel 2010
• Not available prior to Excel 2010

Displaying Data – Power Pivot
• The Power Pivot environment
14
Open Power Pivot

Displaying Data – Power Pivot
• The Power Pivot environment
15
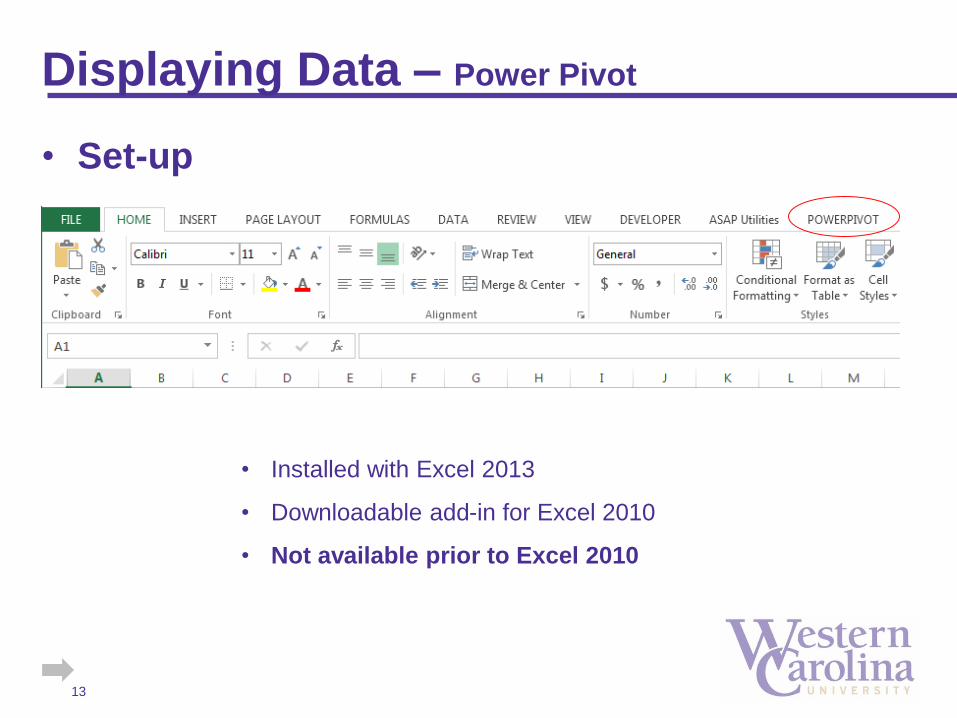
Displaying Data – Power Pivot
• Import data
16
Displaying Data – Power Pivot
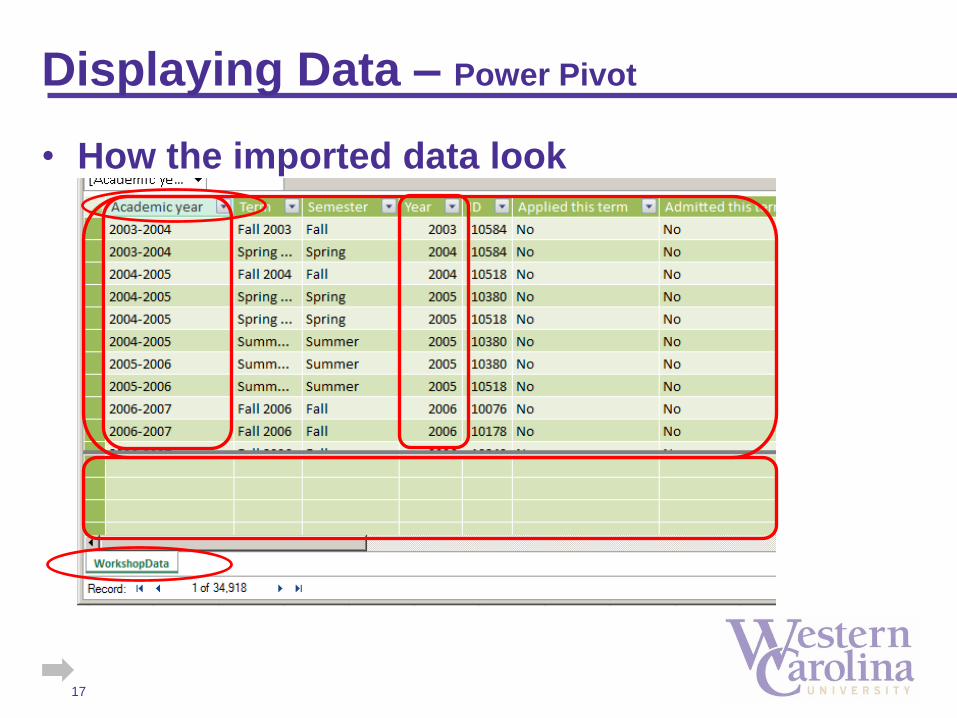
• How the imported data look
17

Displaying Data – Power Pivot
• Bringing data into Excel
18
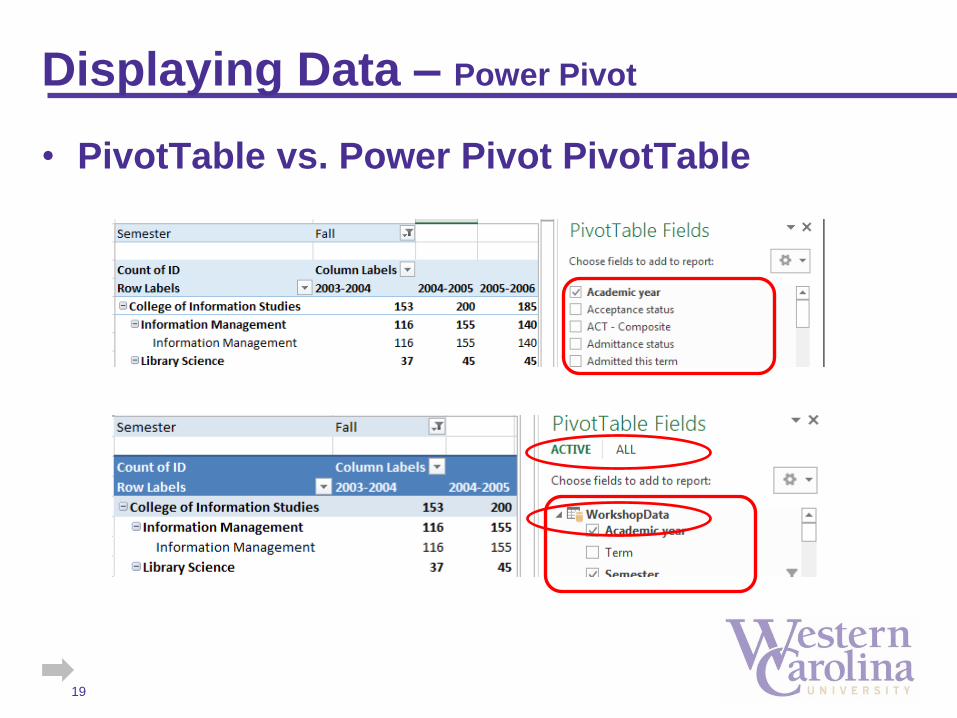
Displaying Data – Power Pivot
• PivotTable vs. Power Pivot PivotTable
19

Displaying Data – Power Pivot
• DAX
– Data Analysis Expressions (DAX)
– Formula language for Power Pivot
– Used to create Calculated Columns and Calculated
Fields
20

Displaying Data – Power Pivot
• Calculated Columns
– Used to add an additional column to data table
– Can be a column added from a related table (like a VLOOKUP) or new data, derived from existing data (sum to combined SAT, length of name, substring of longer string, etc.)
– Column can be used in any area of the pivot
21
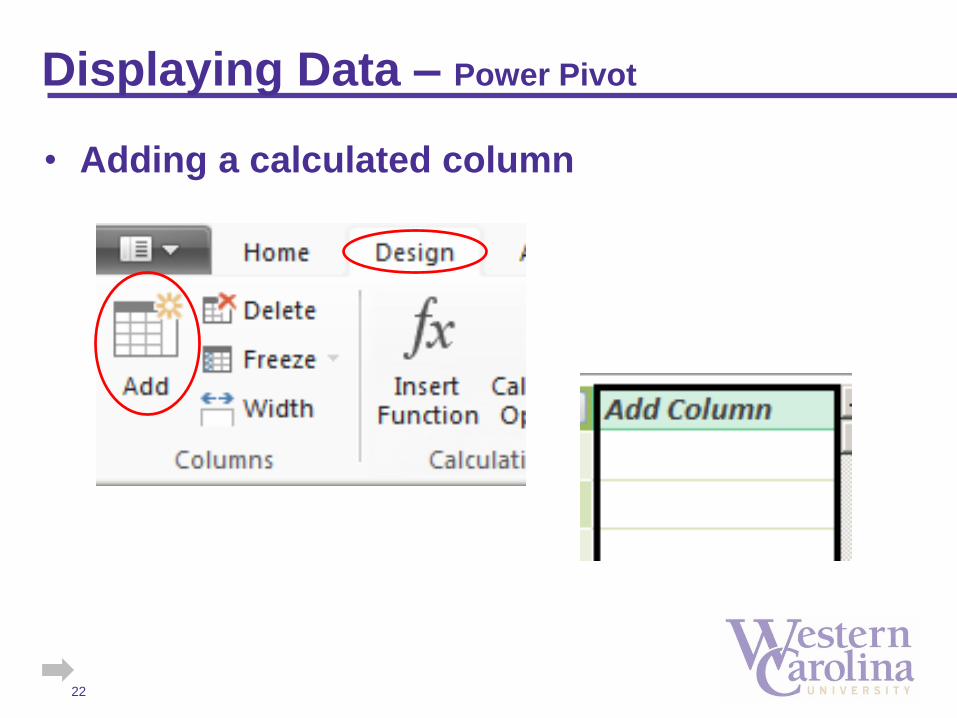
Displaying Data – Power Pivot
• Adding a calculated column
22

Displaying Data – Power Pivot
• Adding a calculated column
23

Displaying Data – Power Pivot
• Adding a calculated column
24

Displaying Data – Power Pivot
• Adding a calculated column to pivot table
25

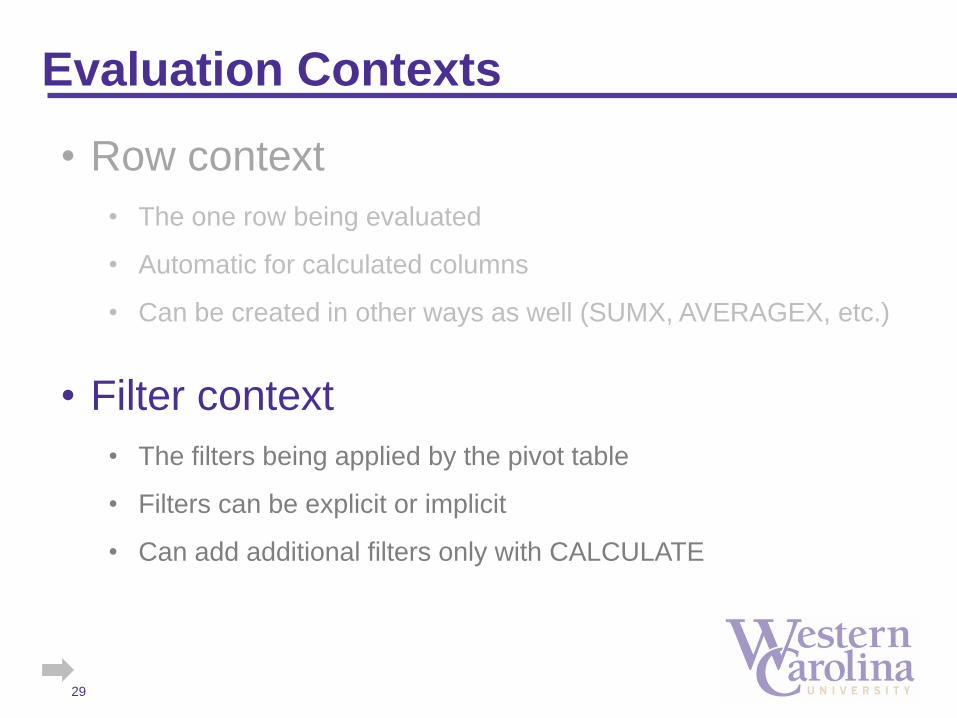
Evaluation Contexts
26
• Row context
• Filter context

• Row context
• Filter context
Evaluation Contexts
27
• The one row being evaluated
• Automatic for calculated columns
• Can be created in other ways as well (SUMX, AVERAGEX, etc.)

Row Context
28
• Filter context
• The filters being applied by the pivot table
• Filters can be explicit or implicit
• Can add additional filters only with CALCULATE
Evaluation Contexts
29
• Row context
• The one row being evaluated
• Automatic for calculated columns
• Can be created in other ways as well (SUMX, AVERAGEX, etc.)

Filter Context
30

Displaying Data – Power Pivot
• Calculated Fields
– Used to add a calculated element
– Aggregate function that applies to whole table,
column, or range
– Something that needs to be recalculated
– Fields can only be used in the VALUES section
31

Displaying Data – Power Pivot
• Adding a Calculated Field
32
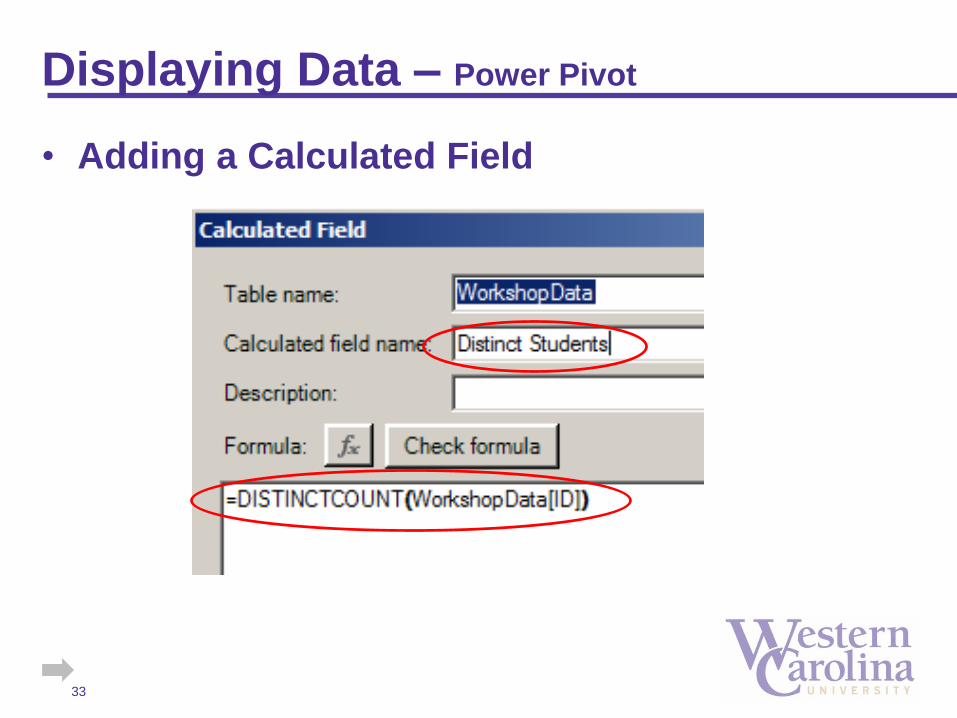
Displaying Data – Power Pivot
• Adding a Calculated Field
33

Displaying Data – Power Pivot
• Calculated Field in Power Pivot
34

35
Displaying Data –Power Pivot
DAX ALL, ALLEXCEPT, CALCULATE, DISTINCTCOUNT, DIVIDE, FILTER

Displaying Data – Power Pivot
• DISTINCTCOUNT
DISTINCTCOUNT( <column> )
– Counts unique values in column
36

Displaying Data – Power Pivot
• Adding a Calculated Field
37

Displaying Data – Power Pivot: DAX CALCULATE
• CALCULATE
CALCULATE( expression, <filter1>, <filter2>… )
– Supercharged SUMIFS
– Allows filtering (IFs) on any aggregate function
(imagine “MAXIFS”, “MEDIANIFS”, etc.)
– Operators for filters: =, <, >, <=, >=, <>
– Can also use || in filter on same column
38

First-time Freshmen Distinct Students:=
CALCULATE(
[Distinct Students],
WorkshopData[Class level]=“Freshman”,
WorkshopData[Is new student this term]=“Yes”
)
39
Displaying Data – Power Pivot: DAX CALCULATE

40
Displaying Data – Power Pivot: DAX CALCULATE

• ALL
ALL( table_or_column, <column1>, <column2>, …)
– Returns all the rows in a table, or all the values in a column, removing any filters that might have been applied
41
Displaying Data – Power Pivot: DAX ALL

All Distinct Enrolled Students:=
CALCULATE(
[Distinct Enrolled Students],
ALL( WorkshopData[Class level] )
)
42
Displaying Data – Power Pivot: DAX ALL

43
Displaying Data – Power Pivot: DAX ALL
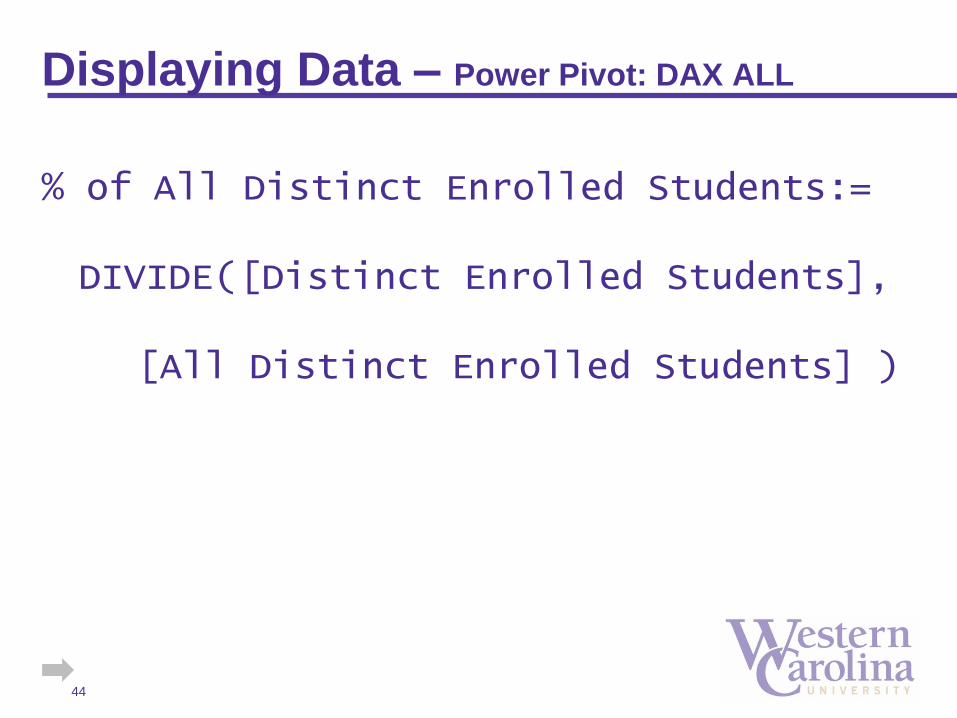
% of All Distinct Enrolled Students:=
DIVIDE([Distinct Enrolled Students],
[All Distinct Enrolled Students] )
44
Displaying Data – Power Pivot: DAX ALL

Displaying Data – Power Pivot
• DIVIDE
DIVIDE( <num>, <den>, [<alt>] )
– “Safe” divide
– Can specify alternate result for divide by zero
45

Displaying Data – Power Pivot
46
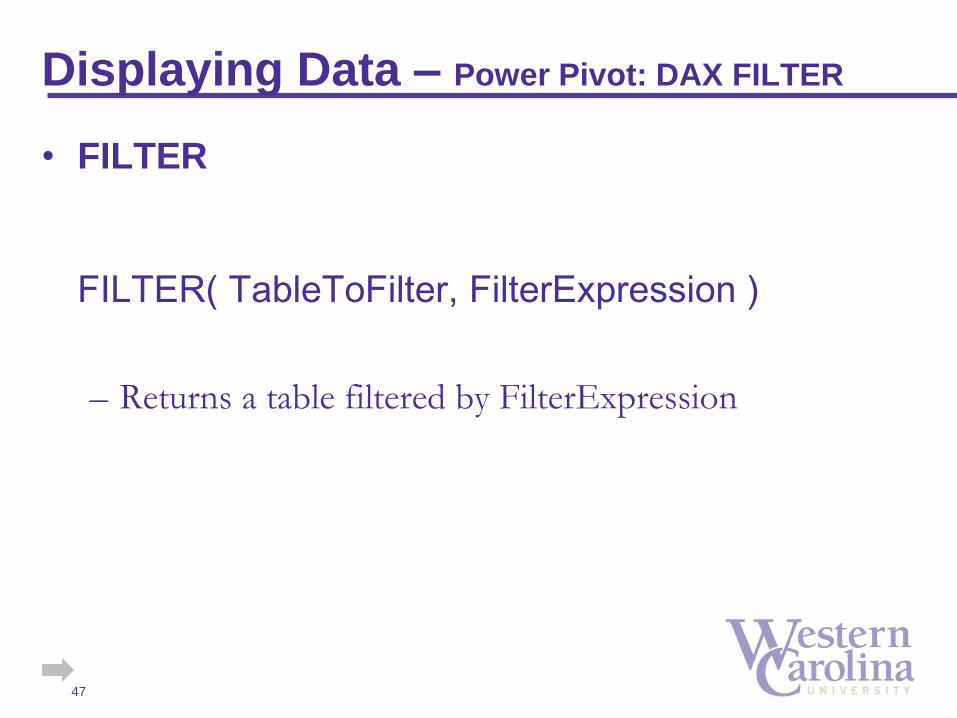
Displaying Data – Power Pivot: DAX FILTER
• FILTER
FILTER( TableToFilter, FilterExpression )
– Returns a table filtered by FilterExpression
47

Above Average GPA Enrolled Undergraduates:=
CALCULATE(
[Distinct Enrolled Students],
FILTER(
WorkshopData,
WorkshopData[Institutional cumulative GPA] > [Average GPA Enrolled Undergraduates]
)
)
48
Displaying Data – Power Pivot: DAX CALCULATE

49
Displaying Data – Power Pivot: DAX FILTER

Displaying Data – Power Pivot: DAX FILTER
• ALLEXCEPT
ALLEXCEPT( <table>, <column>[, <column>…])
– Similar to ALL function, but excludes the column(s) specified from the ALL
50

51
Power Query

Power Query
• Retrieve data from a variety of external sources
• Pull in external data from the Internet
• Limit the data you bring into your model (filter on rows and columns)
• Keep you model to a reasonable size (< 1M records)
to prevent processing problems
• Bring in only what you need
52

Power Query
• Consolidate multiple
tables into one
53

Power Query – Advanced
• In-line data
transformations
54
• Consolidate multiple
tables into one

Power Query – Advanced
• All transformation steps
are listed, and reversible
55
• In-line data
transformations
• Consolidate multiple
tables into one

Power Query – Advanced
• Access to sources of
data not readily
available to Power Pivot
56
• All transformation steps
are listed, and reversible
• In-line data
transformations
• Consolidate multiple
tables into one

Power Query – Advanced
57
• SharePoint Lists

Power Query – Advanced
• See all available
lists
• Expand a
particular list for
fields
58

Power Query – Advanced
59
• Even get Active Directory names
Power Query – Advanced
• Connect to online faculty database
– Import active users from Digital Measures
– Merge with local data
– Export updated data to Digital Measures
60

Power Query – Advanced
61

Power Query – Advanced
62
• Microsoft SQL Server and Access
• An many other databases (e.g., Oracle, MySQL,
PostgreSQL)

Power Query – Advanced
63
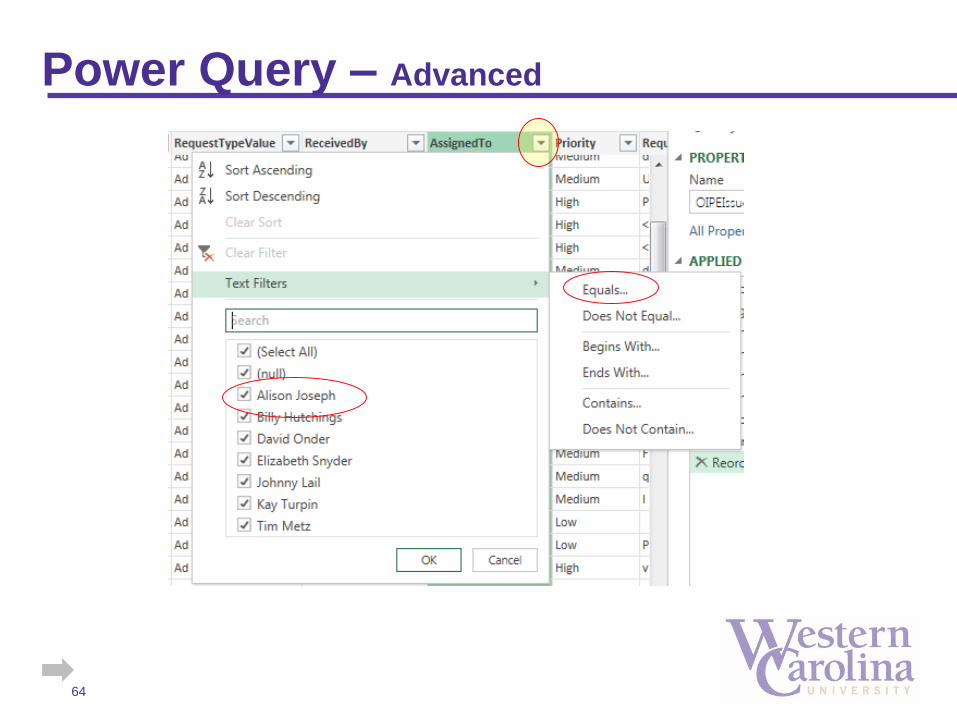
Power Query – Advanced
64
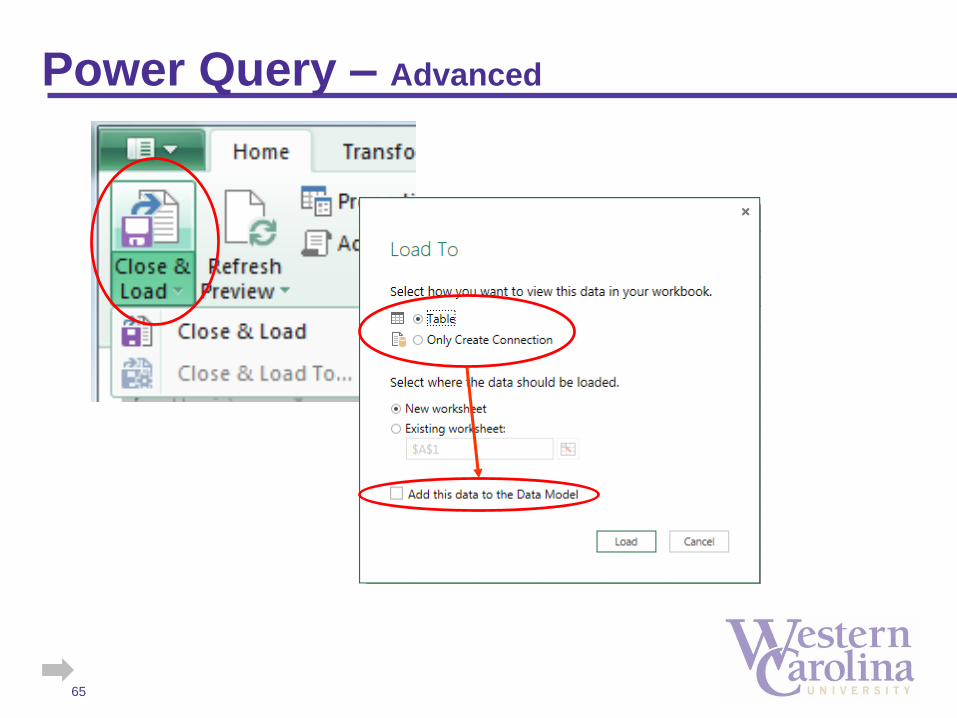
Power Query – Advanced
65

66
Displaying Data –Power View

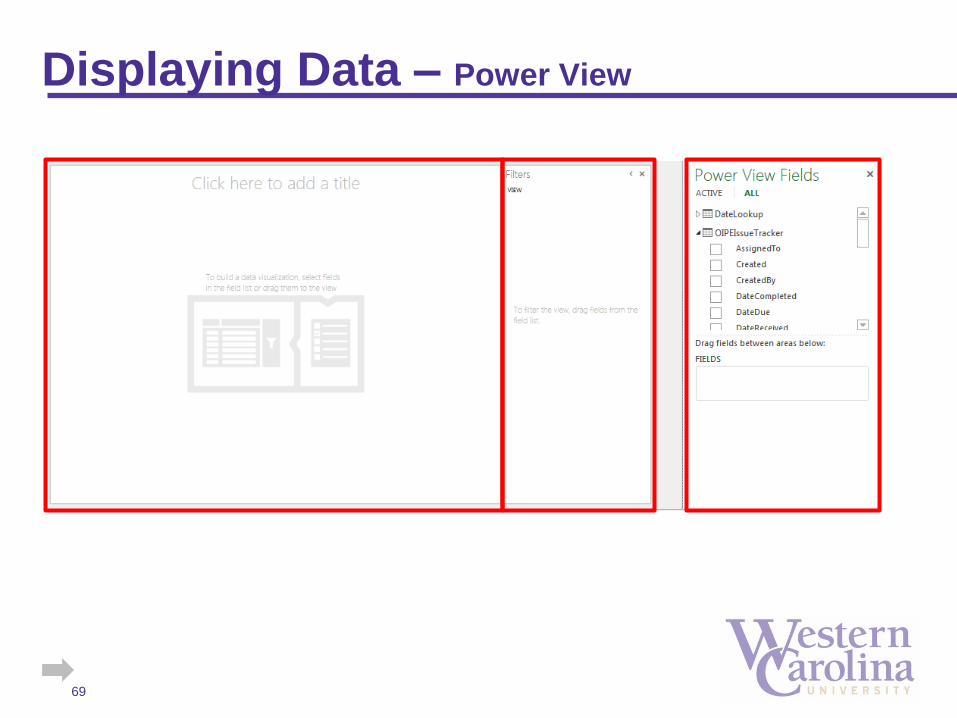
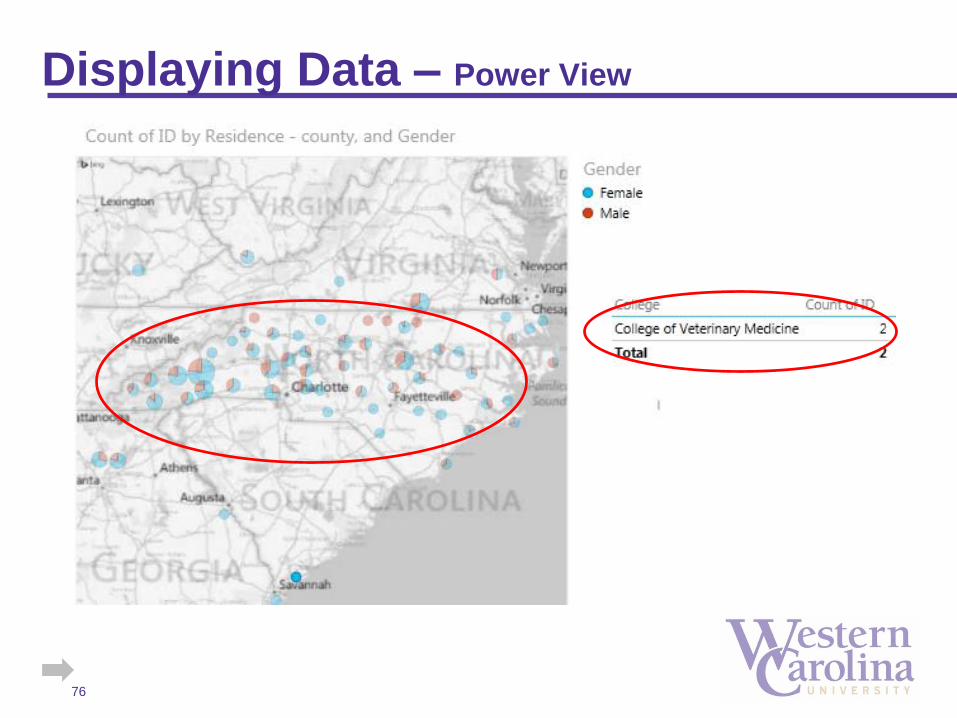
Displaying Data – Power View
• Power View
– Dashboard builder
– Allows synchronized filtering
– Bring together tables, graphs, maps
67

Displaying Data – Power View
68
Displaying Data – Power View
69

Displaying Data – Power View
70

Displaying Data – Power View
71

Displaying Data – Power View
72

Displaying Data – Power View
73
Displaying Data – Power View
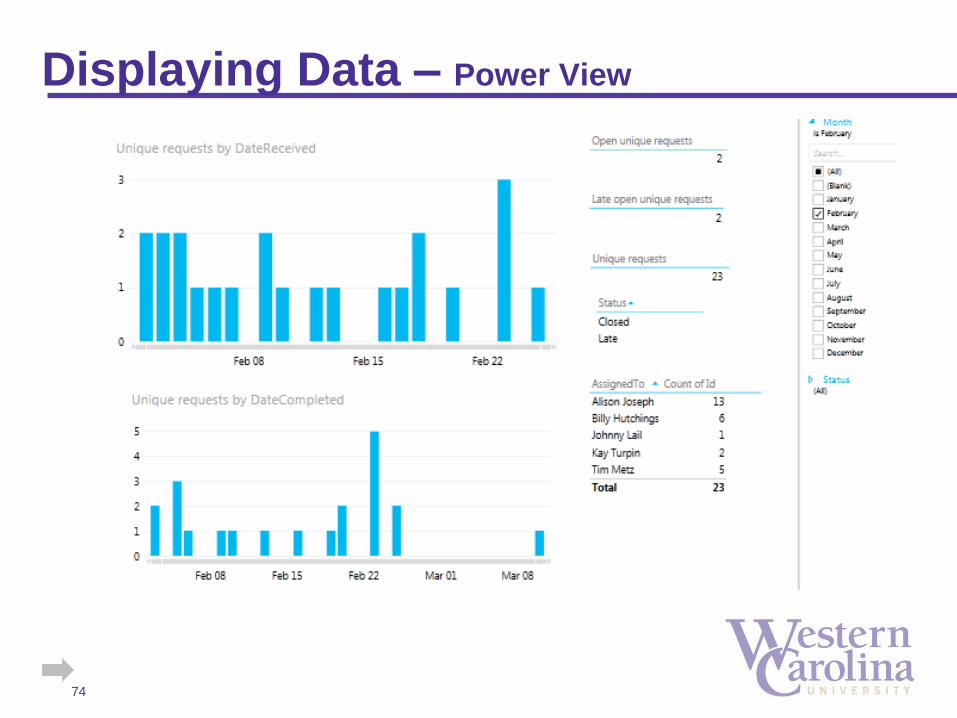
74

Displaying Data – Power View
75
Displaying Data – Power View
76
77
Displaying Data –Power Map

Displaying Data – Power Map
• Power Map
– Automated way to map geographic data
– Doesn’t require geo-location information like longitude and latitude (just country, state, or county names)
– Can add elements to look at aggregate function on variables across physical space
78

Displaying Data – Power Map
79

Displaying Data – Power Map
80

Displaying Data – Power Map
81

Displaying Data – Power Map
82

Displaying Data – Power Map
83

Displaying Data – Power Map
84

Displaying Data – Power Map
85

Displaying Data – Power Map
86

Resources
87
• Rob Collie (http://powerpivotpro)
– DAX Formulas for PowerPivot, 2013
• Bill Jelen (http://mrexcel.com)
– PowerPivot for the Data Analyst: Microsoft Excel 2010, 2010
• Alberto Ferrari and Marco Russo
– Microsoft Excel 2013: Building Data Models with PowerPivot
• Chris Webb (http://cwebbbi.wordpress.com)
• Kasper de Jonge (http://www.powerpivotblog.nl)
• Purna Duggirala (http://www.chandoo.org/)

Contact Information
Alison Joseph, Business and Technology Applications Analyst
Office of Institutional Planning and Effectiveness
oipe.wcu.edu, (828) 227-7239
88
David Onder, Director of Assessment
With the help of Tim Metz, Elizabeth Snyder, Billy Hutchings, and Henson Sturgill