Embed Size (px)
Citation preview

Don’t use Excel for charting. Upload Excel sheets to Plotly for best practice charts, data driven reports, and dashboards.
Better together.

MS Sharepoint from year 2050
Bring the data, charts, and discussion to the cloud
1. Upload Excel sheets to Plotly 2. Create charts 3. Apply company brand 4. Add charts to reports and
dashboards 5. One-click sharing 6. Join discussion on your
colleague’s data visualizations

Uncompromising graphics
Fully interactive charts (zoom, pan, hover text)
Plotly makes D3.js technology accessible to Excel users - The same graphics engine used by the New York Times.
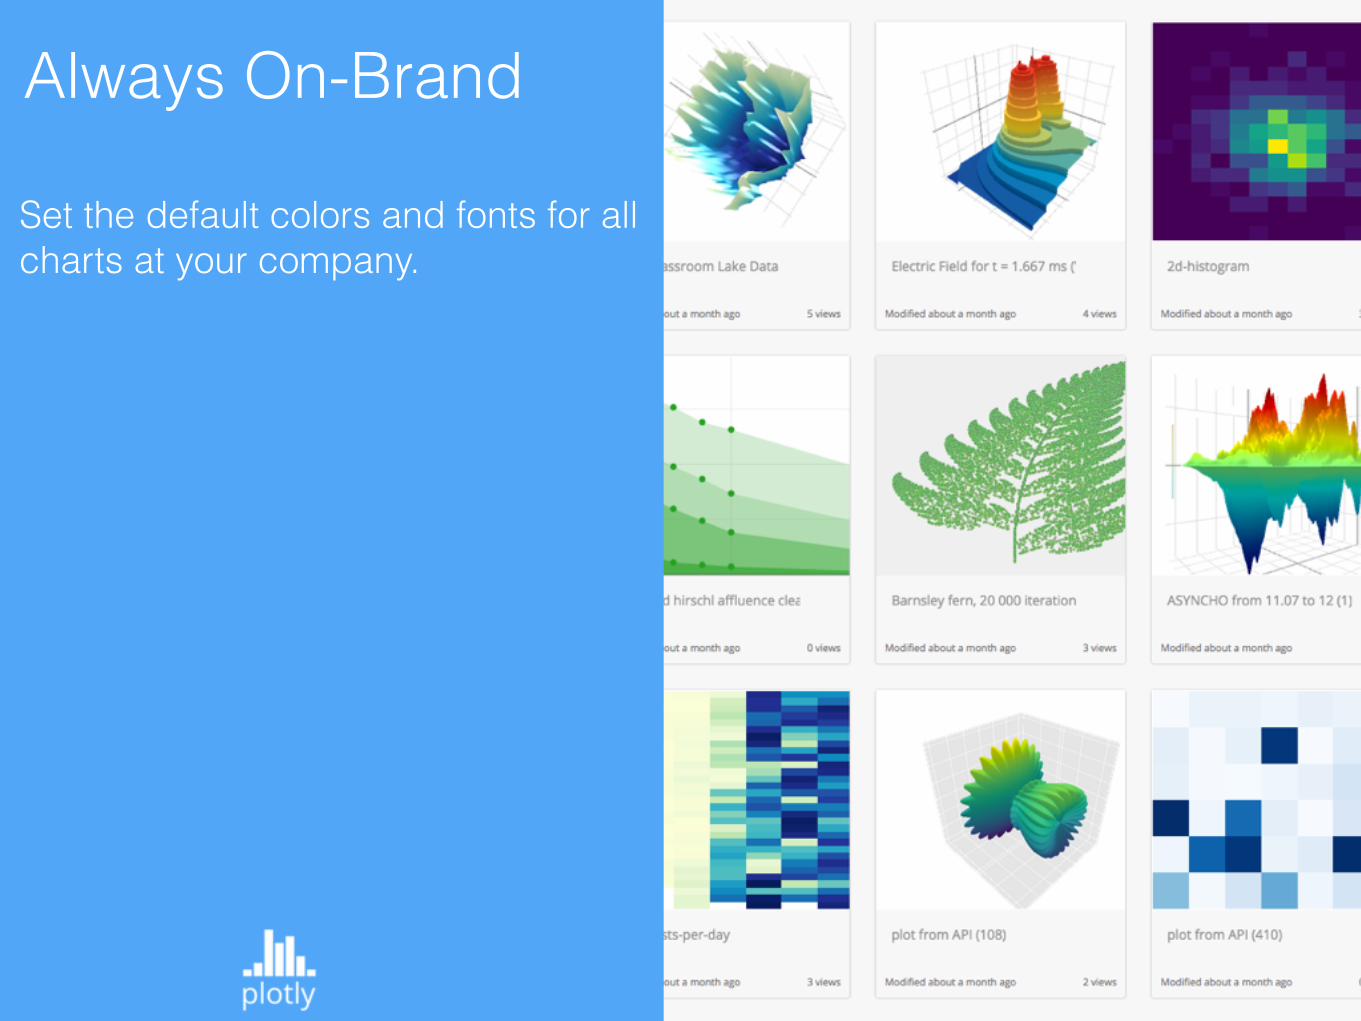
Always On-Brand
Set the default colors and fonts for all charts at your company.

Poorly crafted reports and visuals aren’t accepted in today’s workplace. Plotly makes your work stand out.
Some companies we’ve worked with
Trusted by the best

On-Premise security
Can’t use the cloud?
We’ve got you covered.
Plotly will deploy an On-Premise server behind your company’s firewall, accessible only at an internal address:
plotly.acme.com