Embed Size (px)
Citation preview

EXCELLENCELEADERSHIPINNOVATIONCONNECT:ANNUAL REPORT2011
CONTACT INFORMATIONFor more information about the University, please visit: www.uow.edu.au Enquiries about courses and subjects may be directed to:
Wollongong UniAdviceTel: 1300 367 869Fax: +61 2 4221 4392Email: [email protected]
Other enquiries can be made during office hours to:
The SwitchboardTel: +61 2 4221 3555Fax: +61 2 4221 4322Switchboard 8.30am – 5.30pmOffice hours Monday to Friday
Written Enquiries should be addressed to the:
Vice‑Principal (Administration)University of WollongongNorthfields Avenue Wollongong NSW 2522 Australia
The 2011 Annual Report is available on the University’s website: www.uow.edu.au/about/annualreport
© 2012 University of Wollongong.
The University of Wollongong attempts to ensure that the information contained in this publication is correct at the time of production (April 2012), however sections may be amended without notice by the University in response to changing circumstances or for any other reason.
CRICOS Provider No.: 00102E. ISSN 1 2345 6789.
UN
IVERSITY OF WOLLON
GONG
2011 AN
NUA
L REPORT

27 April 2012
The Honourable Adrian Piccoli, MP
New South Wales Minister for Education and Training Governor Macquarie Tower Level 34, 1 Farrer Place SYDNEY NSW 2000
Dear Minister
The Council of the University of Wollongong has the honour of submitting to you the Annual Report of the proceedings of the University of Wollongong for the period 1 January to 31 December 2011.
The Annual Report has been prepared in accordance with the relevant legislation, particularly the Annual Reports (Statutory Bodies) Act 1984 (NSW) and the Public Finance and Audit Act 1983 (NSW).
Yours sincerely,
Ms Jillian Broadbent AO Professor Paul Wellings Chancellor Vice Chancellor and Principal

2011 Annual Report 01
contents
VOLUME ONE
UOW 2011
UOW at a Glance 03
Vice-Chancellor’s Review 04
Highlights of 2011 06
University Governance 08
Review of Performance
Student Learning and Teaching 13
Research Management 24
Engagement and Partnerships 30
International 32
Staff 35
Quality and Business 41
Appendices
UOW Faculty Structure 54
Senior University Officers 55
Senior Executive Performance 57
UOW Council and Committees 58
Freedom of Information Statistics 60
Employment, Equity and Diversity Statistics 63
Academic Promotions 64
Land Disposal and Acquisition 66
Engagement of Consultants 67
UOW Finance 2011
University and Subsidiaries (Consolidated) Financial Performance 68
University (Parent Entity) Financial Performance 72
Statement by Members of Council 79
Independent Auditor’s Report 80
Audited Financial Report 82
Notes to the Financial Statements 88
VOLUME TWO
Controlled Entities Audited Financial Statements
ITC Limited
Wollongong UniCentre Limited
University Recreation & Aquatic Centre Limited

02 University of Wollongong

2011 Annual Report 03
ThE UNiVErsiTy Of WOLLONgONg aT a gLaNcESince its inception, the University has awarded over 108,000 degrees and diplomas. As at December 2011, it had over 29,000 students enrolled at its onshore and offshore campuses, and attracts students from more than 140 countries.1 The University continues to actively forge links with the communities it calls home. It is a major driver of regional development and one of the largest non-government employers in the Illawarra region, with a total contribution to the regional economy exceeding $1 billion in 2011.
The University has active partnerships with nearly 300 other universities in research, teaching and exchange, as well as with major corporations, organisations and government bodies across the globe.
RESEARCh ThEmESUOW maintains 19 research strengths across five research themes:
• EnvironmentalSustainability• InnovativeMaterials,EngineeringandManufacturing• HealthandMedicalResearch• InformationandMathematicalSciences• Society,PolicyandCulture
For more information on UOW research activity, see page 24.
UOW in 2011Campuses: 8 Wollongong, Innovation Campus (North Wollongong), Shoalhaven, UOW Batemans Bay, UOW Bega, UOW Southern Highlands, UOW Southern Sydney, and Dubai Faculties: 9 Arts, Commerce, Creative Arts, Education, Engineering, Health and Behavioural Sciences, Informatics, Law, Science Graduate Schools: 2 Sydney Business School, Graduate School of Medicine Course Enrolments: 28,2492 Postgraduate: 8,781 Undergraduate: 19,244 Total Enrolments: 29,287 Non Award, Enabling and Cross Institution: 1,038 Equivalent Full Time Student Load (EFTSL): 21,609 International (onshore): 4,341 International (offshore): 3,117
OUR ViSiOnTo enrich people, communities and the environment by making original and creative connections across disciplinary, social and cultural boundaries.
OUR miSSiOnUOW is a comprehensive research and teaching university of international standing. We achieve our Vision through:
> Diversity in access and opportunity for all UOW students and staff> Excellence and sustained quality in research and teaching
programs, processes and graduate outcomes> Enterprise in shaping and realising new and emerging national and
international priorities> Partnership in innovation and the development of staff, students
and our communities
OUR PRinCiPlESWe share a commitment to promoting and celebrating:
> Excellence through initiative, enterprise and achievements that take society forward
> intellectual openness and freedom of opinion> integrity> mutual respect and collegiality> Diversity of cultures, ideas and peoples> indigenous perspectives and reconciliation> Foresight, quality and accountability as an institution> Community partnerships and mutual development> Equity and social justice> Responsible stewardship of the natural environment
The University’s Strategic Plan outlines the University’s goals, objectives and key strategies. The format of this report is primarily aligned with the goals, objectives and strategies of the University’s 2011–2013 Strategic Plan.
1 Figures are based on UOW data as at December 2011.
2 Figures based on UOW data as at December 2011. Total Course Enrolments incorporates Total Enrolments minus the number of Non Award, Enabling and Cross Institution Enrolments.
UoW 2011

04 University of Wollongong
VicE-chaNcELLOr’s rEViEWThe University of Wollongong has just marked the end of a special year in its history. In 2011, UOW celebrated its 60th anniversary with nostalgia and pride. It recognised the founders of a university presence in this region — the passionate community supporters, the ingenious, committed staff, and the bright, spirited students of the early years. It was a time to compare ‘then and now’ and to appreciate how those founding qualities helped to create the culture of this 21st century university with its international reach and recognition.
UOW’s transformation from a small, regional institution was guided by exceptional leaders who carefully ensured that its collegial culture was retained and nourished as it grew. In December 2011, the University community farewelled, with great affection, Professor Gerard Sutton, the Vice-Chancellor who had guided its remarkable growth for nearly 17 years.
During Professor Sutton’s term, the University grew to embrace a network of onshore campuses and a major international campus in the Middle East — the University of Wollongong Dubai (UOWD). On the basis of its research performance, UOW was ranked in the top two per cent of world research universities for over five years. It excelled against the key indicators of Learning and Teaching performance, holding its place in the top tier for ALTC citations and securing over a decade of five star ratings in the categories related to graduate outcomes in the Good Universities Guide. And, in an indicator that Professor Sutton considered of the highest importance, UOW out-performed the Australian university benchmark scores across all dimensions in the 2010 Your Voice workforce survey: UOW’s staff were keen and engaged.
This annual report for 2011 covers the last year of Professor Sutton’s time in office. It is a testament to his leadership and to the initiatives and quality of the University’s staff and students. It also highlights the challenges and opportunities that remain for 2012 and beyond.
In 2011, the Higher Education sector in Australia absorbed the impact of reforms, stimulated largely by changes in federal government policy but reflecting social, technological and economic trends, both here and overseas. The changes included a student demand-driven environment regulated by outcome standards, strengthened performance indicators, risk assessment and compliance.
UOW performed particularly well in a national quality improvement framework. In the first half of 2011, an audit by the then Australian Universities Quality Agency (AUQA) awarded the University 15 commendations (an unprecedented total at that time) and high praise for its learning and teaching and strong student outcomes. By year’s end, the University was readying itself for the introduction of the Tertiary Education Quality and Standards Agency (TEQSA) and its threshold standards, especially a revamped Australian Qualifications Framework. It marshalled efforts around curriculum management and delivery, and engaged in a third, inter-university benchmarking
uow 2011

2011 Annual Report 05
project to identify and establish standards of good practice. These benchmarking projects with the University of Tasmania and Deakin University have been recognised within the sector as exemplars of successful collaboration and effective methodology. The University also joined a number of partner universities in two major external projects that are geared to influence the development of Higher Education Standards, one on a Teaching Standards Framework and the other on External Moderation (central to assuring learning standards).
At the same time, UOW looked to the new challenges of meeting key government performance indicators and attracting students in a demand-driven system. Its approach was to focus and build on its established strengths in the diversity of intake and culture, quality programs, learning support and student experience. Two strategic projects, First Year Transition and Social Inclusion, progressed to action planning and funding initiatives. Their outcomes will help the University to attract and support all students, but particularly those from a Low Socio-Economic Student (LSES) background.
In research, the University performed well across major indicators for success in 2011. Research partnerships and collaborations were buoyant both nationally and internationally. To build on this success, the University concentrated on raising the quality of programs and outcomes, again through the characteristic UOW approach of investing in its people. It sought to nurture talent and open up prospects, particularly for early career researchers and higher degree research students. UOW also critically assessed its performance in the first Excellence in Research for Australia (ERA) assessment and launched significant projects that drew on another three of its signature assets: innovative technology, research management through areas of strength, and a University Library acknowledged nationally for its quality and staff expertise.
UOW is challenged now to realise more fully its potential to excel in national and international research contexts while retaining and enriching the spirit of enterprise, which is one if its hallmarks. That spirit was exemplified in 2011 in the official opening of the SMART (Simulation, Modelling, Analysis, Research and Teaching) Infrastructure Facility, a multidisciplinary national centre for infrastructure solutions. Enterprise continues to be showcased in the growing profile of the Innovation Campus (iC), which is home to a spectrum of university and business activities, including the world renowned innovative materials research teams and, as of 2011, the first fully commercial building whose tenants have links to UOW. However, for entrepreneurship and community outreach, the star ideas of 2011 were for iAccelerate and its incubator StartPad as innovation and development hubs to be centred at iC.
These hubs are prime examples of the University’s symbiotic relationship with its region, which was highlighted during the 60th anniversary celebrations. During 2011, the Illawarra region faced the
restructuring of its signature steel industry and consequent job losses. University members, including students, not only shared the experience but were an important part of the way forward. They worked in partnership, here and at the University of Waterloo in Canada, to develop the concept for iAccelerate, which includes a potential for creating significant numbers of jobs in the first five years of operation. This exciting proposal was matched by the very concrete expansion of UOW accommodation into the Wollongong CBD to revitalise its atmosphere and boost its economy. The University purchased the IBIS hotel and refurbishment was underway at year’s end to convert it to a student residence for over 144 students. In 2011, UOW made an overall economic contribution to the region of over $1 billion.
The University’s international activities are as critical for the development of its home community as they are for its profile as a leader in global education and research. UOW’s international students, for example, make an important cultural and economic impact. Working towards its international goal in 2011, UOW focused on recognition and quality, both on- and offshore. This will remain its prime motivation as it moves to build on positive levels of international student satisfaction and to draw on the cultural richness of its campus population to enhance the experience of all students. The University aims to recoup 2011’s slight drop in onshore international student numbers, as sector trends finally made an impact after being successfully held at bay. Its offshore presence strengthened in 2011, most notably through the continued growth and prestige of UOWD and the partnership with INTI Education Group and Laureate International Universities, a new venture which began in 2011 with the offering of programs in Kuala Lumpur and Penang. UOW also remained in the top ten Australian universities for the number of collaborative international research projects.
When I became Vice-Chancellor of the University of Wollongong in January 2012, I acknowledged a strong record of achievement guided by sound governance under the University Council and the Academic Senate. UOW’S culture is both collegial and enterprising, and its performance is driven by effective decision-making and robust financial management. As we enter our seventh decade and the next phase in our history, we are re-invigorating our strategic planning. We aim to realise, in full, our capacity to be a global educator and a recognised national and international research leader.
Professor Paul Wellings Vice Chancellor and Principal

January Following the devastating Queensland floods, Professor Gerald Nanson from the University’s School of Earth and Environmental Sciences warned that Australia’s red-brown soils were being lost forever. He said that the floods in Queensland raised important issues relating to how well Australia collects data that is vital for the accurate analysis of potential hazards, and how adequately our country understands, and therefore is prepared to deal with, extreme environmental events. Professor Nanson noted that we have one of the world’s most variable climates, and our climate and river gauging stations need to be operated for many decades, even centuries, in order to characterise and analyse such variable regimes.
The popularity of the annual Koori Kids Fun Day hosted by UOW’s Faculty of Commerce was there for all to see when numbers more than doubled the figures for 2010’s inaugural event. Dragons’ players, including Jamie Soward, Cameron King, David Gower and Dragons’ ambassador Wendell Sailor, attended to lend a hand. UOW and the St George Illawarra Dragons entered into a Memorandum of Understanding in 2010 to formally establish a partnership of mutual benefit for both organisations. The Koori Kids Fun Day activity reflects part of that strategic alliance.
February ‘Super Transit Man’ together with ‘Lois Laneless’ formed a dynamic duo to spearhead a new University of Wollongong ‘YDrive Campaign’ during Orientation Week for 2011 aimed at enticing students out of cars and into alternative modes of transport. The superhero campaign was targeted to engage and connect with the student population
during O-Week, rewarding those who avoid cars to travel on buses, trains and by bicycle.
UOW conducted its first Goodwill Hunting initiative aimed at helping students who have recently moved from home to access items for their own living quarters for free. The Movement Laboratory had many customers pass through its doors from students with young families to new international students and bright-eyed first years who all sorted through the piles of bric-a-brac, furnishings and appliances to find what they needed.
march A potential new vaccine to prevent shingles in older people was the first major clinical study to be conducted at the new Clinical Research and Trials Unit (CRTU) of the Illawarra Health and Medical Research Institute (IHMRI).
The official opening of the University of Wollongong’s new Language Centre represents a landmark in the continuing growth in language education at UOW. Centre Director, Professor Kerry Dunne, said that the University’s timely allocation of $2.4 million for the creation and fitting out of the Language Centre was a significant strategic investment in the future of language education.
April The University of Wollongong on 20 April announced that it had appointed Professor Paul Wellings as its next Vice-Chancellor. Professor Wellings, at the time Vice-Chancellor of Lancaster University in north-west England, would take up the appointment on 1 January 2012, succeeding Professor Gerard Sutton, who has been UOW’s Vice-Chancellor for the past 16 years.
may The University of Wollongong’s Innovation Campus (iC) was named the nation’s ‘Best Business and Industrial Park’. The prestigious award was announced at the Property Council of Australia’s Innovation and Excellence Awards gala dinner attended by more than 700 people at Sydney’s Darling Harbour on 14 May.
June Professor Alison Jones, who took up her appointment as the Dean of the Graduate School of Medicine in June, is an internationally recognised toxicologist as well as a general physician. Professor Jones also continues her role as a high-level advisor on acute public health toxicology incidents to NSW Health, WA Health and the Federal Department of Health and Ageing, as well as serving on a NSW Government advisory committee on air pollution.
July Chancellor Jillian Broadbent AO opened UOW’s newest facility, a three-storey creative arts teaching and research centre transformed from a worn out backstage space. Backstage Hope is the result of renovations to the University’s Hope Theatre (named after UOW’s first Chancellor, the Hon Robert Hope). The work of Graham Bell and Bowman Architects, the facility includes professionally equipped rehearsal and technical infrastructure for student theatre as well as studio and study spaces for postgraduate students.
06 University of Wollongong
highlights of 2011

August A University of Wollongong scientist whose research with new bionic materials provides hope for those suffering loss of nerve/muscle function, blindness, hearing loss or from epilepsy was named among a select group of Australian Laureate Fellows at a special function in Melbourne. The honour was bestowed upon Professor Gordon Wallace, who is Executive Research Director at the ARC Centre of Excellence for Electromaterials Science (ACES) and Director of the Intelligent Polymer Research Institute (IPRI), both of which are located at the Australian Institute for Innovative Materials (AIIM) Facility at UOW’s Innovation Campus.
September NSW Premier Barry O’Farrell said that the University of Wollongong’s Innovation Campus was a key to the diversification of the Illawarra regional economy during a visit to open the campus’ $40 million commercial building, iC Enterprise 1. Enterprise 1 is an innovative 10,000 square-metre building designed to house some of UOW’s most valued collaborative partners.
The Sir Nicholas Shackleton Medal for the most outstanding young Quaternary scientist — awarded only every two years — was presented to UOW scientist, Dr Zenobia Jacobs, at a ceremony in Switzerland. Dr Jacobs has contributed significantly to dating finds in the field, increasing our understanding of human effect on newly colonised areas and uncovering evidence of early human settlement in Africa.
October The appointment of the Pro Vice-Chancellor Research and Innovation and Dean of the College of Science and Technology at Salford University in the UK, Professor Ghassan Aouad, as the new President of the University of Wollongong in Dubai (UOWD) from 1 January 2012 was announced.
One of Australia’s most influential public policy experts, Dr Ken Henry (Secretary to the Commonwealth Treasury 2001–2011), was appointed as Chairman of the SMART Infrastructure Facility Advisory Council.
Prominent Australian social researcher and commentator, Hugh Mackay, joined the University of Wollongong as Professor of Social Science with the Institute for Innovation in Business and Social Research (IIBSoR).
november The University of Wollongong and Wollongong City Council joined to launch StartPad, a space to allow entrepreneurs to grow and develop ideas into successful businesses. Also supported by NSW Trade and Investment, RDA Illawarra and Enterprise Connect, StartPad will provide entrepreneurs with inexpensive accommodation, mentoring support, peer support and access to networks for people with ideas that they would like to see developed into businesses.
The University of Wollongong’s SMART Infrastructure Facility is destined to play a vital role in Australia’s future, Federal Infrastructure and Transport Minister Anthony Albanese said at its official opening on 11 November. Mr Albanese was officially opening the $62 million SMART (Simulation, Modelling, Analysis, Research and Teaching) headquarters, one of the largest infrastructure research facilities in the world.
NSW Governor Professor Marie Bashir (AC, CVO) described University of Wollongong Vice-Chancellor Professor Gerard Sutton as one of the jewels of the Illawarra and the Australian academic scene in a glowing tribute when she hosted a reception in his honour on the eve of his retirement.
NSW Premier Barry O’Farrell welcomed the University of Wollongong’s latest initiative to strengthen its ties with India. The University of Wollongong and Indian-Australian businessman Arun Jagatramka agreed to explore the potential establishment of a UOW presence in India.
December A new book ‘Regional Icon, Global Achiever’ was published to celebrate the University of Wollongong’s 60th anniversary and mark the end of Vice-Chancellor Professor Gerard Sutton’s era at UOW. The 152-page coffee table-style book, written by Nick Hartgerink, charts UOW’s evolution from a tiny divisional college to an autonomous university and a world-class institution.
UOW Vice-Chancellor Professor Gerard Sutton told a crowd of 400 well-wishers at his retirement dinner that he would be ‘leading the UOW cheer squad’ when he retires at the end of the month after almost 17 years in the role. Professor Sutton said he was excited about UOW’s future under incoming Vice-Chancellor Professor Paul Wellings.
Nowra’s Shoalhaven Entertainment Centre hosted an historic first graduation ceremony for almost 100 graduates from the University of Wollongong’s Shoalhaven Campus on 20 December.
2011 Annual Report 07

08 University of Wollongong
UNiVErsiTy gOVErNaNcE
Organisational Chart
Internal AuditReports to VC on IT matters
ACADEMIC SENATE
SENATE COMMITTEESUniversity Education Committee University Internationalisation CommitteeUniversity Research Committee
COUNCIL COMMITTEESAdministrative CommitteeAudit Management & Review CommitteeCeremonial & Honorary Awards CommitteeCouncil Committee of AppealCouncil Innovation Campus Oversight CommitteeCouncil Nominations CommitteeChancellor Robert Hope Memorial Prize Selection Committee
Advisory Committees
VICE-CHANCELLOR& PRINCIPAL
UNIVERSITY COUNCIL
· Dean of Research· Research & Innovation
Division- Research Student
Centre- Research Services- Innovation and
Commercial Research· Research Institutes &
Centres- SMART Infrastructure
Facility· Science Centre· University Research
Committee
· Faculties- Arts- Commerce- Creative Arts- Education- Engineering- Informatics- Law- Science
· Sydney Business School· Employment Equity &
Diversity (Operational Matters)
· Planning Services· Domestic Marketing &
Recruitment(within UniAdvice)
· Faculty of Health & Behavioural Sciences
· Graduate School of Medicine
· IHMRI
· International Services & Development Division- Transnational
Education & Alliances Unit
- Faculty International Support Unit
· International Marketing & Recruitment(within UniAdvice)
· Study Abroad & Exchange(within UniAdvice)
· Off shore Academic Programs- UOW Dubai- IRI Hong Kong- INTI Laureate Malaysia- Judicial and Legal
Training Institute (ILKAP) Malaysia
- Mass Transit Rail Authority (Hong Kong)
- PSB Academy Singapore- SIM Singapore
· University Internationalisation Committee
· Dean of Students· Academic Services
Division· Library· Woolyungah
Indigenous Centre· Strategic Planning &
Quality Unit· Regional Campuses· On-shore Teaching
Partnerships· Alumni & Community
Development(within UniAdvice)
· University Education Committee
· Academic Registrar’s Division
· Accommodation Services Division
· Administration Quality Assurance Unit
· Facilities Management Division
· Corporate Relations Unit· Human Resources Division· Innovation Campus· Performance Indicators
Unit
· Financial Services · Information
Technology Services
PROVICE-CHANCELLOR
(HEALTH)Professor Don Iverson
DEPUTYVICE-CHANCELLOR
(RESEARCH)Professor Judy Raper
DEPUTYVICE-CHANCELLOR
(ACADEMIC)Professor Rob Castle
DEPUTYVICE-CHANCELLOR(INTERNATIONAL)
Professor Joe Chicharo
VICE-PRINCIPAL(ADMINISTRATION) &
SECRETARY TO COUNCILMr Chris Grange
DEPUTYVICE-PRINCIPAL(FINANCE AND IT)
Mr Damien Israel
SENIOR EXECUTIVESENIOR DEPUTY
VICE-CHANCELLORProfessor John Patterson
uow 2011

2011 Annual Report 09
Committee Structure
University edUcation committee
administrative committee
University research
committee
aUdit management
and review committee
University international-
isation committee
AcAdemic SenAte
univerSity council
ceremonial and honorary
awards committee
coUrse approval
management groUp
academic senate standing committee
coUncil innovation
campUs oversight committee
stUdent awards
committee
coUncil committee of
appeal
academic review
committee
coUncil nominations
committee
academic staff development
committee
chancellor robert hope
memorial prize selection committee
Uow - Uow college board
of stUdies
other Key committeesacademic probation committeeacademic promotion committeecampus environmental management committeeinvestment advisory committeelibrary consultative committeeoccupational health and safety committeestudent conduct committeeUniversity workload committee
Advisory committees to the Vice chancellorbudget advisory committeecommunity engagement committeeemployment equity and diversity committeeinformation technology policy advisory committeeUniversity planning and Quality committee
Key Faculty committeesfaculty committeesfaculty advisory committeesfaculty assessment committeesfaculty education committeesfaculty executive committeesfaculty external course appraisal committeesfaculty investigation committeesfaculty research committeesfaculty workload committees
Uec subcommitteesUec chairs co-ordinating committee education policy review subcommitteelearning engagement and support subcommitteelearning environment and technology subcommitteestandards and Quality subcommitteeteaching excellence subcommittee
UIc subcommitteesinternational alliances committeeinternational student experience committee
URc subcommitteesUniversity research standing committee thesis examination committeeUniversity ethics policy committee
10 University of Wollongong
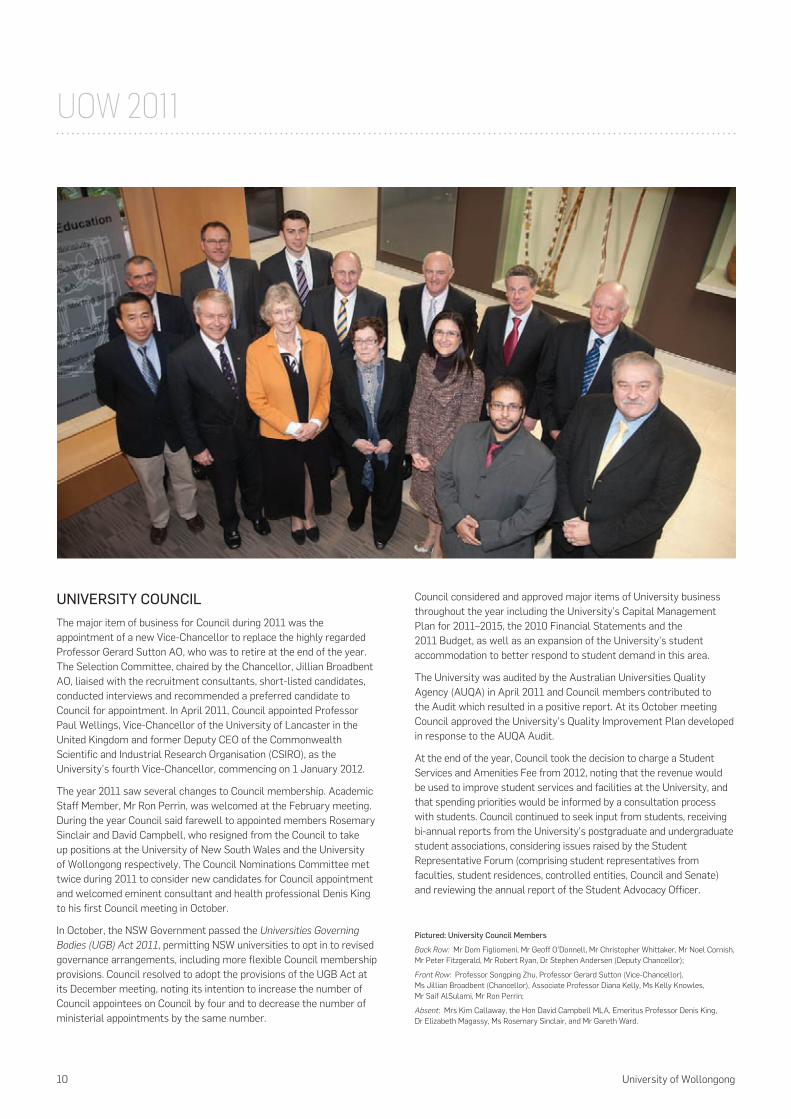
UniVERSiTy COUnCilThe major item of business for Council during 2011 was the appointment of a new Vice-Chancellor to replace the highly regarded Professor Gerard Sutton AO, who was to retire at the end of the year. The Selection Committee, chaired by the Chancellor, Jillian Broadbent AO, liaised with the recruitment consultants, short-listed candidates, conducted interviews and recommended a preferred candidate to Council for appointment. In April 2011, Council appointed Professor Paul Wellings, Vice-Chancellor of the University of Lancaster in the United Kingdom and former Deputy CEO of the Commonwealth Scientific and Industrial Research Organisation (CSIRO), as the University’s fourth Vice-Chancellor, commencing on 1 January 2012.
The year 2011 saw several changes to Council membership. Academic Staff Member, Mr Ron Perrin, was welcomed at the February meeting. During the year Council said farewell to appointed members Rosemary Sinclair and David Campbell, who resigned from the Council to take up positions at the University of New South Wales and the University of Wollongong respectively. The Council Nominations Committee met twice during 2011 to consider new candidates for Council appointment and welcomed eminent consultant and health professional Denis King to his first Council meeting in October.
In October, the NSW Government passed the Universities Governing Bodies (UGB) Act 2011, permitting NSW universities to opt in to revised governance arrangements, including more flexible Council membership provisions. Council resolved to adopt the provisions of the UGB Act at its December meeting, noting its intention to increase the number of Council appointees on Council by four and to decrease the number of ministerial appointments by the same number.
Council considered and approved major items of University business throughout the year including the University’s Capital Management Plan for 2011–2015, the 2010 Financial Statements and the 2011 Budget, as well as an expansion of the University’s student accommodation to better respond to student demand in this area.
The University was audited by the Australian Universities Quality Agency (AUQA) in April 2011 and Council members contributed to the Audit which resulted in a positive report. At its October meeting Council approved the University’s Quality Improvement Plan developed in response to the AUQA Audit.
At the end of the year, Council took the decision to charge a Student Services and Amenities Fee from 2012, noting that the revenue would be used to improve student services and facilities at the University, and that spending priorities would be informed by a consultation process with students. Council continued to seek input from students, receiving bi-annual reports from the University’s postgraduate and undergraduate student associations, considering issues raised by the Student Representative Forum (comprising student representatives from faculties, student residences, controlled entities, Council and Senate) and reviewing the annual report of the Student Advocacy Officer.
Pictured: University Council members
Back Row: Mr Dom Figliomeni, Mr Geoff O’Donnell, Mr Christopher Whittaker, Mr Noel Cornish, Mr Peter Fitzgerald, Mr Robert Ryan, Dr Stephen Andersen (Deputy Chancellor);
Front Row: Professor Songping Zhu, Professor Gerard Sutton (Vice-Chancellor), Ms Jillian Broadbent (Chancellor), Associate Professor Diana Kelly, Ms Kelly Knowles, Mr Saif AlSulami, Mr Ron Perrin;
Absent: Mrs Kim Callaway, the Hon David Campbell MLA, Emeritus Professor Denis King, Dr Elizabeth Magassy, Ms Rosemary Sinclair, and Mr Gareth Ward.
uow 2011

2011 Annual Report 11
Council’s annual review of its performance resulted in a number of improvement opportunities, which included tightening its financial management and reporting, and embarking on a review of the key performance indicators and the performance review arrangements for the Vice-Chancellor to coincide with the arrival of the new Vice-Chancellor.
A number of new and revised policies and rules were approved by the University Council during 2011 including:
> Environmental Policy> Undergraduate Student Scholarships and Grants Policy> Authorship Policy> Joint Doctor of Philosophy Agreement Policy> University Code of Conduct> Examination Rules> Public Interest Disclosure Policy> Children in the Workplace and Study Environment Policy> Research Data Management Policy> Sexual Harassment Prevention Policy> Delegations of Authority Policy
Regular reports were provided to the Council by each of its committees, including the Administrative Committee, Audit Management and Review Committee, Innovation Campus Oversight Committee, and the Ceremonial and Honorary Awards Committee. Council maintained strong relationships with the University’s subsidiaries (ITC, URAC and UniCentre) with Council receiving quarterly progress reports as well as budgets, business plans, financial statements and risk management information from each controlled entity.
Throughout the year Council received presentations from the Deans of Creative Arts, Engineering, Education, Law and the Sydney Business School about their respective faculties, together with presentations on the University’s International Strategy, Financial Benchmarking and its Excellence in Research Australia (ERA) results. Council was also briefed about emerging higher education policy and legislation, such as the newly conceived Tertiary Education Quality and Standards Agency and the Voluntary Code of Best Practice Governance for Australian Universities which was approved in 2011.
At the end of the year, Council bid farewell to departing undergraduate student member, Chris Whittaker, and graduate representative, Kelly Knowles. It also celebrated the contribution of outgoing Vice-Chancellor Professor Gerard Sutton both to the University as a whole and to the Council itself.
ACADEmiC SEnATEThe Academic Senate is the peak body advising the University Council and Vice-Chancellor on academic matters and broad issues affecting academic staff, students, scholarship, and the academic excellence of the University. A central role of Academic Senate is to evaluate, endorse and recommend policies to the Vice-Chancellor and to University Council.
During 2011, Academic Senate activities included:
• SignificantinvolvementintheAUQAaudit.• Policyendorsement:• RevisedAuthorship Policy• RevisedStudent Awards and Prizes Policy• RevisedHigher Degree Research Rules within the General
Course Rules• RevisedSexual Harassment Prevention Policy• Research Data Management Policy• RevisedJointDoctoral/Cotutelleprogram(Joint Doctor of
Philosophy Agreement Policy) and accompanying Guidelines• RevisedSupplementary Assessment Guidelines• RevisedExamination Rules• Undergraduate Student Scholarships and Grants Policy
• Notingofrecent'no-changepolicyreviews',suchasthoseoftheUniversity Archives Policy and the Library Code of Conduct.
• NotingofpoliciesrecentlyapprovedbyCouncilthatmayhaveanimpact on academic issues in the University, such as the UOW College Admissions Policy and UOW College Curriculum Review Policy.
• Endorsementofallofthe2011–13UOWManagementPlansandthe UOW Quality Improvement Plan 2011–2013.
• NotingoftheprogressandinsightsfromtheAssessmentBenchmarking Project with Deakin University and the University of Tasmania, and commencement of developing improvements. An original objective of this exercise was to determine the effectiveness of the Academic Senate (or Academic Board as it is known at Deakin) in initiating, developing, implementing, monitoring, ensuring good standards, and where needed revising policies for assessment of students’ work.
• EndorsementofmembershipprovisionsfortheAcademicStaffDevelopment Committee and Academic Probation and Academic Promotion Committees as well as nominees to the Academic Probation Committee and Academic Promotion Committee.
• ElectionofAcademicSenaterepresentativestoothercommitteesas needed.
• ApprovalofprizeproposalsfromtheStudentAwardsCommittee(appoximately 90 prizes).
• NotingandapprovaloftherevisedTermsofReferenceandmembership of the University Education Committee (UEC) and endorsement of the proposed restructure and Terms of Reference of the UEC Subcommittees, with changes to take effect from 1 January 2012.
• Approvalofmorethan20coursesasrecommendedbytheCourseApproval Management Group (CAMG).

12 University of Wollongong
In August, the Meet the Chancellor Reception was held in the foyer of the SMART Infrastructure Building, hosted by Academic Senate and attended by the Chancellor, Ms Jillian Broadbent AO. Over 80 academic and general staff members and students met with the Chancellor in a relaxed setting.
UOW was represented at all the national meetings of Chairs of Academic Boards and Senates, covering all Australian universities. The primary topics of debate related to increasing regulation of higher education in Australia, the ways in which these influenced on academic governance, and how Academic Boards and Senates might optimise their role and effectiveness in light of such changes.
Academic Senate’s priorities for 2012 include:
• Buildingonimprovedcommunicationandinformationsharingprocesses across the University.
• RedevelopingSenateinductionprocessesfurthersothatallmembers can feel comfortable when raising appropriate issues and conveying academic concerns.
• IncreasingthenumberofSenatemeetingsin2012to7.• IntroducinganewstandingitemontheAgendaforSenatemeetings
— Questions on Notice (directed to the Vice-Chancellor, Senior Executive and others as decided by the Vice-Chancellor), so that Senate members can obtain particular kinds of information.
• UndertakingamajorreviewofAcademicSenate,theobjectiveof which will be to explore the following question and develop apt recommendations: ‘What do we need to do to ensure that in 2017 Academic Senate will uphold and realise the academic ideals, standards, and objectives of the University, enable collegial communication across the University, and be effective, and efficient in developing, implementing and monitoring policy to ensure UOW scholarship and students’ academic experience are excellent by any measure?’
STRATEGiC PlAnninGThe 2011 Australian Universities Quality Agency (AUQA) Audit Report assessed and commended the UOW planning framework as it applied in 2008–2010 and found ‘clear evidence of effective cascading and alignment of goals’ with some room for improved engagement at faculty and school level. AUQA noted the enhancements introduced for the 2011–2013 planning cycle.
The 2011–2013 UOW Strategic Plan came into effect in January 2011. It was put into operation largely through enabling Management Plans under each of the five Strategic Goals: Student Learning and Teaching; Research Management; Engagement and Partnerships; International; and Staff.
Developed by the goal committees and approved by University Council, the annual Management Plans provide targets and strategies to achieve the University’s goals and meet key indicators of success. These aligned targets were included in the templates for faculty and professional unit planning and review during the year.
Reporting against the Management Plans was the basis for the annual review of performance in the latter part of 2011. Strategies and targets were adjusted as necessary for the following year.
Opportunities for engagement and communication during 2011 included the Planning Conference in July and the Planning Forum for Heads of Units in September. These activities were augmented by a quarterly planning and quality newsletter and a continually updated website that tracks environmental changes.
In the external context, the University’s strategic plan was necessarily the starting point for the 2011 Institution Performance Portfolio which was submitted to the Department of Education, Employment and Workplace Relations (DEEWR) and the Department of Innovation, Industry, Science and Research (DIISR). An agreed Compact was finalised in early 2012.
With a new federal regulatory system taking effect in 2012 and the arrival of a new Vice-Chancellor, the University’s priorities are to:
> Take advantage of an opportunity to refresh its strategic directions and enhance its profile
> Fine-tune its management planning and performance reporting in order to support its mission and meet new external demands
> Strengthen and embed aligned indicators and targets for faculty and unit planning and reporting
These developments will be managed through consultative processes and ongoing communication.
uow 2011

2011 Annual Report 13
gOaL 1: gradUaTEs EqUippEd TO LEarN, ENgagE aNd LEad iN sOciETy aNd ThE gLObaL WOrkpLacE
ObJECTiVES1. Graduates who embody the University’s Graduate Qualities2. Student access and quality transition support for the student
learning journey 3. Quality programs relevant to the evolving needs of students and the
community 4. High quality teaching
OVERViEW
In another entry to a long record of achievement, the AUQA Audit in 2011 recognised the University’s strong and innovative teaching culture and a learning environment that was valued by students.
As a testament to UOW’s continuing strength and depth of performance, the AUQA Panel made 13 of its impressive 15 commendations in the area of learning and teaching. The Good Universities Guide for 2011 also awarded the University five stars in learning and teaching categories of getting a job, positive graduate outcomes, graduate satisfaction, staff qualifications, staff-student ratios and generic skills. The University received four stars in the categories of graduate starting salaries and teaching quality. Six
Australian Learning and Teaching Council (ALTC) citations for outstanding contribution to student learning complete the picture of strong external recognition.
In the first year of the 2011–2013 Learning and Teaching Goal, UOW continued to embed Graduate Qualities and link them to assessment and learning outcomes. The work done to develop curriculum mapping was further advanced in 2011, supported by our initiatives to ensure programs were aligned with the Australian Qualifications Framework (AQF) by 2015 and to position the University in the emerging standards-based environment. Course design and management is being shaped significantly by these external developments. Student learning will be enhanced as planning comes to conclusion for the implementation of a new learning management system that will revolutionise student experience of learning. It will augment a strong teaching culture built on continuing efforts to support academics through training and development, to engage in scholarly work, to undertake peer review and to work more closely with professional bodies.
In the area of student access, the University is adjusting to new measures for identifying low socio-economic status (LSES) students. Initiatives to provide more opportunities for LSES students to study
ReVIeW: stUDent LeARnInG AnD teAcHInG

14 University of Wollongong
at UOW included the In2Uni program to support LSES students in secondary school, new equity scholarships, new mentoring and ambassador programs and Social Inclusion Projects Scheme funding for transition and support of LSES students in a range of settings.
UOW is committed to a focus on future performance, and on the challenges emerging from a more deregulated environment, from increasing student expectations, and from the LSES and standards agendas. To this end, the academic decision making structures of the University Education Committee were reviewed at the end of 2011 to allow it to plan and manage current and emerging challenges. Its agenda is to sustain UOW’s superior learning experience, where a coherent and contemporary curriculum is delivered by quality teaching staff.
2011 OUTCOmES UnDER STRATEGiC ObJECTiVES
1. Graduates who embody the University’s Graduate Qualities
The University of Wollongong is committed to developing graduates who are:
> Informed> Independent learners> Problem solvers> Effective communicators> Responsible
The University made significant progress in its efforts to strengthen the curriculum in 2011. Curriculum mapping was deployed across several faculties and will become an increasingly valuable tool in the design of good programs. It demonstrates how graduate qualities are embedded into programs down to the level of the subjects within the program. Supporting this work are new resources, such as a curriculum website on the University’s developing Focus on Teaching website.
Experiential learning is becoming a stronger feature of many programs, as a result not only of student demand but also its value as a part of a sound curriculum. Many more students should be able to participate as a result of planning during 2011 for a new zero credit point subject to be administered from Careers Central in 2012. This will build on the existing Global Certificate of Workplace Practice, a program commended by the AUQA Audit Panel in its 2011 report. The University recognises that further work is needed to develop international perspectives in the curriculum, building on project work undertaken in this area in 2011. The iConnect program, which encourages students to undertake a number of intercultural activities, was the subject of a successful pilot and is expected to be rolled out across faculties in 2012.
A new resource developed to improve support for intercultural group work experiences for students should be finalised in 2012. Ensuring group work is an effective and satisfying experience for students, the University is consulting with students and academic staff to gain a deeper understanding of what issues student face, and how the group work experience can be made into a more satisfying learning opportunity for students and staff.
2. Student access and quality transition support for the student learning journey
At the core of UOW’s Strategic Plan is a commitment to opening up opportunities to students from diverse backgrounds and providing strong support as they adjust to the experience of higher education. The University has positioned itself well to respond to the much greater focus on LSES student attraction and retention. The challenge became more pointed in 2011 when enrolments from LSES students ostensibly declined, a not unexpected result of Commonwealth Government changes to how such students are identified.
The AUQA Audit Panel commended the University for its success in the attraction and retention of students from equity groups in its 2011 report. The lessons learned from a pioneering benchmarking project on Academic Transition Support, undertaken in 2010 with the University of Tasmania, were analysed and converted into action plans by a dedicated Working Party in 2011. In a parallel strategic initiative, the Social Inclusion Working Party was established and the first round of Social Inclusion Projects Scheme allocated funding to support many important initiatives across the University that will support the LSES targets the University has set.
The In2Uni program was successfully launched and will become a critical part of the University’s work to support LSES students to transition from school to university. A stronger and more robust governance framework for scholarships that was introduced in early 2011 will enable the University to utilise scholarships more effectively in support of its LSES targets.
UOW remains committed to its satellite campuses, which provide an important point of access for LSES students living in the Shoalhaven, Eurobodalla and Bega Valley regions. A sign of this commitment was the decision in late 2011 to rename each of the former ‘education centres’ at Batemans Bay, Bega and Moss Vale as campuses of the University. The Shoalhaven campus was also proud to host its first ever formal graduation ceremony for students, held in Nowra in December 2011.
Pleasing evidence of growing student satisfaction with their overall student experience endorsed and rewarded UOW’s attention to this area. In 2012, the University will launch a substantial new transition support program called UOW Student Life. This program, while aimed at social transition, will be another step to supporting students to adjust to university life more quickly, and in turn to support their overall academic experience.
3. Quality programs relevant to the evolving needs of students and the community
The University continued to make strong progress in the areas of what we teach (curricula) and how we teach (pedagogy), in an environment characterised by changing regulatory requirements. Our course approval process has matured to deal more effectively with offshore course proposals. In 2011, an International Course Approvals Group was formed to appraise these course proposals in light of the unique issues that arise with offshore course delivery. The work undertaken will help the University manage the transition to the Australian Qualifications Framework (AQF) more smoothly. Faculty flagship programs were also under development in all faculties to support stronger links between teaching and research.
review: stuDeNt learNiNg aND teachiNg

2011 Annual Report 15
As an innovative practitioner, UOW has always recognised, that technology provides opportunity to revitalise how we teach as well as providing a means of meeting the expectations of our students. After considerable preparatory work, the University is positioned to commence implementation of a new Learning Management System. This system will provide many new opportunities for students to learn, and to interact with their teachers and with each other.
4. high quality teaching
In 2011, UOW sustained its very strong reputation for high quality teaching. It achieved five stars in the Good Universities Guide for staff qualifications, and four stars for teaching quality. Changes to the University Learning and Teaching Course (developed throughout 2011) were designed to support greater uptake of this highly regarded program for new teaching academics. The AUQA Audit Panel commended the University for its ongoing work to improve quality assurance and support of sessional teaching staff. Faculty induction and support programs for sessional teaching staff are continuing to mature.
Our academic governance framework continues to evolve to support enhanced learning and teaching practice. Work to deliver new grades of performance was completed in 2011, is ready for implementation in 2012. A new policy on academic advice for students has been deployed and a review of complaints policies is being finalised. The outcomes of a major review of examination policies in 2011 is also due to be implemented in 2012 to streamline processes and ensure fairer and more rigorous exams.
The commendations received from the AUQA Audit Panel for the integrated quality assurance framework and for effective implementation of the key Code of Practice — Teaching and Assessment are signals of strength in this area.
The new structure for the University Education Committee (UEC) will ensure that its portfolio is better aligned with current and emerging issues in Learning and Teaching, including the standards agenda (through a new Standards and Quality Subcommittee) and the implementation of the new Learning Management System (through the new Learning Environment and Technology Subcommittee).
PRiORiTiES FOR 2012
With leadership from a revitalised UEC, the University plans to:
> Utilise curriculum review to support further embedding of Graduate Qualities, and as an adjunct to ensuring alignment with the Australian Qualifications Framework
> Establish greater opportunities for students to undertake experiential learning
> Establish the iConnect program as a University-wide program for students
> Deliver improved group work resources > Through the UOW Student Life program, support an improved
student experience, particularly in the area of student transition to university life
> Consolidate programs to improve social inclusion through scholarships, mentoring, ambassadorship and new pedagogical approaches
> Roll out a comprehensive transitions strategy
> Implement the preferred Learning Management System for the University
> Continue to implement the outcomes of the Assessment Working Party to improve assessment practice
> Enhance the University Learning and Teaching Course, through greater course flexibility
> Implement a new academic governance structure for the University Education Committee to support focus on key strategic challenges in learning and teaching
> Complete a review of the University’s Admissions and Advanced Standing Policy, General Course Rules, Academic Grievance Policy (Coursework and Honours Students) and Academic Grievance Policy (Higher Degree Research Students)
STUDEnT PROFilE
Table 1: Student Enrolment (by Degree/Award) 2007–2011
Degree/Award 2007 2008 2009 2010 2011
Higher Degree and Masters
6113 6366 7197 7596 7474
Other Postgraduate 1123 1139 1257 1333 1307
Bachelor Degree 14741 15706 16762 18008 19244
Sub-Degree 134 194 233 270 224
Non-Award, Enabling and Cross Institutional
1060 1008 1165 1824 1038
Total 23171 24413 26614 29031 29287
Table 2: Student Population (by mode of Study) 2007–2011
mode of Study 2007 2008 2009 2010 2011
Full-Time 13175 16489 14340 15557 21610
Part-Time 9666 7465 11734 12771 6837
External 330 459 540 703 840
Total 23171 24413 26614 29031 29287
Table 3: Student Enrolment (by Age) 2007–2011
Age 2007 2008 2009 2010 2011
<21 5104 5993 6442 7039 7301
21–25 10588 10946 11716 12753 12887
26–29 3191 3128 3617 4022 3774
30–39 2578 2590 2792 3032 3093
40–49 1169 1214 1210 1319 1297
>49 541 542 837 866 935
Total 23171 24413 26614 29031 29287

16 University of Wollongong
Table 4: Domestic Onshore Enrolment (by home Region) 2007–2011 (percentage)
home Region 2007 2008 2009 2010 2011
Illawarra 51.5 51.8 50.9 51.9 50.02
Sydney 35.6 35.5 34.3 35.0 34.7
Other NSW 9.9 10.7 10.7 9.6 11.48
Interstate 3.0 2.0 4.1 3.5 3.8
Total 100 100 100 100 100
Source: Tables 1–4 University of Wollongong data as at 31 December 2011
REGiOnAl CAmPUSES
Table 5: Enrolments at Regional Campuses 2007–2011
Campus /learning Centre
2007 2008 2009 2010 2011
Shoalhaven 301 384 448 586 578
UOW Batemans Bay 86 100 137 149 145
UOW Bega 130 150 141 152 155
UOW Southern Highlands
97 96 104 102 118
UOW Southern Sydney 290 255 271 281 426
Total 904 985 1101 1270 1422
Table 6: new Enrolments at Regional Campuses 2007–2011
Campus / learning Centre
2007 2008 2009 2010 2011
Shoalhaven 160 191 208 282 248
UOW Batemans Bay 42 47 61 75 58
UOW Bega 53 63 63 69 60
UOW Southern Highlands
42 39 39 34 45
UOW Southern Sydney 113 73 134 149 224
Total 410 413 505 609 635
There was strong interest from the local communities in the programs at the University’s regional campuses during 2011. Most regional communities have set up joint community-based committees with a youth and education focus and the University is a member of these committees. Outcomes from this involvement include an enhanced standing in the local communities and an increased awareness of our programs and of the benefits we bring to individuals and to the economies of these regions. The University has continued to work closely with its local partners at each site, in particular with TAFE NSW and the various local councils.
Shoalhaven Campus
Students enrolled at the Shoalhaven Campus were among the first group of the University’s Medical School to graduate with a Bachelor of Medicine Bachelor of Surgery, an historic milestone for the regional campus. A number of the graduates will take up positions locally and in other regional parts of NSW.
Shoalhaven Campus also saw the first group of Nursing students obtain their Bachelor of Nursing degree. Over 30 graduate nurses have taken their place in local hospitals, aged care facilities and health clinics, providing a much needed boost to the pool of available health care workers. Nursing continued to attract strong enrolments and the students at Shoalhaven performed well, obtaining results equal to those of Wollongong students.
UOW bega
The Bega Campus enrolments in Nursing and Education continued to be strong, with the focus on employment outcomes being attractive to students in the region. Enrolments in the Arts and Commerce programs weakened and there needs to be a refocus of our marketing activities to promote the benefits of these degrees.
UOW batemans bay
Extension work at the Batemans Bay Campus was undertaken during 2011 and is due for completion in early 2012. The expansion at Batemans Bay has allowed for the inclusion of a Clinical Simulation Laboratory suitable for delivery of a Nursing program, and the School of Nursing and Midwifery has started the process of seeking approval from the national nursing accreditation body to offer the program at Batemans Bay.
Overall enrolments in degrees offered at Batemans Bay were consistent and performance of students was strong.
UOW Southern Sydney
The year 2011 saw the first full intake of Nursing students at Southern Sydney. The Campus refurbishment included the installation of a modern simulation laboratory for the Nursing program and the addition of the latest video conferencing and interactive whiteboard technologies enhanced the general teaching spaces.
Enrolments in the Commerce program were strong, with many of the Sutherland students enrolled in this program indicating their appreciation of the opportunity to undertake their studies at Wollongong University without having to leave their local area.
UOW Southern highlands
Over 20 students completed degrees in Arts and Commerce in 2011, making this the largest group of graduating students since the campus commenced operation in 2003. Students at our Southern Highlands Campus continued to perform well across both degree programs on offer.
review: stuDeNt learNiNg aND teachiNg

2011 Annual Report 17
TRAnSnATiOnAl EDUCATiOn (OFFShORE) PROGRAmSUOW currently delivers transnational education (TNE) (offshore) programs in a number of locations, providing opportunities for students to gain a UOW degree in their home country. This includes a campus in Dubai (University of Wollongong in Dubai), two major TNE partners in Singapore, an increasingly important collaboration in Malaysia with INTI International Colleges (a member of the Laureate Group of International Universities), and Hong Kong.
The delivery model in these locations varies from having highly qualified adjunct teaching staff located at these locations teaching all of the academic programs through to our own UOW academic staff
flying into a location for an intensive delivery (usually between 5 and 10 days per subject) with support by either partner institution adjunct teaching staff or UOW e-learning platforms for the remainder of the academic semester.
Arrangements for the delivery of offshore programs are governed by formal contracts of collaboration between UOW and partner institutions. Agreements include clear provisions for the teaching, assessment and moderation of subjects, strong and ongoing quality assurance provisions, the facilities and services that must be provided to students at the offshore locations, and the promotion and advertising of programs in the country of delivery and anywhere else in the world where the programs are promoted.
Table 7: Transnational Education Programs 2011
institution Course Discipline
Dubai
UOWD Master of International StudiesMaster of Media and Communications
Arts / Creative Arts
Bachelor of Business AdministrationBachelor of CommerceGraduate Certificate of Forensic AccountingCertificate in Islamic Commercial and Investment BankingCertificate in Fundamentals of Islamic Banking and FinanceMaster of Business AdministrationMaster of International BusinessMaster of Quality ManagementMaster of Strategic MarketingMaster of Strategic Human Resource ManagementMaster of Applied Finance and Banking
Commerce / Sydney Business School
Bachelor of EngineeringMaster of Engineering Management
Engineering
Bachelor of Computer ScienceBachelor of Computer Science in Digital Systems SecurityBachelor of Computer Science in Multimedia TechnologyBachelor of Information Technology in Management Information SystemsBachelor of Internet Science and TechnologyMaster of Information Technology Management
Informatics
Master of Science (Logistics) Science
hong Kong
IRI Hong Kong Bachelor of Nursing (Conversion)Master of Nursing
Health & Behavioural Sciences
Mass Transit Rail Authority Master of Asset Management Engineering
indonesia
INTI College Indonesia Bachelor Computer Science Informatics
malaysia
INTI College Sarawak Bachelor Computer ScienceBachelor of Computer Science (Digital Systems Security)
Informatics
INTI College Subang Jaya Bachelor of Communication and Media Studies Arts
Bachelor of Commerce Commerce
Bachelor of Information TechnologyBachelor of Computer ScienceBachelor of Computer Science (Multimedia & Game Development)
Informatics

18 University of Wollongong
INTI College Penang Bachelor of Computer Science Informatics
Judicial and Legal Training Institute (ILKAP)
Graduate Certificate in Law (Prosecutions)Graduate Diploma in Law (Prosecutions)Master of Laws in Prosecutions
Law
Singapore
PSB Academy Part-time Programs:Bachelor of Commerce (Supply Chain Management)Bachelor of Commerce (Marketing)Full-time Programs:Bachelor of Commerce (Supply Chain Management)Bachelor of Commerce (Finance)Bachelor of Commerce (Management)Bachelor of Commerce (Public Relations)Bachelor of Commerce (Marketing)
Commerce
Singapore Institute of Management (SIM)
Bachelor of Information Technology (Computing)Bachelor of Computer Science (Digital Systems Security)Bachelor of Computer Science (Multimedia and Game Development)
Informatics
Bachelor of Science (Psychology) Health & Behavioural Sciences
Table 8: Offshore Student numbers 2007–2011
year 2007 2008 2009 2010 2011
Total offshore student numbers 3920 4420 4447 4430 5092 highlights of 2011
• ThesuccessfullaunchoftheBachelorofScience(Psychology)in Singapore in collaboration with the Singapore Institute of Management (SIM), the country’s premier private education provider complementing our existing computer science programs with SIM.
• ThesuccessfulexpansionoftheINTI-Laureatecollaborationin Malaysia from Subang Jaya to Penang with the running of the Bachelor of Commerce. One of the many strengths of the collaboration is the Laureate Group’s strong emphasis on student outcomes including employer outreach and internships programs for our students, complemented by UOW’s own academic value adds including the running of our highly successful Peer Assisted Study Sessions (PASS) program.
• Strongstudentnumberprogramgrowthacrossallourlocationsand partners (Dubai, Singapore, Malaysia and Hong Kong).
libRARy
learning and Teaching
Within the context of an environment underpinned by networked online resources, advanced discovery platforms and a wide array of face-to-face and online support services, a critical evaluation of how information skills support can be delivered more effectively and efficiently was conducted. Throughout the year efforts were made to streamline and consolidate multiple face-to-face interactions, shift the primary delivery mechanism for information skills support (i.e. classroom based) to web-based delivery via a number of contextualised tools, and balance large lectures with some niche targeted face-to-face sessions.
In recognition of the rising popularity of smart phones and other hand-held devices used by students and staff alike, a mobile interface was created for the Library website, providing convenient links to high use services. Netbooks were added to the fleet of loanable laptops and an online, real-time computer availability service was implemented to aid way-finding and access to technology. Eight new group study rooms increased the number of bookable rooms to 17; which were used 21,094 times.
Resources
Much was done to enhance access to information resources in 2011. The introduction of BONUS+, an Australasian resource-sharing scheme, enabled access to over 6 million items for students and staff, augmenting the half million volumes owned by the Library. Since its launch mid-year, 2,538 items were delivered to students and staff. The continued strong performance of the Australian dollar enabled the ongoing purchase of electronic back-files of quality journals and ebook collections ensuring technology-rich access to comprehensive and diverse information sources, independent of the physical building. Early forays with ebook reader platforms commenced with four Kindles — each loaded with 40 titles — being made available for loan.
review: stuDeNt learNiNg aND teachiNg

2011 Annual Report 19
Value and impact
Negotiations with vendors for improved Alumni membership benefits succeeded in securing access to additional databases, covering a broad range of disciplines. International students continued to rate the Library highly, as evidenced through the International Student Barometer Survey with satisfaction ratings surpassing global and national benchmarks.
A notable breakthrough in understanding the Library’s value and impact was the creation of the ‘Library Cube’, a result of an innovative and collaborative research project conceptualised within the Library and delivered through the University’s Performance Indicators Unit. The ‘Library Cube’ is a data warehouse linking student use of Library owned and subscribed resources to their academic grades and demographic information. Findings are revealing in that a strong positive correlation between use and grades has been found. The data will be of immense benefit not just to the Library but to all stakeholders with a vested interest in supporting student success.
Figure 1: library Consultations by Client Group 2011
Coursework students
HDR students
Staff (L&T)
Academic Outreach
155
256546
553
Figure 2: international Student Satisfaction with library services
100%
95%
90%
85%
80%
75%
70%
65%
60%
55%
50%
Global ISB
Australia ISB
UOW ISB
Online library
benchmark comparisons
Physical library
Source: International Student Barometer Survey (2011)
Research
In 2011, the Library enhanced the University’s capacity to support its research endeavours through several initiatives. The Academic Outreach program shifted in focus to better understand the needs of researchers during the various stages of the research cycle. Over 540 Academic
Outreach consultations took place, providing a wealth of data and information to guide the development of future services and resources. The consultations also provided a catalyst for over 200 requests for support in loading research outputs onto the institutional repository. The number of outputs loaded to the repository totalled 2,386, a 75 per cent increase compared to 2010. Downloads from Research Online totalled 872,589, an increase of 20.5 per cent on the previous year.
Staff contributed to assessment and understanding of institutional research productivity and global benchmarked performance through the interrogation of sophisticated bibliometric and citation analysis tools. A number of highly customised reports were prepared for the University Executive. The UOW Datawise initiative for the identification, capture and discoverability of research datasets was sustained following project completion through the continued identification and sourcing of research datasets for lodgement into Research Data Australia (RDA). A total of 39 datasets were loaded to the institutional repository to seed RDA.
Figure 3: Uploads to Research Online 2009–2011
2,000
1,500
1,000
500
0
2009 2010 2011
Figure 4: Downloads from Research Online 2009–2011
1,000,000900,000800,000700,000600,000500,000400,000300,000200,000100,000
0
201120102009
STUDEnT REPRESEnTATiOn AT UOWThroughout 2011 student representatives were closely involved with the governance and operation of the University. The undergraduate and postgraduate representatives on the University Council and Academic Senate play a crucial role in maintaining a strong voice for student concerns at the highest levels of the University. Similarly, the undergraduate and postgraduate student associations (WUSA and

20 University of Wollongong
WUPA) remained active in assisting students regarding welfare, equity and academic support.
The Student Advocacy Officer continued to play an important role in representing students and assisting students in need in complex personal and academic circumstances. The number of cases increases each year, as does the complexity of those cases.
Representatives from the University Council, Academic Senate, WUSA, WUPA, Faculties, student clubs and societies took part in two Student Representative Forums in April and September. For the first time, student representatives from University colleges and residences were elected to participate in the 2011 Student Representative Forums.
The April Student Representative Forum discussed issues relating to eLearning, social media, and IT access. Student representatives were closely involved with the evaluation process for the selection of a new eLearning provider. At the September Student Representative Forum, representatives discussed the quality assurance programs in place to ensure the high quality of the University’s offshore programs. Also discussed were programs under development to improve assessment feedback and staff-student communication.
During September and October, elections were held for 2012 representatives on the University Council, Academic Senate, and the student associations. The elections were contested in good spirit and the level of undergraduate voter participation was considerably greater than in previous years, reflecting a resurgence of enthusiasm and engagement for student representation and participation.
In November, a University-wide student consultation process commenced to find out what UOW students would like the University’s spending priorities to be in relation to Student Services and Amenities Fee revenue. Submissions from all students are being collated and will be analysed by the Student Representation Forum in 2012 before recommendations are submitted for approval by the University Council.
STUDEnT CEnTRAlOver the past six years, Student Central has established itself as the main service centre for UOW and is the primary communication point for students with administrative enquiries.
Student Central prides itself on providing students with prompt and reliable information. The service centre has evolved over the last few years and through a recent restructure and refit now also hosts the Scholarships and Student Compliance teams.
2011 has seen a focus on student feedback with a number of strategies implemented to increase student feedback. This included the ‘Staying Connected’ project, which was an initiative to survey all undergraduate first year students by phone about their current UOW experience. The program was well received with an average of over 79 per cent of students contacted across both Autumn and Spring Sessions.
Student Central had an increased volume of traffic across its three main service points, with over 100,000 enquiries taken across the counter, phone and email. Phone volume increased by 16 per cent to just over 28,000 calls. Counter volumes also increased by 7 per cent to 65,000 interactions whilst emails remained stable at 9,000 enquiries.
Student Central looks forward to the new challenges 2012 brings, and will be undertaking projects involving fees, compliance and scholarships.
ACCOmmODATiOn SERViCESAccommodation Services offers supportive, secure and sustainable residential communities and advice on housing alternatives.
Application Trends
As in previous years, the demand for student accommodation in 2011 continued to exceed the number of beds available in University-managed accommodation with over 2,200 applications for 1,400 beds. We aim for a balanced community in each of the eight sites that we operate, and in 2011 there was a balance of gender, first year and older students across the residences. The decline in international student demand for UOW was also felt in the residences with a slight dip in international students in residences.
managing high Demand
In recognition of the growing demand, Accommodation Services assisted students by providing advice on other accommodation options for 2011.
The Housing Officer continues to offer a high level of support to students seeking rental, share or other types of living options. An additional focus has been through the Accommodation Services website with ‘studystays’, an online property listing service tailored to the student market, now available to UOW students. This service secured an additional 146 listings, showing a growth of 46 per cent since 2009. Studystays can also be used by staff and provides comprehensive information on properties that are available for rental or share accommodation in the area.
Accommodation Services formed an affiliation with Wollongong Surf Leisure Resort (WSLR), where overflow students were placed on a temporary basis until accommodation could be found for them in the residences. Students at WSLR had the opportunity to join in the Campus East community through social programs and having access to the dining room.
Expansion
Accommodation Services was successful in the purchase of the former IBIS hotel and launched the property as Marketview in December. Marketview operated as a hotel from December 2011 to January 2012 in support of the Wollongong tourism industry. From February 2012 Marketview commenced operating as a student accommodation residence. This added another 144 student beds to the offering.
The development of the new student accommodation block near the existing on campus Kooloobong apartments also commenced in 2011. This significant expansion will add another 360 beds in self-catered units to Accommodation Services. The $42 million project will alleviate the student housing shortage and will contribute a positive element to the student experience.
review: stuDeNt learNiNg aND teachiNg

2011 Annual Report 21
3 Success is a measure of academic performance. The success ratio is calculated by dividing equity group students’ progress rate by the rate of all other domestic students. A success ratio of 1.00 indicates that the equity group is performing at the same level as the benchmark population.
4 Retention is the number of domestic equity students who re-enrol at an institution in a given year, as the proportion of students who re-enrol at an institution in a given year, as a proportion of students who were enrolled the previous year, less those who completed their course. The retention ratio is calculated by dividing domestic equity group students’ retention rate by the apparent retention rate of all other domestic students. A retention rate of 1.00 indicates that the equity group is performing at the same level as the benchmark population.
Awards and Recognition
Staff in Accommodation Services were recognised with a number of awards during 2011, including:
> The International House Team led by Student Residence Manager Alison Hemsley was awarded the 2011 Vice-Chancellor’s Team Award for Excellence in Community Engagement
> GrahamHynardreceivedtheVice-Chancellor'sAwardsforOutstanding Service for General Staff
> Accommodation Services was recognised by the NSW Premier and received the 2011 National Multicultural Marketing Awards – Government for its Global Highway festival
Community Events
The combined residence events continue to be a highlight for students living within UOW residences and are important in bringing students together from across the residences to meet and learn from each other. Events such as the International Food Fair, the Interhalls Ball, and an inter-residence sporting competition were available to all residents and attracted an enthusiastic response. Global Highway is now the flagship event on the UOW calendar and in 2011 had the most stalls ever participating. It was also recognised at the 2011 National Multicultural Marketing Awards (see above).
The residences ran a wide range of fundraising events which supported a number of local and well-known charities. Weerona College raised in excess of $10,000 for charity in 2011 through their ‘Think Pink Breakfast’, ‘Girls Night In’ and a range of other events.
Students from International House were awarded USD10,000 as part of their proposal for the Davis Projects for Peace 2011. The US project is in its fifth year and this was the fourth consecutive year that students from International House have been awarded funding.
Students living at UOW residences continue to rate their level of satisfaction with student life and well being highly (93 per cent in 2011, Living@UOW Student Accommodation Survey) and tend to outperform their peers in academic scores and degree completion.
inDiGEnOUS STUDEnTS AT UOW
Woolyungah indigenous Centre
The Woolyungah Indigenous Centre is the central University hub for Indigenous student access, recruitment and support activities. It is the centre for University engagement with the Indigenous communities in the wider UOW catchment areas.
The Centre’s aim is to attain a high level of access and educational achievement for Aboriginal and Torres Strait Islander people, through sustained engagement with their communities, with particular attention to the local and regional communities of the Illawarra, Shoalhaven and far South Coast.
In 2011 the Woolyungah Indigenous Centre provided UOW Indigenous students with:
> Academic advice and mentoring> Learning and leisure facilities
> Indigenous Tutorial Assistance Scheme> Cultural and social support> Scholarship, career and cadetship information> Student leadership opportunities
Table 9: indigenous Student Success 2006–20103
2006 2007 2008 2009 2010
UOW 0.98 0.93 0.93 0.85 0.91
NSW 0.85 0.85 0.86 0.84 0.86
Australia 0.77 0.79 0.79 0.79 0.81
Table 10: indigenous Student Retention 2005–20094
2005 2006 2007 2008 2009
UOW 0.90 0.85 0.94 0.98 0.91
NSW 0.85 0.86 0.84 0.89 0.87
Australia 0.81 0.82 0.79 0.83 0.79
Woolyungah highlights of 2011
• InJulytheSeniorDeputyVice-Chancellorchairedareviewtoassess the structure, management and staffing of Woolyungah Indigenous Centre in light of the proposal to transfer the Indigenous Studies Undergraduate Program from Woolyungah Indigenous Centre to the Faculty of Arts.
• Thereviewcommitteeendorsedtherevisedfocusthatcanbroadlybe expressed under the following headings: Access, Recruitment, Support and Community Relations — both internal and external to the University.
• AnewandexpandedstaffingstructureheadedbyaSeniorManagerwas endorsed and is in the process of being implemented.
• TheIndigenousStudiesUnit(ISU)wasestablishedintheFacultyof Arts. The Faculty, through the ISU, assumed responsibility from the Woolyungah Indigenous Centre for the Indigenous Studies Undergraduate Program and for the development of postgraduate training and research in Indigenous Studies in the University.
• TheCentrebuildingwasrenovatedtoprovidemoreflexibleaccommodation for support and administrative staff.
• TheCentreprovidedtheEldersinResidenceprogramwithofficeaccommodation.
• TheAlternativeAdmissionProgramwasreviewedandre-organisedto better coordinate with University enrolment times. Under the new arrangement a successful Alternative Admission Program was conducted in November. In total 46 prospective students completed the program and 44 were offered places in undergraduate or enabling programs.

22 University of Wollongong
• IndigenousstudentsattendedtheNationalIndigenousTertiaryEducation Student Games at the University of Melbourne in October.
• TheCentretooktheleadingroleintheUniversity’scelebrationofReconciliation Day and NAIDOC Week.
• Atotalof42IndigenousstudentsgraduatedfromtheFacultiesofArts, Commerce, Creative Arts, Education, Engineering, Health and Behavioural Sciences, Law and Science.
Table 11: indigenous higher Education Performance 2006–2010
2006 2007 2008 2009 2010
indigenous Student Access %
UOW 1.10 1.18 1.22 1.57 1.61
NSW 1.22 1.33 1.30 1.43 1.55
Australia 1.49 1.51 1.58 1.63 1.59
indigenous Student Participation %
UOW 1.00 0.94 1.10 1.25 1.41
NSW 1.09 1.15 1.14 1.23 1.31
Australia 1.25 1.29 1.29 1.35 1.35
PEER lEARninG AnD TRAnSiTiOn
Peer Assisted Study Sessions
In 2011, over 5,500 participants took part in the voluntary Peer Assisted Study Sessions (PASS) Program at UOW, an increase of 21 per cent from 2010. The program has now been operating for ten years and is the flagship student support program at UOW, delivering multiple benefits across transition, retention and student learning. The year 2011 also saw PASS awarded its second Commendation by AUQA. In 2011, PASS supported 59 subjects at the Wollongong Campus and 15 subjects at regional campuses. As PASS improves academic progress and retention of students, it was on offer, in addition to multiple first year subjects, to increased numbers of second year and postgraduate subjects, particularly those which had large numbers of international students transitioning to UOW. Demonstrated benefits for international students who participated in PASS continued, with 97 per cent of international students confirming PASS had assisted with improving their understanding of subject content and 95 per cent strongly agreeing it had assisted them in forming social connections (Spring Semester PASS Survey, 2011). Ongoing analysis of the PASS participation of students from a low socio economic background indicates that these students are more likely to attend PASS and to attend more regularly. As always, the focus of the ‘super group’ learning PASS provides for all participants was the consolidation of lecture content integrated with the development of discipline specific study strategies and skills.
In 2011, UOW continued its role as the National Centre for PASS. This involved training staff from other institutions and providing leadership in the field of peer learning in the Asia/ Pacific region. The National Centre has now trained over 350 staff from nearly 50 institutions
in Australia, New Zealand, Malaysia, Fiji and Hong Kong since commencing the role in 2005. In 2011, PASS staff delivered onsite accredited training to a large cohort of staff from INTI International University in Malaysia and in Auckland to staff from multiple New Zealand institutions. They also delivered invited presentations at a number of national and international conferences as well as hosting the 7th PASS National Forum in Sydney. This forum attracted 175 practitioners from 27 institutions in the region. UOW PASS, for the fourth consecutive year, was again successful in the National PASS Leader Awards for Outstanding Contribution to Peer Learning. The PASS National Trainer and Director of Student Support and Peer Learning, Sally Rogan, became the first Australian to be invited to join the Advisory Board of the US National Resource Center for First Year Experience and Students in Transition. In 2011, the Journal of Peer Learning, published by UOW PASS in collaboration with staff from the University of Melbourne, Monash University and Griffith University, published its 4th edition and was awarded a Special Recognition for Contribution to the Field of Peer Learning by the International Center for PASS/SI in the USA.
First year at UOW Website
In 2011, as a part of the Peer Learning & Transition team’s ongoing commitment to the successful transition of UOW students, a major benchmarking activity and upgrade project was completed for the First Year at UOW website. The website aims to support the student experience and transition of UOW students, particularly during their first semester of study. The site can be found at http://www.uow.edu.au/student/services/fye/.
STUDEnT SUPPORT
Counselling, Disability, Equity and Diversity Support
UOW was awarded second highest achiever over five consecutive years (2006 to 2010) by the DEEWR in the category ‘Students with a disability – success and retention’ across the 38 Table A Australian universities. Disability Services had 422 new registrations in 2011. There has been an approximate 30 per cent increase in new Disability registrations each year for the previous four years. In 2011, 909 students were registered with the Disability Service. Registered students represented every faculty, regional campuses and UOW College Services and programs. Services provided included assistive technology, alternative exam arrangements, casual support staff (comprising facilitators and note takers), mentor programs, an Independent Learning Skills Program and accessible formats for learning. A total of 234 currently or previously registered students graduated in 2011. Disability staff had an ongoing, active involvement in the formation of the University of Wollongong Disability Action Plan 2011–2015 (DAP). Disability service provision was also improved with the establishment of three full-time continuing Disability Liaison Officer positions.
In Counselling Services, increased staffing levels enabled the appointment waiting time to be reduced from approximately 10 days (in 2010) to either the same day or the following day (in 2011). Counselling staff provided in excess of 4,120 contact hours in 2011, assisting UOW and UOW College students and staff. Counselling services were
review: stuDeNt learNiNg aND teachiNg

2011 Annual Report 23
available at all regional campuses and the Sydney Business School (SBS) in addition to the main campus. The majority of the assistance was provided via confidential individual counselling, workshops, and group work assisted a significant number of students and contributed to a broader forum and wider emphasis on well being.
Student Support Advisers (SSAs) continued to provide individual support to students, with a particular focus on assisting students with disabilities and international students. The SSA team, along with the Disability team, were commended in the 2011 AUQA audit. In 2011, the SSA team supported 1911 students overall, with approx 564 of those being international students and 464 students with a disability. In addition, SSAs continued to provide support to and communicate with particular student groups during the year, most noticeably the Libyan student cohort who experienced very difficult circumstances. The SSAs worked with the University’s Counselling Services and a community group to provide specialist counselling in Arabic for this cohort. In addition to their individual support, the team managed a number of projects including the Emergency Food Voucher Program and expansion of the Mature Age Orientation program. SSAs were again active across a number of equity initiatives, including the Commerce and Education Faculties Indigenous Working Parties and Women in Engineering. The SSA team also participated in the In2Uni program and provided information at Parents Night held in February. SSAs remained involved in international student issues and contributed to the management of the Welcome to Wollongong Committee. They continued to support international students by multiple means including the Global Communicators program for student peer to peer conversation groups, which greatly enhanced engagement between international and domestic students. They also contributed to various committees and groups on matters regarding the support of international students, and produced the Experience Wollongong booklet, which is given to all newly arriving international students.
learning Development
Learning Development contributed to the University’s receipt of a Commendation from the AUQA Panel for “the dedication of staff who provide … learning support services”. The Audit Panel “formed a view that the network of dedicated people who provide learning … support is a strong factor in enabling undergraduate learning at UOW”.
The Learning Development unit continued to assist UOW to meet its social inclusion agenda. One strategy was the Successful Transitions Program conducted at the Batemans Bay, Bega, Southern Highlands and Shoalhaven campuses to support student transition to the first year of university study. Another was the Disability Support Program, which supports the academic development of students with disabilities, including those with mental illness and learning difficulties. In 2011, this program was further supported through the appointment of a lecturer to focus on supporting mathematical and statistical thinking. The student learning conference, Learning Carnivale, was again held over two days in April, and timed as a post-orientation event falling within the first six weeks of study. In advance of the Carnivale, an eLearning site provided participants with support, pre and post event.
Learning Development continued to work with faculties at all onshore locations to support student development of discipline specific academic writing and research capacity, academic language and
graduate qualities. This work involved a co-operative approach with faculty staff toward the inclusion of Learning Development support within subjects, the provision of lecture and workshop series, and the development of teaching materials and student resources to support the development of discipline-specific academic literacy at the time of acquisition of subject content. These methods reached more than 10,000 students, of whom more than 4,000 were equity students.
The University’s research training agenda was enhanced by a research writing subject designed and taught by Learning Development lecturers for postgraduate students in Engineering, Informatics, and Science. As well as this, two series of thesis writing workshops for HDR were provided in co-operation with the Research Student Centre. Throughout the year, workshops for undergraduate students were provided on a range of study, research, academic writing and language related topics, and individual consultations were provided for research and coursework students across all faculties.
Careers
The mission at Careers Central is to assist graduates to learn, engage and lead in society and the global workplace, through Career Development Learning (CDL) and workplace partnerships. To realise this mission, Careers Central works closely with three key client groups: the students and graduates of the University, employers and industry networks, and staff across the University.
All strategic planning priorities were implemented and achieved in 2011. Highlights included:
• EmbeddingCareerDevelopmentLearningacrossvariousSocialInclusion projects. Students of UOW College (Step to UOW and University Access Program (UAP) cohorts) and EdStart students were engaged in career development programs and resources. In addition, developments took place in the In2Uni program in 2011 with solid grounds established for innovative plans for 2012.
• JobsonCampusservicerealisingsignificantgrowthin2011witha500 per cent increase in opportunities for students to obtain work on campus. A total of 498 students participated in the Campus Ready workshop (up from 307 in 2010) to prepare for these roles.
• WorkplaceLearningprogramsincluding:90studentsand9hostorganisations involved in Univative Illawarra (the Univative model was adopted by Sydney metropolitan universities for the first time in 2011); 12 Lucy mentors, secured from the corporate and community sectors, were linked with 12 student mentees; and 12 students placed as Careers Central Interns.
• SuccessfulcollaborationwithUOWAlumnitostageCareerAheadSpeed Interviewing program, with 90 students enrolled.
• Curricularandco-curricularprogramspreparinginternationalstudents for the Australian workplace: 213 Masters level students were involved in coursework and 55 students undertook the Certificate in Global Workplace Practice. Approximately 40 per cent of total users of Careers Central services, including workshops and the Resume Checking Service, are International students.
• InitiatingtheArtsCareerReadinessprograminNovemberandthe intensive 2 day program with guest speakers and industry representatives. This pilot model has seen three other faculties request implementation in 2012.

24 University of Wollongong
gOaL 2: rEcOgNiTiON fOr rEsEarch Of high qUaLiTy aNd iMpacT
ObJECTiVES1. Global recognition for research of high quality and impact2. Enhanced capacity to attract research funding3. Strong national and international partnerships to facilitate the
achievement and recognition of research outcomes 4. Attraction and development of high quality staff and higher degree
research students to strengthen research capacity and leadership
OVERViEW
UOW was reconfirmed as one of Australia’s most research intensive universities in 2011 when it was placed, once again, in the top 2 per cent of universities in the world in the Times Higher Education World University Rankings (with new rankings data provider Thomson Reuter), and also in the top 2 per cent of the Quacquarelli Symonds (QS) World University Rankings.
To strengthen its research capacity and leadership, the University continued to focus on the attraction and retention of excellent academic staff, particularly in existing or emerging areas of research strength. In 2011, UOW received a number of externally funded fellowships, including an Australian Research Council (ARC) Australian Laureate Fellowship (one of only 19 awarded nationally), and was in the top third of Australian universities for ARC Future Fellowships
and Discovery Early Career Researcher Awards (DECRAs). Initiatives to support career development pathways for academic staff included the Early Career Researcher Program and the Vice Chancellor’s Postdoctoral Research Fellowship Scheme.
The attraction and recruitment of Higher Degree Research (HDR) students in areas of research strength is a closely related strategic focus. In 2011, HDR student load increased by 10 per cent to 1220 EFTSL. An HDR benchmarking project was conducted with the University of Tasmania and Deakin University to assess and compare performance in a range of areas, including supervision, academic support and learning outcomes. eClub was launched and continues to attract and motivate HDR students to commercialise their research. One of several positive outcomes from eClub was the attraction of international venture capital for two companies set up by UOW graduates.
The University’s capacity to attract competitive grants and direct industry funding is both a driver and an outcome of the above priorities. In 2011, the overall level of research income increased (see Table 13) and UOW ranked 11th nationally (taking size into account) for combined ARC Discovery, Linkage Projects, DECRA and Future Fellowship income with total funding awarded of over $11.5 million (see Figure 5). A total of $2.06 million was awarded in National Health and Medical Research Council (NHMRC) project funding, and commercial research income totalled $18 million, up 12.8 per cent from the previous year.
ReVIeW: ReseARcH MAnAGeMent

2011 Annual Report 25
The University’s two UOW flagship developments - the Illawarra Health and Medical Research Institute (IHMRI) and the SMART (Simulation, Modelling, Analysis, Research and Teaching) Infrastructure Facility – made their presence and collaborative strength known in 2011. IHMRI completed its first operational year with a Research Network membership of 715 attracting significant funding.
The state-of-the-art building that houses the SMART Infrastructure Facility was officially opened in November 2011 by Federal Minister for Infrastructure and Transport, Anthony Albanese, in an event that highlighted SMART’s mission to “provide the data and analytical capability to successfully create and execute a national integrated infrastructure plan for Australia”. SMART was also honoured to welcome, as the new Chairman of its Advisory Council, Dr Ken Henry AC, the highly respected former Secretary of the federal Department of Treasury.
Research collaborations and partnerships increased significantly in 2011, with numbers up 14.8 per cent nationally and 31.4 per cent internationally. On the international front, UOW strengthened its engagement with the University of Waterloo in Canada, with a number of exchange visits, joint seminars and conferences, and new research initiatives. Nationally, the University’s participation in initiatives such as the new Automotive Cooperative Research Centre (CRC) and the ARC
Linkage Grants Scheme broadened the scope of partnerships across multiple universities and businesses.
In response to the Excellence in Research for Australia (ERA) assessment, UOW developed a purpose-built information system to ensure that the quality of UOW research is accurately reflected in the 2012 ERA outcomes. The ERA Management System (EMS) is designed to assist in the preparation, reporting and optimisation of research data in each assessable field of research. A review of research publication management was also conducted, and its recommendations will be implemented in 2012 to improve not only the quality and visibility of UOW research outputs but the entire publication management process.
UOW’s research priorities for 2012 will be overseen by the Deputy Vice-Chancellor (Research) and monitored by the University Research Committee.
2011 OUTCOmES UnDER STRATEGiC ObJECTiVES
1. Global recognition for research of high quality and impact
The University sustained its exceptional record for research performance internationally in 2011 and continued to register strong individual research performances by staff and students (see Table 12).
Table 12 – Recognition of UOW Researchers in 2011
Researcher and Award Description
Professor Salim bouzerdoum Australian Museum Eureka Prize for Science in Support of Defence or National Security
Awarded for groundbreaking research in developing through-the-wall radar imaging systems that can ‘see’ objects behind walls, doors and other opaque materials
Professor Gordon WallaceAustralian Research Council (ARC) Australian Laureate Fellowship
Awarded to outstanding researchers of international repute – Professor Wallace has built a groundbreaking medical bionics research program and team
Professor lesley head Fellow of the Academy of Social Sciences in Australia
Elected in recognition of her sustained and distinguished contribution to cultural geography and the wider field of geography
Professor buddhima indraratna Fellow to the Academy of Technological Sciences and Engineering (ATSE)
Engineers Australia Transport Medal
Elected in recognition of his significant contributions to geotechnical engineering and groundbreaking work on Rail Track Innovations and Ground Improvement for Infrastructure Development
In recognition of outstanding individual contributions to transport in Australia. Recipients must have at least 10 years distinguished service, a professional reputation, have contributed significantly to Australian transport and have national and international influence in the transport field
Professor Amanda lawson ARC Advisory Council
Members are appointed to the Council for up to three years on the basis of their distinguished research records or achievements in business research and development
Associate Professor Zenobia Jacobs Sir Nicholas Shackleton Medal
Awarded by the International Union for Quaternary Research (INQUA) for groundbreaking work on the role of ecological change in the lives of our earliest ancestors in Africa and the effect of humans on the native biota of newly colonised lands
ms naomi biribo (hDR)Prime Minister’s Pacific-Australia Award (PMPA)
Awarded for her doctoral thesis on the coastal vulnerability of her island home, Kiribati’s Tawara Reef Islands – the PMPA aims to build the capacity of postgraduate students through leadership development programs and placement opportunities in Australian Government departments

26 University of Wollongong
2. Enhanced capacity to attract research funding
Figures are not yet available to provide a complete picture of progress towards the 2011 target for total research income but the Department of Innovation, Industry, Science and Research (DIISR) research income figure for 2010 (most recent figures available) was approximately $47.2 million compared with $45.67 million in 2009. Research block grant allocations for 2011 (and their percentage of the national pool) were as follows:
> Research Training Scheme income: $11,609,226 (1.9 per cent)> Joint Research Engagement Scheme income: $5,667,685
(1.7 per cent)> Research Infrastructure Block Grant income: $3,552,964
(1.6 per cent )> Sustainable Research Excellence income: $2,239,263 (1.8 per cent)
UOW’s external competitive research income continued to grow from 2009 to 2010 (with 2010 being the most current year for which audited information is available).
Table 13: UOW Competitive Research income 2006–2010
Source2006
($ million)
2007($ million)
2008($ million)
2009($ million)
2010($ million)
Australian Competitive Grants
17.9 16.3 18.0 20.3 21.8
Other Public Sector Grants
6.3 7.9 8.6 17.5 9.7
Industry and Other Grants
5.7 7.0 9.2 6.6 14.3
Co-operative Research Centres
1.9 1.0 0.1 1.2 1.4
Total 31.9 32.2 35.9 45.6 47.2
In competitive research grant funding, the University received:
> over $2.6 million for Professor Gordon Wallace (Director of the ARC Centre of Excellence for Electromaterials Science and founder of the Intelligent Polymer Research Institute), who was awarded a prestigious ARC Australian Laureate Fellowship
> a total of $3.47 million for five ARC Future Fellowships and a total of $2.6 million for seven ARC DECRAs
> a total of $2.06 million in funding for NHMRC Project Grants, with over $740,000 awarded to researchers from the Interdisciplinary Educational Research Institute (IERI) from the Heart Foundation for a Grant-in-Aid, Career Development Fellowship and Postdoctoral Fellowship
> approximately $435,000 via GeoQuest as a partner in a $2.3 million Australian Government grant for the Greenhouse Gas Monitor project funded by the Australian Space and Research Program.
> a total of approximately $19.5 million to support health and medical research activities via competitive research grants, contracts and donations (see Figure 6).
Figure 5: Total Funding ARC Discovery, linkage Projects, Future Fellowships and DECRAs Announced in 2011 per Full-Time Staff (based on 2010 DEEWR Staff Statistics)
$40,000
$35,000
$30,000
$25,000
$20,000
$15,000
$10,000
$5,000
$0
Griffith $7,451
Swinburne $9,379
UTS $10,076
QU
T $10,297
UO
W $11,521
New
castle $11,673
Adelaide $16,097
Macquarie $16,854
Monash $17,261
USyd $18,202
Melbourne $18,363
UN
SW $18,517
UW
A $18,843
UQ
$20,842
AN
U $33,932
All ARC $ Awarded per FTE (includes DP, LP, FT, DECRA)
In health and medical initiatives for 2011, IHMRI announced its population health flagship project, Health Connect: A Chronic Disease Prevention Program for the Illawarra-Shoalhaven population. This is a truly collaborative venture of the University of Wollongong and the Illawarra Shoalhaven Local Health District with the leadership team comprising clinicians, dieticians, psychologists, public health researchers and exercise scientists. IHMRI’s Clinical Research and Trials Unit also commenced the first commercial trials for a shingles vaccination, blood lipid control medication and a cold sore treatment. Investigator-initiated trials included weight management (Healthy Eating and Lifestyle study), dietary interventions, exercise interventions, and dementia.
IHMRI scientists achieved excellent results in the ARC Fellowships Schemes with Dr Heath Ecroyd, Dr Todd Mitchell, Dr Nadia Solowij and Dr Haibo Yu receiving Future Fellowship awards, and Dr Justin Yerbury receiving a Discovery Early Career Researcher Award (DECRA). Successful ARC Discovery Project funding supported diverse projects such as the structural elucidation of lipids and the impact of alcohol advertising on young people. IHMRI researchers were also part of two successful ARC Linkage Infrastructure, Equipment and Facilities (LIEF) grants. At year’s end, IHMRI was looking forward to hosting a state-of-the-art Single Molecule Fluorescence analysis and confocal imaging system which will greatly improve research efforts to understand molecular changes that occur in Alzheimer’s disease.
review: research MaNageMeNt

2011 Annual Report 27
Figure 6: Total Funding Received for health and medical Research 2007–2011
$25,000,000
$20,000,000
$15,000,000
$10,000,000
$5,000,000
0
Total H&M Income
2007 2008 2009 2010 2011
Source: UOW Research and Financial Information Systems
In Commercial Research, income received grew by 12.8 per cent to $18 million. More than 180 contracts were negotiated in 2011. Of these, 26 commercial research projects were valued at greater than $100,000, which was roughly consistent with 2010.
In another excellent result, 16 of the 29 UOW tender applications submitted in 2011 were successful, with 8 still awaiting decision. This builds on the previous two years’ performance and once again achieves a success rate of more than 50 per cent. A team led by Professor Brian Cullis (School of Mathematics) was named as the successful tenderer for a $5 million, five year project funded by the Grains Research and Development Corporation to develop a statistical methodology and provide statistical support to the Australian grains industry.
In a major outcome for UOW’s research infrastructure, the Australian Institute for Innovative Materials Processing and Devices Facility (AIIM P&D) was completed in 2011 and will soon be fully operational on the Innovation Campus. The first of its kind in Australia, the AIIM P&D Facility will take multifunctional materials from fundamental research to proof of concept, using novel fabrication methods. It enhances prospects for national and international collaboration and offers postgraduate training to produce the personnel required for technology transfer to industry.
3. Strong national and international partnerships to facilitate the achievement and recognition of research outcomes
The University continued to build its national and international partnership networks during 2011. The collaborative power of such partnerships was cleverly captured at the first National SMART Infrastructure Research Summit held at Parliament House, Canberra in March 2011. SMART Advisory Council Member, the CSIRO’s Dr Alex Zelinsky (now Chief Defence Scientist) observed: “I certainly commend the University of Wollongong for its SMART initiative: a big sort of peloton mob of bicycles…Wollongong has got the yellow jersey and … the CSIRO are very happy to come in behind ... Because when you are inside that peloton you don’t have to pedal that hard (always) by yourself because there’s a real momentum of everyone moving forward.”
The SMART Infrastructure Facility was created by a partnership between the federal government ($35 million in funding), the University ($17 million) and the NSW Government, through RailCorp ($10 million). Its impressive, four-storey headquarters, with 30 integrated laboratories, simulation and modelling hub and rail logistics research centre, will be home to up to 150 research staff and 200 higher degree research students.
SMART is developing a new branch of research - ‘integrated infrastructure planning and management’. In 2011, it brought together a formidable leadership team, establishing Australia’s first Professorial chairs in infrastructure governance, infrastructure systems, infrastructure modelling and simulation and appointed a professor of infrastructure economics. It has already established strategic relationships with, for example, UK Infrastructure Transitions Research Consortium at Oxford University, the federal Attorney General’s Department, Transport for NSW and the University of Melbourne. SMART has secured $215,000 funding from the Australian National Data Service (ANDS) for the development of the Multi Utility Dashboard (MUD), a ‘one-stop-shop’ online portal providing information on infrastructure services and operations in a given region.
Figure 7: SmART Research Streams
National and International C
ollaborations Professors, Research Fellow
s, H
DR Students
Infr
astr
uctu
re n
etw
ork
data
an
d vi
sual
isat
ion
port
al
RS Infrastructure 1 Dashboard
RS Infrastructure Productivity and 2 Service Benchmarking
RS Governance, Project Selection 3 and Prioritisation
RS Integrated Land Use and 4 Infrastructure Provision
Enchancedcompetitiveness
betterLiveability
Integrated Infrastructure Planning & Management
Societal Outcomesgreater
resilience
The SMART research streams will contribute to Australian society by delivering benefits across three major areas:
> Increasing our economic competitiveness> Improving our community and urban liveability> Enhancing the resilience of our infrastructure systems
At the Innovation Campus, the acclaimed Australian Institute for Innovative Materials (AIIM) was successful in two Cooperative Research Centres (CRCs) announced by the Federal Government. UOW’s flagship research teams within AIIM (the Institute for Superconducting and Electronic Materials (ISEM), the Intelligent Polymer Research Institute (IPRI) and the ARC Centre of Excellence in Electromaterials Science (ACES)) are partners in:
• The$26millionAutomotiveAustralia2020CRCwhichwilldrivethe advancement of electrification technologies for use in electric and hybrid electric vehicles. ISEM will be the program leader for vehicle electrification. The new CRC will tackle the complex issues that are currently impeding the uptake of low-carbon vehicles worldwide. It is a consortium of 31 local and international industry and research organisations active in the automotive industry.

28 University of Wollongong
• The$14.5millionCRCforPolymerswhichwillestablishAustralianmanufacturing as a leading provider and exporter of products that meet emerging global needs in three areas — health therapies, water and food security, and low-cost solar energy — by developing enabling and sustainable advanced polymer technology. The IPRI/ACES team will lead the solar energy program which involves researchers at the Universities of Newcastle, Queensland, New South Wales, and Monash, the Queensland University of Technology, and the Australian Nuclear Science and Technology Organisation (ANSTO).
Many of UOW’s strong research partnerships have been developed over the past decade through our areas of research strength. Long-term commercial partners include BlueScope Steel, RailCorp and Integral Energy. Strong research relationships have also been developed with national and international partners:
> United States Naval Academy, Scintech (USA), Memorial Sloan Kettering Cancer Care Center (USA), European Synchotron Radiation Facility (France), Loma Linda University Medical Center’s Proton Therapy and Research Centre (USA) (Centre for Medical Radiation Physics)
> Asthma Foundation NSW, Australian Health Management, Cancer Council NSW (Centre for Health Initiatives)
> National Museum of Natural History, Smithsonian Institution (USA), National Research and Development Centre for Archaeology (Indonesia), Max Planck Institute for Evolutionary Anthropology (Germany) (Centre for Archaeological Sciences)
> BlueScope Steel, BHP Billiton, Beijing University of Science and Technology (China), Los Alamos National Laboratory (USA), BaoSteel (Engineering Materials Institute)
As reported under Objective 4 (below), partnerships and agreements with key international organisations also brought high quality HDR students to the University.
Commercialisation activity continued to be supported by the University’s partnership with UniQuest (University of Queensland) and the UOW Managers of Innovation and Commercialisation ensured that commercialisation was an integrated activity amongst UOW academics. A total of 35 Intellectual Property Disclosures from researchers were lodged, two licence deals finalised and two individual one-off software licences were signed during 2011. Nine provisional patent applications were filed, while five Patent Cooperation Treaty (PCT) applications were made and eight Patent Families entered the national phase, with a total of 10 applications. Key developments in commercialisation projects during 2011 include:
> A novel sports bra design, developed in the Biomechanics Research Laboratory (School of Health Sciences, Faculty of Health and Behavioural Sciences) to reduce exercise-induced breast discomfort, was exclusively licensed to Kalyx Technologies, Inc., a US sports apparel manufacturer. Product release in the US is scheduled for mid-2012.
> A high performance trace gas analyser system, developed with the Centre for Atmospheric Chemistry (School of Chemistry, Faculty of Science), was exclusively licensed to Ecotech Pty Ltd, an Australian manufacturer of environmental monitoring equipment. Product release is scheduled for April 2012 and the target segment is the world-wide greenhouse gas monitoring community.
> UOW received Commercialisation Australia grant funding to support the development of a business plan for its water splitting intellectual property (IP).
> Ongoing royalty payments were received for nine licence agreements involving UOW intellectual property.
4. Attraction and development of high quality staff and higher degree research students to strengthen research capacity and leadership
This is a two-pronged objective for developing research capability in staff and potential staff (HDR students).
In 2011, initiatives to support career development pathways for academic staff, included:
• TheEarlyCareerResearcherDevelopmentProgram,offeredover12 months to assist staff in the early stages of their research careers with strategic career planning and with developing the skills, knowledge and abilities required to be a successful researcher. The first cohort comprised 22 academic staff.
• TheViceChancellor’sPostdoctoralResearchFellowshipsSchemeto support outstanding Early Career Researchers to undertake full-time research. Three fellowships were awarded: > Dr Zhenguo Huang, working with Professor Shi Xue Dou (ISEM),
project title: ‘Exploring boron-containing hydrides for hydrogen storage’;
> Dr Kara Perrow, working with Associate Professor Marie Ranson (Biological Sciences), project title: ‘Development of “controlled release” nano-conjugates to simultaneously target the metastatic biomarkers uPAR and HER-2 for the treatment of breast cancer’;
> Dr Hailiang Yu, working with Professor Kiet Tieu (Mechanical Engineering), project title: Thermodynamic criterion and mechanism of crack healing in heavy plates rolling process.
UOW’s growing international reputation and a strategic focus on HDR recruitment in areas of research strength have resulted in the HDR student load increasing by 45 per cent over the past five years. In 2011, international students accounted for 56 per cent of all HDR commencements, while HDR student load grew by 10 per cent to 1,220 EFTSL (with domestic EFTSL up 2 per cent to 630 and international EFTSL up 21 per cent to 590. (See Figure 7).
Figure 8: hDR Commencements 2007–2011
500
400
300
200
100
0
2007 2008 2009 2010 2011
Domestic
International97 147 146185
258
188 180 213 198 200
review: research MaNageMeNt

2011 Annual Report 29
More recent growth in international HDR enrolments has partially resulted from a strategic increase in the level and diversity of funding sources to support international HDR students. UOW has significantly increased the number of its own scholarships (see Table 14). Other sources include scholarship agreements with the Chinese Scholarship Council (CSC) and the Ministry of Education and Training in Vietnam. In both scholarship agreements, the international sponsor pays a living allowance, overseas health cover and airfares for HDR students and UOW pays an International Postgraduate Tuition Award. The first two cohorts, of about 25 students each, have enrolled at UOW under the CSC program while about 20 HDR students arrive from Vietnam, each year. These agreements will help to build ongoing relationships with partner universities in China and Vietnam, and increase the numbers of international HDR students at UOW, in areas of mutual strategic importance.
Table 14: international Research Scholarships funded by UOW 2008–2011
2008 2009 2010 2011
UOW scholarship (living allowance) 42 52 54 90
UOW scholarship (tuition) for course 54 72 137 170
UOW also enjoyed a substantial increase in Government-funded Australian Postgraduate Award scholarships (from 48 to 73 over three years) due to increases in DIISR funding and improved research outcomes.
In 2011, the new four year PhD (Integrated) program which combines coursework (one year) and research (three years) in a single, integrated degree was introduced. The addition of the coursework year is designed to deliver better completion outcomes as it provides candidates with the opportunity to develop their research skills and additional time to develop a detailed research topic. In another important development, the new SMART Infrastructure Facility brought on line dedicated space for 200 HDR students working on a range of interdisciplinary projects.
A new ‘Thesis Writing’ subject (RESH900/901) ‘Fundamentals for HDR Writing’ was trialled in 2011 with a class of 25 students from Engineering, Science and Informatics. In view of very strong demand from international HDR students, the subject will be extended in 2012 to about 75 students, 50 from the quantitative disciplines and 25 from the qualitative disciplines. It will be taught by a mix of Learning Development and Faculty staff, including Engineering and the Language Centre.
The development of HDR professional skills and tailored Graduate Qualities and the quality of the overall HDR student experience were addressed by:
• AstrongercapacityforHDRsupervisionasaresultofbothincreased academic staff numbers and an improved supervisor training program.
• Aprogramoffaculty-basedandcentrally-fundedresearchseminars and workshops covering a range of generic and discipline based research skills and professional development needs. (A review in 2010 found that HDR students were overwhelmingly positive about the value of these seminars). In 2012, the seminar series will include a new module giving an overview of e-Research
strategies and techniques.• FreeenrolmentintheGraduateCertificateinResearch
Commercialisation and the Graduate Certificate in Business. • EncouragingHDRstudentstogaininternationalexperienceeither
by attending an international conference, for which funding is available through the Faculties, or visiting an overseas university to conduct part of their research. Dedicated study spaces in each faculty (and now the SMART Infrastructure Facility) promote interaction between domestic and international HDR students.
PRiORiTiES FOR 2012
> Maintain a leading performance in research through outstanding scholarship, groundbreaking discovery, collaborative networks and commercialised outcomes
> Facilitate multidisciplinary research excellence by targeting resources to encourage and enhance collaborations that span traditional disciplinary boundaries
> Develop strategies to improve access to international research opportunities and promote collaborative research with internationally recognised institutions and partners
> Increase capacity to attract and leverage competitive grants and other categories of external funding
> Increase availability of UOW publications in the online repository, improving citation rates and exposure of our research
> Develop excellence in health and medical research and innovation through IHMRI
> Increase domestic and international HDR recruitment to support the research activities of our existing research strengths
> Build links with key international partner institutions to promote opportunities for HDR recruitment and experience
> Implement the recommendations of the HDR Benchmarking Report> Provide increased support to HDR candidates, via the development
of generic and discipline specific research skills and other professional development opportunities
> Ensure articulation of alignment of HDR learning outcomes with UOW Graduate Qualities and AQF learning outcomes
> Develop SMART Infrastructure research capabilities and the facility as a nationally recognised facility
> Develop strategies for managing key existing research partners and identifying new partners, utilising the Innovation Campus
> Establish iAccelerate and StartPad as innovation and development ‘hubs’ at the Innovation Campus.
> Develop a research space plan and research infrastructure register.

30 University of Wollongong
gOaL 3: parTNErships ThaT dEVELOp cOMMUNiTiEs aNd aN ENTErprisiNg, ENgagEd UNiVErsiTy
ObJECTiVES1. Contribute to the vitality of our region by providing leadership
and collaboration on emerging economic, social, cultural and environmental issues
2. Embed university-community partnerships in research and the learning experience
3. Partnerships that create mutually beneficial outcomes4. Increased participation by diverse groups in university education
OVERViEW
The University of Wollongong takes pride in its history of dynamic engagement with its communities. In 2011, the University continued to deliver and improve its existing engagement programs and initiatives, including the Community Engagement Grants Scheme, the Chancellor’s Awards for Voluntary Contribution and the biannual Community Perceptions Survey. These core programs are designed to build on UOW’s strengths. They ensure that activities and policies are grounded in community values and reflect the role that community, partners and students expect from their university.
In a significant achievement, UOW received a maximum of ‘Five Stars’
in its first ever international benchmarking by the same organisation which determines the annual World University Rankings. In the area of ‘engagement’ the University achieved a perfect score of 50 out of 50 points, clearly demonstrating the strength and calibre of its engagement program.
A high point of the year was the 60th Anniversary Program which celebrated the history of UOW’s presence in the Illawarra and our achievements over that time. It was an opportunity to express our gratitude to alumni, students, staff and community partners and to invite them to share their UOW story. The Anniversary Program was also designed to strengthen awareness of the University’s vision as well as promote UOW to a wider audience. Over 10,000 people attended the celebration and a diverse communications plan reached over 2.5 million people around the world. Social media and online technologies were used to connect with international audiences as well as more traditional local media. More than 500 people shared stories and memories of UOW.
The Community Perceptions Survey was conducted again in 2011. While the questions remained largely the same, the survey was reviewed and reorganised under the key categories of Awareness, Participation and Identity. As the survey is now in its eighth year,
ReVIeW: enGAGeMent AnD PARtneRsHIPs

2011 Annual Report 31
an extra component of analysis will be undertaken that looks longitudinally at community perceptions across a number of areas. A full report will be available in early 2012. These results will continue to inform and drive the University’s engagement agenda.
2011 OUTCOmES UnDER STRATEGiC ObJECTiVES
1. Contribute to the vitality of our region by providing leadership and collaboration on emerging economic, social, cultural and environmental issues
UOW’s economic impact on its region increased to $1.054 billion in 2011, a particularly important input in a year of economic challenges as Bluescope Steel restructured its operations and reduced its workforce. The University continued to provide leadership and work collaboratively with its community towards solutions. The Vice-Chancellor, Professor Gerard Sutton, was invited to join a taskforce to help identify future manufacturing directions for the region and also to work as a special advocate directly alongside the Chair, Head of the Department of Innovation, Industry, Science and Research, Mr Don Russell. The Illawarra Stakeholder Taskforce’s job is to inform the federal Government’s Working Group that oversees and co-ordinates the entire Government support package for the region.
A bold new initiative announced in 2011 contributed to a new vision and future for the region. iAccelerate will be an innovation hub that, with its incubator, StartPad, has the potential to create 500 direct jobs with a multiplier effect of thousands more in its first five years of operation. iAccelerate evolved from a year of deep engagement with local stakeholders to identify the critical components of the Illawarra Innovation Ecosystem and international regional best practice in business incubation.
During the year, University staff and students also continued to contribute their time, expertise and support to the broader community. UOW Cares completed its fourth year and achieved another milestone by registering a 14 per cent increase over 2010 in contributions to the participating charities in the program. As part of the program, UOW successfully piloted a staff volunteering program in the first quarter of 2011. Staff volunteered their time to one of two charities: The Smith Family – Learning Clubs or Landcare. A total of 5,569 staff hours were donated.
2. Embed university-community partnerships in research and the learning experience
The UOW Community Engagement Grants Scheme (CEGS) enabled a number of worthwhile, collaborative projects to proceed in 2011. A leading example was the UOW and Meals on Wheels Project. Working with Northern Illawarra Meals on Wheels, health science researchers, Dr Karen Walton and Associate Professor Karen Charleton, aimed to identify how the service could be improved to better target those most at risk of malnutrition. This collaborative, community-based research evaluated the nutritional status of homebound clients receiving meals, the nutritional content of meals available from Meals on Wheels, and developed a ‘snack pack’ program and nutritional screening resources pack.
In October, the University launched a new consortium which represents an innovative model for research collaboration and engagement between local government authorities and the University. Five key councils (Wollongong City, Shoalhaven City, Hurstville City, Rockdale City and Camden) are committed and actively involved in the consortium for at least an initial three-year period. This initiative provides the opportunity for nominated council staff to enrol in a UOW Masters by Research or a Doctor of Philosophy on projects that are of strategic importance to a council or to the local government sector more broadly. The other focal point of the consortium will involve UOW acting as the hub for networking, research guidance and knowledge exchange between the five councils, their research staff and the University.
3. Partnerships that create mutually beneficial outcomes
A Partner Satisfaction Survey was developed in 2011 to understand how the University is performing as a partner and establish baseline targets from which to improve performance. The survey, which will again be conducted in 2012, will register performance under one of UOW’s key 2011–2013 indicators, ‘partnership satisfaction’.
4. increased participation by diverse groups in university education
The In2Uni Program continued to extend its reach in 2011. The program includes an Academic Mentoring program as well as UNIque Experience days held on campus. Pre and post survey data was collected as part of each program.
Over 1,000 high school students participated in the In2Uni Academic Mentoring program over terms 2 and 3, and 93 per cent of those surveyed ‘strongly agreed’ or ‘agreed’ that the program had encouraged them to consider further studies after high school. Over 400 Year 9 and 10 students from the area between Vincentia and Corrimal participated in the UNIque Experience day. Students from UOW’s Faculty of Commerce’s public relations and marketing subject designed the day and also raised over $4,000 towards an In2Uni Equity Scholarship for students from participating schools. Of the 281 (69 per cent) participants who completed the survey, 89 per cent agreed the UNIque Experience day provided them with information to think about their future; 38 per cent said that the day had changed their opinion of university life and opened up their minds to a world beyond high school.
Also in 2011, UOW and TAFE Illawarra signed a new Memorandum of Understanding that heralds a new phase of co-operation as each works to make pathways between the respective institutions transparent and easy for students to access.
PRiORiTiES FOR 2012
In 2012, under the guidance of the Community Engagement Committee, UOW aims to:
> Support faculties to engage with their communities> Build and strengthen the Community Engagement Grants Scheme,
including new faculty based initiatives> Further grow strategic partnerships> Review and promote community access to UOW

32 University of Wollongong
gOaL 4: aN iNTErNaTiONaL UNiVErsiTy Of chOicE
ObJECTiVES1. A global educator renowned for quality and innovation2. A rich and engaging international experience for students3. Global networks of alliances
OVERViEW
International education is one of Australia’s largest and most competitive export sectors. In 2011 the University and its University Internationalisation Committee (UIC) have acted to ensure that our international strategy is clearly articulated and internally aligned. We have taken into account critical environmental factors, including the fluctuations in currencies and policy shifts, such as the reforms resulting from the Knight Review of the student visa program. At the same time, the UIC and the Deputy Vice-Chancellor (International) have worked with faculties to enhance UOW’s reputation for high quality programs and services, which is central to maintaining market share and growing student numbers onshore and offshore.
Enrolment figures for onshore international students, as at October 2011, totalled 6,085 (a decrease of 7.33 per cent on 2010 enrolments) and accounted for 25.8 percent of total onshore course enrolments. Enrolments at UOWD were 3,318 (an increase of 8.5 per cent on 2010).
An initiative by the International Alliance Committee (IAC) supported the implementation of Working Groups led by the Faculty International Support Unit (FISU) and Transnational Education & Alliances Unit (TNE&A) to review policies and procedures established to monitor quality assurance of our offshore activities and achieve targets within Faculty International Plans. IAC supported the UIC International Links Grants Scheme to promote the development of teaching and research collaborations with a total of $109,365 distributed amongst 22 applications. This funding included a continued focus on building relationships in Thailand as well as focusing on relationships with India.
International student satisfaction continued to be positive. The International Student Barometer (ISB) Survey, conducted again during 2011, provides the University with a valuable tool to identify key drivers of international student satisfaction and establish the relative importance of each. Achieving a response rate of 47 per cent for 2011 (compared to a 46 per cent response rate achieved in 2010), UOW ranked 9 out of 28 Australian universities in the overall satisfaction question and continued to maintain a strong performance against other international universities. In 2012, the International Student Experience Committee (ISEC) will focus on reviewing the international student satisfaction survey results to identify and recommend to UIC improvements and/or support to our international students.
ReVIeW: InteRnAtIonAL

2011 Annual Report 33
2011 OUTCOmES UnDER STRATEGiC ObJECTiVES
1. A global educator renowned for quality and innovation
UOW welcomed 512 international students at customised enrolment days in Autumn Session and at combined enrolment days for both domestic and international students in Spring Session. Orientation activities brought together the social and academic aspects of campus life to engage, inform and motivate commencing students.
The Welcome to Wollongong Reception and Community Festival for international students continued to grow in profile and in support. The February event was attended by 700 students, with 21 businesses and community organisations also participating. The benefits are reciprocal as international students bring not only economic but social and cultural rewards to the region and their fellow students. Their contributions are showcased at the popular ‘Global Highway’ event, held on the main campus each year.
Opportunities offered during their courses added to the enriching UOW experience offered by the University. English conversation groups were well attended and continued to provide both a social and personal development opportunity to international students. A webpage listing availability of the conversation groups assists in providing information to students. During 2011, 55 international students successfully completed the Global Workplace Citizenship Certificate Program (CGWP). The Faculty of Commerce registered 160 enrolments in the iConnect Certificate which encourages engagement by all students in cross-cultural experiences through lectures, seminars, workshops or overseas study or internships. Plans are underway to roll this program out to other faculties in 2012.
The Professional & Organisational Development Services (PODS) Unit offered cultural awareness workshops — Effective Intercultural Communication and Customer Service across Cultures — to support academic and general staff in cultural awareness, with 68 staff attending during 2011. Staff continued to engage in international research and teaching collaborations with many overseas institutions and partner organisations, supported by the UIC International Links Grants Scheme.
UOW also sought to maintain its global outreach through Exchange and Study Abroad programs in 2011. The student load from incoming numbers for non-award semester-students remained on a par with 2010 figures. With Autumn and Spring sessions combined, there were 186 incoming non-award Exchange students (a 12 per cent increase compared to 2010) and 311 incoming non-award Study Abroad students (a 7 per cent decrease compared to 2010). For domestic students, the outbound student mobility programs provided opportunities for over 282 students to study overseas for semester or short-term programs during 2011. The semester exchange component was down by approximately 20 per cent compared to 2010 but 2012 preliminary figures indicate a return to a pattern of growth. The University allocated over $242,000 in travel grants in 2011, supplemented by $170,000 from the International Exchange Program funds allocated by the Australian Government Department of Education, Employment and Workplace Relations (DEEWR). In addition, the International Exchange Program participants applied for over $500,000 in interest-free OS-HELP loans administered via UOW.
2. A rich and engaging international experience for students
UOW increased its focus on student recruitment from a broader range of market segments. Principal among these in 2011 were joint promotional and student recruitment activities with INTI College Malaysia; international high school leavers in Australia, Malaysia, Thailand, Sri Lanka and the UAE; scholarship holders in Libya, Kuwait, Iraq and Jordan; and students seeking bachelor pathways as diploma graduates in China and Korea. In addition, further resources were devoted to student recruitment from Vietnam; and study abroad recruitment from the United States, France and Germany.
As part of its commitment to a rewarding University experience for all students, UOW worked to ensure they had access to support services and assistance. The University provides an excellent counselling service for students as well as online resources and academic support programs run by Peer Assisted Study Sessions (PASS). In excess of 1,200 social, academic, personal development and cultural activities were offered to UOW international students throughout 2011.
The ISB survey tool provides data on expectations and experiences of international students at UOW and offered benchmarks both nationally and internationally. UOW scored above the national average against key aspects of the student experience (Arrival 89 per cent, Learning 84 per cent, Living 86 per cent and Support 90 per cent) and for Overall Satisfaction. UOW particularly explored the topical issue of safety with our international students and found they were concerned about safety off campus. In 2011, the University worked closely on a number of initiatives with the local Police and the community to educate and identify ways to ensure students feel safe both at university and in the surrounding environs.
The satisfaction rate with accommodation was 80 per cent, slightly down on 2010 results. During 2011, however, the University purchased a commercial hotel to assist with providing suitable accommodation for an extra 144 students who relocate to Wollongong. Plans are underway to develop further on campus accommodation with up to an extra 360 beds to meet the demand of international student accommodation needs.
3. Global networks of alliances
As reported in the Research chapter, UOW was again highly placed in the prime international rankings. Comparative data from DEEWR’s Institutional Performance Portfolios (IPP) also shows that UOW is in the top ten for the number of collaborative international research projects.
To raise its profile and enhance its international reputation, the University is working to build new partnerships, consolidate existing partnerships and strengthen quality assurance for all partnerships through the review of offshore programs, articulation, and twinning arrangements. Through its innovative partnership with the INTI Education Group and Laureate International Universities network, UOW began to offer programs in Kuala Lumpur and Penang. This partnership will assist in raising the University’s profile as a global educator.
The Strategic International Partners (SIP) List was again reviewed in 2011 to capture existing top level international relationships. Formal international linkages by country are listed and regularly updated by the Transnational Education & Alliances Unit.

34 University of Wollongong
review: iNterNatioNal
Highlights of the international Alumni events held during 2011 included a successful Singapore Alumni Reception; the Thai Chapter Annual Alumni and Friends function (where the UOW Alumni Network Thailand Chapter president Associate Professor Linchong Chorrojprasert was awarded the 2011 Vice-Chancellor’s Distinguished Alumni Award); the Australia-China Alumni Awards Presentation, Beijing (where Simon Chung, a UOW Faculty of Informatics graduate, was awarded the Australia-China Alumni of the Year Award); and the Faculty of Law Alumni Function, London. Alumni reunions were held in Beijing and Shanghai.
PRiORiTiES FOR 2012
In 2011 and as part of a sector-wide downturn, UOW’s international onshore student commencements were 2,920 overall, as against 3,354 commencements in 2010 (a decrease of 13 per cent). To reinvigorate international enrolment numbers and improve the University’s international profile, UOW will be developing its capacity to monitor and improve performance through:
> International student satisfaction rates> A number of offshore programs with new premium partners in
identified growth countries/regions> Onshore international student recruitment (commencements)
amongst the universities in New South Wales
To assist in continuous improvements, the University’s International Management Plan for 2012 identifies the following reviews to be undertaken:
> International student retention and attrition rates> Communication and co-ordination of international student social
inclusion activities, including offshore sites> Student survey instruments, including offshore sites, to identify
opportunities for continued improvements in a systematic way> Quality Assurance process for offshore teaching sites

2011 Annual Report 35
gOaL 5: VErsaTiLE, cOLLabOraTiVE aNd crEaTiVE sTaff
ObJECTiVES1. Talented staff whose purpose, skills and efforts are closely aligned
with UOW’s strategic direction2. A mutually supportive, rewarding and equitable work environment3. A staff culture that values and demonstrates collaboration and a
spirit of enterprise
OVERViEW
During 2011, UOW continued to focus on improving recruitment strategies and processes to enhance our competitive edge in attracting high quality staff and introducing further initiatives to develop our future academic and leadership capability.
The University’s full-time equivalent staff numbers continued to grow, reflecting continued expansion and success. A focus on core teaching and research activities produced an increase in academic full-time equivalent staff numbers at a higher rate than non-academic staff, while administration remained highly efficient.
The further development and expansion of the SMART Infrastructure Facility and the Illawarra Health and Medical Research Institute (IHMRI), as well as the continued success of the Australian Institute for Innovative Materials (AIIM), accounted for a large proportion of the growth in staff numbers. The Faculty of Commerce, the Sydney
Business School and the Graduate School of Medicine also experienced modest staff growth in 2011. However, Indigenous employment was recognised as an area for improvement in regard to comparative staff number growth.
The attraction and retention of high quality staff remains the key strategic challenge in the context of acutely competitive international academic labour markets and the rising age profile of the existing cohort of academic staff both at UOW and more broadly across the sector. UOW continued to perform above Australian higher education benchmarks in overall staff retention in 2011. Importantly, our capacity to retain high-performing staff, as identified through the annual strategic retention planning process, remained strong.
The University performed well overall against targets in the Staffing Goal in 2011, and the next steps are to achieve tighter alignment of workforce and broader organisational strategic planning in research and teaching and learning, coupled with the adoption of a longer term planning horizon. The aim is to reinforce this alignment by the integration of financial, academic and workforce planning.
ReVIeW: stAFF

36 University of Wollongong
2011 OUTCOmES UnDER STRATEGiC ObJECTiVES
1. Talented staff whose purpose, skills and efforts are closely aligned with UOW’s strategic direction
UOW met or exceeded most targets in staff attraction and retention in the following key areas in 2011 and identified areas for a review of strategies, measures and targets in 2012–2013:
• Anintegratedworkforceplanningframework,withahorizonbeyondthe immediate annual budget cycle, was reconsidered in 2011 and temporarily replaced by an approach that maintained alignment with current activities and centrally controlled risks associated with staffing budgets. Workforce decision making was iterative and primarily driven by vacancies, immediate teaching demands and research grant outcomes.
• ThenumberofacademicstaffwithaPhDisakeyindicatorofsuccess under this objective. The number decreased marginally from 76.6 per cent in 2010 to 74.55 per cent in 2011. The target (currently set at 80 per cent by 2013) presents a sizable challenge in view of the large number of staff with PhDs across the sector likely to retire in the next 5 to 10 years and a known gap in: (a) the pool of persons with doctoral qualifications as a percentage of the workforce; and (b) current HDR enrolments and completion patterns, particularly of domestic doctoral students. Also, the feasibility of entry requirements without a PhD may need to be assessed to attract Aboriginal people to the field of academia. In view of these factors, consideration is being given to other high level measures of staff quality and the strategic alignment of staff with UOW objectives.
• UOWcontinuedtoperformstrongly,andaheadofsectoraverages,in the retention of high-performing staff and, as the essential quality measure, staff critical to UOW’s strategic goals. The attrition of staff (voluntary employee separations) as a percentage of the cohort identified in the Annual Strategic Retention Planning process was 1.5 per cent and therefore exceeded the target of <5 per cent per annum.
• Theacademicpromotionratein2011was5.65percent,exceedingthe target of >4 per cent of continuing academic staff as a percentage of academic full time equivalent staff. Achieving healthy promotion rates, while maintaining standards for promotion will remain a critically important part of refreshing the senior academic workforce given its current age profile. In this context, a vigorous and structured focus on academic career development will need to be underpinned by consistent engagement in the Career Development Record process and expansion of tailored initiatives such as the Early Career Researcher Program, the Research Mentoring Program and teaching development programs and initiatives.
• Performanceenhancementandcareerdevelopmentprocessesarea central mechanism for aligning individual efforts with faculty and unit objectives and recognising individual performance. Shifting performance enhancement planning processes to an online system (CareerNet in 2011) has provided more reliable data on participation in the respective processes. The online system also provides enhanced recording and career management continuity, and feedback has been positive.
• ThegeneralstaffPerformancePlannersandPerformance
Agreements were online for the full year with participation rates of 89 per cent for staff up to Level 6/7 and 86 per cent for senior staff at Level 8/9 and above. It will be important to monitor completion rates in the final review phase to be conducted in the first quarter of 2012.
• AcademicCareerDevelopmentandPerformanceEnhancementprocesses were transferred online in the third quarter of 2011, after extensive consultation, piloting and feedback from users. To date, 38 per cent of academic staff have commenced the process and completion rates will be monitored in 2012. While consistent and reliable data on participation has not been available in prior years, evidence shows that engagement in the process still varies from fully embedded to a ‘just in time’ approach when required for applications for probation and promotion. The University recognises and is promoting the academic leadership that is essential for driving these processes.
• In2011,boththeHeadsofSchoolandSeniorGeneralStaff(levels8/9) leadership programs received very positive evaluations and had strong participation rates. Some 87 per cent of Heads and Associate Deans and 76 per cent of Senior General Staff have now completed the respective leadership programs. Participation in the 360 degree leadership survey is at 44 per cent — which is well below the target of 100 per cent (albeit, over a 2 year period). It is expected that participation in the Deans leadership survey will be at 100 per cent by end of first quarter 2012.
• WorkonbetterintegratingtheDeansCompetencyFrameworkintorecruitment and performance planning will continue in 2012.
2. A mutually supportive, rewarding and equitable work environment
UOW performed above the sector average in all of the 36 survey dimensions of the biennial workforce survey (last conducted in May 2010). Results on the identified indicators of Passion and Progress were 82 per cent and 78 per cent respectively. There are now 37 Australian and New Zealand universities using the ‘Voice Workforce Survey’ instrument which allows for benchmarking. Our results in 2010 remain the highest in the sector. The survey is next scheduled for second Semester 2012.
In 2011, UOW could be proud of a strong culture of celebration for the achievements of staff in all equity groups.
The University achieved the Equal Opportunity for Women in the Workplace Agency (EOWA) Employer of Choice for Women for 2011. This is an important recognition of the programs and strategies in place to support women. Women are well represented in the Senior General Staff at 48 per cent. However, increasing the number of women at the academic senior executive level remains a priority; this remained at 20 per cent during the year. There was a slight increase in the number of female professors, with a concerted effort on the part of the Deans to continue to identify and appoint suitable applicants. There was also strong support for performance relative to opportunity for academic women applying for promotion.
UOW’s targets for Indigenous employment are ambitious and require a high level of commitment and focus to move from the 1.2 per cent achieved in 2011 to reach the target of 2 per cent by 2013. The decision in 2011 to embed the Indigenous Employment Officer into
review: staff

2011 Annual Report 37
the Recruitment team from January 2012 is one initiative towards increasing the number of Indigenous staff, particularly in the academic field.
The Employment Equity and Diversity (EED) Unit also continued to work effectively with Occupational Health and Safety (OH&S) in supporting people with disabilities in the workplace. Mental health has become a focus and new training was introduced to support managers to work with their staff who have mental health challenges.
Overall performance in OH&S was positive but below target in the area of percentage compliance with internal verification audits and lost time injury. The targets are deliberately set high and OH&S performance remains well ahead of sector benchmarks on all measures, including lost time injury.
New Enterprise Agreements for general and academic staff were approved in 2011. The respective agreements provide a competitive benefit and supportive employment framework whilst maintaining balanced flexibility to ensure UOW can respond to opportunities and adapt to changes in meeting its strategic goals.
3. A staff culture that values and demonstrates collaboration and a spirit of enterprise
Teamwork and collaboration have been actively reinforced through inclusion as key UOW competencies in position descriptions, performance plans, selection criteria and leadership programs.
The University successfully negotiated the new and robust Enterprise Agreements with a low level of industrial action (the sole action was in 2009), in contrast to the experience of many other universities across the sector. UOW has also maintained a very low level of formal staff grievances, reflecting an ongoing commitment to good management practices, consultation with our staff, and early and practical intervention where issues have emerged.
PRiORiTiES FOR 2012
> Better visibility and integration of academic, financial and workforce planning at the strategic level including a rolling aligned model with a 3–5 year horizon; a review of the viability and cost effectiveness of academic activities
> Continuous improvement in recruitment> Continuation and expansion of structured programs to support the
growth and accelerated development of early career academics> Integration of Indigenous cultural awareness into training and
development programs> Better integration of the annual Strategic Retention Planning
process> Continued focus on the development of leadership capability,
including use of current feedback tools> Engagement in career development and performance enhancement
processes for staff with a particular focus on academic staff> Faculty engagement in active performance management of
underperforming staff> Continuous improvement in HR business process through
development of HR online systems> Finalisation of the Reconciliation Action Plan and integration of the
strategies into relevant unit and faculty plans
> Revision of EO Online and enforcement of completion prior to probation
> Improvement in female representation in the Senior Executive team> Review of the Affirmative Action Policy for all equity groups
Table 15: Full-time and Fractional Full-time Staff 2007–2011
2007 2008 2009 2010 2011
Academic Activities 1356 1379 1493 1541 1663
Academic Support 202 207 222 234 340
Institution Services 265 272 302 318 336
Other 98 111 110 112 28
Total 1921 1969 2127 2215 2370
Staff Policies and Practices
During 2011, UOW continued to focus on improving recruitment strategies and processes to enhance our competitive edge in attracting high quality staff. Initiatives included a refresh of our recruitment advertising in line with the newly established UOW branding protocols, and a review of our employment website to enhance information for prospective staff and market UOW as a ‘great place to work’.
The annual Vice-Chancellor’s Awards program saw a record number of recipients and record attendance at the annual ceremony in June.
The Human Resources Division maintained high standards in service delivery while introducing a number of initiatives in process improvement and systems enhancement during 2011. These included an upgrade of the personnel/payroll system and enhanced functionality for academic timesheet processing, academic leave management and HR reporting as well as development and implementation of interfaces with other enterprise systems. The CareerNet implementation continued, with academic performance management processes rolled out in the system during 2011. The implementation of the hiring module within this system has been delayed to take advantage of major development enhancements of the baseline product that are currently being undertaken by the vendor.
A new web-based HR information toolkit was launched in 2011. The Manager’s HR Toolkit is designed to help managers across the University do their job more easily by providing easy access and improved navigation to critical HR information needed to effectively undertake their HR responsibilities as a manager or team leader. The toolkit highlights the core HR responsibilities for managers in four key areas: recruiting, onboarding, managing staff and developing staff. The toolkit features embedded links to specific topics for each of these areas.
industrial Relations Policies and Practices
A new Academic Staff Enterprise Agreement was finalised in September and went to ballot in October 2011. Of those staff who participated in the ballot over 96 per cent voted to approve the Agreement. The new Academic Staff Agreement provides for salary increases of 20.5 per cent over the life of the Agreement. This includes administrative increases of 4 per cent paid in 2009, 2010 and 2011 which have been incorporated into the new Agreement.

38 University of Wollongong
The Agreement also contains a new, more contemporary salary structure that will operate from 31 March 2012 and new leave management arrangements for academic staff. The nominal expiry date of the Agreement is 31 December 2013; however, it will continue until another Agreement is made.
In accordance with both the General Staff and Academic Staff Enterprise Agreements, staff received a 4 per cent salary increase on 31 March 2011.
There was no industrial action or formal industrial disputes in 2011.
Overseas Visits by Employees
University of Wollongong employees made 906 visits to 69 international destinations in 2011. The main purpose of these visits was to participate in academic conferences and symposiums, and undertake research and related scholarly activity while on formal study leave.
Professional and Organisational Development
A wide range of training programs were offered to both academic and general staff in 2011. In all, 283 programs had a total of 3,534 staff attendances. This represents an increase of 12 per cent on the number of programs offered in 2010. Requests for tailored professional development interventions with both units and individuals continued with 173 one-to-one training sessions, 40 internal consultancies for work groups across campus and 88 individual coaching sessions.
The focus on leadership development continued with 77 staff (including 7 Deans) participating in the UOW 360 degree Leadership Survey, which is supported by individual debriefing sessions to identify strengths and develop professional development action plans. The Associate Deans, Heads and Potential Leaders Program and the Senior General Staff Leadership Program were conducted with 16 participants in each. These Programs consist of workshops, individual coaching and networking forums. A new six-month Mentoring Program for New Managers was introduced, with 31 managers participating. The program is targeted at new managers or managers new to the University who are matched with experienced managers. The momentum of this program is ensured through regular mentee and mentor networking sessions and monthly newsletters. The Impact@UOW – Leadership in Action Program was also launched. This program is conducted in conjunction with the Centre for Student Engagement and aims to provide management and leadership skills to staff who aspire to move into these positions through partnering them with a group of students to lead a community project. Some of these projects included a trivia night, Cancer Council Relay for Life, Barnardos Big Kids Carnival Day and SCARF Family Day.
As a result of a researcher training needs analysis conducted in 2010, an Early Career Researcher (ECR) Development Program was developed and delivered. A total of 20 staff participated in this twelve-month integrated program which aims to assist career development and provide ECRs with a suite of skills, knowledge and abilities to facilitate a successful research and academic career. The program consisted of core and optional workshops, a two day writing retreat, mentoring from senior researchers and networking forums.
New training programs offered in 2011 included a Career Development Workshop, Introduction to Mindfulness, Strengths Essentials, Presenting your Research with Confidence, Mental Health in the Workplace, Personal Positioning, Ideas Mapping, How to Feel F.R.E.S.H at Work Every Day and Writing for Publication.
Thirteen staff are studying towards their Certificate IV in Business Administration and fourteen staff towards their Diploma of Management. Government incentive funding and a partnership with Origin HR support this initiative.
Occupational health and Safety
The University of Wollongong is committed to providing a working and learning environment which sustains the health and safety of its staff, students, contractors and visitors. Table 16 sets out the University’s OH&S outcomes on key performance indicators in 2011 compared with the previous year. Overall performance was again positive and well above sector benchmarks.
There was an increase in the number of workers compensation claims from 65 in 2010 to 80 in 2011. However, the number of work related lost time injuries further decreased from 4 in 2010 to 2 in 2011. The majority of work related injuries reported were associated with manual handling and poor ergonomic work practices which were minor in nature thereby allowing for a successful early return to work in all instances.
The University’s Lost Time Injury Frequency Rate (LTIFR) was 0.47 which met the target of below 1 for the second year in a row. The Average Time Lost Rate (ATLR) increased from 1.25 days in 2010 to 4.5 days for 2011. While there is an increase in the ATLR figure for 2011, it is noted that this result is volatile given the low number of lost time injuries for the year. This still compares favourably to the Australian universities average of 23.20 days as provided in the QUT Universities HR Benchmarking Survey 2011.
The University implemented several best practice OH&S initiatives throughout the year, including further improvement of the University OH&S management system in accordance with NSW WorkCover requirements. Other initiatives included the Vice-Chancellor’s Awards for Health and Safety and the signing of an Alliance Agreement with WorkCover NSW to further improve health and safety outcomes for the Illawarra.
The number of reported hazards in 2011 was 537 compared to 518 for 2010. Overall, the high level of hazard reporting is seen as a positive indicator as it shows a heightened awareness of reporting OH&S hazards via workplace inspections and allows for the implementation of corrective actions to prevent injuries. A total of 245 safe work procedures were approved utilising the SafetyNet online system in 2011, expanding the online library to over 780 safe work procedures across the University.
The OH&S Unit conducted three internal OH&S Verification Audits which included the following units:
> Printery, Administration > School of Mechanical, Materials and Mechatronics, Faculty of
Engineering> Illawarra Health and Medical Research Institute
review: staff

2011 Annual Report 39
There were 50 OH&S training courses delivered in 2011, which included the following OH&S topics:
> OH&S Principles and Awareness> Applying First Aid and Remote First Aid> Mental Health First Aid> Building Warden Training> Fire Extinguisher Training> OH&S Risk Management> OH&S For Supervisors> Hazardous Substance Awareness> Manual Handling and Ergonomic Practices > Radiation Safety, Biosafety and Laser Safety> Safe Handling of Gases
There were no prosecutions under the Occupational Health and Safety Act 2000 (NSW).
Table 16: Oh&S Outcomes on Key Performance indicators 2010–2011
Key Performance indicator 2010 2011
Loss Time Injury Frequency Rate 0.95 0.47
Average Time Lost Rate 1.25 4.50
Number of Workers Compensation Claims Reported 65 100
Number of Work Related Medically Treated Injuries 26 40
Number of Work Related Lost Time Injuries 4 2
Number of Hazards/Near Misses Reported 557 518
EmPlOymEnT EQUiTy AnD DiVERSiTy
Equity for Women
Several significant appointments were made at the senior level throughout 2011, the most significant being the appointment of Cathy Nicastri, the first female Director of Information Technology Services at the University of Wollongong. Cathy Nicastri has worked in the IT area at the University since 1985 and is an inspirational leader and role model for women working in non-traditional areas. Other significant academic women appointments include Professors in Law, Creative Arts and the Dean of the Graduate School of Medicine.
The percentage of women at senior executive level remained unchanged at 20 per cent and female Associate Professors also remained static at 27 per cent. It is pleasing to see a slight improvement in women at Professorial level, which reached 20 per cent, a 2 per cent increase from 2010. Female general staff at level 8/9 and 10 and above comprise 48 per cent of that level, which is close to the NSW Government’s target of 50 per cent.
The University of Wollongong was awarded the Employer of Choice for Women Citation for 2011 and a submission was made for the 2012 Award. A Pay Equity Audit was conducted for the second year to support this application process. The overall pay equity gap was 20.98 per cent, a slight increase from the 20.4 per cent in 2010. Where a statistically significant pay equity gap for one particular group of staff was identified, further investigation has been undertaken.
Equity Fellowships were awarded to three female academic staff to assist them with relief from teaching to complete a PhD. This program has been very successful since its inception in 2005, with 34 scholarships being awarded and 19 recipients having completed their PhD. All recipients have reported the value of the award in progressing their PhD completion much earlier than would have otherwise been possible.
indigenous Australians
The percentage of Indigenous general staff increased from 1.4 per cent in 2010 to 1.8 per cent in 2011 while that for Indigenous academic staff decreased from 1.3 per cent in 2010 to 1.2 per cent in 2011. The overall rate of Indigenous employment has not kept pace with that of all employment, the latter having grown by 6 per cent over the past 12 months. Initiatives for general staff Indigenous employment, such as the three year Indigenous trainee program, have been very successful in creating ongoing meaningful employment for staff at an entry level.
Lauren Davies, one of the first three year Indigenous Trainees was awarded Indigenous Trainee of the Year 2011 for the Illawarra Region. She has secured a permanent appointment as assistant to the Dean of Law. Lauren has now commenced studying at UOW College with the aim of entering university in 2012.
In order to increase Indigenous academic recruitment, alternative strategies need to be created around entry points and alternative employment models.
The Indigenous Employment Officer position was converted to full-time in March 2011 and will transfer to the Recruitment team from January 2012, with the aim of facilitating an emphasis on recruiting Indigenous Australians into mainstream employment positions as well as for the trainee roles.
Implementation of the Reconciliation Action Plan progressed. An outline of the key areas for action was compiled as a result of focus groups and will now be used as the basis for initial consultation with the broader Indigenous community both within and external to the University.
Support for People with Disabilities
A new University of Wollongong Disability Action Plan 2011–2015 (DAP) was developed and implemented. DAP addresses issues related to students and staff and includes requirements to meet the legislative changes to the Disability Discrimination Act 1992 (Cth). The increasing need for mental health training, the mandatory reporting obligation of health professionals, the use of inclusive teaching and learning practices as well as ongoing campus maintenance and improvement strategies, all form key aspects of the revised Plan.
A Stakeholder Advisory Committee was implemented to improve ownership, accountability and reporting of the allocated actions within the DAP.
The increasing focus on the mental health of both staff and students has required a greater understanding of the rights and responsibilities of employers, employees and students. A series of workshops has been developed, with the first titled Mental Health in the Workplace for Managers. This workshop covers both the legal and ethical

40 University of Wollongong
responsibilities of employers and explores some of the myths surrounding mental health. The workshops were well-received and will continue into 2012 with the second workshop in the series, Student Mental Health – Managing in Your Role as an Academic.
multicultural Policies and Services Program
A new Multicultural Policies and Services Plan 2011–2013 (MPSP) was developed. It is aligned to the comprehensive University planning process. The MPSP draws on ten key strategies from the University Strategic Plan which address the seven areas of the Multicultural Policies and Services Program Requirements and the Planning Framework. The intent is not to have a separate set of strategies but rather develop the MPSP as one of the cascading plans within the suite of unit plans. The success of this will be evaluated in 2012.
In the period 2010–2011, the number of academic and general staff whose first language is not English increased. The percentage of general staff whose first language is other than English increased by 1.5 per cent to 16.9 per cent, and that of academic staff by 1.6 per cent to 27.9 per cent.
University of Wollongong Commerce and Communications student, Gracia Ngoy, was the recipient of the 2011 Australian Young People’s Human Rights Medal, particularly for her work with refugee families. The University has a strong connection with the Illawarra based body, the Strategic Community Assistance for Refugee Families (SCARF), which is one of the organisations benefiting from the outstanding work of this young woman.
Policy Reviews
The University aims to provide a family friendly workplace and study environment whilst maintaining a balance between the safety of children on campus, limiting their exposure to risks, and maintaining equity standards for all employees and students. The Children on Campus Policy was revised and renamed to reflect the intention of the Policy. It is now titled Children in the Workplace and Study Environment Policy and more accurately addresses the needs and concerns in this area.
The Anti-Bullying Policy was revised and is now more appropriately titled the Bullying Prevention Policy. In order to provide a context for the Policy and highlight additional information and resources, a web page titled ‘Bullying Prevention’ has been developed and linked from the Employment Equity and Diversity web site.
The Sexual Harassment Prevention Policy was reviewed and changed to include harassment via social media, and to encompass students living in University accommodation. Priorities for 2012
> Implement strategies to increase the percentage of women in the senior executive team
> Measure the impact of embedding Indigenous employment within the mainstream recruitment processes
> Develop alternative pathways to Indigenous people wishing to move into academic positions
> Work with a local agency for disability employment to develop a pilot three year traineeship for a person with a disability
> Evaluate the revised format of the MPSP> Review the Equal Opportunity and Affirmative Action Policy with the
inclusion of all equity groups
See Appendix F for Employment Equity and Diversity statistics.
review: staff

2011 Annual Report 41
UOW qUaLiTy aNd bUsiNEss kEysTONEs:• Open,ResponsibleGovernanceandBusiness• SocialInclusionandReconciliation• ACommitted,CollegialCulture• TrustandSustainability
QUAliTy & STAnDARDSThe University underwent its second quality audit by the Australian Universities Quality Agency (AUQA) in March 2011. The audit was focused on two themes — Enabling Undergraduate Learning and International Activities. The Audit Panel visited a further five teaching locations in addition to the main campus in Wollongong, including the Sydney Business School campus in Sydney, UOWD in Dubai, and transnational education partner institutions in Singapore and Hong Kong. In all, some 150 staff and 350 students were interviewed during the 11 day audit period.
The Audit Report, released mid-year, found that UOW complied with the Federal Government’s National Protocols (now replaced by the Provider Standards) and commended the University for “the integration of its quality assurance framework and planning processes and for the commitment of its administrative divisions to systematic quality assurance”.
The strongest finding of the Audit Report was that students really value their UOW learning experience and that the University has a strong record in ensuring students, particularly from equity groups, succeed in their studies.
In all, the University received:
> 15 commendations acknowledging its achievements > 12 affirmations endorsing improvement actions that were already
planned or being implemented at the time of the audit, and > 8 recommendations in relation to additional areas identified through
the audit process as needing attention.
The audit preparation, portfolio compilation and the visits themselves encouraged a focused reflection and review. Many quality improvements have been put in place in response to both AUQA’s findings and UOW’s own self-review, and these will continue into 2012. An updated Quality Improvement Plan, approved by Council in October, will ensure that areas identified for improvement are addressed systematically by the University.
ReVIeW: QUALItY AnD BUsIness

42 University of Wollongong
In early 2011, UOW completed a second major cross-institutional benchmarking project on Assessment Policies and Practices with its benchmarking partners — Deakin University and the University of Tasmania. The three partners jointly presented a paper entitled Articulating and Comparing Standards through Benchmarking of Assessment at the Australian Universities Quality Forum in July.
An Assessment Working Party was established in March to implement the recommendations arising from the benchmarking project and, among other things, organised a series of workshops to facilitate academic staff development and the sharing of good practice on assessment.
A third major benchmarking project focusing on Higher Degree Research (HDR) support across the three universities was conducted between April and December 2011. While the final report is not due until March 2012, preliminary findings suggest that UOW compares well in many aspects of HDR support with improvement opportunities in areas such as HDR budget allocation, supervisor training and articulation of learning outcomes.
The AUQA Audit Report reaffirmed UOW’s approach to benchmarking with commendations received for both the 2010 Assessment Project and 2009 Academic Transition Support Project.
The second half of the year was focused on preparations for the new regulatory environment under the Tertiary Education Quality and Standards Agency (TEQSA). Key developments included:
> A UOW Learning & Teaching Strategic Project initiated to develop a framework for setting, monitoring and demonstrating Learning & Teaching Standards at UOW
> A UOW Qualification Standards Review initiated to check compliance with the Australian Qualifications Framework (AQF) and identify actions required by 2015
> University Education Committee (UEC) restructured with a new Standards and Quality Subcommittee established
> UOW’s participation in two external projects funded through the Federal Government and which are likely to influence the evolution of the Australian Higher Education Standards:• TeachingStandardsFrameworkProject(aconsortiumof11
universities led by Macquarie University)• ExternalModerationProject(aconsortiumofuniversitiesledby
Griffith University)
As a result of UOW’s successful AUQA audit, UOW has gained registration under TEQSA until March 2018.
The major priorities for 2012 will be to:
> Continue to play an active role in the development of academic standards for the higher education sector
> Develop a coherent framework for setting, monitoring and demonstrating Learning & Teaching Standards at UOW
> Ensure UOW’s compliance with the new Thresholds Standards, including the AQF requirements
> Review the relationship between institutional risk assessment and academic risk assessment, and to align the ITC/UOWD academic risk assessment more closely with the UOW process
> Continue to implement improvements identified through self reviews, benchmarking projects and external audits
> Further develop benchmarking relationships, with the potential for a new international benchmarking project with a focus on academic promotion
> Develop an improved online environment for reporting comparative data used to monitor performance of student cohorts by entry pathway, mode of study and place of study
RiSK mAnAGEmEnTUOW risk management policy is based on the ISO31000 Risk Management Principles and Guidelines, and this has been articulated in practice through various UOW Internal Audit (UOWIA) assessments, academic risk assessments, anti-fraud and anti-corruption approaches, operational self-assessments, the UOW Strategic Risk Register and Audit Management and Review Committee perspectives.
An update to the University’s Key Risk Assessment was conducted in 2011 with primary inputs from the senior executive team. The outcomes were 6 revised strategic risks accompanied by 17 revised key operational risks. The risk management matrix was also updated to reflect current risk appetites and sector realities.
UOWIA reported to the Audit Management and Review Committee three times in 2011 on the implementation completion rate of agreed risk-significant actions from UOWIA Reports. The Committee was given risk profile updates from three main controlled entities and also had fraud statistics reported to them. In addition, regular financial statement updates and risk scan discussions by senior executives were provided at Committee meetings.
The Committee met four times during 2011. The UOW Internal Audit Charter was also updated and approved by the Committee.
internal Audit
The UOWIA 2011 Work Program continued to be conducted with an independent, ethical and objective mindset and access to staff members, records and documentation at all levels. UOWIA is focused on ensuring compliance with the International Professional Practices Framework as prescribed by the Institute of Internal Auditors Australia (IIA-Australia). It utilised trained and qualified personnel to provide value to risk management owners. The UOWIA Unit worked closely with teams in the Strategic Planning and Quality Unit and the Policy and Governance Unit of the Academic Registrar’s Division (ARD) to ensure consistent and quality risk management.
Apart from a set of annual regular activities, the UOWIA 2011 Work Program consisted of 16 discrete reviews/evaluations that ensured compliance, assurance, controls evaluation and risk mitigation in key processes and suggested best practice improvement options for risk owners. Examples of areas examined are: IT shared services review, capital and investment planning, examinations processes, research funding performance, and accounts payable analytics. Up to 25 research grants were reviewed by the UOWIA Manager for incurred financial expenditures.
review: QualitY aND BusiNess

2011 Annual Report 43
COmPlAinTS mAnAGEmEnTThe University of Wollongong works to manage complaints in a manner that is consistent with the relevant principles embodied in the Strategic Plan 2011–2013, including:
> Excellence> Integrity> Mutual respect and collegiality> Diversity of cultures, ideas and peoples> Foresight, quality and accountability as an institution> Equity and social justice
Consistent with these principles, the University seeks to identify, appropriately investigate and respond to complaints, grievances and concerns raised by students.
The University provides students with access to a student complaints webpage: www.uow.edu.au/student/complaints/index.html. Students who cannot resolve matters at the University are able to take their concerns externally, for example by approaching the NSW Ombudsman’s Office.
The Dean of Students is the University’s student ombudsman and plays a key role in examining and resolving more serious student complaints. Students are also able to consult Student Support Advisers who are attached to all faculties.
In addition, Student Advocacy Officers represent the interest of students in areas that impact on the quality of their experience whilst studying at the University of Wollongong. The positions are independent of the University and report to the presidents of the undergraduate and postgraduate student associations. In 2011, the Student Advocacy Service was expanded to include an additional part-time officer in order to meet continuing demand for this service.
The University continues to work to improve its complaints and feedback systems to give students more effective and accessible mechanisms through which to raise concerns. Efforts to more broadly promote the feedback system, feedback@UOW, as the central portal through which feedback is received and managed, have resulted in an increase in both the number and quality of student complaints. The feedback system is managed by Student Central, the University’s student service hub. In 2011, we received 539 complaints through the UOW feedback system. Signalling the greater emphasis given to attracting complaints and other feedback, this represents a fivefold increase over the number of complaints received via the feedback system in 2010. Separate feedback channels exist for specific concerns, such as those relating to the Library, privacy, personnel issues, parking, security, and UOW Administration.
The University’s policy framework for complaints management is built around three key policies, which can be accessed on the University Policy Directory:
> Academic Grievance Policy (Coursework and Honours Students) > Academic Grievance Policy (Higher Degree Research Students) > Grievance Policy
The University is finalising a major overhaul of these policies to simplify the complaints process and reduce the number of steps involved in resolving a complaint. In 2012, the University will also review the way
students can lodge complaints. The aim of this review is to ensure that students are able to access clear and simple complaints lodgement processes. The University is working to ensure the complexity of the policy framework against which complaints are judged is not a deterrent for students who are aggrieved from raising their concerns and having them dealt with fairly and promptly.
FinAnCiAl mAnAGEmEnTThe University and its controlled entities recorded a surplus consolidated operating result of $37.8 million for the year ended 31 December 2011.
The results for the parent and subsidiaries for 2011 compared to the prior year are shown in Table 17.
The surplus for 2011 was a result of continued growth in domestic student revenue tempered by a softening in international student enrolments, offset by moderate increases in operating expenditure; significant success in attracting capital funding, and continued investment in research and infrastructure.
Table 17: Consolidated Operating Result 2010–2011
2011 2010
Consolidated Operating Result ($’000) 37,766 100,567
University Parent 38,173 100,400
ITC 2,933 3,555
Unicentre 141 386
URAC (681) (975)

44 University of Wollongong
2011 University (Parent Entity) Financial Performance
The following commentary focuses on the University parent entity, excluding its controlled entities.
Strategic plan performance indicators
Underlying operating result 3 per cent of operating income (net of capital grants and depreciation)
The result for 2011 was 5.5 per cent (compared to a five year average of 8.2 per cent). Recognition of academic annual leave and a fall in international onshore student revenue negatively impacted on the result.
Figure 9: Underlying Operating Result 2007–2011
16.0%
14.0%
12.0%
10.0%
8.0%
6.0%
4.0%
2.0%
0.0%
20112010200920082007
Current ratio greater than or equal to 1.8
The ratio for 2011 was 2.44, above the strategic target. The slight reduction from previous years reflects utilisation of cash from grants received for major capital projects.
Figure 10: Current Ratio 2007–2011
3.00
2.50
2.00
1.50
1.00
0.50
0.00
20112010200920082007
Debt to Equity Ratio no greater than 15 per cent
The ratio for 2011 was 11 per cent, within the strategic target and similar to 2010. Additional borrowings in 2010 increased the ratio at that time.
Figure 11: Debt to Equity Ratio 2007–2011
14%
12%
10%
8%
6%
4%
2%
0%
20112010200920082007
Debt service coverage ratio greater than or equal to 8
The ratio for 2011 was 11.25, above the strategic target. A decrease in international onshore student revenue and reduction in capital grants has seen the ratio decline compared to recent years.
Figure 12: Debt Service Coverage Ratio 2007–2011
40.00
35.00
30.00
25.00
20.00
15.00
10.00
5.00
0.00
20112010200920082007
The University has also maintained its AA/A-1+ stable Standard and Poor’s credit rating. The University has maintained the rating since 2006.
Further details about the University’s financial performance are outlined in the financial performance chapter of this report.
review: QualitY aND BusiNess

2011 Annual Report 45
innOVATiOn CAmPUSIn May 2011, the Innovation Campus (iC) was awarded the prestigious national ‘Best Business and Industrial Park’ award in the Innovation and Excellence Awards of the Australian Property Council.
A further milestone in the growth of the Innovation Campus was reached in June when construction of the 4.5 star rated Enterprise 1 building was completed, meeting the construction schedule of this 10,000 square metre leading edge office building. Occupants of the building include BHP Billiton-Illawarra Coal, NSW Cancer Council, Tickets.com, MphasiS, CoMMscope and Australian Health Services Research Institute.
In officially opening the Enterprise 1 Building on 1 September, the Premier of NSW, the Hon Barry O’Farrell, said “It’s not surprising that successive state governments would stand beside the University of Wollongong. What you are doing here [at the Innovation Campus] is critical to a region with many strengths.”
The Innovation Campus was again recognised for excellence with the Enterprise 1 Building winning the Commercial Buildings ($20–$50 million) category of the NSW Master Builders Association Excellence in Construction Awards.
The Australian Institute for Innovative Materials – Processing and Devices (AIIM P&D) Facility, a 5,000 square metre building and the largest research building on the iC, was completed in August, with research staff and students progressively occupying the building in conjunction with the installation and commissioning of sophisticated best practice research equipment. The AIIM P&D Facility is an Australian first, offering the innovative processes and facilities required to take multifunctional materials from fundamental research to proof of concept, using novel fabrication methods. Funded by the Australian Government, the facility will focus on nano-science and nano-technologies. The Facility was recognised in the 2011 NSW Master Builders Association Excellence in Construction Awards for ‘Best Use of Timber’.
Prime Minister Julia Gillard chose the AIIM P&D Facility as the venue for a roundtable meeting that she chaired in August 2011 on the future of the Illawarra regional economy.
Development continues apace with planning consent issued by Wollongong City Council for a grey water recycling project. Construction and commissioning are expected to be completed in the first quarter of 2012.
Planning approval was also received for the Sustainable Buildings Research Centre, with site works, foundation construction and piling commencing in November 2011. The 2,700 square metre SBRC, which will be the seventh building at the Innovation Campus, has been designed to allow collaboration and partnership between researchers and industry to meet the challenge of improving the energy efficiency and sustainability of Australia’s built environment. The $26 million research centre, funded by the Federal Government, will include the Illawarra’s first 6 Green Star rated building and will lead the way in sustainable building research.
Significant internal road works to link the northern and central parts of the site were completed, creating Innovation Way as the main north-south road at iC.
PROPERTy AnD inFRASTRUCTURE
Wollongong Campus
Construction of the $62 million SMART (Simulation, Modelling and Analysis for Research and Teaching) Infrastructure Facility commenced in May 2009 and was completed in January 2011. The SMART Infrastructure Facility, with a gross floor area of some 12,000 square metres across four levels, commenced operations as a world-class comprehensive research and training facility with 30 integrated laboratories, connected by a national simulation and infrastructure data centre, and designed to transform the way in which infrastructure-related disciplines are taught and researched. The building was officially opened on 11 November by the Federal Minister for Infrastructure and Transport, the Hon Anthony Albanese MP. The building went on to win the Master Builders Association of NSW Excellence in Construction Award for ‘Tertiary Buildings in the $20–50 million range’.
Also completed in January was a 2,160 square metre Common Teaching Building (Building 24) which can accommodate 568 students within 12 teaching spaces. Building 24 is located centrally on the campus and extends over three levels. The total project cost was $8 million and the building was ready for operation at the commencement of Autumn Session.
UniCentre (Building 11), which houses the majority of student leisure and retail facilities, was refurbished to provide a range of casual meeting areas and upgraded facilities. The refreshed space includes new food and beverage outlets, an atrium covered food court, a student lounge with leisure reading spaces, informal and formal meeting areas, interactive games areas and a multi-use exhibition space. This refurbishment has also significantly increased campus indoor seating. The $6.8 million refurbishment works commenced in February 2010 and were completed in April 2011.
The development of a Nursing Simulation Centre was commenced within the Sciences Building (Building 41) in September 2011. The $1.3 million project will provide four nursing laboratory rooms with accommodation for twelve beds in total, and two simulation laboratories that can be configured for different training environments, such as a medical consulting room or a home visit. Also included will be two breakout rooms (smaller subsidiary learning and teaching spaces), equipment and general storage areas, standardised patient bathroom/change room facilities, and office space. The Centre is scheduled to be completed in January 2012.
Civil works commenced in September in preparation for the construction of a 360 bed student accommodation building at the western end of campus, facing Robsons Road. Construction of the $42 million Kooloobong Stage 2 development will commence early in 2012, with completion in early 2013. The project will significantly increase the number of students able to be housed on the Wollongong campus and will include a number of green initiatives, including rainwater harvesting, energy and water efficient fittings and the use of sustainable construction techniques.
A staged refurbishment of the Arts Building (Building 19) continues. Following the completion of the new $1.4 million Languages Centre in December 2010, further work valued at $4 million has commenced,

46 University of Wollongong
with upgrades to meet current building code requirements, clear a maintenance backlog and undertake preventative maintenance. Also included is a functional upgrade including improved amenities, an upgrade to common teaching areas, postgraduate study spaces and a new main entrance. This upgrade commenced in November 2011 and will be completed by January 2013.
UOW batemans bay
Construction commenced in June 2011 on a $2.5 million expansion of UOW Batemans Bay, which commenced operations in 2000. This expansion is being carried out with, and jointly funded by, partners TAFE NSW Illawarra Institute and Eurobodalla Shire Council. UOW’s contribution is $1.9 million. The project will provide further teaching spaces, offices, facilities and an expansion of the library. Construction is scheduled for completion in February 2012, ready for the commencement of the academic year.
Student Accommodation at bowral
Construction of five four-bedroom town houses to accommodate students attending the Graduate School of Medicine commenced in August 2011. The $2 million project, which will also provide administration and tutorial space, is scheduled for completion by July 2012.
Student Accommodation at mudgee
Construction of a five-bedroom house to accommodate students from the Graduate School of Medicine commenced in December 2011. The $500,000 project is scheduled for completion by July 2012.
heritage management
UOW has three former Commonwealth Migrant Hostel ‘Nissen’ and ‘Quonset’ Huts at the Innovation Campus. In 2006, these huts were refurbished for adaptive reuse as a childcare facility in accordance with Heritage Council requirements. The huts were listed on the State Heritage Register (Listing No 01767) in 2009.
A Heritage Asset Management Strategy (HAMS) for the three listed huts was submitted to the Heritage Branch, NSW Department of Planning, in June 2010, as required under section 170 of the Heritage Act 1977 (NSW).
EnViROnmEnTAl PERFORmAnCE
major Environmental highlights for 2011
• EnvironmentalSustainabilityInitiatives(ESI)teamwona$250,000grant for a Grey Water Reuse project at the Innovation Campus and a further $114,000 for stormwater reuse in the McKinnon Lawn (both grants being from the NSW Government Office of Water).
• Installationof514kilolitresofundergroundstorageintheMcKinnonLawn for use in toilet flushing on the Ground and First floors, Building 67, the McKinnon Pond and associated irrigation.
• Installationofa367kilolitrerainwaterstoragetankbetweenOvals1 and 3 to supplement oval irrigation.
• Installationoftwo22.5kilolitrerainwatertanksatBuilding70for
toilet flushing and irrigation of the Nursery.• ReductionofpotablewateruseattheWollongongCampusby24
per cent compared to 2010.• Energyreductionactionssaving$220,000annuallyinelectricity
charges.• SuccessfulcompostingtrialconductedwithUniCentrefoodoutlets.• The‘OneLessCup’campaignsavedover60,000cupsgoingto
landfill in 2011.
Environmental initiatives
Numerous initiatives were implemented during 2011 that work towards achieving the objectives and targets outlined in the University Environment Management Plan 2010–2013.
Energy management
• TheUniversitycontinuedtopurchase15percentofitselectricityas ‘Green Power’.
• UOWcontinuedtoimplementenergysavingsimprovementsatWollongong Campus as part of its Energy Savings Action Plan (ESAP). ESAP projects are generating over $220,000 savings annually.
• A9.4kilowattsolargridconnectsystemwasinstalledattheUniCentre-operated South Coast Workers Childcare Centre. The system attracts the NSW Government’s 60 cents per kW rebate, and is expected to generate around 15,800 kWh and save 15.9 tonnes of CO2 per annum.
• ImplementationoftheWollongongCampusUtilityMonitoringand Management System continued throughout the year. On completion, this system will enable more effective monitoring and improved management of the energy consumed.
• TheUniversityparticipatedinEarthHour,aninternationalcampaignto reduce power consumption and encourage staff to switch off unnecessary equipment. An ‘I’m off for Christmas’ campaign was also launched for the 2011/2012 Christmas break.
• Underthe National Greenhouse and Energy Reporting Act 2002 (Cth) (NGER), the University triggered the reporting requirement for the Wollongong Campus in 2008 and therefore prepared its first report in October 2009, and is now required to report to the Commonwealth Government annually in October. For the financial year 2010/2011 the Wollongong campus consumed 167 terajoules (TJ) of energy and emitted 34 kilotonnes (kt) of CO2-e (carbon dioxide emission equivalent).
• WiththeaidofpartfundingfromthethenNSWDepartmentof Environment, Climate Change and Water, an energy audit was conducted of Campus East as well as the Innovation and Shoalhaven Campuses. These audits will provide the relevant information to implement actions to reduce energy consumption at these sites.
Water management
• UOWcontinuedtoimplementwatersavingsimprovementsatWollongong Campus as part of its Water Savings Action Plan. During the year, with the support of Sydney Water, Wollongong Campus and Campus East revenue water meters were fitted with automatic reading equipment which allows access to hourly
review: QualitY aND BusiNess

2011 Annual Report 47
consumption data via a web portal. This data, along with the automatic and manual reading programs of our private meters, allowed the location and rectification of several significant water leaks within the potable water reticulation system. This arrangement now provides an ongoing monitoring tool for the early detection of water leakages.
• Theinstallationof514kilolitresofrainwatercapturewithintheMcKinnon precinct was completed, with harvested water to be utilised within the McKinnon Building for toilet flushing on the Ground and First Floors and used to top up the McKinnon Pond and associated irrigation.
• Installationofa367kilolitrerainwatertankwascompletedbetween Ovals 1 and 3. This will reduce the amount of water sourced from Sydney Water to irrigate the ovals.
• Two22.5kilolitretankswereinstalledatBuilding70(EcologicalResearch Station) to supplement the existing 20 kilolitre tank.
• AreportwaspreparedbyGHDtoimproveexistingwaterstorageusage.
• UOWwonagrantof$250,000forgreywaterreuseattheInnovation Campus and another $114,000 for the McKinnon Lawn project from the NSW Office of Water.
Waste management
• UOWindoorrecyclingprogramhascontinuedattheWollongongCampus with ongoing support, including the provision of resources and education of staff about recycling.
• WollongongCampusrecyclingrateincreasedto35percentin2011.
• UOWcontinuedtoencouragetheswitchfromdisposabletoreusable cups via the ‘One Less Cup’ campaign. In 2011 the use of Keep Cups by participants saved over 60,000 disposable cups going to landfill.
• UOWhosteditsbiannuale-wastecollectioneventinAprilandSeptember which was led by ESI staff with significant support by numerous faculty and divisional staff. In April, 217 items were collected weighing a total of 2.5 tonnes, and in September a further 281 items were collected, totalling a further 4.7 tonnes. Items collected from the University were sent to a local e-waste recycler in Wollongong to have components reused or recycled. Only 1 per cent of the collected e-waste went to landfill.
• TheUOWMobilePhoneRecyclingprogramcontinuedduring2011.• TheUOWTonerRecyclingprogramalsocontinuedatthe
Wollongong Campus.• AcompostingtrialwascarriedoutwithUniCentrefoodoutletsto
examine the mode of collection, amount collected and other data. Due to the success of this trial a full scale composting trial will be carried out in 2012.
Campus Environment
• During2011,over200hourswerespentonspecialistbushregeneration activities in remnant native bushland across the Wollongong Campus. In addition, more than 200 local native plants were planted in these remnant bushland areas of the campus.
• NationalTreeDay2011activitiesinvolvedabout20staffandstudents planting native plants on a bush regeneration site on Campus.
• AreviewandupdateoftheUniversity’sbuildingdesignstandardswas conducted to improve the environmental performance for new buildings and renovations, and to incorporate Ecologically Sustainable Development (ESD) principles.
Communication and Engagement
• TheESIteampresentedupdatesofenvironmentalperformanceatfaculty staff meetings throughout the year.
• TheUOWstaffenvironmentalchampionprogramcontinuedwith over 80 staff involved from various faculties, divisions and campuses.
Research, Teaching and learning
• ESIwonagrantincollaborationwithMarineScienceandEducationto provide a Marine Touch Pond as a mobile resource for primary schools. Students from Marine Science and Education will be paid to develop and present the Pond consistent with the NSW curriculum. The work will enable students to gain experience in presenting an experiential learning tool to primary schools in the Illawarra.
Environmental Performance at a Glance
Figure 13: Wollongong Campus Waste and Recycling (Kilograms) 2009–2011
900,000800,000700,000600,000500,000400,000300,000200,000100,000
0
2009 2010 2011
Mixed
Recycling

48 University of Wollongong
Figure 14: Wollongong Campus Water Usage (Kilolitres) 2009–2011
200,000
160,000
120,000
80,000
40,000
0
2009 2010 2011
Figure 15: Wollongong Campus Energy Usage (Gigajoules) 2009–2011
120,000
100,000
80,000
60,000
40,000
20,000
0
2009 2010 2011
Gas
Green Energy Purchase
Electricity
Figure 16: innovation Campus Water Usage (Kilolitres) 2009–2011
14,00012,00010,000
8,0006,0004,0002,000
0
2009 2010 2011
Figure 17: innovation Campus Energy Usage (Gigajoules) 2009–2011
20,000
16,000
12,000
8,000
4,000
0
2009 2010 2011
Gas
Green Energy Purchase
Electricity
Figure 18: Shoalhaven Campus Water Usage (Kilolitres) 2009–2011
2,500
2,000
1,500
1,000
500
0
2009 2010 2011
Figure 19: Shoalhaven Campus Energy Usage (Gigajoules) 2009–2011
2,000
1,600
1,200
800
400
0
2009 2010 2011
Gas
Green Energy Purchase
Electricity
review: QualitY aND BusiNess

2011 Annual Report 49
inFORmATiOn TEChnOlOGy SERViCESThe year 2011 saw ITS continue its focus on the delivery of infrastructure projects, business and process solutions, along with an emphasis on engagement. The progress of ITS activities was monitored by the IT Policy Advisory Committee (ITPAC), while the IT Forum facilitated an open dialogue with faculties and units.
The ability to deliver core services is crucial to the success of any support entity. In 2011, ITS achieved an average availability of 99 per cent for core services and applications and a 77 per cent completion rate on infrastructure projects within the Project Management Office (PMO).
The 2011 IT Infrastructure Program included flagship initiatives such as SMART, which saw the delivery and support of specialised research technologies.
During this period the rollout of the new University network continued, providing numerous benefits to the occupants of Buildings 1, 16, 39C, Koolobong and Uni Lodge. The Sydney Business School and Shoalhaven Hospital also benefitted from significant network development activities.
In recognition of the institution’s ever increasing data storage needs and the criticality of business continuity, 2011 saw the renewal of tape and storage systems along with a significant boost to disaster recovery capability through the introduction of a new data centre at the Innovation Campus.
Shared service initiatives continued with the aim of improving operations and support. The shared services print model was deployed to numerous faculties and remote sites, whilst shared support arrangements were expanded to include the operations of the AIIM P&D Facility. To support teaching and research needs, ITS procured a University-wide licence of a numeric computing application called Matlab and expanded coverage of SAS/JMP to support new opportunities in the Faculty of Engineering. In supporting the enterprise more than 20 applications underwent significant upgrades, including core human resource, finance and records management systems. Over one million records were migrated to the new records management system.
Enhancing the user experience is at the core of ITS values. In 2011 significant upgrades were completed on key information systems such as the Student Management systems (Student Management Package (SMP)) and Research Information System (RIS). These upgrades provided additional functionality whilst ensuring UOW met its legislative requirements. Further demonstrating this core ITS value is the implementation of the Google Search Appliance, which improved the quality and customisation of the search function on UOW websites.
As part of broadening ITS engagement with the University community, a new position was created to guide the implementation of IT solutions to support research, teaching and innovation. Throughout 2011, ITS ran a number of activities with the aim of developing awareness and understanding. Examples include the iPad in Tertiary Education Seminar, an ever-increasing program of workshops to raise awareness of the High Performance Computing facilities available to researchers, and a project engagement exercise from the ITS Project Management Office.
PRiVACyThe University is committed to protecting the privacy of each individual’s personal and health information as required under the NSW Privacy and Personal Information Protection Act 1998 (PPIPA) and Health Records and Information Privacy Act 2002 (HRIPA).
In 2011, comprehensive privacy training sessions continued for all University staff. These sessions were conducted as part of the University’s staff induction program and delivered via face-to-face workshops. The University also provides detailed privacy information on its website, through its Privacy Policy and Privacy Management Plan (which are currently under review) and its fact sheet entitled ‘Privacy and You’. Privacy awareness workshops are also conducted for specific areas of the University upon request.
The University received two privacy complaints in 2011 and internal reviews were conducted in compliance with privacy legislation. After careful investigation of these complaints, the University did not find any evidence to indicate that there had been a breach of privacy by the University. As is required under legislation, both determinations were referred to the Office of the Privacy Commissioner NSW for review and comment prior to finalisation and issuing of determination to the complainants. The Office of the Privacy Commissioner did not make any submissions regarding the determinations. The complainant of one of these matters lodged a review with the Administrative Decisions Tribunal in late 2011. This review will be conducted in 2012.
No privacy complaints were referred to the University by the Office of the Privacy Commissioner in 2011.
Many requests for privacy advice were received from University staff in relation to documents, procedures or specific requests for information, and the Privacy Officers (located within the Legal Services Unit) satisfied these requests.
ACCESS TO inFORmATiOn AnD FREEDOm OF inFORmATiOnThe University continued to comply with the requirements of the Government Information Pubic Access Act 2002 (NSW) (GIPA) during 2011. A wide range of organisational information, including the University’s key publications, policy documents and the University Register of Contracts can be accessed on the University’s website free of charge. Information not already available on the University website, including personal information, can be obtained by submitting an informal request or a formal access application.
The University has proactively released information through its website, media releases and public lectures and conferences to the University community and the public. This information includes updates on its major projects, latest research directions, and community and international engagement. The News and Media section of the website provides the latest news, media releases, newsletters and Campus magazines.

50 University of Wollongong
During 2011, the University received three formal GIPA applications, and these were determined within the statutory timeframe. Of those three applications:
• thefirstapplicantwasgrantedaccessinfulltoallinformationrequested.
• thesecondapplicantwasgrantedaccessinfullwheretheUniversity held the information requested, but some information requested was not held by the University.
• thethirdapplicantrequestedinformationthatwasnotheldbytheUniversity. This application was the subject of an internal review, where it was further confirmed that no information was held.
The University also received one invalid application. The University provided the applicant with information regarding the actions required to make the application valid, but the University did not receive any further submissions from the applicant.
The University did not refuse any access applications, either wholly or in part, where there was a conclusive presumption of overriding public interest against disclosure. See Appendix E for the GIPA statistical information.
In 2011, the University was a consulted party on four Commonwealth freedom of information (FOI) applications lodged with Australian Commonwealth agencies that concerned University material.
lEGiSlATiVE ChAnGES At its October meeting, the University Council was advised of the NSW Universities Governing Bodies Bill 2011 (the Bill), which proposed to amend university Acts in NSW to provide for the removal from office of the Chancellor or Deputy Chancellor on the recommendation of a two thirds majority of Council; to allow for Council to remunerate its members if it wishes; and, to permit the use of video and phone conferencing for Council meetings if Council so determines. These provisions were inserted into the University of Wollongong Act 1989 (NSW) when the Bill was passed at the end of October.
The Act also now includes more flexible Council membership provisions, which are offered on an opt-in basis. In December 2011, the University Council resolved to adopt these provisions and resolved to alter the balance of Council and ministerial appointed members on the University Council from three Council and six Ministerial members to seven Council and two Ministerial members.
The Higher Education Support Amendment (Demand Driven Funding System and Other Measures) Bill 2011 was passed by the Commonwealth. The introduction of the student demand driven funding for bachelor level undergraduates from 1 January 2012 means that universities will be funded based on student demand rather than a predetermined number of places on offer. This legislation allows universities and the Government to have in place funding agreements for 2012, altering the Commonwealth Grants Scheme to provide Commonwealth funding for the actual number of students enrolled. These agreements will identify the number of postgraduate places and medical places to be funded, but will not specify numbers for undergraduate places (excluding medicine). Furthermore this legislation abolishes the Student Learning Entitlement. This will ensure that higher education students no longer have a limit placed on
how much study they can undertake as a Commonwealth supported student.
Another significant legislative change was the Higher Education Legislation Amendment (Student Services and Amenities) Bill 2011 (the SSA Bill) which was passed by the Commonwealth in October 2011. The legislation amended the Higher Education Support Act 2003 (Cth) and Income Tax Assessment Act 1936 (Cth) to allow higher education providers to impose an annual compulsory student services and amenities fee (currently capped at $263 per student) from 1 January 2012. At its December meeting, the University Council resolved to impose the full fee for full-time students at the Wollongong campus, and 50% of the fee for part-time students and students at regional campuses, from 1 January 2012.
Other legislative changes affecting the University included the reduction of the 20 per cent discount on HECS HELP upfront payments to 10 per cent and reducing the 10 per cent voluntary HECS HELP repayment bonus to 5 per cent; changes in the visa points test for international students; and the replacement of Australian Learning and Teaching Council with the Office for Teaching and Learning.
review: QualitY aND BusiNess

2011 Annual Report 51
cONTrOLLEd ENTiTiEs
iTC lTDITC Ltd (ITC) is the largest subsidiary of the University of Wollongong. ITC operates as a company limited by shares with an independent Board of Directors. It has been a preferred vehicle for the University to identify and develop new commercial education ventures for some 20 years and continues to pursue new opportunities, most recently in the Australian higher education and vocational education sectors, and in the Middle East.
Currently, ITC delivers high quality education in the higher education and vocational education sectors, both domestically and internationally. The ITC portfolio includes:
> University of Wollongong Dubai (UOWD) > UOW College> International Film School Sydney (IFSS) > International Training and Careers College (ITCC) > Management of the University’s Departments of External Relations
and UniAdvice
This adds value to the University in the following ways:
> Contributing to the University’s international reputation through its subsidiary operations, particularly in Dubai
> Providing dividends to the University of $14 million over the past three years (2009–2011), with a focus on funding University research priorities
> Students articulating into the University from UOW College, with an estimated value to UOW of $21 million per annum
> Provision of a variety of vocational pathways into the University> Cost effective administration of core services.
The year in Review
A dividend of $4 million was paid to the University in May 2011. UOWD had a record number of new enrolments with a year-on-year growth in new enrolments of 40 per cent. The predicted decline in the onshore international student market saw related enrolments at UOW College decline from the peak of 2010, although total UOW College enrolments exceeded Budget. Onshore international student commencements for the University (recruited through UniAdvice and in collaboration with UOW support units) declined by 13 per cent, consistent with the experience of similar peers within the Australian university sector. Domestic student enrolments held strongly, with UniAdvice recording an increase for the University of 4 per cent. In ITC’s commercial vocational education operations, IFSS recorded a 16 per cent increase in revenues and ITCC enrolled its first qualifications students.
Additional successes achieved in 2011 were:
> The first full AUQA Audit for UOW College resulted in a very positive report
> ITC Corporate and support divisions gained recertification for ISO9001
> The Innovation in Educational Technology Project developed the first smart device application for UOW College
> ITC was a finalist in the Equal Opportunity for Women in the Workplace Agency (EOWA) Business Achievement Awards for being a Leading Organisation for the Advancement of Women with less than 800 employees
business Development
The focus for 2011 was to review all new education ventures to ensure long term sustainable returns, and to build a pipeline of new programs across all business units. The focus on the Australian vocational education market was maintained, with IFSS and ITCC continuing to be nurtured and grown. Operations at the International School of Aviation Australia ceased at the end of 2011 with activities being merged with an external aviation school.
Across the organisation, the pipeline of new courses increased substantially with three new degrees, one new Higher Education diploma and six new vocational qualifications gaining approval and being ready for launch by the end of 2011.
UOWD
UOWD celebrated 18 years of providing quality education in the United Arab Emirates (UAE). In 2011,
• UOWDcontributedstronglytoapositiveoutcomeintheUOWAUQA Audit.
• Revenuegrewby3.2percentand,moreimportantly,theenrolmentpipeline grew strongly with a record number of new enrolments (1,371 students) being achieved, representing year-on-year growth of 40 per cent.
• Amilestoneofover5,000graduateswasreached.• UOWDbecamethefirstprivateuniversityintheUAEtocommence
PhD and DBA programs. • UOWD’sculturallydiversestudentpopulationcomprisedalmost
100 nationalities.• Threenewdegreeprogramsreceivedtheirinitialaccreditation,
three received their full accreditation, and reaccreditation submissions were made for a further 10 programs.
UOW College
• UOWCollegehaditsfirstinstitutionwideAUQAAudit.Thefeedback was very positive, with the College receiving ten commendations, nine affirmations and eight recommendations.
• UOWCollegewasrebrandedfromWollongongCollegeAustraliainJune 2011.
• UniversityAccessProgram(UAP)students’shareofenrolmentsincreased in the last four years to 20–25 per cent of academic enrolments (up from 10–15 per cent).
• StudentnumbersintheEnglishLanguageIntensiveCoursesforOverseas Students (ELICOS) program remained solid at over 1,500 despite the overall decline in the international student market.

52 University of Wollongong
• 7,130candidatesundertookInternationalEnglishLanguageTestingSystem (IELTS) testing in 2011, approximately 1 per cent above target in a volatile market.
• TheDiplomaofCommunicationandMediaStudieswasdeveloped,which will articulate into the UOW Bachelor degree.
• Asmartdeviceapplicationwasdevelopedandimplementedtoenable mobile learning and easier access to student services.
international Film School Sydney (iFSS)
• A16percentincreaseinenrolmentsbroughtthetotalstudentnumbers to 112.
• DirectingTeacherDeanFrancis’film‘RoadTrain’wasawarded‘Best Soundtrack Album’ (composer Rafael May) at the 2011 Australian Performing Right Association / Australian Guild of Screen Composers (APRA AGSC) Screen Music Awards.
• ProducingTeacherAndrewWilliams’film‘AsLifeGoesOn’waslaunched at Sydney’s Parliament House to celebrate World Elder Abuse Awareness Day.
• StudentsShaneBorza(‘TheBigStone’)andDanielStephens(‘Father Strickland’) won Audience Choice Awards at the 2011 Sydney Underground Film Festival.
international Training and Careers College (iTCC)
In its second year of operation, ITCC launched six new vocational qualifications, taking its total offering to eight. ITCC has also been approved to be part of the NSW Department of Education and Training’s ‘Apprentice and Traineeship Training Program’.
Services to UOW
ITC continued to deliver efficient and effective marketing, student recruitment, public affairs and community relations services to the University through its UniAdvice and External Relations teams.
• ThecostoftheUniversity’sinternationalrecruitmentactivities,managed through UniAdvice in collaboration with UOW support units and benchmarked by the Australian Universities International Directors Forum (AUIDF), showed international recruitment costs to be 1.5 per cent lower than the national mean and 2.3 per cent lower than the national average. Its international student conversion rates were 33.5 per cent as against a national mean of 23.9 per cent and a national average of 25.9 per cent.
• ExternalRelationsdeliveredanumberofstrategiesandactivitiesfor the University’s 60th Anniversary, including an exhibition at the University Library, Living History Sessions, and publication of a history of the University, ‘Regional Icon, Global Achiever’, written by ITC’s Media Consultant Nick Hartgerink.
• ITCandUOWRegulatoryAffairsManager,PaulO’Halloran,wasrecognised by the International Education Association of Australia (IEAA) for his distinguished contribution to international education in Australia.
• TheOfficeofCommunityandPartnershipscontinuedtomanageanumber of high profile events for the University, including the 2011 ‘Stumping Serious Diseases Charity Twenty 20 Cricket Match’ and the Chancellor’s Awards.
UniVERSiTy RECREATiOn AnD AQUATiC CEnTRE lTD (URAC)URAC’s core mission is: To enhance the quality of life of our members through provision of an extensive range of sporting, leisure, recreation and fitness opportunities for the University population and the wider community through access to quality programs, services and facilities.
In 2011, URAC had an excellent operational year, due mainly to growth in new and existing programs. The URAC Board and staff were able to grow income by 9 per cent while holding costs below 2010 levels.
Key initiatives in 2011
• Thesmalloperationalsurpluswasanexcellentresult,andtheURAC staff did very well to be able to do more with less, as capital and recurrent funding was particularly tight throughout the year.
• Membernumbersgrewby8percent,continuingthetrendofthelast 5 years. More pleasingly, visits per member rose sharply by 12 per cent, which means members are visiting more often and improving their fitness accordingly.
• ThemajorcapitalprojectfortheyearwasthenewCycleStudio,which received rave reviews by members, and achieved 87 per cent occupancy across all classes for the year.
• Minormaintenancewasnecessaryonthepoolexpansionjoints,butwith minimal disruption to the public. More problematic was the continuous patching of the many roof leaks, which did not produce a significant reduction in water entering operational spaces in the building. The foyer carpet and ceiling sustained serious damage in February and Squash Court 2 was fully re-floored due to water damage sustained in May. Both incidents were fully covered by UOW insurance, including loss of income.
• TheURACSportsHubhostednumerousstateandnationalcompetitions and sports events, and continued to support numerous junior and senior sports regionally. Futsal, netball and basketball were major users, and on the non-sporting side, 1,380 students sat examinations every 3–4 hours during the two exam periods.
• Theswimschoolparticularlybenefittedfromamajorpromotionalpush, and grew by over 40 per cent. Other programs reached or exceeded budget and participation targets.
• AmajortestoftheovaldrainagesystemwasprovidedinOctober2011 by the annual ‘Stumping Serious Diseases’ Twenty 20 cricket fundraiser, when 1,200 spectators braved the wet weather to help raise funds for medical research. It was a challenge and the renovated fields with their new drainage system passed with flying colours.
• Anumberofregionalsportsdevelopmentand/orcoachingstaffcontinued to have offices within URAC: NSW Rugby Union, NSW/ACT AFL, NSW Tennis, NSW Triathlon, the Illawarra Academy of Sport, and the Australian Sports Commission.
• NumerousexternalgroupsmadeextensiveuseofURACfacilities,many extending their programs with on campus and community users. Local primary and high schools, St George-Illawarra Dragons, NSW Football Junior Academy, Sydney Swans Junior Academy, and Ron McKeon Swim Schools remained regular hirers.
• CasualusefromvisitingelitesportingteamsandgroupsfromtheNRL, NBL, and Super 14 Rugby continued throughout the year.
review: QualitY aND BusiNess

2011 Annual Report 53
• ProfessionalexternalcoachesalsomademajorcontributionstoURAC income. Ron McKeon (swimming), Greg Royle (tennis) and Glenn Fontana (football) all assisted URAC reach income targets by paying for facility use throughout the year.
• URACstaffcontinuedtoinstituteanumberofbenchmarkingandpolicy initiatives which improved the safety and well being of our customers. Staff action to redress behaviour and safety issues at the University Games lead to a dramatic improvement in 2011.
• URACconductedanextensiveCustomerServicesurveywhichagain indicated our customer satisfaction levels (90.6 per cent) are well above industry benchmarks. The challenge is to continue to meet or exceed these high levels with limited financial resources, but with an abundance of initiatives and imagination.
• TheURACBoard,asindividualmembers,undertookanumberofgovernance and financial education programs throughout the year.
Figure 20: URAC members 2007–2011
4,000
3,500
3,000
2,500
2,000
1,500
1,000
500
0
20112010200920082007
WOllOnGOnG UniCEnTRE lTDThroughout 2011 UniCentre continued to provide high levels of services and support to the campus community through its services and offerings.
Our vision is: UniCentre to be a deciding factor in experiencing UOW.
Our mission is: To create services, spaces and activities that enhance the University experience, funded by maximising the commercial returns of our business operations.
Key UniCentre initiatives in 2011 included:
• OfficialopeningoftherefurbishedUniCentre(Building11)inApril2011 by the Vice Chancellor Professor Gerard Sutton. The new facilities provide formal seating for up to 480 persons, an increase of indoor seating capacity of 90 per cent, and distinct zones for student use — informal study, relaxation zone and game zone.
• SuccessfullaunchofnewUniCentreoperationswithinrefurbishedspace: Rush2 coffee outlet and Eleven, the University apparel and merchandise store.
• Customer Service Index (CSI) Survey was conducted on all UniCentre service outlets and all tenants on the Wollongong campus with an overall satisfaction of 80 per cent, which is steady against the 2010 result. All UniCentre outlets achieved ratings above the 77 per cent satisfaction benchmark, with an average
of 81.9 per cent satisfaction measured through the index. Rush2, UniCentre’s latest coffee operation, kicked off its inaugural year with a 91 per cent rating, achieving the highest individual CSI satisfaction rating.
• ThefinancialresultsforWollongongUniCentrecontinuetoprovidesustainability for UniCentre, which again recorded a positive operating surplus.
• UniCentre’sstudentengagementandsocialactivityservice,theCentre for Student Engagement, again increased its reach across the campus community, not only increasing the number of people engaged in its activity on the Wollongong Campus, but spreading its reach and effect to the local community through the programs it delivers and social media reach.
• Children’sServicesexperiencedconsistentcustomer/childrenuseas measured through average utilisation.

54 University of Wollongong
appENdix a: UOW facULTy sTrUcTUrE
Faculty of Arts
> Language Centre> Indigenous Studies Unit> School of English Literatures and Philosophy> School of History and Politics> School of Social Sciences, Media and Communication
Faculty of Commerce
> School of Accounting and Finance> School of Economics> School of Management and Marketing
Faculty of Creative Arts
Faculty of Education
Faculty of Engineering
> School of Civil, Mining and Environmental Engineering> School of Engineering Physics> School of Mechanical, Materials and Mechatronic Engineering
Faculty of health and behavioural Sciences
> School of Health Sciences> School of Nursing, Midwifery and Indigenous Health> School of Psychology
Faculty of informatics
> School of Computer Science and Software Engineering> School of Electrical, Computer and Telecommunications Engineering> School of Information Systems and Technology> School of Mathematics and Applied Statistics
Faculty of law
Faculty of Science
> School of Biological Sciences> School of Chemistry> School of Earth and Environmental Sciences
Graduate School of medicine
Sydney business School

2011 Annual Report 55
appENdix b: sENiOr UNiVErsiTy OfficErs
Chancellor Ms Jillian Broadbent AO, BA Syd, Hon DLitt UWS
Deputy Chancellor Dr Stephen Andersen MBBS Syd, MBA UOW
Vice-Chancellor and Principal Professor Gerard Sutton AO, BE MEngSc UNSW, PhD CUA
Senior Deputy Vice-Chancellor Professor John Patterson DipPhysEd STC, MSc Oregon, MEd Syd, EdD N Colorado, FAICD
Deputy Vice-Chancellor (Academic) Professor Rob Castle BEc MEc Syd
Deputy Vice-Chancellor (international) Professor Joe Chicharo BEng(Hons) PhD UOW, FIEAust, SMIEEE
Deputy Vice-Chancellor (Research) Professor Judy Raper BE Chem(Hons) PhD ChemEng UNSW
Pro Vice-Chancellor (health) Professor Don Iverson BSc N Dakota, MSc PhD Oregon
Vice-Principal (Administration) Mr Chris Grange BA UNSW, MCom UOW
Deputy Vice-Principal (Finance and iT) Mr Damien Israel BBus MAcc CSU, CPA
Dean of Research Professor Tim Marchant BSc(Hons) PhD Adel
Dean of Students Ms Yvonne Kerr DipPhysEd Cert Health Ed MSc Oregon, MEd Syd, FACHPER
Dean of Faculty of Arts Professor Wenche Ommundsen BA(Hons) DipEd Lausanne, MA Lond, PhD Melb
Dean of Faculty of Commerce Professor Trevor Spedding BSc(Hons) PhD CStat University of Coventry
Dean of Faculty of Creative Arts Professor Amanda Lawson BA Edin, BA(Hons) UOW, PhD Syd
Dean of Faculty of Education Professor Paul Chandler BSc(Hons) DipEd Syd, MSc PhD UNSW
Dean of Faculty of Engineering Professor Chris Cook BSc BE Adel, PhD UNSW
Dean of Faculty of health and behavioural Sciences
Professor Patrick Crookes BSc(Nurs) Leeds, CertEd York, PhD Hull, RGN, RN
Dean of Faculty of informatics Professor Philip Ogunbona BSc(Hons) OAU Ife, DIC, PhD ImpCollLond, SMIEEE
Dean of Faculty of law Professor Luke McNamara BA LLB UNSW, LLM Manitoba, PhD UOW
Dean of Faculty of Science Professor William Price BSc(Hons) DIC PhD Lond
Executive Dean of business and Dean of the Sydney business School
Professor John Glynn MA Kent, MPhil Exeter, PhD Kent, FCCA, FCPA
Dean of Graduate School of medicineProfessor Don Iverson BSc N Dakota MSc PhD Oregon (to 30 June 2011)
Professor Alison Jones BSc(Hons) MD Edin, FRCPE, FRCP, FIBiol, FRACP (from 1 July 2011)
Chair of Academic Senate Associate Professor Diana Kelly BA Macq, MCom(Hons) PhD UOW
University librarian Ms Margie Jantti BA(LibInfoSci) CSU, MBA UOW, AALIA
Academic Registrar Ms Megan Huisman GradCertMgt CSU, MBA UOW
Executive Director, learning and Teaching Professor Sandra Wills BA DipEd TTC Tas , MEd Monash FACS FACCE
Director, Employment Equity and Diversity Ms Lynne Wright DipTeach WIE, DipLib RMIE, MHumResMgmt CSU
Director, Facilities management Mr Bruce Flint BBuild(Hons) UNSW, MBA UOW
Director, human Resources Mr John Steele BSocStud Syd, GradDipHRM CSU, CMAHRI
Director, information Technology ServicesMr Joe McIver BInfo MBA UOW (to 9 March 2011)
Mrs Catherine Nicastri Assoc Dip Comp Apps UOW (from 19 September 2011)
Director, innovation & Commercial Research Ms Elizabeth Eastland BA(Hons) Concordia, B. Fine Art NAS, Executive MBA UNSW
Director, innovation CampusMr David Fuller BEd RCAE, MA LU (to 6 May 2011)
Mr David Campbell (Acting Director from 9 May 2011)
Director, legal Services Ms Angela Taylor BA LLB(Hons) GDipLegPrac UOW
Director, Performance indicator Unit Mrs Richelle Hilton BCom(Dist) UOW

56 University of Wollongong
Director, Planning Services Mr Aden Steinke BCom-Econ MEd UOW
Director, Research Services Office Ms Sharon Martin BSocSc UNE, MBA UOW
Director, Research Student Centre Ms Kim Callaway BCom, MBA UOW
Associate Director, Financial Services Mr Matt Wright BCom UOW, MAcc CSU, CPA
General manager, Accommodation Services Mr Nigel Pennington BA UQ, MCom UOW, FAICD, FAIMM
internal Audit manager Mr Kevin Yong BAcc(Hons) Universiti Malaya, FCPA Australia, CA Malaysia, Fellow IIA

2011 Annual Report 57
appENdix c: sENiOr ExEcUTiVE pErfOrMaNcE
name Position and level Total Remuneration
Package
Performance Pay
Period in Position
Statement of Performance
Professor Gerard Sutton Vice-Chancellor $698,393 Nil Whole year The University performed strongly throughout 2011. Professor Sutton successfully met the performance criteria for his position.
Professor John Patterson Senior Deputy Vice-Chancellor
$396,530 Nil Whole year Professor Patterson successfully met the performance criteria for his position including sound direction of day-to-day operations, successful negotiation of the enterprise agreement for academic staff and achievement of planned student enrolment targets.
Professor Rob Castle Deputy Vice-Chancellor (Academic)
$396,757 Nil Whole year Professor Castle met the performance criteria for his position including a strong endorsement of the University by the Australian Universities Quality Agency and continued high standards of teaching and learning.
Professor Joe Chicharo Deputy Vice-Chancellor (International)
$418,199 Nil Whole year Professor Chicharo met the performance criteria for his position including ongoing implementation of the International Strategic Plan and further expansion of offshore operations
Professor Judy Raper Deputy Vice-Chancellor (Research)
$421,691 Nil Whole year Professor Raper met the performance criteria for her position including continued development of research strengths, capacity building for recent initiatives (IHMRI, SMART) and development of research assets (AIIM P&D, SBRC).
Mr Chris Grange Vice-Principal (Administration)
$418,796 Nil Whole year Mr Grange met the performance criteria for his position including oversight of capital development activities (including the iC), ongoing development of student centred services and spaces, and improved service delivery and quality assurance accreditation of administrative services
Mr Damien Israel Deputy Vice-Principal (Finance and IT)
$318,590 Nil Whole year Mr Israel met the performance criteria for his position including unqualified audit of financial statements, ongoing assignment of S&P AA credit rating and oversight of IT infrastructure developments.
Professor Don Iverson Pro Vice-Chancellor (Health)
$372,888 Nil Whole year Professor Iverson met the performance criteria for his position including ongoing development of the Graduate School of Medicine, leadership of the IHMRI and development of the University’s overall health portfolio.

58 University of Wollongong
appENdix d: UOW cOUNciL aNd cOMMiTTEEs
UniVERSiTy COUnCil ROlE AnD FUnCTiOnUnder the University of Wollongong Act 1989 (NSW), the Council is the governing authority of the University. The Council acts for and on behalf of the University and controls and manages the University’s affairs and concerns. Section 16(1B) and (1) of the Act states that, in exercising the University’s functions the Council may:
> monitor the performance of the Vice-Chancellor> oversee the University’s performance> oversee the academic activities of the University> approve the University’s mission, strategic direction, annual budget
and business plan> oversee risk management and risk assessment across the
University (including, if necessary, taking reasonable steps to obtain independent audit reports of entities in which the University has an interest but which it does not control or with which it has entered into a joint venture)
> approve and monitor systems of control and accountability for the University (including in relation to controlled entities within the meaning of section 16A of the Act)
> approve significant University commercial activities (within the meaning of section 21A of the Act)
> establish policies and procedural principles for the University consistent with legal requirements and community expectations
> ensure that the University’s grievance procedures, and information concerning any rights of appeal or review conferred by or under any Act, are published in a form that is readily accessible to the public
> regularly review its own performance (in light of its functions and obligations imposed by or under this or any other Act)
> adopt a statement of its primary responsibilities> make available for members of the Council a program of induction
and of development relevant to their role as such a member> provide such courses, and confer such degrees and award such
diplomas and other certificates, as it thinks fit> appoint and terminate the appointment of academic and other staff
of the University> borrow money within such limits, to such extent and on such
conditions as to security or otherwise as the Governor on the recommendation of the Treasurer may approve
> invest any funds belonging to or vested in the University> promote, establish or participate in (whether by means of debt,
equity, contribution of assets or by other means) partnerships, trusts, companies and other incorporated bodies, or joint ventures (whether or not incorporated)
> establish and maintain branches and colleges of the University, within the University and elsewhere
> make loans and grants to students> impose fees, charges and fines.
Section 16A of the Act also sets out Council functions in regard to controlled entities.
Council meets six times per year.
COUnCil COmmiTTEES
Administrative Committee
The Administrative Committee is the executive committee of Council and acts under delegated authority. It has particular responsibility for monitoring operational policies and performance. The Administrative Committee comprises the Deputy Chancellor as Chair, the Vice-Chancellor, one staff member, one student member and three external members of Council. The Committee meets five times per year in alternate months to Council.
Audit management and Review Committee
The Audit Management and Review Committee assists and advises Council in fulfilling its corporate governance and oversight responsibilities in relation to the University’s management of risk, its internal control structure and its external reporting responsibilities. The Audit Management and Review Committee comprises four external members nominated by Council (one of whom is the Chair) plus a nominee of the Vice Chancellor. One member of the Committee is required to have recognised professional financial qualifications and experience. In attendance, as non-voting observers, are representatives of the NSW Audit Office, the Deputy Vice-Principal (Finance and IT), Manager Audit and Review and other persons as required. The Committee meets at least 4 times per year.
Council nominations Committee
The Council Nominations Committee meets as required and makes recommendations to Council concerning suitable candidates for appointment to Council by Council or the NSW Minister for Education and Training. Selection Criteria for the relevant membership categories are drawn from the University of Wollongong Act 1989 (NSW) and from the National Governance Protocols. The Nominations Committee comprises the Chancellor as Chair, the Vice-Chancellor, Deputy Chancellor and two external Council members.
Ceremonial and honorary Awards Committee
The Ceremonial and Honorary Awards Committee makes recommendations to Council, under approved procedures and criteria, on the award of honorary degrees, University fellowships and emeritus professorships. The Committee comprises the Chancellor as Chair, Vice-Chancellor, Chairperson of the Academic Senate, senior member of the University’s Academic Staff and a member of Council (other than a student or staff member). The Committee meets twice a year.
Council innovation Campus Oversight Committee
The Council Innovation Campus Oversight Committee is a special purpose committee established by the University Council in April 2006. Its role is to monitor the development of the University’s Innovation Campus, including overseeing the business plan and the attraction and retention of commercial tenants. The Committee comprises the

2011 Annual Report 59
Deputy Chancellor as Chair, the Vice-Chancellor, the Deputy Vice-Chancellor (Research), the Vice-Principal (Administration) and two external members of Council. The Committee meets at least three times per year.
Council Committee of Appeal
This Committee is the final appeal body at the University and deals with matters arising from the Student Conduct Rules, and any appeals against decisions taken by University officer(s) with regard to the application of University rules and policies. The Committee of Appeal comprises the Deputy Chancellor as Chair, a student member of Council (or, if not available, another student appointed by Council), a staff member of Council and one external member of Council appointed by Council.
Chancellor Robert hope memorial Prize Selection Committee
The Chancellor Robert Hope Memorial Prize was established by Council in August 2004. Council has established a Chancellor Robert Hope Memorial Prize Selection Committee to shortlist applications and make recommendations to Council for the recipient of the Prize. The Committee is chaired by the Chancellor and also comprises the Chair of Academic Senate, the Academic Registrar and a member of Council who is not a staff member.
ACADEmiC SEnATE mEmbERShiP
Ex-Officio members
> Vice-Chancellor> Senior Deputy Vice-Chancellor> Deputy Vice-Chancellor (Academic)> Deputy Vice-Chancellor (International)> Deputy Vice-Chancellor (Research)> Pro Vice-Chancellor (Health)> Vice-Principal (Administration)> Dean of Students> Dean of Research> Deans of Faculties> University Librarian> Head of the Centre for Educational Development, Innovation and
Recognition> Director of the Woolyungah Indigenous Centre> Director of Colleges – ITC Limited> Academic Registrar> Faculty nominated ex-officio positions
Elected members
The number of academic staff elected by and from each Faculty / Graduate School is determined by subtracting the Dean and Faculty / Graduate School nominated ex-officio positions for that Faculty / Graduate School from the number of allocated positions for that Faculty / Graduate School. Faculties / Graduate Schools must have at least 50 per cent of their allocated positions available to elected members. There are 50 elected members of Academic Senate from Faculties / Graduate Schools.
Two members are elected by and from the Academic Services Division, which includes Woolyungah Indigenous Centre academic staff, Learning Development staff, Library staff and educational consulting staff from the Centre for Educational Development, Innovation and Recognition.
One member is elected by and from the Research Institute Directors.
Six students are elected by and from the students enrolled for a degree or diploma at the University: four undergraduate students and two postgraduate students.
Chair and Deputy Chair
Every two years, the Academic Senate must elect a Chair and a Deputy Chair from among the Professors and Associate Professors of the University. The current term of office for the Chair and Deputy Chair will conclude on 30 June 2012.

60 University of Wollongong
appENdix E: frEEdOM Of iNfOrMaTiON sTaTisTics
Government information (Public Access) Application Statistics 2011
Table 18: number of applications by type of applicant and outcome
Access
granted in Full
Access granted in
part
Access refused in
full
information not held
information already
available
Refuse to deal with
application
Refuse to confirm/
deny whether
information is held
Application withdrawn
Media 1 0 0 0 0 0 0 0
Members of Parliament 0 0 0 0 0 0 0 0
Private sector business 0 0 0 0 0 0 0 0
Not for profit organisations or community groups
0 0 0 0 0 0 0 0
Members of the public (application by legal representative)
0 0 0 0 0 0 0 0
Members of the public (other)
1 0 0 2 0 0 0 0
Table 19: number of applications by type of application and outcome
Access
granted in Full
Access granted in
part
Access refused in
full
information not held
information already
available
Refuse to deal with
application
Refuse to confirm/
deny whether
information is held
Application withdrawn
Personal information applications*
0 0 0 1 0 0 0 0
Access applications (other than personal information applications)
2 0 0 1 0 0 0 0
Access applications that are partly personal information applications and partly other
0 0 0 0 0 0 0 0
* A personal information application is an access application for personal information (as defined in clause 4 of Schedule 4 to the Act) about the applicant (the applicant being an individual)

2011 Annual Report 61
Table 20: invalid applications
Reason for invalidity no of applications
Application does not comply with formal requirements (section 41 of the Act) 1
Application is for excluded information of the agency (section 43 of the Act) 0
Application contravenes restraint order (section 110 of the Act) 0
Total number of invalid applications received 1
Invalid applications that subsequently became valid applications 0
Table 21: Conclusive presumption of overriding public interest against disclosure: matters listed in Schedule 1 of the Act
no of times consideration used
Overriding secrecy laws 0
Cabinet information 0
Executive Council information 0
Contempt 0
Legal professional privilege 0
Excluded information 0
Documents affecting law enforcement and public safety 0
Transport safety 0
Adoption 0
Care and protection of children 0
Ministerial code of conduct 0
Aboriginal and environmental heritage 0
Table 22: Other public interest considerations against disclosure: matters listed in table to section 14 of Act
no of occasions when application
not successful
Responsible and effective government 0
Law enforcement and security 0
Individual rights, judicial processes and natural justice 0
Business interests of agencies and other persons 0
Environment, culture, economy and general matters 0
Secrecy provisions 0
Exempt documents under interstate Freedom of Information legislation 0

62 University of Wollongong
Table 23: Timeliness
number of applications
Decided within the statutory timeframe (20 days plus any extensions) 3
Decided after 35 days (by agreement with applicant) 0
Not decided within time (deemed refusal) 0
Total 3
Table 24: number of applications reviews under Part 5 of the Act (by type of review and outcome)
Decision varied Decision upheld Total
Internal review 0 1 1
Review by Information Commissioner 0 0 0
Internal review following recommendation under Section 93 of Act 0 0 0
Review by ADT 0 0 0
Total 0 1 1
Table 25: Applications for review under Part 5 of the Act (by type of applicant)
number of applications for review
Applications by access applicants 1
Applications by persons to whom information the subject of access application relates (see section 54 of the Act) 0

2011 Annual Report 63
appENdix f: EMpLOyMENT, EqUiTy aNd diVErsiTy sTaTisTics
Trends in the Representation of EEO Target Groups as a Percentage as at 31 march of particular year
Table 26: General Staff – Representation of EEO Target Groups as a percentage at 31 march in the years 2007–2011
General Staff % of General Staff
EEO Target Group benchmark or target5 2007 2008 2009 2010 2011
Women 50 62 65 63.9 64.1 65.2
Aboriginal people and Torres Strait Islanders 2.6 2.6 2.2 1.8 1.4 1.8
People whose first language was not English 19 24 13.8 14 15.4 16.9
People with a disability N/A 6 4.8 4.8 6.9 6.9
People with a disability requiring work-related adjustment 1.1 1.6 1.5 1.5 2 2.1
Table 27: Academic Staff – Representation of EEO Target Groups as a percentage at 31 march in the years 2007–2011
Academic Staff % of Academic Staff
EEO Target Group benchmark or target6 2007 2008 2009 2010 2011
Women 50 39 40 39.7 40.3 41.2
Aboriginal people and Torres Strait Islanders 2.6 1.4 1.2 1.1 1.3 1.2
People whose first language was not English 19 34 22.5 22.8 26.3 27.9
People with a disability N/A 10 7.3 7.5 8.2 8.4
People with a disability requiring work-related adjustment 1.1 3.5 2.6 2.6 3.1 2.6
Trends in the Distribution of EEO Target Groups as at 31 march of particular year
Table 28: General Staff – Trends in Distribution of EEO Target Groups at 31 march in the years 2007–2011
General Staff % of General Staff
EEO Target Group benchmark or target 2007 2008 2009 2010 2011
Women 100 85 86 85 84 84
Aboriginal people and Torres Strait Islanders 100 66 79 64 81 66
People whose first language was not English 100 95 96 93 88 80
People with a disability 100 107 106 139 121 131
People with a disability requiring work-related adjustment 100 n/a n/a 156 130 134
Table 29: Academic Staff – Trends in Distribution of EEO Target Groups at 31 march in the years 2007–2011
Academic Staff % of Academic Staff
EEO Target Group benchmark or target 2007 2008 2009 2010 2011
Women 100 80 79 64 63 64
Aboriginal people and Torres Strait Islanders 100 n/a n/a 134 109 136
People whose first language was not English 100 95 90 91 85 85
People with a disability 100 112 105 124 100 101
People with a disability requiring work-related adjustment 100 127 125 154 139 136
5 Target changed from 1 January 2011.
6 Target changed from 1 January 2011.

64 University of Wollongong
appENdix g: acadEMic prOMOTiONs
Promoted to Associate Professor
Michael Adams Academic Service Division
Roberta Collins Academic Service Division
Tony Simoes da Silva Faculty of Arts
Peter Siminski Faculty of Commerce
Mario Fernando Faculty of Commerce
Valerie Harwood Faculty of Education
Long Nghiem Faculty of Engineering
Nadia Solowij Faculty of Health and Behavioural Sciences
Aidan Sims Faculty of Informatics
Mark Nelson Faculty of Informatics
Annette Worthy Faculty of Informatics
Andrew Frazer Faculty of Law
Todd Minchinton Faculty of Science
James Wallman Faculty of Science
Promoted to Associate Principal Fellow
Chao Deng Faculty of Health and Behavioural Sciences
Simon Moulton Faculty of Science/IPRI
Promoted to Senior lecturer
Alisa Percy Academic Service Division
Guy Davidson Faculty of Arts
Michael Flood Faculty of Arts
Shiguang Ma Faculty of Commerce
Oleg Yerokhin Faculty of Commerce
Reetu Verma Faculty of Commerce
Christopher Sykes Faculty of Commerce
Siobhan McHugh Faculty of Creative Arts
Margaret Hamilton Faculty of Creative Arts
Noelene Weatherby-Fell Faculty of Education
Vinod Jayan Sylaja Faculty of Engineering
Lip Teh Faculty of Engineering
Kelly Newell Faculty of Health and Behavioural Sciences
Deirdre McGhee Faculty of Health and Behavioural Sciences
Simone Favelle Faculty of Health and Behavioural Sciences
Ngamta Thamwattana Faculty of Informatics
Haiping Du Faculty of Informatics
Sarah Sorial Faculty of Law
Adam Trevitt Faculty of Science
Solomon Buckman Faculty of Science

2011 Annual Report 65
Promoted to Senior Fellow
Owen Price Faculty of Science
Promoted to lecturer
Mariolina Pais Marden Faculty of Arts
Sandra Chapple Faculty of Commerce
Zhiming Cheng Faculty of Commerce
Promoted to Fellow
Thitima Urathamakul Faculty of Science

66 University of Wollongong
appENdix h: LaNd dispOsaL aNd acqUisiTiONThere was no land disposed of during 2011.
land Acquisitions
> 15 Falder Place, Keiraville – $1,200,000• ThishousewasdemolishedtoprovidespaceforfutureUOWdevelopment.
> 13 Ashcroft Place, Keiraville – $710,000• ThishouseistobeusedtemporarilyasStudentAccommodation,butthelandwillbeusedlaterforfutureUOWdevelopment.
> 105–107 Bowral Street, Bowral – $900,000 combined• Thesetwohouseswereremovedtoprovidethesiteforconstructionoffivefour-bedroomtownhousestoprovideaccommodationforstudentsof
the Graduate School of Medicine.> 41 Lions Drive, Mudgee – donated by Mid-Western Regional Council, Mudgee• Thisvacantlandisbeingusedasthesiteforconstructionofafive-bedroomhousetoprovideaccommodationforstudentsoftheGraduate
School of Medicine.
major Works
Wollongong Campus
> SMART Infrastructure Facility – $62,000,000 (completed January 2011)> Common Teaching Building (Building 24) – $8,000,000 (completed January 2011)> UniCentre (Building 11) Refurbishment – $6,800,000 (completed April 2011)> Nursing Simulation Centre (Building 41) – $1,300,000 (due for completion January 2012)> Kooloobong Stage 2 (student accommodation) – $42,000,000 (due for completion early 2013)> Arts Faculty (Building 19) Refurbishment – $4,000,000 (due for completion January 2013)
innovation Campus
> Enterprise 1 – $38,000,000 (completed April 2011)> Australian Institute for Innovative Materials – Processing and Devices (AIIM P&D) Facility – $33,000,000 (completed June 2011)> Sustainable Buildings Research Centre (SBRC) – $26,000,000 (due for completion November 2012)
Other Sites
> UOW Batemans Bay – $1,900,000 (due for completion February 2012)> Student accommodation at Bowral – $2,000,000 (due for completion July 2012)> Student accommodation at Mudgee – $500,000 (due for completion July 2012)

2011 Annual Report 67
appENdix i: ENgagEMENT Of cONsULTaNTs
Engagements costing less than $50,000
The total number of engagements costing less than $50,000 was 2,277. The total cost of these engagements was $8,490,918.
Table 30: Engagements costing equal to or greater than $50,000
Consultant Title of Project Actual Cost Type of Consultancy
THE BRAND SHOP University Branding $510,000 Organisation Review & Marketing
FLINDERS UNIVERSITY OF SOUTH AUSTRALIA Palliative Care Outcomes Research $123,959 Academic Research/Advisory
QUEENSLAND UNIVERSITY OF TECHNOLOGY Palliative Care Outcomes Research $238,834 Academic Research/Advisory
UNIVERSITY OF WESTERN AUSTRALIA Palliative Care Outcomes Research $168,248 Academic Research/Advisory
MAXIMIZE ASIA CONSULTING CO LTD Best Practice Rehabilitation services in China $66,500 Academic Research/Advisory
GRANT SAMUEL PROPERTY PTY LTD Sydney Business School Premises $135,545 Property Advisory Services
PRICE WATERHOUSE COOPERS iC - Private Hospital Development $66,686 Property Advisory Services
TOURISM WOLLONGONG Convention Exhibit Centre Study $55,000 Marketing study
HEIDRICK & STRUGGLES Executive Recruitment $64,300 Executive Recruitment
GRAHAM BELL & BOWMAN PTY LTD Early Start Project $118,514 Architectural and Design
ORYGEN RESEARCH CENTRE Treatment of Personality Disorder $78,470 Academic Research/Advisory
Total $1,626,056
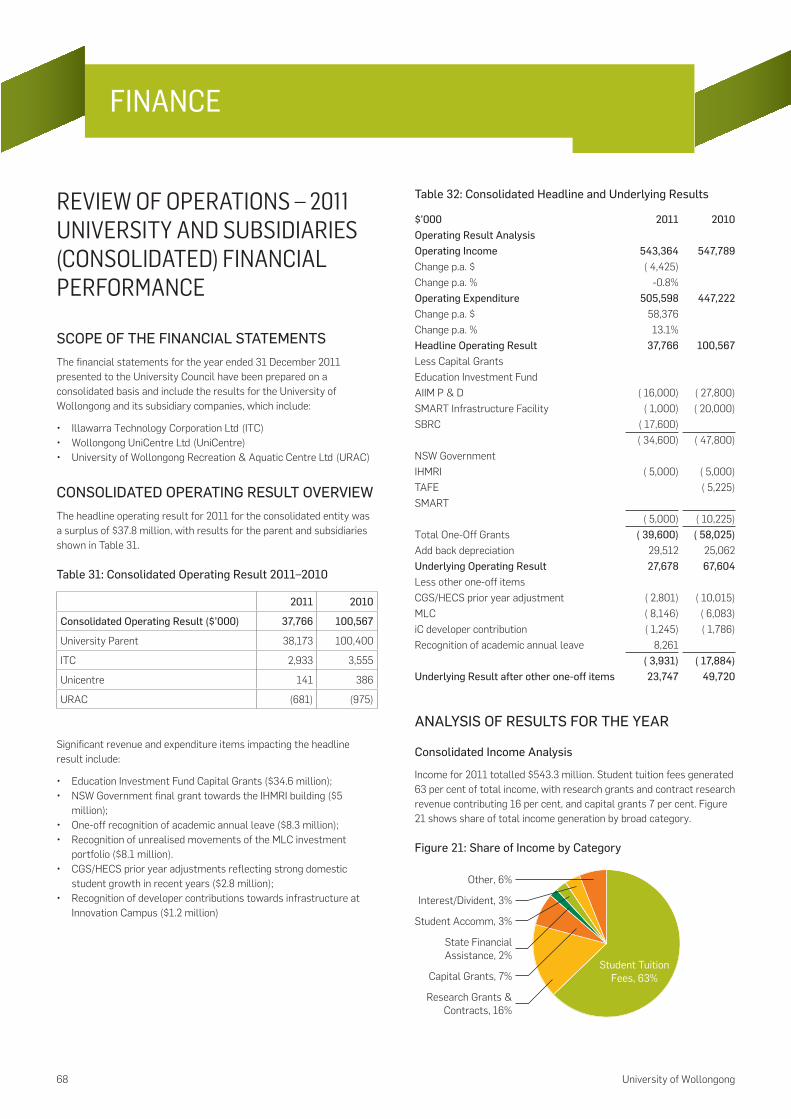
68 University of Wollongong
rEViEW Of OpEraTiONs – 2011 UNiVErsiTy aNd sUbsidiariEs (cONsOLidaTEd) fiNaNciaL pErfOrMaNcE
SCOPE OF ThE FinAnCiAl STATEmEnTSThe financial statements for the year ended 31 December 2011 presented to the University Council have been prepared on a consolidated basis and include the results for the University of Wollongong and its subsidiary companies, which include:
• IllawarraTechnologyCorporationLtd(ITC)• WollongongUniCentreLtd(UniCentre)• UniversityofWollongongRecreation&AquaticCentreLtd(URAC)
COnSOliDATED OPERATinG RESUlT OVERViEWThe headline operating result for 2011 for the consolidated entity was a surplus of $37.8 million, with results for the parent and subsidiaries shown in Table 31.
Table 31: Consolidated Operating Result 2011–2010
2011 2010
Consolidated Operating Result ($’000) 37,766 100,567
University Parent 38,173 100,400
ITC 2,933 3,555
Unicentre 141 386
URAC (681) (975)
Significant revenue and expenditure items impacting the headline result include:
• EducationInvestmentFundCapitalGrants($34.6million);• NSWGovernmentfinalgranttowardstheIHMRIbuilding($5
million);• One-offrecognitionofacademicannualleave($8.3million);• RecognitionofunrealisedmovementsoftheMLCinvestment
portfolio ($8.1 million).• CGS/HECSprioryearadjustmentsreflectingstrongdomestic
student growth in recent years ($2.8 million);• Recognitionofdevelopercontributionstowardsinfrastructureat
Innovation Campus ($1.2 million)
Table 32: Consolidated headline and Underlying Results
$’000 2011 2010Operating Result AnalysisOperating income 543,364 547,789Change p.a. $ ( 4,425)Change p.a. % -0.8%Operating Expenditure 505,598 447,222Change p.a. $ 58,376Change p.a. % 13.1%headline Operating Result 37,766 100,567Less Capital GrantsEducation Investment FundAIIM P & D ( 16,000) ( 27,800)SMART Infrastructure Facility ( 1,000) ( 20,000)SBRC ( 17,600)
( 34,600) ( 47,800)NSW GovernmentIHMRI ( 5,000) ( 5,000)TAFE ( 5,225)SMART
( 5,000) ( 10,225)Total One-Off Grants ( 39,600) ( 58,025)Add back depreciation 29,512 25,062Underlying Operating Result 27,678 67,604Less other one-off itemsCGS/HECS prior year adjustment ( 2,801) ( 10,015)MLC ( 8,146) ( 6,083)iC developer contribution ( 1,245) ( 1,786)Recognition of academic annual leave 8,261
( 3,931) ( 17,884)Underlying Result after other one-off items 23,747 49,720
AnAlySiS OF RESUlTS FOR ThE yEAR
Consolidated income Analysis
Income for 2011 totalled $543.3 million. Student tuition fees generated 63 per cent of total income, with research grants and contract research revenue contributing 16 per cent, and capital grants 7 per cent. Figure 21 shows share of total income generation by broad category.
Figure 21: Share of income by Category
Student Tuition
Fees, 63%
Other, 6%
Interest/Divident, 3%
Student Accomm, 3%
State Financial Assistance, 2%
Capital Grants, 7%
Research Grants & Contracts, 16%
FInAnce

2011 Annual Report 69
Total operating income decreased by $4.4 million in comparison to the 2010 year, mainly as a result of a decrease in capital grants. Figure 22 shows the total income by category for 2011 compared to 2010.
Figure 22: year on year income Sources 2011 and 2010.
400,000
350,000
300,000
250,000
200,000
150,000
100,000
50,000
0
2011
$’00
0
2010
Student Tuition Fees
341,008 88,722 39,600 9,792 13,663 17,895 32,684
342,553 82,708 52,800 15,309 13,047 14,722 26,650
Research Grants & Contracts
Capital Grants
State Financial Assistance
Student Accomm
Interest/Dividend
Other
Student tuition generated a total of $341.0 million in 2011 compared to $342.6 million in 2010, with CGS/HECS adjustment payments in 2010 and a decline in international student revenue contributing to the change in total tuition fees. Due to strong domestic student enrolments in 2010 and prior years, 2010 included commonwealth grant scheme and HECS prior year funding adjustments (approx $10 million). From 2011, funding arrangements have greater alignment with the year of student enrolment.
International student fee revenue declined from $143.6 million to $135.9 million.
Figure 23: year on year Student Tuition Fees 2011 and 2010.
160,000
140,000
120,000
100,000
80,000
60,000
40,000
20,000
0
2011
$’00
0
2010
Commonwealth Grant Scheme
114,771
112,664
72,101
69,344
HECS/FEE HELPGrand
14,892
13,234
HECS StudentPayments
135,882
143,570
International
3,362
3,741
Domestic FeePaying

70 University of Wollongong
At 16 per cent of total operating income, revenue generated from research grants and contract research contributed $88.7 million to University income and increased 7.3 per cent compared to 2010. Figure 24 shows the key research income categories and the contribution to total research related revenue.
Figure 24: Research income Categories 2011 and 2010.
25,000
20,000
15,000
10,000
5,000
0
2011
$’00
0
2010
Scholarships
5,696
5,535
23,216
22,239
DIISR
2,746
2,282
NHMRC
19,914
18,147
ARC
17,057
14,978
Other AustResearch
20,093
19,527
Consultancy & Contracts
Capital grants (Education Investment Fund) decreased from $34.6 million in 2011 compared to $47.8 million in 2010. Grants in 2011 included $16 million AIIM P & D; $1 million SMART Infrastructure Facility; and $17.6 million for the Sustainable Buildings Research Centre. This funding is in line with grant agreements.
In 2010 the University received a grant of $5.3 million from the NSW State Government towards the digital media centre at Innovation Campus, contributing to the year on year fall in state financial assistance.
Consolidated Expense Analysis
Overall expenditure for 2011 was $505.6 million (including income tax and discontinued operations). This was an increase of $58.4 million compared to 2010. Figure 25 shows expenditure by category for 2011 compared to 2010.
Figure 25: Operating Expenditure by Category 2011 and 2010.
180,000
160,000
140,000
120,000
100,000
80,000
60,000
40,000
20,000
0
2011
$’00
0
2010
AcademicStaff Costs
152,567
127,534
137,576
132,984
GeneralStaff Costs
13,755
11,734
Repairs& Maint
29,512
25,062
Depreciation & Amortisation
6,118
3,689
BorrowingCosts
166,070
146,129
OtherExpenses
fiNaNce

2011 Annual Report 71
The year on year changes for expenditure include:
• Academicstaffcostsincreased$25.0millionfrom2010to2011.This includes a one off recognition of annual leave provision for academic staff of $8.3 million. Prior to the academic enterprise agreement entered into in late 2010, all academic annual leave was deemed to be taken. The new agreement requires accrual and accounting of annual leave for academic staff similar to staff employed under the general staff agreement. Excluding this adjustment, the remaining increase of $16.7 million (13 per cent) reflects pay increases awarded to staff in March 2011 (4 per cent), Longer service leave provision growth as a result of a change in the discount rate used to calculate future obligations, promotions and reclassifications, growth related to increased student load (11 per cent 2009-2011), and increased research activity.
• Generalstaffcostsincreased$4.6million(3.5percent)-reflectingpay increases, promotions and reclassifications, and general growth supporting activities of the University.
• Depreciationandamortisationhasincreasedreflectingcontinuedgrowth in the group’s property, plant, and equipment.
• OtherExpensesincreased$19.2million(13.1percent).Itemscontributing to the rise, and the amount of increase compared to 2010, include operating lease costs for gym equipment for URAC, and IT infrastructure on University campuses as part of the University IT capital plan ($3.6 million); scholarships ($2.5 million); travel and related staff development and training ($1.9 million); Non-capitalised equipment ($1.2 million); and contracts and fees primarily relating to maintenance and minor capital works ($3.7 million).
Consolidated balance Sheet
Net Assets for the group grew $27.9 million (4 per cent). Total assets grew by $115.1 million (11 per cent), whilst total liabilities grew $87.3 million (25 per cent). Figure 26 shows total assets, total liabilities and net assets for 2011 compared to 2010.
Figure 26: Total Assets, Total liabilities, and net Assets 2011 and 2010.
1,400,000
1,200,000
1,000,000
800,000
600,000
400,000
200,000
0
2011
$’00
0
2010
TotalAssets
1,163,184
1,048,063
437,243
349,983
TotalLiabilities
725,941
698,080
NetAssets
AssetsCash and investments decreased $11 million (-4 per cent), whilst property, plant, and equipment increased $48.5 million (8 per cent). This decrease in cash and increase in PPE was consistent with the University’s capital management plan. Other Assets increased $77.7 million (42 per cent) primarily due to the receivable to offset the increase in deferred superannuation liabilities ($67.8 million). Other receivables growth reflects outstanding fees from students, and other activities including research.
Figure 27: Assets 2011 and 2010
700,000
600,000
500,000
400,000
300,000
200,000
100,000
0
2011
$’00
0
2010
Cash &Investments
243,678
254,723
658,350
609,886
Property, Plant& Equipment
261,156
183,454
OtherAssets
liabilitiesPayables and other liabilities increased $4.2 million (5 per cent), whilst employee provisions increased $82.4 million (44 per cent). The large increase in provisions was due to first time recognition of academic annual leave ($8.3 million), and recognition of deferred superannuation obligations ($68.5 million, mainly as result of discount rate decrease – partially offset by receivable). Whilst increased salary levels and an increase in total accrued hours (5 per cent increase) contributed to an increase in long service leave provision, a decrease in the discount factor used to determine future obligations was the main contributing factor (3.3 per cent 2011, 5.37 per cent 2010).
Figure 28: liabilities 2011 and 2010
300,000
250,000
200,000
150,000
100,000
50,000
0
2011
$’00
0
2010
Payables &Other Liabilities
89,431
85,277
269,026
186,658
Provisions
78,786
78,048
Borrowings

72 University of Wollongong
2011 UNiVErsiTy (parENT ENTiTy) fiNaNciaL pErfOrMaNcEThe following commentary focuses on the University parent entity, excluding its controlled entities.
Strategic Plan Performance indicators
Underlying operating result 3 per cent of operating income (net of capital grants and depreciation)
The result for 2011 was 5.5 per cent (compared to a five year average of 8.2 per cent). Recognition of academic annual leave and a fall in international on-shore student revenue negatively impacted on the result.
Figure 29: Underlying Operating Result 2007–2011
16.0%
14.0%
12.0%
10.0%
8.0%
6.0%
4.0%
2.0%
0.0%
20112010200920082007
Current ratio greater than or equal to 1.8
The ratio for 2011 was 2.44, above the strategic target. The slight reduction from previous years reflects utilisation of cash from grants received for major capital projects.
Figure 30: Current Ratio 2007–2011
3.00
2.50
2.00
1.50
1.00
0.50
0.00
20112010200920082007
Debt to Equity Ratio no greater than 15 per cent
The ratio for 2011 was 11 per cent, within the strategic target and similar to 2010. Additional borrowings in 2010 increased the ratio at that time.
Figure 31: Debt to Equity Ratio 2007–2011
14%
12%
10%
8%
6%
4%
2%
0%
20112010200920082007
Debt service coverage ratio greater than or equal to 8
The ratio for 2011 was 11.27, above the strategic target. A decrease in international on-shore student revenue and reduction in capital grants has seen the ratio decline compared to recent years.
Figure 32: Debt Service Coverage Ratio 2007–2011
40.00
35.00
30.00
25.00
20.00
15.00
10.00
5.00
0.00
20112010200920082007
The University has also maintained its AA/A-1+ stable Standard and Poor’s credit rating. The University has maintained the rating since 2006.
fiNaNce

2011 Annual Report 73
priNcipaL acTiViTiEsUnder the University of Wollongong Act 1989 NSW (as amended), the object of the University is the promotion, within the limits of the University’s resources, of scholarship, research, free enquiry, the interaction of research and teaching, and academic excellence. The University has the following principal functions for the promotion of its object.
• Theprovisionoffacilitiesforeducationandresearchofuniversitystandard.
• Theencouragementofthedissemination,advancement,development and application of knowledge informed by free enquiry.
• Theprovisionofcoursesofstudyorinstructionacrossarangeoffields, and the carrying out of research, to meet the needs of the community.
• Theparticipationinpublicdiscourse.• Theconferringofdegrees,includingthoseofbachelor,masterand
doctor, and the awarding of diplomas, certificates and other awards.• Theprovisionofteachingandlearningthatengagewithadvanced
knowledge and enquiry.• Thedevelopmentofgovernance,proceduralrules,admission
policies, financial arrangements and quality assurance processes that are underpinned by the values and goals referred to in the functions set out in this subsection, and that are sufficient to ensure the integrity of the University’s academic programs.
COUnCil mEmbERShiP AnD ATTEnDAnCEThe following lists the members of the University Council during the reporting period, the number of Council meetings attended by each member, and Council committee membership and attendance during the reporting period.
Council membership and Attendance 2011 Term of Office meeting Attendance
EX OFFiCiO Attended Possible
Chancellor - Ms Jillian Broadbent AO, BA Syd, HonDUniv UWS n/a 5 6
Vice-Chancellor and Principal - Professor Gerard Sutton AO, BE MEng Sc UNSW, PhD CUA n/a 6 6
Chair of Academic Senate - Associate Professor Diana Kelly BA Macq, MCom(Hons), PhD UOW n/a 6 6
nSW miniSTERiAl nOminEES
Hon David Campbell MLA (note a) 2010–2011 0 2
Mr Noel Cornish BSc (Metallurgy) MEngEc Newcastle 2010–2011 6 6
Mr Dom Figliomeni BBus GradDipBus ECU, DipPubAdmin Curtin TAFE 2010–2013 6 6
Dr Elizabeth Magassy MBBS Syd, Dip RACOG 2010–2011 5 6
Mr Geoff O’Donnell DipBus UQ 2010–2011 6 6
Mr Robert Ryan BE Syd, MCL Macq 2010–2013 4 6
APPOinTED by COUnCil
Deputy Chancellor - Dr Stephen Andersen MBBS Syd, BSc MBA UOW 2010–2013 6 6
Mr Peter Fitzgerald BCom UOW, FCA 2009–2013 6 6
Ms Rosemary Sinclair BA LLB Syd, BBA C Sturt, MCom UNSW (note b) 2008–2011 1 1
Emeritus Professor Denis King OAM, MBBS Syd, FRACS 2011–2014 2 2
ElECTED by ThE STUDEnTS OF ThE UniVERSiTy
Mr Saif AlSulami 2010–2011 2 6
Mr Christopher Whittaker 2010–2011 4 6
ElECTED by GRADUATES
Ms Kelly Knowles BA UOW 2008–2011 4 6
Mr Gareth Ward BA-BCom UOW, MP (note c) 2010–2013 2 5
ElECTED by ThE FUll TimE ACADEmiC STAFF OF ThE UniVERSiTy
Mr Ron Perrin BBus(Acc) UWS, MCom UOW, ASA, AFAIM 2011–2013 6 6
Prof Song Ping Zhu BE Huazhong China, MSE, PhD Michigan 2010–2012 5 6
ElECTED by ThE FUll TimE GEnERAl STAFF OF ThE UniVERSiTy
Ms Kim Callaway BCom MBA UOW 2010–2013 3 6
(a) Mr David Campbell resigned from the Council before the June Council meeting(b) Ms Rosemary Sinclair resigned from the Council before the April Council meeting(c) Mr Gareth Ward was granted Leave of Absence by the Council for the October Council meeting

74 University of Wollongong
Council Committee membership and Attendance 2011
Committeemeeting Attendance
Attended Possible
Administrative Committee
Dr Stephen Andersen (Chair) 4 5
Mr Dom Figliomeni 4 5
Ms Kelly Knowles 1 5
Ms Kim Callaway 4 5
Mr Geoff O’Donnell 3 5
Professor Gerard Sutton (note d) 5 5
Mr Chris Whittaker 5 5
Audit management and Review Committee
Mr Peter Fitzgerald (Chair) 4 4
Mr Robert Ryan 4 4
Mr Noel Cornish 4 4
Professor John Patterson 4 4
Ms Rosemary Sinclair (note e) 2 2
Ceremonial and honorary Awards Committee
Ms Jillian Broadbent AO (Chair) 3 3
Associate Professor Diana Kelly 3 3
VACANT - -
Professor Gerard Sutton 2 3
Professor John Glynn 3 3
Council innovation Campus Oversight Committee
Dr Stephen Andersen (Chair) 4 4
Prof Gerard Sutton 4 4
Mr Noel Cornish 4 4
Mr Peter Fitzgerald 4 4
Mr Chris Grange 4 4
Prof Judy Raper 4 4
Council nominations Committee
Ms Jillian Broadbent AO (Chair) 2 2
Dr Stephen Andersen 2 2
Professor Gerard Sutton 2 2
Mr Noel Cornish 2 2
Dr Elizabeth Magassy 1 2
(d) For three of the meetings of the Administration Committee Gerard Sutton was unable to attend and John Patterson attended in his stead in his role as Acting Vice-Chancellor
(e) Ms Rosemary Sinclair resigned from the Council before the April Council meeting
SiGniFiCAnT ChAnGES in ThE STATE OF AFFAiRSThere were no significant changes in the State of Affairs of the University or any of its subsidiaries during and up to the date of this report that are not included elsewhere in the Annual Report and which require separate disclosure.
mATTERS SUbSEQUEnT TO ThE EnD OF ThE yEARThere are no matters subsequent to the end of the year that will impact materially on the University’s financial position and which requires disclosure.
liKEly DEVElOPmEnTS AnD EXPECTED RESUlTS OF OPERATiOnSThe likely developments in the operations and the expected results of those operations of the consolidated entity constituted by the University, and the entities it controls from time to time, are included within the Annual Report. There were no significant matters not finalised up to the date of this report that would impact on the interpretation of the financial statements.
EnViROnmEnTAl REGUlATiOnThe University is subject to a variety of regulations and legislation in relation to environmental management. The University has systems and processes in place to ensure compliance with relevant regulations and legislation and is not aware of any instances of non-compliance that would pose significant risk to the University.
The University’s annual report includes commentary on environmental management and initiatives.
inDEmniFiCATiOn AnD inSURAnCE OF OFFiCERSThe University provides a Management Liability Policy (previously known as Directors & Officers Liability Protection) through Unimutual, issued by Chubb Insurance. The policy insures directors and officers, employees and the members for defence costs and legal liability incurred on account of claims and prosecutions against them in their role. The policy also insures directors and officers, employees and the members for representation costs in relation to investigations by regulators and other authorities.
The policy provides $10,000,000 of cover for any one claim but limited to $20,000,000 in the aggregate for the policy period. The premium for the policy is $29,925.
PROCEEDinGS On bEhAlF OF ThE UniVERSiTyThere are no material proceedings against or on behalf of the University or its controlled entities.
This report is made in accordance with a resolution of the members of the University of Wollongong.
fiNaNce

2011 Annual Report 75
pErfOrMaNcE cOMparEd TO OrigiNaL bUdgET
inCOmE STATEmEnT
Table 33: University (parent) income Statement Compared to budget
initial budget
2011$ ‘000
Actual result 2011
$ ‘000
budget 2012
$ ‘000
income from continuing operations
Australian Government Grants
Operating 173,264 186,756 192,688
Capital 26,100 34,600 7,500
HECS-HELP 62,921 68,496 69,900
FEE-HELP 3,100 3,605 2,930
HECS-HELP (student payments)
17,550 14,892 16,200
State and Local Govt 6,021 9,792 3,675
Fees and Charges 96,107 127,401 124,908
Investment revenue 3,565 19,269 5,309
Consultancy and contracts 18,481 20,155 22,218
Other Revenue 4,333 8,268 6,189
411,442 493,234 451,517
Gain on disposal of assets 3 555 0
411,445 493,789 451,517
Expenses from continuing operations
Employee related expenses 221,595 250,696 251,896
Depreciation and amortisation 24,720 26,606 28,500
Repairs and maintenance 9,908 13,150 10,557
Borrowing costs 5,170 5,913 5,400
Other expense 131,462 159,251 148,680
392,855 455,616 445,033
Operating result 18,590 38,173 6,484
The University’s operating result for 2011 was $19.6 million better than initial forecasts. There were several key reasons for this including:
income
• Totalfundingfordomesticstudentswas$16.9million(6.6percent)higher than forecast. This is due to prior year adjustments and the transition to uncapped funding where the government funded up to 10 per cent over enrolment in the year of funding. The University initial forecast was to receive only 5 per cent of this over enrolment. Total domestic Commonwealth funded places grew 4 per cent.
• TimingofEducationInvestmentFundgrantswasdifferentthanoriginally forecast. For the SBRC project in particular, a $7.5 million progress payment was received in 2011 but originally forecast for 2012.
• FeesandChargesexceededbudgetduetoconservativeinitialforecasts for international on-shore student revenue. The initial forecast was $63 million compared to an actual result of $88.2 million
• InvestmentrevenueexceededbudgetasaresultofunrealisedMLCreturns of $8.1 million being brought to account. Initial forecasts anticipated movements for the MLC portfolio through the balance sheet reserve. In addition initial forecasts did not include a dividend from ITC, compared to an actual dividend of $4 million in 2011.
Expenditure
• Employeeexpenseswerehigherthanforecastduetofirsttimerecognition of academic annual leave; expanding activities funded by revenue growth; and increases in long service leave and superannuation provisions.
• RepairsandMaintenancewerehigherthaninitialbudgetprimarilyas a result of decisions to expense rather than capitalise major repairs and small infrastructure projects. Although this expense item is larger than budgeted, the total Capital and Repair and Maintenance program for 2011 was in accordance with the University’s capital management plan.
• Thekeyvariationsfor‘OtherExpenses’includeoperatingleasecosts IT infrastructure on University campuses as part of the University IT capital plan; scholarships; travel and related staff development and training; Non-capitalised equipment; and contracts and fees primarily relating to maintenance and minor capital works.

76 University of Wollongong
bAlAnCE ShEET
Table 34: University (parent) income Statement Compared to budget
initial budget
2011$ ‘000
Actual result 2011
$ ‘000
budget 2012
$ ‘000
Assets
Current Assets
Cash & Cash Equivalents 15,000 6,541 15,000
Receivables 41,782 49,480 47,446
Inventories 455 398 573
Held to maturity investments 52,515 104,108 56,667
Non-current assets held for sale
56,702 0 0
Other non-financial assets 5,014 5,692 5,515
171,468 166,219 125,201
non-Current Assets
Receivables 124,110 195,875 131,040
Available-for-sale financial assets
55,565 109,037 117,142
Property, plant & equipment 668,176 652,211 753,643
Other non-financial assets 7,752 3,366 6,428
855,603 960,489 1,008,253
1,027,071 1,126,708 1,133,454
liabilities
Current liabilities
Trade and other payables 22,344 23,129 30,894
Provisions 39,082 52,895 44,488
Other liabilities 35,909 36,961 45,223
97,335 112,985 120,605
non-Current liabilities
Borrowings 82,369 77,832 89,186
Provisions 143,851 209,546 162,047
Other liabilities 17,427 25,083 19,078
243,647 312,461 270,311
340,982 425,446 390,916
net Assets 686,089 701,262 742,538
Equity
Reserves 7,846 ( 9,759) 6,435
Retained Suplus 678,243 711,021 736,103
686,089 701,262 742,538
The key movements on the University’s balance sheet for 2011 were:
• CashandHeldtoMaturityInvestments(shorttermbankdeposits)were higher than forecast due to unspent capital grants and greater than forecast international on-shore student revenue. Property, Plant, and Equipment was below initial forecast due to the timing of expenditure on various capital projects.
• TheUniversity’smanagedinvestmentportfolioisdisclosedinthecategories ‘Non-current assets classified as held for sale’ and ‘Available-for-sale financial assets’. During 2011 the portfolio was combined into one and has subsequently been classified within non-current assets. Returns on the portfolio were -0.3 per cent, compared to initial forecast of 7 per cent. The return below forecast is also reflected in equity reserves lower than forecast.
• Provisionswithincurrentliabilitiesexceededtheinitialbudgetdueto first time recognition of annual leave liabilities for academic staff as required by the new enterprise agreement negotiated late in 2011. Current long service leave liabilities also increased above budget expectation as a result of a decrease in the discount factor used to calculate future obligations.
• Non-current‘Receivables’andNon-current‘Provisions’arehigherthan expected due to the valuation of deferred government superannuation contributions. The receivable movement offsets the movement in the provision.
mAnAGEmEnT OF inVESTmEnTSThe University continued to utilise the services of MLC Implemented Consulting as its investment manager throughout 2011. MLC returns were below benchmark but generally consistent with similar implemented consulting investment managers. The University, via the Investment Advisory Committee, closely monitors the performance of MLC against benchmark and other implemented consulting industry measures. Table 35 summarises performance for the total portfolio and individual trusts within the portfolio for the 2011 year with benchmarks.
fiNaNce

2011 Annual Report 77
Table 35: investment Portfolio Performance 2011.
Portfolio Weighting %
5 yrs% pa
3 yrs% pa
1 yr%
Total Portfolio^ Index
100 0.9 1.7
7.7 7.8
-0.3 0.1
mlC (nCiT) Australian Share TrustIndex
21.5 -2.0-2.4
6.77.7
-11.6-11.0
mlC (nCiT) Global Share TrustIndex
14 -6.6-6.5
1.0-1.0
-4.8-6.9
mlC (nCiT) Global Share Trust with Currency hedgedIndex
16.5 -2.6-1.0
14.713.3
-2.2-3.6
mlC (nCiT) Property Securities TrustIndex
3 -5.1-5.9
16.216.6
-6.4-0.7
Diversified DebtIndex
43 6.97.1
8.58.1
9.49.7
Antares Enhanced Cash TrustIndex
2 5.85.5
5.24.4
5.45.0
Asset Class market indexAustralian Equity S&P/ASX 300 Accumulation IndexGlobal Equity (Unhedged) MSCI All Country World Index in $AGlobal Equity (Hedged) MSCI All Country World Index hedged into $AGlobal Listed Property EPRA/NAREIT Global Developed IndexDiversified Debt Calculated using the portfolio’s actual asset allocations to index returns of debt
sub-asset classesEnhanced Cash UBS Warburg Australian Bank Bill Index
PAymEnT OF ACCOUnTSTable 36 has been prepared in accordance with New South Wales Treasury guidelines and provides details of the University’s account payment performance for 2011.
Payment performance in the table has been measured using the University’s standard payment terms of 30 days from invoice date. The percentage of accounts paid on time is based on the number of accounts not their value. Aged accounts payable at each quarter end are not significant in comparison to the value of current invoices on hand.
Table 36: Payment of Accounts 2011
Quarter Ended31-mar-11
$’ 00030-Jun-11
$’ 00030-Sep-11
$’ 00031-Dec-11
$’ 000
interest due to late payment
0 0 0 0
Value of accounts payable at month end
Current 1,628 4,696 1,654 1,882
Between 30-60 days ( 7) 11 0 23
Between 60-90 days 1 5 0 0
Between 90-120 days 0 6 0 0
Over 120 days ( 9) ( 14) ( 11) ( 11)
1,613 4,704 1,643 1,895
Note: figures in brackets represent credit notes to be offset against future payments
Details of accounts paid on time
$’ 000 $’ 000 $’ 000 $’ 000
Percent of accounts paid on time
61% 65% 62% 67%
Number of accounts paid on time
4,454 4,517 5,046 5,252
Total number of accounts paid
7,325 6,990 8,202 7,881
78 University of Wollongong
GRAnTS TO nOn-GOVERnmEnT COmmUniTy ORGAniSATiOnSThe University made the following grants (excl. GST) to community organisations in 2011:
Organisation Grant Purpose
Conservatorium of Music $128,000Contribution towards operating expense
Illawarra Regional Information Service
$143,220Contribution towards operating expense
RiSK mAnAGEmEnT AnD inSURAnCEThe Audit Management & Review Committee is a formally constituted committee of Council with particular responsibility to assist and advise Council in fulfilling its corporate governance and independent oversight responsibilities in relation to the University’s management of risk, its internal control structure and its external reporting responsibilities.
In April 2005, the University Council approved a comprehensive risk management policy to apply a structured and consistent approach to risk management in accordance with the Australian Risk Management Standard AS/NZS4360:2004.
The University holds a self-insurance license for workers compensation purposes. A liability for outstanding claims has been measured as the present value of expected future payments. The expected future payments include amounts in relation to unpaid reported claims and claims incurred but not reported. Reinsurance for occurrences in excess of $500,000 has been obtained.
The University’s Occupational Health and Safety Committee undertakes regular campus inspections and actively reports on safety in the workplace. The Committee meets regularly to ensure that awareness of safety and ergonomics is promoted throughout the University. Occupational Health & Safety performance is reported to every meeting of the University Council and the Administrative Committee of Council.
The University has a range of insurance policies in place to cover property, general third party and product liability, directors’ and officers’ indemnity, professional indemnity, comprehensive motor vehicle, marine hull, marine cargo, voluntary workers, overseas travel for university officers and employees, business interruption and consequential loss, and student personal accidents. Property cover includes industrial special risk, burglary, fidelity guarantee, accidental damage, property in transit and machinery breakdown.
The majority of these policies are arranged through Unimutual Limited. Unimutual was formed for the purpose of offering its members a commercially feasible alternative to insurance. Membership is available to universities, other educational or research institutions or entities associated with education or research or with education or research institutions that have more than 20 employees. Unimutual is a discretionary mutual and was established to provide its members with access to a facility for the management of financial risks that have been traditionally difficult to place at an affordable price in the insurance market.
The University maintains a Legal Services Unit to actively risk assess its services and programs, and to ensure compliance with statutory requirements in respect to its commercial activities.
The Human Research Ethics Committee is accredited by National Guidelines. It protects the welfare and rights of participants involved in research. A secondary aim is to facilitate research of benefit to the wider community. The Committee’s approval is necessary for research ranging from examination of records containing personal information, to anonymous surveys and medical intervention.
fiNaNce

2011 Annual Report 79

80 University of Wollongong

2011 Annual Report 81

82 University of Wollongong
income StatementFor the year ended 31 December 2011
Consolidated(Economic Entity)
University of Wollongong(Parent Entity)
2011 2010 2011 2010
Notes $’000 $’000 $’000 $’000
income from continuing operations
Australian Government financial assistance
Australian Government grants 4 221,356 226,357 221,356 226,332 HECS-HELP - Australian Government payments 4 68,496 65,275 68,496 65,275 FEE-HELP 4 3,605 4,069 3,605 4,069
State and Local Government financial assistance 5 9,792 15,309 9,792 15,309 HECS-HELP - Student payments 14,892 13,234 14,892 13,234
Fees and charges 6 171,585 176,651 127,401 129,751 Investment revenue 7 17,895 14,722 19,269 16,302 Consultancy and contracts 8 20,156 19,527 20,155 19,583 Other revenue 9 15,032 12,496 8,268 8,726
Total revenue from continuing operations 542,809 547,640 493,234 498,581
Gains on disposal of assets 555 149 555 149
Total income from continuing operations 543,364 547,789 493,789 498,730
Expenses from continuing operationsEmployee related expenses 10 289,657 260,026 250,696 219,434 Depreciation and amortisation 11 29,512 25,062 26,606 23,059 Repairs and maintenance 12 13,755 11,734 13,150 10,844 Borrowing costs 13 6,118 3,689 5,913 3,600 Impairment of assets 14 (16) 75 (16) 75 Deferred super expense 10/44 486 492 486 492 Other expenses 15 164,246 145,035 158,781 140,826
Total expenses from continuing operations 503,758 446,113 455,616 398,330
Operating result before income tax 39,606 101,676 38,173 100,400
Income tax expense 16 (1,095) (1,018) - - Operating result from continuing operations 38,511 100,658 38,173 100,400
Operating result from discontinued operations 17 (745) (91) - - Operating result after income tax for the period 37,766 100,567 38,173 100,400
Operating result attributable to non-controlling interest (1) (106) - -
Operating result attributable to members of University of Wollongong
33(b) 37,765 100,461 38,173 100,400
Operating result attributable to members from:.
Continuing Operations 38,510 100,552 38,173 100,400
Discontinued Operations (745) (91) - -
Total 37,765 100,461 38,173 100,400
The above income statement should be read in conjunction with the accompanying notes.
FInAncIAL stAteMentsbEGinninG OF AUDiTED FinAnCiAl STATEmEnTS

2011 Annual Report 83
Statement of Comprehensive incomeFor the year ended 31 December 2011
Consolidated University of Wollongong
(Economic Entity) (Parent Entity)
2011 2010 2011 2010
Notes $’000 $’000 $’000 $’000
Operating result after income tax for the period 37,765 100,461 38,173 100,400
Gain/(loss) on value of available for sale financial assets (8,653) (1,170) (8,566) (569)
Transfer of reserve to retained earnings 33 - (549) - -
Acquisition of non controlling interest in subsidiary 33 - 549 - -
Exchange differences on translation of foreign operations 33 175 667 - -
Income tax on items of other comprehensive income 26 - - -
Net Actuarial losses (gains) recognised in respect of Defined Benefit Plans 44 (1,454) (686) (1,454) (686)
Total comprehensive income (9,906) (1,189) (10,020) (1,255)
Total comprehensive income attributable to Non-controlling interest (1) 106 - -
Total comprehensive income attributable to members of University of Wollongong
27,858 99,378 28,153 99,145
The above statement of comprehensive income should be read in conjunction with the accompanying notes.

84 University of Wollongong
Statement of Financial PositionAs at 31 December 2011
Consolidated University of Wollongong(Economic Entity) (Parent Entity)
2011 2010 2011 2010Notes $’000 $’000 $’000 $’000
AssetsCurrent assets
Cash and cash equivalents 18 32,214 33,870 6,541 11,122 Receivables 19 47,433 39,317 49,480 39,912 Inventories 20 2,838 3,059 398 573 Held to maturity investments 24 104,108 110,604 104,108 110,604 Non-current assets classified as held for sale 17, 21 334 55,408 - 55,408 Other non-financial assets 27 6,478 7,516 5,692 5,515
Total current assets 193,405 249,774 166,219 223,134
non-current assetsReceivables 19 194,350 123,410 195,875 123,506 Property, plant and equipment 25 623,348 609,886 617,209 602,722 Investment properties 23 35,002 - 35,002 - Deferred tax assets 1,540 1,544 - - Intangible assets 26 2,044 2,008 128 382 Other non-financial assets 27 3,413 6,300 3,238 6,046 Available-for-sale financial assets 22 110,082 55,141 109,037 54,009
Total non-current assets 969,779 798,289 960,489 786,665
Total assets 1,163,184 1,048,063 1,126,708 1,009,799
liabilitiesCurrent liabilities
Trade and other payables 28 29,108 27,703 23,129 23,361 Borrowings 29 94 237 - - Provisions 30 58,039 43,814 52,895 38,879 Current tax liabilities 31 6 176 - - Other liabilities 32 45,533 46,958 36,961 36,809
Total current liabilities 132,780 118,888 112,985 99,049
non-current liabilitiesBorrowings 29 78,692 77,811 77,832 76,946 Provisions 30 210,987 142,844 209,546 141,617 Other liabilities 32 14,784 10,440 25,083 19,078
Total non-current liabilities 304,463 231,095 312,461 237,641
Total liabilities 437,243 349,983 425,446 336,690
net assets 725,941 698,080 701,262 673,109
EquityParent entity interest
Reserves 33(a) (7,627) 825 (9,759) (1,193) Retained earnings 33(b) 733,568 697,257 711,021 674,302
Parent entity interest 725,941 698,082 701,262 673,109
Non-controlling interest 34 - (2) - -
Total equity 725,941 698,080 701,262 673,109
The above statement of financial position should be read in conjunction with the accompanying notes.
fiNaNcial stateMeNts

2011 Annual Report 85
Stat
emen
t of C
hang
es in
Equ
ityFo
r the
yea
r end
ed 3
1 D
ecem
ber 2
011
Con
solid
ated
Pare
nt
Rese
rves
non
con
trol
ling
inte
rest
Reta
ined
ea
rnin
gsTo
tal:
Ow
ners
of
the
pare
ntTo
tal
Rest
ricte
d fu
nds
Rese
rves
Reta
ined
ea
rnin
gsTo
tal
$’00
0$’
000
$’00
0$’
000
$’00
0$’
000
$’00
0$’
000
$’00
0
bala
nce
at 1
Jan
uary
20
10
1,32
8
(657
)
598,
031
59
8,70
2
598,
702
-
(6
24)
57
4,58
8
573,
964
Bala
nce
as re
stat
ed
1,32
8
(657
)
598,
031
59
8,70
2
598,
702
-
(6
24)
57
4,58
8
573,
964
Profi
t or (
loss
)
-
106
10
0,46
1
100,
567
10
0,56
7
-
-
100,
400
10
0,40
0
Act
uaria
l gai
ns (l
osse
s)
reco
gnis
ed d
irect
ly in
re
tain
ed e
arni
ngs
-
-
(6
86)
(6
86)
(6
86)
-
-
(6
86)
(6
86)
Incr
ease
/ (d
ecre
ase)
in
man
aged
fund
s re
valu
atio
n re
serv
e
(5
69)
-
-
(5
69)
(5
69)
-
(5
69)
-
(5
69)
Incr
ease
/ (d
ecre
ase)
in
finan
cial
ass
ets
at fa
ir va
lue
(6
01)
-
-
(6
01)
(6
01)
-
-
-
-
Tran
sfer
of r
eser
ve to
re
tain
ed e
arni
ngs
-
-
(5
49)
(5
49)
(5
49)
-
-
-
-
Gai
n on
fore
ign
exch
ange
66
7
-
-
667
66
7
-
-
-
-
Acq
uisi
tion
of n
on
cont
rolli
ng in
tere
st
-
549
-
54
9
549
-
-
-
-
Tota
l com
preh
ensi
ve
inco
me
(5
03)
65
5
99,2
26
99
,378
99,3
78
-
(5
69)
99
,714
99,1
45
bala
nce
at 3
1 D
ecem
ber
2010
82
5
(2)
69
7,25
7
698,
080
69
8,08
0
-
(1,1
93)
67
4,30
2
673,
109

86 University of Wollongong
Stat
emen
t of C
hang
es in
Equ
ityFo
r the
yea
r end
ed 3
1 D
ecem
ber 2
011
Con
solid
ated
Pare
nt
Rese
rves
non
con
trol
ling
inte
rest
Reta
ined
ea
rnin
gsTo
tal:
Ow
ners
of
the
pare
ntTo
tal
Rest
ricte
d fu
nds
Rese
rves
Reta
ined
ea
rnin
gsTo
tal
$’00
0$’
000
$’00
0$’
000
$’00
0$’
000
$’00
0$’
000
$’00
0
bala
nce
at 1
Jan
uary
20
11
825
(2
)
697,
257
69
8,08
0
698,
080
-
(1
,193
)
674,
302
67
3,10
9
Bala
nce
as re
stat
ed
825
(2
)
697,
257
69
8,08
0
698,
080
-
(1
,193
)
674,
302
67
3,10
9
Profi
t or (
loss
)
-
2
40,5
65
40
,567
40,5
67
-
-
38
,173
38,1
73
Incr
ease
/ (d
ecre
ase)
in
man
aged
fund
s re
valu
atio
n re
serv
e
(8
,566
)
-
-
(8,5
66)
(8
,566
)
-
(8,5
66)
-
(8
,566
)
Incr
ease
/ (d
ecre
ase)
in
finan
cial
ass
ets
at fa
ir va
lue
(6
1)
-
-
(6
1)
(6
1)
-
-
-
-
Act
uaria
l gai
ns (l
osse
s)
reco
gnis
ed d
irect
ly in
re
tain
ed e
arni
ngs
-
-
(1
,454
)
(1,4
54)
(1
,454
)
-
-
(1,4
54)
(1
,454
)
Div
iden
ds p
rovi
ded
for
or p
aid
-
-
(2
,800
)
(2,8
00)
(2
,800
)
-
-
-
-
Gai
n on
fore
ign
exch
ange
17
5
-
-
175
17
5
-
-
-
-
Tota
l com
preh
ensi
ve
inco
me
(8
,452
)
2
36,3
11
27
,861
27,8
61
-
(8
,566
)
36,7
19
28
,153
bala
nce
at 3
1 D
ecem
ber
2011
(7
,627
)
-
733,
568
72
5,94
1
725,
941
-
(9
,759
)
711,
021
70
1,26
2
The
abov
e st
atem
ent o
f cha
nges
in e
quity
sho
uld
be re
ad in
con
junc
tion
with
the
acco
mpa
nyin
g no
tes.
fiNaNcial stateMeNts

2011 Annual Report 87
Statement of Cash FlowsFor the year ended 31 December 2011
Consolidated(Economic Entity)
University of Wollongong(Parent Entity)
2011 2010 2011 2010Notes $’000 $’000 $’000 $’000
Cash flows from operating activitiesCGS and Other DEST Grants 45.1 115,965 114,113 115,965 114,113 Higher Education Loan Programmes 45.2 72,101 69,344 72,101 69,344 Scholarships 45.3 5,696 5,535 5,696 5,535 DIISR Research 45.4 23,216 22,239 23,216 22,239
Other Capital Funding 34,600 47,800 34,600 47,800 Australian Research Council Grants 45.6
Discovery 45.6(a) 12,502 10,722 12,502 10,722 Linkages 45.6(b) 5,085 4,926 5,085 4,926 Networks and Centres 45.6(c) 2,327 2,499 2,327 2,499
Other Australian Government Grants 4(h) 21,965 18,523 21,965 18,498 OS - HELP (net) 4(h) 1,005 1,337 1,005 1,337
State Government Grants 9,793 15,309 9,792 15,309 HECS-HELP - Student Payments 14,892 13,234 14,892 13,234 Receipts from student fees and other customers 173,117 180,447 130,738 133,789 Interest received 9,104 6,407 7,678 6,219 Other Revenue 49,057 47,214 42,302 43,528 Payments to suppliers and employees (inclusive of GST) (474,596) (429,879) (433,010) (386,893) Interest and other costs of finance (6,118) (3,680) (5,913) (3,600) Income taxes paid (1,095) (1,018) - -
net cash provided by / (used in) operating activities 42 68,616 125,072 60,941 118,599
Cash flows from investing activitiesProceeds from sale of property, plant and equipment 91 51 81 32 Proceeds from sale of financial assets 53,976 1,205 53,976 1,205 Repayment of loans 100 50 100 50 Dividends received - - 2,800 2,800 Payments for property, plant and equipment (77,905) (103,172) (75,878) (100,549) Payments for financial assets (53,976) (1,205) (53,976) (1,205) Interest received - 1,032 - -
net cash provided by / (used in) investing activities (77,714) (102,039) (72,897) (97,667)
Cash flows from financing activitiesProceeds from secured loans - 18 18 18 Proceeds from borrowings 956 20,317 886 20,317 Repayment of borrowings (173) (518) (18) (18)
net cash provided by / (used in) financing activities 783 19,817 886 20,317
net increase / (decrease) in cash and cash equivalents (8,315) 42,850 (11,070) 41,249
Cash and cash equivalents at the beginning of the financial year 144,474 101,168 121,726 80,432 Effects of exchange rate changes on cash and cash equivalents 163 456 (7) 45
Cash and cash equivalents at the end of the financial year 18 136,322 144,474 110,649 121,726
Financing arrangements 29
The above statement of cash flows should be read in conjunction with the accompanying notes.

88 University of Wollongong
cONTENTs Of ThE NOTEs TO ThE fiNaNciaL sTaTEMENTs note Page
1 Summary of significant accounting policies 882 Disaggregated information (dual sector institutions only) 1013 Critical accounting estimates and judgements 101 Revenue 4 Australian Government financial assistance including HECS-HELP and FEE-HELP 1025 State and Local Government financial assistance 1046 Fees and charges 1047 Investment revenue and income 1058 Consultancy and contracts 1059 Other revenue and income 105 Expenses10 Employee related expenses 10611 Depreciation and amortisation 10712 Repairs and maintenance 10713 Borrowing costs 10714 Impairment of assets 10815 Other expenses 10816 Income tax expense 10917 Discontinued operation 110 Assets18 Cash and cash equivalents 11119 Receivables 11220 Inventories 11421 Assets held for sale 11422 Available-for-sale financial assets 11523 Investment properties 11524 Held to maturity investments 11525 Property, plant and equipment 11626 Intangible assets 11827 Other non-financial assets 12028 Trade and other payables 12029 Borrowings 12130 Provisions 12431 Current tax liabilities 12532 Other liabilities 125 Equity33 Reserves and retained earnings 12534 Non-controlling interest 127 Disclosure notes35 Key management personnel disclosures 12736 Remuneration of auditors 12937 Contingencies 12938 Commitments 13039 Subsidiaries 13240 Contributions to controlled entities and financial arrangements 13341 Events occurring after the statement of financial position date 13442 Reconciliation of operating result after income tax to net cash flows from operating activities 13443 Financial risk management 13544 Defined Benefit Plans 14345 Acquittal of Australian Government financial assistance 147
fiNaNcial stateMeNts

2011 Annual Report 89
1 Summary of significant accounting policies
The principal accounting policies adopted in the preparation of these financial statements is set out below. These policies have been consistently applied for all years reported unless otherwise stated. The financial statements include separate statements for University of Wollongong as the parent entity and the consolidated entity consisting of University of Wollongong and its subsidiaries.
The principle address of the University of Wollongong is:
Northfields AvenueWollongongNSW 2522
(a) basis of preparation
The annual financial statements represent the audited general purpose financial statements which have been prepared on an accrual basis in accordance with Australian Accounting Standards, AASB Interpretations, the requirements of the Department of Education, Employment and Workplace Relations and other State/Australian Government legislative requirements.
Compliance with Public Finance and Audit Act 1983
The financial statements and notes have been prepared in accordance with the provisions of the Public Finance and Audit Act 1983 and the Public Finance and Audit Regulation 2010.
Compliance with IFRSThe financial statements and notes of University of Wollongong comply with Australian Accounting Standards, some of which contain requirements specific to not-for-profit entities that are inconsistent with IFRS requirements.
Date of authorisation for issueThe financial statements were authorised for issue by the members of University of Wollongong on 20th April 2011.
Historical cost conventionThese financial statements have been prepared under the historical cost convention, as modified by the revaluation of available-for-sale financial assets, financial assets and liabilities (including derivative instruments) at fair value through profit or loss and investment property.
Critical accounting estimatesThe preparation of financial statements in conformity with Australian Accounting Standards requires the use of certain critical accounting estimates. It also requires management to exercise its judgement in the process of applying the University of Wollongong’s accounting policies. The estimates and underlying assumptions are reviewed on an ongoing basis. The areas involving a higher degree of judgement or complexity, or areas where assumptions and estimates are significant to the financial statements, are disclosed below:
i. - Provisions (note 30)
ii. - Defined benefit plans (note 44)
(b) basis of consolidation
(i) Subsidiaries
The consolidated financial statements incorporate the assets and liabilities of all subsidiaries of University of Wollongong (‘’parent entity’’) as at 31 December 2011 and the results of all subsidiaries for the year then ended. The University of Wollongong and its subsidiaries together are referred to in this financial statement as the Group or the consolidated entity.
Subsidiaries are all those entities (including special purpose entities) over which the Group has the power to govern the financial and operating policies, generally accompanying a shareholding of more than one-half of the voting rights. The existence and effect of potential voting rights that are currently exercisable or convertible are considered when assessing whether the Group controls another entity.
Subsidiaries are fully consolidated from the date on which control is transferred to the Group. They are de-consolidated from the date that control ceases.
The acquisition method of accounting is used to account for the acquisition of subsidiaries by the Group (refer to note 1(g)).
Intercompany transactions, balances and unrealised gains on transactions between Group companies are eliminated. Unrealised losses are also eliminated unless the transaction provides evidence of the impairment of the asset transferred. Accounting policies of controlled entities have been changed where necessary to ensure consistency with the policies adopted by the Group except for property plant and equipment (refer to note 1)(o)).

90 University of Wollongong
(ii) Joint ventures
Joint venture operations
The proportionate interests in the assets, liabilities and expenses of a joint venture operation have been incorporated in the financial statements under the appropriate headings.
Joint venture entities
The interest in a joint venture entity is accounted for in the consolidated financial statements using the equity method and is carried at cost by the parent entity. Under the equity method, the share of the profits or losses of the entity is recognised in the income statement, and the share of movements in reserves is recognised in reserves in the statement of comprehensive income and the statement of changes in equity.
(c) Foreign currency translation
(i) Functional and presentation currency
Items included in the financial statements of each of the Group’s entities are measured using the currency of the primary economic environment in which the entity operations (‘the functional currency’). The consolidated financial statements presented in Australian dollars, which is University of Wollongong’s functional and presentation currency.
(ii) Transactions and balances
Foreign currency transactions are translated into the functional currency using the exchange rates prevailing at the dates of the transactions. Foreign exchange gains and losses resulting from the settlement of such transactions and from the translation at year-end exchange rates of monetary assets and liabilities denominated in foreign currencies are recognised in the income statement. Qualifying cash flow hedges and qualifying net investment hedges in a foreign operation shall be accounted for by recognising the portion of the gain or loss determined to be an effective hedge in other comprehensive income and the ineffective portion in profit or loss.
Translation differences on non-monetary financial assets and liabilities are reported as part of the fair value gain or loss. Translation differences on non-monetary financial assets and liabilities, such as equities held at fair value through profit or loss, are recognised in profit or loss as part of the fair value gain or loss. Translation differences on non-monetary financial assets are included in the fair value reserve in equity.
(iii) Group companies
The results and financial position of all the Group entities (none of which has the currency of a hyperinflationary economy) that have a functional currency different from the presentation currency are translated into the presentation currency as follows:
• assetsandliabilitiesforeachstatementoffinancialpositionpresentedaretranslatedattheclosingrateatthedateofthatstatementoffinancial position;
• incomeandexpensesforeachincomestatementaretranslatedataverageexchangerates(unlessthisisnotareasonableapproximationofthe cumulative effect of the rates prevailing on the transaction dates, in which case income and expenses are translated at the dates of the transactions); and
• allresultingexchangedifferencesarerecognisedasaseparatecomponentofequity.
On consolidation, exchange differences arising from the translation of any net investment in foreign entities, and of borrowings and other financial instruments designated as hedges of such investments, are accounted for by recognising the effective portion in other comprehensive income and the ineffective portion in the income statement. When a foreign operation is sold or any borrowings forming part of the net investment are repaid, the gain or loss relating to the effective portion of the hedge that has been recognised in other comprehensive income is reclassified from equity to the income statement as a reclassification adjustment.
Goodwill and fair value adjustments arising on the acquisition of foreign entities are treated as assets and liabilities of the foreign entities and translated at the closing rate.
(d) income recognition
Income is measured at the fair value of the consideration received or receivable. Amounts disclosed as Income are net of returns, trade allowances, rebates and amounts collected on behalf of third parties.
The Group recognises income when the amount of income can be reliably measured, it is probable that future economic benefits will flow to the Group and specific criteria have been met for each of the Group’s activities as described below. The amount of income is not considered to be reliably measurable until all contingencies relating to the sale have been resolved. The Group bases its estimates on historical results, taking into consideration the type of customer, the type of transaction and the specifics of each arrangement.
Income is recognised for the major business activities as follows:
fiNaNcial stateMeNts

2011 Annual Report 91
(i) Government grants
The University of Wollongong treats operating grants received from Australian Government entities as income in the year of receipt.
Grants from the government are recognised at their fair value where the Group obtains control of the right to receive the grant, it is probable that economic benefits will flow to the Group and it can be reliably measured.
(ii) Student fees and charges
Fees and charges are recognised as income in the period to which the course relates. Fees for students who have enrolled prior to year end for a course in the following year, are recognised as income in advance once an invoice has been issued. Where these invoices are not paid prior to year end, a receivable is recognised.
(iii) Sale of goods and services
Sales income comprises income earned (net of returns, discounts and allowances) from the supply of products to entities outside the consolidated entity. Sales income is recognised when control and title of goods passes to the customer.
(iv) Fees and charges for services
Income from services rendered is recognised in the period in which the service is provided, having regard to the stage of completion of the service.
(v) Investment income
Interest income is recognised as it accrues.
(vi) Lease income
Lease income from operating leases is recognised in income on a straight-line basis over the lease term.
(vii) Consultancy and contract revenue
Consultancy and contract income is recognised in income when it is earned.
(e) income tax
The Parent is exempt from income tax under the Commonwealth income taxation legislation. Within the consolidated entity, however, ITC Ltd is not exempt from this legislation. Unicentre Conferences and Functions Pty Ltd is also not exempt from this legislation but has not traded in 2011.
The income tax expense or income for the period is the tax payable on the current period’s taxable income based on the national income tax rate for each jurisdiction adjusted by changes in deferred tax assets and liabilities attributable to temporary differences between the tax bases of assets and liabilities and their carrying amounts in the financial statements, and to unused tax losses.
Deferred income tax is provided in full, using the liability method, on temporary differences arising between the tax bases of assets and liabilities and their carrying amounts in the consolidated financial statements. However, the deferred income tax is not accounted for if it arises from initial recognition of an asset or liability in a transaction other than a business combination that at the time of the transaction affects neither accounting nor taxable profit or loss. Deferred income tax is determined using tax rates (and laws) that have been enacted or substantially enacted by the statements of financial position date and are expected to apply when the related deferred income tax asset is realised or the deferred income tax liability is settled.
Deferred tax assets are recognised for deductible temporary differences and unused tax losses, only if it is probable that future taxable amounts will be available to utilise those temporary differences and losses.
Deferred tax liabilities and assets are not recognised for temporary differences between the carrying amount and tax bases of investments in controlled entities where the parent entity is able to control the timing of the reversal of the temporary differences and it is probable that the differences will not reverse in the foreseeable future.
Current and deferred tax assets and liabilities relating to the same taxation authority are offset when there is a legally enforceable right to offset current tax assets and liabilities and they are intended to be either settled on a net basis, or the asset is to be realised and the liability settled simultaneously.
Current and deferred tax balances attributable to amounts recognised outside profit and loss are also recognised outside profit and loss.
(f) leases
Leases of property, plant and equipment where the Group, as leasee, has substantially all the risks and rewards of ownership are classified as finance leases (note 25). Finance leases are capitalised at the lease’s inception at the lower of the fair value of the leased property and the present value of the minimum lease payments. The corresponding rental obligations, net of finance charges, are included in other short-term and long-term payables. Each lease payment is allocated between the liability and finance cost. The finance cost is charged to the income statement over the lease period so as to produce a constant periodic rate of interest on the remaining balance of the liability for each period. The property, plant and equipment acquired under finance leases are depreciated over the shorter of the asset’s useful life and the lease term.

92 University of Wollongong
Leases in which a significant portion of the risks and rewards of ownership are retained by the lessor are classified as operating leases (note 38). Payments made under operating leases (net of any incentives received from the lessor) are charged to the income statement on a straight-line basis, over the period of the lease.
Lease income from operating leases is recognised in income on a straight-line basis over the lease term.
(g) business combinations
The acquisition method shall be applied to account for each business combination; this does not include a combination of entities or businesses under common control, the formation of a joint venture, or the acquisition of an asset or a group of assets. The acquisition method requires identification of the acquirer, determining the acquisition date and recognising and measuring the identifiable assets acquired, liabilities assumed, goodwill gained, a gain from a bargain purchase and any in the acquiree. Identifiable assets acquired, liabilities assumed and any in the acquiree shall be recognised separately from goodwill as of the acquisition date. Intangible assets acquired in a business combination are recognised separately from goodwill if they are separable, but only together with a related contract, identifiable asset or liability. Acquisition related costs are expensed in the periods in which they are incurred with the exception of costs to issue debt or equity securities, which are recognised in accordance with AASB132 and AASB139.
Identifiable assets acquired and liabilities and contingent liabilities assumed in a business combination are measured initially at their fair values at the acquisition date. Measurement of any non-controlling interest in the acquiree is at fair value or at the non controlling interest’s proportionate share of the acquiree’s identifiable net assets. Contingent liabilities assumed are recognised as part of the acquisition if there is a present obligation arising from past events and the fair value can be reliably measured. The excess at the acquisition date of the aggregate of the consideration transferred, the amount of any and any previously held equity interest in the acquiree, over the net amounts of identifiable assets acquired and liabilities assumed is recognised as goodwill (refer to note 1(p)). If the cost of acquisition is less than the fair value of the identifiable net assets of the subsidiary acquired, the difference is recognised directly in the income statement of the acquirer, but only after a reassessment of the identification and measurement of the net assets acquired.
Consideration transferred in a business combination shall be measured at fair value. Where the business combination is achieved in stages, the acquirer shall remeasure previously held equity interest in the acquiree at its acquisition date fair value and recognise the resulting gain or loss in profit or loss.
The University’s policy is to capitalise purchases of land, buildings, infrastructure, library collection, works of art, motor vehicles, computer and other equipment over $5,000, as part of a business combination.
(h) impairment of assets
Goodwill and intangible assets that have an indefinite useful life are not subject to amortisation and are tested annually for impairment, or more frequently if events or changes in circumstances indicate that they might be impaired. Other assets are reviewed for impairment whenever events or changes in circumstances indicate that the carrying amount may not be recoverable. An impairment loss is recognised for the amount by which the asset’s carrying amount exceeds its recoverable amount. The recoverable amount is the higher of an asset’s fair value less costs to sell and value in use. For the purposes of assessing impairment, assets are grouped at the lowest levels for which there are separately identifiable cash flows which are largely independent of the cash inflows from other assets or groups of assets (cash generating units). Non-financial assets other than goodwill that suffered an impairment are reviewed for possible reversal of the impairment at each reporting date.
(i) Cash and cash equivalents
For statement of cash flows presentation purposes, cash and cash equivalents includes cash on hand, deposits held at call with financial institutions, other short-term, highly liquid investments with original maturities of three months or less that are readily convertible to known amounts of cash and which are subject to an insignificant risk of changes in value, and bank overdrafts. Bank overdrafts are shown within borrowings in current liabilities on the statement of financial position.
(j) Trade receivables
Trade receivables are recognised initially at fair value and subsequently measured at amortised cost using the effective interest method, less provision for impairment. Trade receivables are due for settlement no more than 120 days for related parties, and no more than 30 days for other debtors.
Collectability of trade receivables is reviewed on an ongoing basis. Debts which are known to be uncollectible are written off. A provision for impairment of receivables is established when there is objective evidence that the Group will not be able to collect all amounts due according to the original terms of receivables. Significant financial difficulties of the debtor, probability that the debtor will enter bankruptcy or financial reorganisation, and default or delinquency in payments (more than 30 days overdue) are considered indicators that the trade receivable is impaired. The amount of the provision is the difference between the asset’s carrying amount and the present value of estimated future cash flows, discounted at the effective interest rate. Cash flows relating to short-term receivable are not discounted if the effect of discounting is immaterial. The amount of the provision is recognised in the income statement.
The carrying amount of the asset is reduced through the use of an allowance account and the amount of the loss is recognised in the income statement within ‘other expenses’. When a trade receivable is uncollectible, it is written off against the allowance account for trade receivables. Subsequent recoveries of amounts previously written off are credited against other expense in the income statement.
fiNaNcial stateMeNts
2011 Annual Report 93
(k) inventories
The Group value inventory using two methods. The printing stores, work in progress and finished goods inventory is valued on a first in first out basis. For all other stores, work in progress and finished goods inventory are valued on the basis of weighted average costs.
Under the weighted average method, stores, work in progress and finished goods are stated at the lower of cost and net realisable value. Cost comprises direct materials, direct labour and an appropriate proportion of variable and fixed overhead expenditure, the latter being allocated on the basis of normal operating capacity. Costs are assigned to individual items of inventory on the basis of weighted average costs. Costs of purchased inventory are determined after deducting rebates and discounts. Net realisable value is the estimated selling price in the ordinary course of business less the estimated costs of completion and the estimated costs necessary to make the sale.
(l) non-current assets (or disposal groups) held for sale and discontinued operations
Non-current assets (or disposal groups) are classified as held for sale and stated at the lower of their carrying amount and fair value less costs to sell, if their carrying amount will be recovered principally through a sale transaction rather than through continuing use.
An impairment loss is recognised for any initial or subsequent write down of the asset (or disposal group) to fair value less costs to sell. A gain is recognised for any subsequent increases in fair value less costs to sell of an asset (or disposal group), but not in excess of any cumulative impairment loss previously recognised. A gain or loss not previously recognised by the date of the sale of the non-current asset (or disposal group) is recognised at the date of derecognition.
Non-current assets (including those that are part of a disposal group) are not depreciated or amortised while they are classified as held for sale. Interest and other expenses attributable to the liabilities of a disposal group classified as held for sale continue to be recognised.
Non-current assets classified as held for sale and the assets of a disposal group classified as held for sale are presented separately from the other assets in the statement of financial position. The liabilities of a disposal group classified as held for sale are presented separately from other liabilities in the statement of financial position.
A discontinued operation is a component of the Group that has been disposed of or is classified as held for sale and that represents a separate major line of business or geographical area of operations, is part of a single co-ordinated plan to dispose of such a line of business or area of operations, or is a subsidiary acquired exclusively with a view to resale. The results of discontinued operations are presented separately on the face of the income statement.
(m) investments and other financial assets
ClassificationThe Group classifies its investments in the following categories: financial assets at fair value through profit or loss, loans and receivables, held-to-maturity investments, and available-for-sale financial assets. The classification depends on the purpose for which the investments were acquired. Management determines the classification of its investments at initial recognition and, in the case of assets classified as held-to-maturity, re-evaluates this designation at each reporting date.
(i) Financial assets at fair value through profit or loss
Financial assets at fair value through profit or loss include financial assets held for trading. A financial asset is classified in this category if it is acquired principally for the purpose of selling in the short term. Derivatives are classified as held for trading unless they are designated as hedges. Assets in this category are classified as current assets.
(ii) Loans and receivables
Loans and receivables are non-derivative financial assets with fixed or determinable payments that are not quoted in an active market. They are included in current assets, except for those with maturities greater than 12 months after the statement of financial position date which are classified as non-current assets. Loans and receivables are included in receivables in the statement of financial position.
(iii) Held-to-maturity investments
Held-to-maturity investments are non-derivative financial assets with fixed or determinable payments and fixed maturities that the Group’s management has the positive intention and ability to hold to maturity.
If the Group were to sell other than an insignificant amount of held-to-maturity financial assets, the whole category would be tainted and reclassified as available-for-sale. Held-to-maturity financial assets are included in non-current assets, except for those with maturities less than 12 months from the reporting date, which are classified as current assets.
(iv) Available-for-sale financial assets
Available-for-sale financial assets, comprising principally marketable equity securities, are non-derivatives that are either designated in this category or not classified in any of the other categories. They are included in non-current assets unless management intends to dispose of the investment within 12 months of the statement of financial position date.
Regular purchases and sales of financial assets are recognised on trade-date - the date on which the Group commits to purchase or sell the asset.

94 University of Wollongong
Investments are initially recognised at fair value plus transaction costs for all financial assets not carried at fair value through profit or loss. Financial assets carried at fair value through profit or loss are initially recognised at fair value and transaction costs are expensed in the income statement. Financial assets are derecognised when the rights to receive cash flows from the financial assets have expired or have been transferred and the Group has transferred substantially all the risks and rewards of ownership.
When securities classified as available-for-sale are sold, the accumulated fair value adjustments recognised in equity are included in the Income Statement as gains and losses from investment securities.
Subsequent measurementAvailable-for-sale financial assets and financial assets at fair value through profit and loss are subsequently carried at fair value. Loans and receivables and held-to-maturity investments are carried at amortised cost using the effective interest method. Gains or losses arising from changes in the fair value of the ‘financial assets at fair value through profit or loss’ category are included in the income statement within other income or other expenses in the period in which they arise.
Changes in the fair value of monetary security denominated in a foreign currency and classified as available-for-sale are analysed between translation differences resulting from changes in amortised cost of the security and other changes in the carrying amount of the security. The translation differences related to changes in the amortised cost are recognised in profit or loss, and other changes in carrying amount are recognised in equity. Changes in the fair value of other monetary and non-monetary securities classified as available-for-sale are recognised in equity.
Fair valueThe fair values of quoted investments are based on current bid prices. If the market for a financial asset is not active (and for unlisted securities), the Group establishes fair value by using valuation techniques. These include reference to the fair values of recent arm’s length transactions, involving the same instruments or other instruments that are substantially the same, discounted cash flow analysis, and option pricing models refined to reflect the issuer’s specific circumstances.
ImpairmentThe Group assesses at each balance date whether there is objective evidence that a financial asset or group of financial assets is impaired. In the case of equity securities classified as available-for-sale, a significant or prolonged decline in the fair value of a security below its cost is considered as in determining whether the security is impaired. If any such evidence exists for available-for-sale financial assets, the cumulative loss - measured as the difference between the acquisition cost and the current fair value, less any impairment loss on that financial asset previously recognised in profit and loss - is removed from equity and recognised in the income statements. Impairment losses recognised in the income statements on equity instruments are not reversed through the income statement.
(n) Fair value estimation
The fair value of financial assets and financial liabilities must be estimated for recognition and measurement or for disclosure purposes.
The group classifies fair value measurements using a fair value hierarchy that reflects the significance of the inputs used in making the measurements. The fair value of financial instruments traded in active markets (such as publicly traded derivatives, and trading and available-for-sale securities) is based on quoted market prices for identical assets or liabilities at the statements of financial position date (Level 1). The quoted market price used for financial assets held by the Group is the current bid price.
The fair value of financial instruments that are not traded in an active market (for example, over-the-counter derivatives) is determined using valuation techniques. The Group uses a variety of methods and makes assumptions that are based on market conditions existing at each balance date. Quoted market prices or dealer quotes for similar instruments (Level 2) are used for long-term debt instruments held. Other techniques that are not based on observable market data (Level 3) such as estimated discounted cash flows, are used to determine fair value for the remaining financial instruments. The fair value of interest-rate swaps is calculated as the present value of the estimated future cash flows. The fair value of forward exchange contracts is determined using forward exchange market rates at the statements of financial position date. The level in the fair value hierarchy shall be determined on the basis of the lowest level input that is significant to the fair value measurement in its entirety.
The carrying value less impairment provision of trade receivables and payables are assumed to approximate their fair values due to their short-term nature. The fair value of financial liabilities for disclosure purposes is estimated by discounting the future contractual cash flows at the current market interest rate that is available to the Group for similar financial instruments.
(o) Property, plant and equipment
Items of property, plant and equipment are stated at cost or deemed cost less accumulated depreciation (see below) and impairment losses - see accounting policy (h).
Subsequent costs are included in the asset’s carrying amount or recognised as a separate asset, as appropriate, only when it is probable that future economic benefits associated with the item will flow to the Group and the cost of the item can be measured reliably. All other repairs and maintenance are charged to the income statement during the financial period in which they are incurred.
Certain items of property, plant and equipment that had been revalued to fair value on or prior to 1 January 2004, the date of transition to Australian Accounting Standards - AIFRSs, are measured on the basis of deemed cost, being the revalued amount at the date of that revaluation.
Land and Works of Art are not depreciated.
fiNaNcial stateMeNts

2011 Annual Report 95
Under the Groups assets policy, some building improvements are not recognised as assets and are expensed in the period they occur. Under the University’s practice, if a building improvement does not increase the floor area and capacity, then it is improbable that future economic benefits will be increased and the costs are expensed.
The following summaries the differences in accounting policies for property plant and equipment between the Group:
Capitalisation threshold:
Parent
- University of Wollongong >$5,000, furniture is not capitalised
Subsidiaries
- ITC > $300
- Unicentre > $5,000
- URAC > $5,000
The Group has assessed the differences in the accounting treatment and consider any differences to be immaterial.
Depreciation on other assets is calculated using the straight line method except for library assets which applies the written down value method. The cost allocated over their estimated useful lives is as follows:
Asset life- Buildings and improvements 1 to 40 years- Computer Equipment 3 to 5 years- Other Equipment 25 to 40 years- Vehicles 5 years- Library holdings 1 to 10 yearsInfrastructure 3 to 26 years
The library holdings are reviewed every year to account for the additions and disposals. The result is the library holdings are depreciated between 1 and 10 years.
The assets’ useful lives and residual values are reviewed, and adjusted if appropriate, at each statement of financial position date.
An asset’s carrying amount is written down immediately to its recoverable amount if the asset’s carrying amount is greater than its estimated recoverable amount.
Gains and losses on disposals are determined by comparing proceeds with carrying amount. These are included in the income statement.
(p) intangible assets
(i) Research and development
Expenditure on research activities is recognised in the income statement as an expense, when it is incurred.
Expenditure on development activities, relating to the design and testing of new or improved products, are recognised as intangible assets when it is probable that the project will, after considering its commercial and technical feasibility, be completed and generate future economic benefits and its costs can be measure reliably. The expenditure capitalised comprises all directly attributable costs, including costs of materials, services, direct labour and an appropriate proportion of overheads. Other development expenditure is recognised in the income statement as an expense as incurred. Development costs previously recognised as an expense are not recognised as an asset in a subsequent period. Capitalised development expenditure are recorded as intangible assets and amortised from the point at which the asset is ready for use. Amortisation is calculated using the straight-line method to allocate the cost over the period of the expected benefit, which varies from 3 to 5 years.
(ii) Computer software
Computer software is amortised using the straight line method to allocate its cost, net or any residual value, over its estimated useful life. Computer software is amortised at between 20% and 33% per annum.
Software maintenance less than 1 year is expensed.
(iii) Goodwill
Goodwill represents the excess of the fair value measurement of consideration transferred in an acquisition over the fair value of the Group’s share of the net identifiable assets of the acquiree at the date of acquisition. Goodwill on acquisitions of subsidiaries is included in intangible assets. Goodwill on acquisitions of associates is included in investments in associates. Goodwill is not amortised, instead it is tested for impairment annually, or more frequently if events or changes in circumstances indicate that it might be impaired, and is carried at cost less accumulated impairment losses. Gains
96 University of Wollongong
and losses on the disposal of an entity include the carrying amount of goodwill relating to the entity sold.
(q) Unfunded superannuation
In accordance with the 1998 instructions issued by the Department of Education, Training and Youth Affairs (DETYA) now known as the Department of Education, Employment and Workplace Relations (DEEWR), the effects of the unfunded superannuation liabilities of University of Wollongong and its controlled entities were recorded in the Income Statement and the statement of financial position for the first time in 1998. The prior years’ practice had been to disclose liabilities by way of a note to the financial statements.
The unfunded liabilities recorded in the statement of financial position under Provisions have been determined by Pillar for State Authorities Superannuation Scheme (SASS), State Superannuation Scheme (SSS) and State Authorities Non-contributory Superannuation Scheme (SANCS) and ALEA Actuarial Consulting Pty Ltd for the Professorial Superannuation Fund. For principal assumptions used in the actuarial valuations (refer to note 44).
An arrangement exists between the Australian Government and the State Government to meet the unfunded liability for the University of Wollongong’s beneficiaries of the State Superannuation Scheme and State Authorities Superannuation Scheme on an emerging cost basis. This arrangement is evidenced by the State Grants (General Revenue) Amendment Act 1987, Higher Education Funding Act 1988 and subsequent amending legislation. Accordingly, the unfunded liabilities have been recognised in the statement of financial position under Provisions with a corresponding asset recognised under Receivables. The recognition of both the asset and the liability consequently does not affect the year end net asset position of the University of Wollongong and its controlled entities.
(r) Trade and other payables
These amounts represent liabilities for goods and services provided to the Group prior to the end of financial year, which are unpaid. The amounts are unsecured and are usually paid within 120 days for related parties and 30 days for other creditors.
(s) borrowings
Borrowings are initially recognised at fair value, net of transaction costs incurred. Borrowings are subsequently measured at amortised cost. Any difference between the proceeds (net of transaction costs) and the redemption amount is recognised in the income statement over the period of the borrowings using the effective interest method. Fees paid on the establishment of loan facilities, which are not an incremental cost relating to the actual draw-down of the facility, are recognised as prepayments and amortised on a straight-line basis over the term of the facility.
Preference shares, which are mandatorily redeemable on a specific date, are classified as liabilities. The dividends on these preference shares are recognised in the income statement as finance costs.
The fair value of the liability portion of a convertible bond is determined using a market interest rate for an equivalent non-convertible bond. This amount is recorded as a liability on an amortised cost basis until extinguished on conversion or maturity of the bonds. The remainder of the proceeds is allocated to the conversion option. This is recognised and included in shareholders’ equity, net of income tax effects.
Borrowings are removed from the statement of financial position when the obligation specified in the contract is discharged, cancelled or expired. The difference between the carrying amount of a financial liability that has been extinguished or transferred to another party and the consideration paid, including any non-cash assets transferred or liabilities assumed, is recognised in other income or other expenses.
Borrowings are classified as current liabilities unless the Group has an unconditional right to defer settlement of the liability for at least 12 months after the statement of financial position date and does not expect to settle the liability for at least 12 months after the statement of financial position date.
(t) borrowing costs
Borrowing costs incurred for the construction of any qualifying asset are capitalised during the period of time that is required to complete and prepare the asset for its intended use or sale. Other borrowing costs are expensed.
(u) Provisions
Provisions for legal claims and service warranties are recognised when: the Group has a present legal or constructive obligation as a result of past events; it is probable that an outflow of resources will be required to settle the obligation and the amount has been reliably estimated.
Provisions are not recognised for future operating losses.
Where there are a number of similar obligations, the likelihood that an outflow will be required in settlement is determined by considering the class of obligations as a whole. A provision is recognised even if the likelihood of an outflow with respect to any one item included in the same class of obligations may be small.
Provisions are measured at the present value of management’s best estimate of the expenditure required to settle the present obligation at the statements of financial position date. The discount rate used to determine the present value reflects current market assessments of the time value of
fiNaNcial stateMeNts

2011 Annual Report 97
money and the risks specific to the liability. The increase in the provision due to the passage of time is recognised as a finance cost.
(v) Employee benefits
(i) Wages and salaries
Liabilities for short-term employee benefits including wages and salaries, non-monetary benefits and profit-sharing bonuses due to be settled within 12 months after the end of the period are measure at the amount expected to be paid when the liability is settled and recognised in other payables. Liabilities for non-accumulating sick leave are recognised when the leave is taken and measured at the rates paid or payable.
(ii) Annual leave and sick leave
The liability for long-term employee benefits such as annual leave and accumulating sick leave is recognised in current provisions for employee benefits as it is not due to be settled within 12 months after the end of the reporting period. It is measured at the amount expected to be paid when the liability is settled. Regardless of the expected timing of settlements, provisions made in respect of employee benefits are classified as a current liability, unless there is an unconditional right to defer the settlement of the liability for at least 12 months after the reporting date, in which case it would be classified as a non-current liability.
(iii) Long service leave
The liability for long service leave is recognised in the provision for employee benefits and measured as the present value of expected future payments to be made in respect of services provided by employees up to the reporting date using the projected unit credit method. Consideration is given to expected future wage and salary levels, experience of employee departures and periods of service. Expected future payments are discounted using market yields at the reporting date on national government bonds with terms to maturity and currency that match, as closely as possible, the estimated future cash outflows.
For the parent entity, the provision for LSL was assessed by PricewaterhouseCoopers for the year ending 31 December 2011. The assumptions used to calculate the long service leave provision include:
- Salary inflation rate per annum 4.0%
- Discount rate 3.3%
- Proportion of leave taken in service 12%
(iv) Retirement benefit obligations
All employees of the Group are entitled to benefits on retirement, disability or death from the Group’s superannuation plan. The Group has a defined benefit section and a defined contribution section within its plan. The defined benefit section provides defined lump sum benefits based on years of service and final average salary. The defined contribution section receives fixed contributions from Group entities and the Group’s legal or constructive obligation is limited to these contributions.
A liability or asset in respect of defined benefit superannuation plans is recognised in the statements of financial position, and is measured as the present value of the defined benefit obligation at the reporting date less the fair value of the superannuation fund’s assets at that date and any unrecognised past service cost. The present value of the defined benefit obligation is based on expected future payments which arise from membership of the fund to the reporting date, calculated annually by independent actuaries using the projected unit credit method. Consideration is given to expected future wage and salary levels, experience of employee departures and periods of service.
Expected future payments are discounted using market yields at the reporting date on national government bonds with terms to maturity and currency that match, as closely as possible, the estimated future cash outflows.
Actuarial gains and losses arising from experience adjustments and changes in actuarial assumptions are recognised in the period in which they occur, outside of the income statement, in the statement of comprehensive income.
Past service costs are recognised immediately in income, unless the changes to the superannuation fund are conditional on the employees remaining in service for a specified period of time (the vesting period). In this case, the past service costs are amortised on a straight-line basis over the vesting period.
Contributions to the defined contribution fund are recognised as an expense as they become payable. Prepaid contributions are recognised as an asset to the extent that a cash refund or a reduction in the future payments is available.
The unfunded liabilities recorded in the statement of financial position under Provisions have been determined by independent actuaries relating to the defined benefit superannuation plan State Superannuation Scheme (SSS), State Authorities Superannuation Scheme (SASS), State Authorities Non-Contributory Superannuation Scheme (SANCS) and for the UOW Professorial Superannuation Fund.
(v) Workers’ Compensation
The University has determined to self –insure for workers compensation. A provision for self –insurance has been made to recognise outstanding claims, the amount of which is detailed in note 30.

98 University of Wollongong
The provision for Workers compensation was determined by David A. Zaman Pty Ltd on 23 December 2011. Key assumptions made in the report are:
• Underlyingriskpremiumrateforfutureperiodsis0.25%(incurrentvalues);
• Claimsescalationisestimatedat4%forfutureyears;
• Payrollforthe12monthsending31stDecember2012wastakentobe$237m.
As a self-insurer, the Group sets a notional annual premium, which is charged on in-service salaries. Costs of workers’ compensation claims, claims administration expenses and actuarially assessed increases/decreases in the provision for outstanding claims liability are met from the notional premium. The outstanding claims liability includes incidents incurred but not reported as assessed actuarially. The Group contributes to the WorkCover authorities for its general fund, dust and diseases fund, insurers guarantee fund, and disaster insurance premiums. It is also a requirement of the license that the Group maintain a provision for each fund in respect of outstanding claims liability as at 31 December each year.
(vi) Termination benefits
Termination benefits are payable when employment is terminated before the normal retirement date, or when an employee accepts voluntary redundancy in exchange for these benefits. The Group recognises termination benefits when it is demonstrably committed to either terminating the employment of current employees according to a detailed formal plan without possibility of withdrawal or providing termination benefits as a result of an offer made to encourage voluntary redundancy. Benefits falling due more than 12 months after balance date are discounted to present value.
(w) Rounding of amounts
The University of Wollongong has rounded off to the nearest thousand dollars, or in certain cases, the nearest dollar.
(x) Government grants
Grants from the government are recognised at their fair value where the Group obtains control of the right to receive the grant, it is probable that economic benefits will flow to the Group and it can be reliably measured.
(y) Goods and Services Tax (GST)
Income, expenses and assets are recognised net of the amount of associated GST, unless the GST incurred is not recoverable from the taxation authority. In this case it is recognised as part of the cost of acquisition of the asset or as part of the expense.
Receivables and payables are stated inclusive of the amount of GST receivable or payable. The net amount of GST recoverable from, or payable to, the taxation authority is included with other receivables or payables in the statement of financial position.
Cash flows are presented on a gross basis. The GST components of cash flows arising from investing or financing activities which are recoverable from, or payable to the taxation authority, are presented as operating cash flow.
(z) Comparative amounts
Where the presentation or reclassification of items in the financial statements is amended, comparable amounts shall be reclassified unless reclassification is impracticable. When comparable amounts are reclassified, the University of Wollongong will disclose:
(a) the nature of the reclassification;
(b) the amount of each item or class of items that is reclassified; and
(c) the reason for the reclassification.
When it is impracticable to reclassify comparative amounts, the University of Wollongong will disclose:
(a) the reason for not reclassifying the amounts; and
(b) the nature of the adjustments that would have been made, if the amounts had been reclassified.
(aa) Financial guarantee contracts
Financial guarantee contracts are recognised as a financial liability at the time the guarantee is issued. The liability is initially measured at fair value and subsequently at the higher of the amount determined in accordance with AASB 137 Provisions, Contingent Liabilities and Contingent Assets and the amount initially recognised less cumulative amortisation, where appropriate.
The fair value of financial guarantees is determined as the present value of the difference in net cash flows between the contractual payments under the debt instrument and the payments that would be required without the guarantee, or the estimated amount that would be payable to a third party for assuming the obligations.
fiNaNcial stateMeNts

2011 Annual Report 99
Where guarantees in relation to loans or other payables of subsidiaries or associates are provided for no compensation, the fair values are accounted for as contributions and recognised as part of the cost of the investment.
(ab) investment properties
Investment properties exclude properties held to meet service delivery objectives of the University of Wollongong. The investment property held by the University of Wollongong is Enterprise 1 located on the Innovation Campus.
Investment properties are initially recognised at cost. Costs incurred subsequent to initial acquisition are capitalised when it is probable that future economic benefits in excess of the originally assessed performance of the asset will flow to the University of Wollongong. Where an investment property is acquired at no cost or for nominal consideration, its cost shall be deemed to be its fair value, as at the date of acquisition.
Rental revenue from the leasing of investment properties is recognised in the income statement in the periods in which it is receivable, as this represents the pattern of service rendered though the provision of the properties.
(ac) new Accounting Standards and interpretations
Certain new Accounting Standards and Interpretations have been published that are not mandatory for 31 December 2011 reporting periods. The University of Wollongong did not early adopt any new Accounting Standards and Interpretations that are not yet effective.
The following new Accounting Standards and Interpretations have not been adopted and are not yet effective.
Compiled Standards
Standard name Application Date
AASB 9 Financial Instruments 1 January 2013
AASB 10 Consolidated Financial Statements 1 January 2013
AASB 11 Joint Arrangements 1 January 2013
AASB 12 Disclosure of Interests in Other Entities 1 January 2013
AASB 13 Fair Value Measurement 1 January 2013
AASB 119 Employee Benefits 1 January 2013
AASB 127 Separate Financial Statements 1 January 2013
AASB 128 Investments in Associates and Joint Ventures 1 January 2013
AASB 1053 Application of Tiers of Australian Accounting Standards 1 July 2013
100 University of Wollongong
Amending Standards and Errata affecting Standards and interpretations
Standard name Application Date
2010-2 Amendments to Australian Accounting Standards arising from Reduced Disclosure Requirements[AASB 1, 2, 3, 5, 7, 8, 101, 102, 107, 108, 110, 111, 112, 116, 117, 119, 121, 123, 124, 127, 128, 131, 133, 134, 136, 137, 138, 140, 141, 1050 & 1052 and Interpretations 2, 4, 5, 15, 17, 127, 129 & 1052]
1 July 2013
2010-7 Amendments to Australian Accounting Standards arising from AASB 9 (December 2010) [AASB 1, 3, 4, 5, 7, 101, 102, 108, 112, 118, 120, 121, 127, 128, 131, 132, 136, 137, 139, 1023 & 1038 and Interpretations 2, 5, 10, 12, 19 & 127]
1 January 2013
2010-8 Amendments to Australian Accounting Standards – Deferred Tax: Recovery of Underlying Assets [AASB 112]
1 January 2012
2010-10 Further Amendments to Australian Accounting Standards – Removal of Fixed Dates for First-time Adopters [AASB 2009-11 & AASB 2010-7]
1 January 2013
2011-2 Amendments to Australian Accounting Standards arising from the Trans-Tasman Convergence Project – Reduced Disclosure Requirements[AASB 101 & AASB 1054]
1 July 2013
2011-3 Amendments to Australian Accounting Standards – Orderly Adoption of Changes to the ABS GFS Manual and Related Amendments [AASB 1049]
1 July 2012
2011-4 Amendments to Australian Accounting Standards to Remove Individual Key Management Personnel Disclosure Requirements[AASB 124]
1 July 2013
2011-6 Amendments to Australian Accounting Standards – Extending Relief from Consolidation, the Equity Method and Proportionate Consolidation – Reduced Disclosure Requirements[AASB 127, AASB 128 & AASB 131]
1 July 2013
2011-7 Amendments to Australian Accounting Standards arising from the Consolidation and Joint Arrangements Standards [AASB 1, 2, 3, 5, 7, 9, 2009-11, 101, 107, 112, 118, 121, 124, 132, 133, 136, 138, 139, 1023 & 1038 and Interpretations 5, 9, 16 & 17]
1 January 2013
2011-8 Amendments to Australian Accounting Standards arising from AASB 13 [AASB 1, 2, 3, 4, 5, 7, 9, 2009-11, 2010-7, 101, 102, 108, 110, 116, 117, 118, 119, 120, 121, 128, 131, 132, 133, 134, 136, 138, 139, 140, 141, 1004, 1023 & 1038 and Interpretations 2, 4, 12, 13, 14, 17, 19, 131 & 132]
1 January 2013
2011-9 Amendments to Australian Accounting Standards – Presentation of Items of Other Comprehensive Income [AASB 1, 5, 7, 101, 112, 120, 121, 132, 133, 134, 1039 & 1049]
1 July 2012
2011-10 Amendments to Australian Accounting Standards arising from AASB 119 (September 2011) [AASB 1, AASB 8, AASB 101, AASB 124, AASB 134, AASB 1049 & AASB 2011-8 and Interpretation 14]
1 January 2013
2011-11 Amendments to AASB 119 (September 2011) arising from Reduced Disclosure Requirements 1 July 2013
2011-12 Amendments to Australian Accounting Standards arising from Interpretation 20[AASB 1] 1 January 2013
2011-13 Amendments to Australian Accounting Standard – Improvements to AASB 1049 1 July 2012
interpretations
interpretation name Application Date
Interpretation 20 Stripping Costs in the Production Phase of a Surface Mine 1 January 2013
The University has assessed the impact of these new Standards and Interpretations and considers the impact to be insignificant.
fiNaNcial stateMeNts

2011 Annual Report 101
2 Disaggregated information (dual sector institutions only)
(a) Geographical
(Economic Entity) Revenue Results Assets
2011 2010 2011 2010 2011 2010
$’000 $’000 $’000 $’000 $’000 $’000
Australia 515,846 518,042 35,265 98,841 1,157,892 1,043,294
United Arab Emirates 27,518 29,747 2,500 1,620 5,292 4,769
Sub total 543,364 547,789 37,765 100,461 1,163,184 1,048,063
Unallocated - - - - - -
Total 543,364 547,789 37,765 100,461 1,163,184 1,048,063
3 Critical accounting estimates and judgementsEstimates and judgements are continually evaluated and are based on historical experience and other factors, including expectations of future events that may have a financial impact on the Group and that are believed to be reasonable under the circumstances.

102 University of Wollongong
4 Australian Government financial assistance including hECS-hElP and FEE-hElP
Consolidated(Economic Entity)
University of Wollongong(Parent Entity)
2011 2010 2011 2010
$’000 $’000 $’000 $’000
(a) Commonwealth Grants Scheme and Other Grants
Commonwealth grants scheme##1 114,771 112,664 114,771 112,664
Indigenous support fund 861 763 861 763
Disability support program 119 140 119 140
Workplace reform program 73 41 73 41
Workplace productivity program - 505 - 505
Collaboration & structural reform program#2 141 - 141 -
Total Commonwealth Grants Scheme and Other Grants 115,965 114,113 115,965 114,113
(b) higher Education loan Programs
HECS-HELP 68,496 65,275 68,496 65,275
FEE-HELP#3 3,605 4,069 3,605 4,069
Total Higher Education Loan Programs 72,101 69,344 72,101 69,344
(c) Scholarships
Australian postgraduate awards 3,953 3,144 3,953 3,144
International postgraduate research scholarship 399 365 399 365
Commonwealth education cost scholarships#4 1,269 1,917 1,269 1,917
Commonwealth accommodation scholarships#4 32 45 32 45
Indigenous Access Scholarships 43 64 43 64
Total Scholarships 5,696 5,535 5,696 5,535
(d) DiiSR-Research
Joint Research Engagement Programme 5,668 5,526 5,668 5,526
Research training scheme 11,609 11,534 11,609 11,534
Research infrastructure block grants 3,553 3,376 3,553 3,376
Implementation assistance program - 70 - 70
Commercialisation training scheme 147 106 147 106
Sustainable Research Excellence in Universities 2,239 1,627 2,239 1,627
Total DIISR-Research Grants 23,216 22,239 23,216 22,239
(e) Other Capital Funding
Education Investment Fund 34,600 47,800 34,600 47,800
Total Other Capital Funding 34,600 47,800 34,600 47,800
# Includes the basic CGS grant amount, CGS – Regional Loading and CGS – Enabling Loading and HEFA Transition Fund.
fiNaNcial stateMeNts

2011 Annual Report 103
4 Australian Government financial assistance including hECS-hElP and FEE-hElP (continued)
Consolidated(Economic Entity)
University of Wollongong(Parent Entity)
2011 2010 2011 2010$’000 $’000 $’000 $’000
(f) Australian Research Council(i) Discovery
Project 8,644 8,220 8,644 8,220 Fellowships 3,669 2,409 3,669 2,409 Super Science Fellowships 189 93 189 93
Total Discovery 12,502 10,722 12,502 10,722
(ii) LinkagesInfrastructure 890 1,050 890 1,050 International - 85 - 85 Projects 4,195 3,791 4,195 3,791
Total Linkages 5,085 4,926 5,085 4,926
(iii) Networks and CentresCentres 2,327 2,499 2,327 2,499
Total Networks and Centres 2,327 2,499 2,327 2,499
Total Australian Research Council 19,914 18,147 19,914 18,147
(g) Other Australian Government financial assistanceOther Australian Government - other
National Health & Medical Research Council (NHMRC) 2,746 2,282 2,746 2,282 Higher Education Participation Programme 2,162 1,263 2,162 1,263
Subtotal Other Australian Government - other 4,908 3,545 4,908 3,545
Other Australian Government - researchOther Australian Research Grants 17,057 14,978 17,057 14,953
Total Other Australian Government financial assistance 21,965 18,523 21,965 18,498
Total Australian Government financial assistance 293,457 295,701 293,457 295,676
#1 Includes the basic CGS grant amount, CGS - Regional Loading, CGS - Enabling Loading, Maths and Science Transition Loading and Full Fee Places Transition Loading.
#2 Includes Collaboration & Structural Adjustment Program#3 Program in respect of FEE-HELP for Higher Education only and excludes funds received in respect of VET FEE-HELP.#4 Includes National Priority and National Accommodation Priority Scholarships respectively.
ReconciliationAustralian Government grants [(a) + (c) + (d) + (e) + (f) + (g)] 221,356 226,357 221,356 226,332 HECS-HELP payments 68,496 65,275 68,496 65,275 FEE-HELP payments 3,605 4,069 3,605 4,069 Total Australian Government financial assistance 293,457 295,701 293,457 295,676
(h) Australian Government Grants received - cash basisCGS and Other DEEWR Grants 115,965 114,113 115,965 114,113 Higher Education Loan Programmes 72,101 69,344 72,101 69,344 Scholarships 5,696 5,535 5,696 5,535 DIISR Research 23,216 22,239 23,216 22,239 Other Capital Funding 34,600 47,800 34,600 47,800 ARC grants - Discovery 12,502 10,722 12,502 10,722 ARC grants - Linkages 5,085 4,926 5,085 4,926 ARC grants - Networks and Centres 2,327 2,499 2,327 2,499 Other Australian Government Grants 21,965 18,523 21,965 18,498
Total Australian Government Grants received - cash basis 293,457 295,701 293,457 295,676 OS-Help (Net) 1,005 1,337 1,005 1,337
Total Australian Government funding received - cash basis 294,462 297,038 294,462 297,013

104 University of Wollongong
5 State and local Government financial assistance
Consolidated(Economic Entity)
University of Wollongong(Parent Entity)
2011 2010 2011 2010
$’000 $’000 $’000 $’000
State financial assistance
Research Grants 4,161 4,809 4,161 4,809
Other 5,631 10,500 5,631 10,500
Total state financial assistance 9,792 15,309 9,792 15,309
6 Fees and chargesConsolidated
(Economic Entity)University of Wollongong
(Parent Entity)
2011 2010 2011 2010
$’000 $’000 $’000 $’000
Course fees and charges
Fee-paying overseas students 135,882 143,570 92,782 97,414
Continuing education 444 511 444 511
Fee-paying domestic postgraduate students 2,918 3,230 2,918 3,230
Total course fees and charges 139,244 147,311 96,144 101,155
Other non-course fees and charges
Amenities and service fees 29 40 29 40
Late fees 62 144 62 144
Library charges 390 426 390 426
Parking fees 2,131 2,012 2,160 2,123
Rental charges 3,238 2,642 2,933 2,949
Student accommodation 13,663 13,047 13,663 13,047
Other fees and charges 6,775 6,677 5,967 5,515
Conference fees 1,777 1,727 1,777 1,727
Student Administration Fees 2,854 1,254 2,854 1,254
Visitor entry fees 1,422 1,371 1,422 1,371
Total other fees and charges 32,341 29,340 31,257 28,596
Total fees and charges 171,585 176,651 127,401 129,751
fiNaNcial stateMeNts

2011 Annual Report 105
7 investment revenue and incomeConsolidated
(Economic Entity)University of Wollongong
(Parent Entity)
2011 2010 2011 2010
$’000 $’000 $’000 $’000
Term Deposits and Bank Interest 8,972 7,439 7,678 6,219
Distribution from assets held for sale 7,591 6,083 7,591 6,083
Dividend Income 1,332 1,200 4,000 4,000
Total investment revenue 17,895 14,722 19,269 16,302
8 Consultancy and contractsConsolidated
(Economic Entity)University of Wollongong
(Parent Entity)
2011 2010 2011 2010
$’000 $’000 $’000 $’000
Consultancy 2,381 2,497 2,384 2,503
Consultancy fees - related orgs - - 17 15
Other contract research 17,775 17,030 17,754 17,065
Total consultancy and contracts 20,156 19,527 20,155 19,583
9 Other revenue and incomeConsolidated
(Economic Entity)University of Wollongong
(Parent Entity)
2011 2010 2011 2010
$’000 $’000 $’000 $’000
Donations and bequests 1,087 1,464 1,114 1,497
Scholarships and prizes 2,098 1,627 2,114 1,648
Non-government grants 447 462 447 462
Net gain on disposal of property, plant & equipment 70 9 - -
Other revenue 244 1,045 203 538
Trading Income 6,696 3,749 - -
Printery revenue 2,108 1,653 2,108 2,096
Publications and merchandise 1,037 701 1,037 699
Developer contributions received 1,245 1,786 1,245 1,786
Total other revenue and income 15,032 12,496 8,268 8,726

106 University of Wollongong
10 Employee related expensesConsolidated
(Economic Entity)University of Wollongong
(Parent Entity)
2011 2010 2011 2010
$’000 $’000 $’000 $’000
Academic1
Salaries 111,068 100,793 111,068 100,794
Contribution to superannuation and pension schemes:
Funded 17,974 14,402 17,974 14,402
Payroll tax 7,044 6,442 7,044 6,442
Worker’s compensation 734 498 734 498
Long service leave expense 4,791 3,542 4,791 3,542
Annual leave 9,843 - 9,843 -
Other 627 1,365 627 1,365
Total academic 152,081 127,042 152,081 127,043
non-academic2
Salaries 107,668 101,691 74,564 67,386
Contribution to superannuation and pension schemes:
Funded 12,272 12,465 10,108 10,346
Payroll tax 5,997 5,594 5,004 4,570
Worker’s compensation 762 609 525 337
Long service leave expense 4,127 3,181 3,403 2,486
Annual leave 6,156 8,572 4,479 6,447
Other 594 872 532 819
Total non-academic 137,576 132,984 98,615 92,391
Total employee related expenses 289,657 260,026 250,696 219,434
Deferred superannuation expense 486 492 486 492
Total employee related expenses, including deferred government employee benefits for superannuation 290,143 260,518 251,182 219,926
1Academic staff are paid under the Academic Staff Enterprise Agreement and include teaching staff, sessional teaching staff, guest lecturers and academic research staff.2Non-academic staff are paid under the Group’s General Staff Enterprise Agreement and include general and administrative staff, professional and technical staff, examination supervisors and casual general staff.
Annual leave for academic staff has been recognised for the first time in 2011 under the academic staff enterprise agreement. Prior to this agreement, no provision was recognised for academic annual leave on the basis thhat all leave was taken by the 31st December each year.
fiNaNcial stateMeNts

2011 Annual Report 107
11 Depreciation and amortisationConsolidated
(Economic Entity)University of Wollongong
(Parent Entity)
2011 2010 2011 2010
$’000 $’000 $’000 $’000
Depreciation
Buildings 18,037 15,748 17,677 15,460
Plant and equipment 4,004 3,207 2,092 1,976
Plant and equipment under finance leases 158 150 - -
Other 5,443 4,707 5,100 4,437
Library 832 857 832 857
Investment property 637 - 637 -
Total depreciation 29,111 24,669 26,338 22,730
Amortisation
Other 130 50 - -
Software 271 343 268 329
Total amortisation 401 393 268 329
Total depreciation and amortisation 29,512 25,062 26,606 23,059
12 Repairs and maintenanceConsolidated
(Economic Entity)University of Wollongong
(Parent Entity)
2011 2010 2011 2010
$’000 $’000 $’000 $’000
Buildings 12,127 9,751 11,615 8,954
Equipment 871 857 778 764
Infrastructure 757 1,126 757 1,126
Total repairs and maintenance 13,755 11,734 13,150 10,844
13 borrowing costsConsolidated
(Economic Entity)University of Wollongong
(Parent Entity)
2011 2010 2011 2010
$’000 $’000 $’000 $’000
Interest 6,118 3,689 5,913 3,600
Total borrowing costs expensed 6,118 3,689 5,913 3,600

108 University of Wollongong
14 impairment of assetsConsolidated
(Economic Entity)University of Wollongong
(Parent Entity)
2011 2010 2011 2010
$’000 $’000 $’000 $’000
Sciventures Investment (13) 78 (13) 78
AC3 Supercomputing Investment (3) (3) (3) (3)
Total impairment of assets (16) 75 (16) 75
15 Other expensesConsolidated
(Economic Entity)University of Wollongong
(Parent Entity)
2011 2010 2011 2010
$’000 $’000 $’000 $’000
Scholarships, grants and prizes 22,676 20,206 22,682 20,677
Non-capitalised equipment 5,921 4,707 5,740 4,458
Advertising, marketing and promotional expenses 4,250 4,425 944 1,047
Audit fees, bank charges, legal costs and insurance expenses 4,403 4,942 2,874 3,399
General consumables 7,514 5,656 6,643 4,624
Printing and stationery 2,907 2,985 1,349 1,298
Minimum lease payments on operating leases 6,826 7,394 829 923
Rental, hire and other leasing fees 11,816 8,088 11,924 8,275
Telecommunications 2,696 2,990 2,379 2,571
Travel and related staff development and training 14,037 12,071 12,790 10,662
Net gain on disposal of assets 721 1,929 733 1,938
Agency staff 3,338 2,615 2,353 1,736
Agent fees 1,989 2,537 - -
Catering 2,738 3,002 2,863 3,138
Computer maintenance and software 6,085 5,817 5,590 5,345
Consultant fees 12,235 11,184 11,412 10,420
Copyright 681 653 681 653
Staff appointment expense 1,394 1,351 1,165 1,070
Trading expenses 7,833 6,859 - -
Contracts 10,025 7,875 9,974 7,828
Contributions 4,030 3,456 24,698 25,096
Fees 5,516 3,967 5,090 3,476
Motor vehicle expenses 566 626 370 407
Subscriptions 5,393 5,255 5,139 5,008
Net foreign currency loss (gain) 226 301 222 286
Utilities 7,468 7,244 6,867 6,629
Visitor expenses 698 687 676 663
Other 10,264 6,213 12,794 9,199
Total other expenses 164,246 145,035 158,781 140,826
fiNaNcial stateMeNts

2011 Annual Report 109
16 income tax expenseConsolidated
(Economic Entity)University of Wollongong
(Parent Entity)
2011 2010 2011 2010
$’000 $’000 $’000 $’000
(a) income tax expense
Current tax 757 1,543 - -
Deferred tax 29 (557) - -
Adjustments for current tax of prior periods - 65 - -
786 1,051 - -
Income tax expense is attributable to:
Operating result from continuing operations 1,095 1,018 - -
Operating result from discontinued operations (309) 33 - -
Aggregate income tax expense 786 1,051 - -
(b) numerical reconciliation of income tax expense to prima facie tax payable
Operating result from continuing operations before income tax expense 39,606 101,676 38,173 100,400
Operating result from discontinuing operations before income tax expense (1,058) 77 - -
38,548 101,753 38,173 100,400
Tax at the Australian tax rate of 30% (2010 - 30%) 11,564 30,484 11,452 30,120
Tax effect of amounts which are not deductible / (taxable) in calculating taxable income:
Franked dividend gross up 17 - - -
Deferred tax asset not brought to account 146 78 - -
Other 315 127 - -
Franked dividend rebate (1,257) (1,200) (1,200) (1,200)
Tax Exempt Income (9,995) (28,431) (10,252) (28,920)
790 1,058 - -
Adjustment for current tax of prior periods (4) (7) - -
Total income tax expense 786 1,051 - -

110 University of Wollongong
17 Discontinued operation
Wollongong Unicentre limited
The subsidiary of the Wollongong Unicentre Limited, UniCentre Conferences and Functions Pty Limited commenced liquidation on 1 January 2011. Through 2011 the subsidiary continued the liquidation process and ceased all operations and activities.
iTC limited
On 23 December 2011 ITC Limited ceased the operations of ITC Aviation Pty Ltd.
The results of the discontinued operations which have been included in the income statement are as follows. The comparative profit and cash flows from discontinued operations have been re-presented to include those operations classified as discontinued in the current period:
(a) Financial performance and cash flow information
The financial performance and cash flow information presented are for the year ended 31 December 2011
Consolidated(Economic Entity)
University of Wollongong(Parent Entity)
2011 2010 2011 2010
$’000 $’000 $’000 $’000Revenue 987 359 - - Net bad and doubtful debts expense (53) 142 - - Net foreign exchange - (32) - - Employee benefit expenses (770) (198) - - Depreciation and amortisation expenses (107) (40) - - Project expenses (531) (181) - - Administration and site expenses (289) (70) - - Marketing expenses (127) (29) - - Other expenses (164) (8) - - Operating result before income tax (1,054) (57) - -
Income tax expense 309 (33) - - Operating result after income tax of discontinued operations (745) (90) - -
Operating result from discontinued operation (745) (90) - -
Net cash inflow from operating activities (645) 103 - - Net cash inflow (outflow) from investing activities (39) (548) - - Net cash (outflow) from financing activities 667 612 - -
(17) 167 - -
(b) Carrying amounts of assets and liabilitiesCash and cash equivalents 41 - - - Trade receivables 14 - - - Deferred tax assets 36 - - - Non current assets classified as held for sale 335 - - -
Total assets 426 - - -
Trade and other payables (13) - - - Provisions (65) - - - Other current liabilities (5) - - -
Total liabilities (83) - - -
Net assets 343 - - -
fiNaNcial stateMeNts

2011 Annual Report 111
18 Cash and cash equivalentsConsolidated
(Economic Entity)University of Wollongong
(Parent Entity)
2011 2010 2011 2010
$’000 $’000 $’000 $’000
Cash at bank and on hand 30,106 31,762 5,564 10,189
NAB professional funds 2,108 2,108 977 933
Total cash and cash equivalents 32,214 33,870 6,541 11,122
(a) Reconciliation to cash at the end of the year
The above figures are reconciled to cash at the end of the year as shown in the statements of cash flows as follows:
Balances as above 32,214 33,870 6,541 11,122
Bank term deposits 104,108 110,604 104,108 110,604
Balances per cash flow statement 136,322 144,474 110,649 121,726
Restricted cash and cash equivalents
The following cash and cash equivalents are restricted in their use:
Prizes and donations $8,592k (2010: $9,096k) economic and parent entity. These funds are restricted for purposes of providing student scholarships and supporting research and other specific activities.
(b) Cash at bank and on hand
Cash at bank includes cash held in day to day bank transaction accounts earning an average interest rate of 4.66% (2010: 4.43%). Cash on hand of $51k (2010: $49k) for the parent entity and $99k (2010: $95k) for the economic entity are non interest bearing.
(c) Foreign exchange risk
The following cash and cash equivalents are denominated in the following currencies:
Australian Dollars 31,612 33,326 5,939 10,578
United States Dollars 602 544 602 544
32,214 33,870 6,541 11,122

112 University of Wollongong
19 ReceivablesConsolidated
(Economic Entity)University of Wollongong
(Parent Entity)
2011 2010 2011 2010
$’000 $’000 $’000 $’000
Current
ReceivablesStudent fees 28,155 27,061 28,155 25,091 Less: Provision for impaired receivables (155) (270) (155) (191)
28,000 26,791 28,000 24,900
Trade receivables 19,146 12,240 17,546 12,361 Provision for impaired receivables (694) (503) (563) (472)
18,452 11,737 16,983 11,889 Total receivables 46,452 38,528 44,983 36,789
Other receivablesAccrued income 398 253 368 252 Current Loans - - 458 18 Other loans and receivables 583 536 3,671 2,853
Total other receivables 981 789 4,497 3,123
Total current receivables 47,433 39,317 49,480 39,912
non-current
ReceivablesDeferred government contribution for superannuation 44 194,350 123,310 194,350 123,310
Total receivables 194,350 123,310 194,350 123,310
Other non-current receivablesLoans to Unicentre - - 1,525 96 Other loans and receivables - 100 - 100
Total other receivables - 100 1,525 196
Total non-current receivables 194,350 123,410 195,875 123,506
Total receivables 241,783 162,727 245,355 163,418
(a) impaired receivables
As at 31 December 2011 current receivables of the group with a nominal value of $301k (2010: $382k) were impaired. For the parent entity, current receivables of $226k (2010: $266k) were impaired. The amount of the provision was $718k (2010: $661k) for the parent entity and $849k (2010: $754k) for the consolidated entity.
The ageing analysis of these receivables is as follows:3 to 6 months - - - - Over 6 months 301 382 226 266
301 382 226 266
As of 31 December 2011, for the parent entity trade receivables of $1,552k (2010: $1,628k) and the consolidated entity $2,871k (2010: $2,168k) were past due but not impaired. These relate to a number of independent customers for whom there is no recent history of default and settlement is expected.
The ageing analysis of these receivables is as follows:
fiNaNcial stateMeNts

2011 Annual Report 113
19 Receivables (continued)Consolidated
(Economic Entity)University of Wollongong
(Parent Entity)
2011 2010 2011 2010
$’000 $’000 $’000 $’000
3 to 6 months 1,006 884 813 816
Over 6 months 1,865 1,284 739 812
2,871 2,168 1,552 1,628
Movements in the provision for impaired receivables are as follows:
At 1 January 754 806 663 570
Provision for impairment recognised during the year 229 200 129 135
Receivables written off during the year as uncollectible (134) (252) (74) (42)
At 31 December 849 754 718 663
The creation and release of the provision for impaired receivables has been included in ‘other expenses’ in the income statement. Amounts charged to the provision account are generally written off when there is no expectation of recovering additional cash.
The other amounts within receivables do not contain impaired assets and are not past due. Based on credit history, it is expected that these amounts will be received when due.
(b) Foreign exchange and interest rate risk
A summarised analysis of the sensitivity of trade and other receivables to foreign exchange and interest rate risk can be found in note 43.
Consolidated(Economic Entity)
University of Wollongong(Parent Entity)
2011 2010 2011 2010
$’000 $’000 $’000 $’000
AUD 241,430 161,560 245,002 162,295
USD 290 264 290 220
SGD 30 680 30 680
GBP 4 55 4 55
EUR 29 166 29 166
NZD - 2 - 2
241,783 162,727 245,355 163,418
Current receivables 47,433 39,317 49,480 39,912
Non-current receivables 194,350 123,410 195,875 123,506
241,783 162,727 245,355 163,418
(c) Fair value and credit risk
Due to the short-term nature of these receivables, their carrying amount is assumed to approximate their fair value.
The maximum exposure to credit risk at the reporting date is the carrying amount of each class of receivables mentioned above. The Group does not hold any collateral as security. Refer to note 43 for more information on the risk management policy of the Group.
2011 2010
Carrying amount Fair value Carrying amount Fair value
$’000 $’000 $’000 $’000
Trade and other receivables 47,433 47,433 39,317 39,317
47,433 47,433 39,317 39,317

114 University of Wollongong
20 inventoriesConsolidated
(Economic Entity)University of Wollongong
(Parent Entity)
2011 2010 2011 2010
$’000 $’000 $’000 $’000
Current
Catering stock
- at cost 92 84 23 20
Newsagency and book store stock
- at cost 2,222 2,261 - -
Print and paper stock
- at cost 375 553 375 553
Other
- at cost 149 161 - -
Total current inventories 2,838 3,059 398 573
21 Assets held for saleConsolidated
(Economic Entity)University of Wollongong
(Parent Entity)
2011 2010 2011 2010
$’000 $’000 $’000 $’000
Plant and equipment 315 - - -
Motor vehicles 7 - - -
Other property, plant & equipment 12 - - -
Managed funds - 55,408 - 55,408
Total non-current assets classified as held for sale 334 55,408 - 55,408
impairment and risk exposure
The maximum exposure to credit risk at the reporting date is the fair value of the assets classified as held for sale.
In June 2011, the medium term managed funds were withdrawn and invested in the reserve managed funds - see Note 22.
All available for sale financial assets are denominated in Australian currency. For an analysis of the sensitivity of available for sale financial assets to price and interest rate risk refer to note 43.
2011 2010
Carrying amount Fair value Carrying amount Fair value
$’000 $’000 $’000 $’000
Assets held for sale 334 334 55,408 55,408
334 334 55,408 55,408
fiNaNcial stateMeNts

2011 Annual Report 115
22 Available-for-sale financial assetsConsolidated
(Economic Entity)University of Wollongong
(Parent Entity)
2011 2010 2011 2010
$’000 $’000 $’000 $’000IDP Education Australia Ltd - at fair value 1,045 1,132 - - Sciventures investments 214 186 214 186 AC3 Supercomputing 63 50 63 50 Managed funds 108,760 53,773 108,760 53,773 Total non-current available-for-sale financial assets 110,082 55,141 109,037 54,009
(a) Fair value and credit risk
The maximum exposure to credit risk at the reporting date is the fair value of the assets classified as available-for-sale.
23 investment propertiesConsolidated
(Economic Entity)University of Wollongong
(Parent Entity)2011 2010 2011 2010
At cost $’000 $’000 $’000 $’000Opening balance at 1 January 35,639 - 35,639 - Accumulated depreciation (637) - (637) -
35,002 - 35,002 -
At costClosing balance as at 31 December 35,639 - 35,639 - Accumulated depreciation (637) - (637) -
35,002 - 35,002 - (a) Valuation basis
Investment properties are held at historical cost.
The property classified as an investment property is Enterprise One on the Innovation Campus.
24 held to maturity investmentsConsolidated
(Economic Entity)University of Wollongong
(Parent Entity)
2011 2010 2011 2010
$’000 $’000 $’000 $’000
Unlisted SecuritiesTerm Deposits 104,108 110,604 104,108 110,604 Total held to maturity investments 104,108 110,604 104,108 110,604
impairment and risk exposure
The maximum exposure to credit risk at the reporting date is the carrying amount of the assets.
None of the held to maturity assets are either past due or impaired.
All held-to-maturity assets are denominated in Australian currency. As a result, there is no exposure to foreign currency risk. There is also no exposure to price risk as the assets will be held to maturity.
2011 2010
Carrying amount Fair value Carrying amount Fair value
$’000 $’000 $’000 $’000
Held to maturity investments - 110,604 - 70,223
- 110,604 - 70,223

116 University of Wollongong
25 Property, plant and equipment
(ECOnOmiC EnTiTy)Construction in progress Freehold land
Freehold buildings
Plant and equipment
leased plant & equipment
Other property, plant and
equipment library Total
$’000 $’000 $’000 $’000 $’000 $’000 $’000 $’000
At 1 January 2010
- Cost 53,892 61,120 411,017 60,335 866 70,451 11,741 669,422
Accumulated depreciation - - (65,355) (23,996) (329) (44,705) (3,218) (137,603)
Net book amount 53,892 61,120 345,662 36,339 537 25,746 8,523 531,819
year ended 31 December 2010
Opening net book amount 53,892 61,120 345,662 36,339 537 25,746 8,523 531,819
Exchange differences - - - (111) - - - (111)
Additions 87,846 - 1,478 9,440 - 7,775 857 107,396
Transfer from construction in progress - - 47,739 3,658 - - - 51,397
Assets classified as held for sale and other disposals - - (1,315) (188) - (458) (661) (2,622)
Depreciation charge - - (15,755) (3,156) (235) (4,699) (857) (24,702)
Capitalised - - - (1,894) - - - (1,894)
Transfer to freehold buildings (47,739) - - - - - - (47,739)
Transfer to plant and equipment (3,658) - - - - - - (3,658)
Writeoff - - - - - - - -
Closing net book amount 90,341 61,120 377,809 44,088 302 28,364 7,862 609,886
At 31 December 2010
- Cost 90,341 61,120 458,488 69,119 915 77,029 11,937 768,949
Accumulated depreciation - - (80,679) (25,031) (613) (48,665) (4,075) (159,063)
Net book amount 90,341 61,120 377,809 44,088 302 28,364 7,862 609,886
year ended 31 December 2011
Opening net book amount 90,341 61,120 377,809 44,088 302 28,364 7,862 609,886
Exchange differences - - - (10) - - - (10)
Additions 61,608 375 434 10,766 35 9,145 809 83,172
Transfer from construction in progress - 995 100,491 246 - 1,100 - 102,832
Assets classified as held for sale and other disposals (30) - (1,453) (509) (1) (551) (203) (2,747)
Impairment charge recognised in profit and loss - - - - - - - -
Depreciation charge - - (18,049) (3,479) (203) (5,383) (832) (27,946)
Capitalised - - - (1,932) - - - (1,932)
Transfer to freehold land (995) - - - - - - (995)
Transfer to freehold buildings (100,491) - - - - - - (100,491)
Transfer to plant and equipment (246) - - - - - - (246)
Transfer to other plant and equipment (1,100) - - - - - - (1,100)
Transfer to investment property (35,639) - - - - - - (35,639)
Transfer to intangibles (223) - - - - - - (223)
Writeoff (1,213) - - - - - - (1,213)
Closing net book amount 12,012 62,490 459,232 49,170 133 32,675 7,636 623,348
At 31 December 2011
- Cost 12,012 62,490 557,825 76,261 949 85,312 12,543 807,392
Accumulated depreciation - - (98,593) (27,091) (816) (52,637) (4,907) (184,044)
Net book amount 12,012 62,490 459,232 49,170 133 32,675 7,636 623,348
fiNaNcial stateMeNts

2011 Annual Report 117
25 Property, plant and equipment (continued)
(PAREnT EnTiTy)Construction in progress Freehold land
Freehold buildings
Plant and equipment
Other property, plant and
equipment library Total
$’000 $’000 $’000 $’000 $’000 $’000 $’000
At 1 January 2010- Cost 53,892 61,120 406,658 50,599 67,908 11,741 651,918 Accumulated depreciation - - (62,856) (17,404) (43,466) (3,218) (126,944)
Net book amount 53,892 61,120 343,802 33,195 24,442 8,523 524,974
year ended 31 December 2010Opening net book amount 53,892 61,120 343,802 33,195 24,442 8,523 524,974 Additions 87,623 - 1,079 7,845 7,464 857 104,868 Transfer from construction in progress - - 47,739 3,658 - - 51,397 Assets classified as held for sale and other disposals - - (1,315) (63) (458) (661) (2,497) Depreciation charge - - (15,459) (1,976) (4,437) (857) (22,729) Construction in progress capitalised - - - (1,894) - - (1,894) Transfer to freehold buildings (47,739) - - - - - (47,739) Transfer to plant and equipment (3,658) - - - - - (3,658)
Closing net book amount 90,118 61,120 375,846 40,765 27,011 7,862 602,722
At 31 December 2010- Cost 90,118 61,120 453,791 58,705 74,174 11,937 749,845 Accumulated depreciation - - (77,945) (17,940) (47,163) (4,075) (147,123)
Net book amount 90,118 61,120 375,846 40,765 27,011 7,862 602,722
year ended 31 December 2011Opening net book amount 90,118 61,120 375,846 40,765 27,011 7,862 602,722 Additions 61,570 375 - 9,494 8,883 809 81,131 Transfer from construction in progress - 995 100,491 246 1,100 - 102,832 Assets classified as held for sale and other disposals - - (1,453) (29) (472) (203) (2,157) Depreciation charge - - (17,677) (2,093) (5,100) (832) (25,702) Capitalised - - - (1,932) - - (1,932) Transfer to freehold land (995) - - - - - (995) Transfer to freehold buildings (100,491) - - - - - (100,491) Transfer to plant and equipment (247) - - - - - (247) Transfer to other plant and equipment (1,100) - - - - - (1,100) Transfer to investment property (35,639) - - - - - (35,639) Transfer to intangibles - - - - - - - Writeoff (1,213) - - - - - (1,213)
Closing net book amount 12,003 62,490 457,207 46,451 31,422 7,636 617,209
At 31 December 2011- Cost 12,003 62,490 552,691 65,696 82,251 12,543 787,674 Accumulated depreciation - - (95,484) (19,245) (50,829) (4,907) (170,465)
Net book amount 12,003 62,490 457,207 46,451 31,422 7,636 617,209
1Property, plant & equipment includes all operational assets and artworks.2Other Property, plant & equipment includes non-operational assets.
(a) non-current assets pledged as security
Refer to note 29 for information on non-current assets pledged as security by the parent entity and its controlled entities.
The carrying amounts of assets pledged as security for current and non-current borrowings are: International House land $4.0m International House building $2.8m Weerona land $3.5m Weerona building $3.4m

118 University of Wollongong
26 intangible assets
(ECOnOmiC EnTiTy) Goodwill Computer softwareOther intangible
assets Total
$’000 $’000 $’000 $’000
At 1 January 2010
Cost 1,043 5,183 206 6,432
Accumulated amortisation (103) (4,210) (114) (4,427)
Net book amount 940 973 92 2,005
year ended 31 December 2010
Opening net book amount 940 973 92 2,005
Exchange differences - - (6) (6)
Additions - 243 54 297
Acquisition of subsidiary - - 105 105
Amortisation charge - (343) (50) (393)
Closing net book amount 940 873 195 2,008
At 31 December 2010
Cost 1,043 5,235 340 6,618
Accumulated amortisation and impairment (103) (4,362) (145) (4,610)
Net book amount 940 873 195 2,008
year ended 31 December 2011
Opening net book amount 940 873 195 2,008
Additions 15 849 174 1,038
Adjustments for subsequent recognition of deferred tax assets - - (105) (105)
Impairment charge - - - -
Amortisation charge - (352) (58) (410)
Capitalised - (487) - (487)
Amortisation charge - - - -
Closing net book amount 955 883 206 2,044
At 31 December 2011
Cost 1,058 5,597 409 7,064
Accumulated amortisation and impairment (103) (4,714) (203) (5,020)
Net book amount 955 883 206 2,044
fiNaNcial stateMeNts

2011 Annual Report 119
26 intangible assets (continued)(PAREnT EnTiTy) Computer software Total
$’000 $’000
At 1 January 2010
Cost 4,022 4,022
Accumulated amortisation (3,382) (3,382)
Net book amount 640 640
year ended 31 December 2010
Opening net book amount 640 640
Additions 71 71
Amortisation charge (329) (329)
Closing net book amount 382 382
At 31 December 2010
Cost 3,902 3,902
Accumulated amortisation and impairment (3,520) (3,520)
Net book amount 382 382
year ended 31 December 2011
Opening net book amount 382 382
Additions 14 14
Amortisation charge (268) (268)
Closing net book amount 128 128
At 31 December 2011
Cost 3,916 3,916
Accumulated amortisation and impairment (3,788) (3,788)
Net book amount 128 128

120 University of Wollongong
27 Other non-financial assetsConsolidated
(Economic Entity)University of Wollongong
(Parent Entity)
2011 2010 2011 2010
$’000 $’000 $’000 $’000
Current
Prepayments 6,478 7,516 5,692 5,515
Total current other non-financial assets 6,478 7,516 5,692 5,515
non-current
Prepayments 603 254 428 -
Defined benefit fund net surplus of plan assets 2,810 6,046 2,810 6,046
Total non-current Other non-financial assets 3,413 6,300 3,238 6,046
Total Other non-financial assets 9,891 13,816 8,930 11,561
28 Trade and other payablesConsolidated
(Economic Entity)University of Wollongong
(Parent Entity)
2011 2010 2011 2010
$’000 $’000 $’000 $’000
Payables 29,121 27,530 23,142 23,188
OS-HELP liability to Australian Government (13) 173 (13) 173
Total current trade and other payables 29,108 27,703 23,129 23,361
(a) Foreign currency risk
The carrying amounts of the Group’s and parent entity’s trade and other payables are denominated in the following currencies:
Australian Dollars 29,108 27,702 23,130 23,360
British pound - 1 - 1
29,108 27,703 23,130 23,361
For an analysis of the sensitivity of trade and other payables to foreign currency risk refer to note 43.
fiNaNcial stateMeNts

2011 Annual Report 121
29 borrowingsConsolidated
(Economic Entity)University of Wollongong
(Parent Entity)
2011 2010 2011 2010
$’000 $’000 $’000 $’000
Current
Secured
Lease liabilities - 80 - -
Other loans 18 18 - -
Total current secured borrowings 18 98 - -
Interest bearing loan 76 139 - -
Total current borrowings 94 237 - -
non-current
Secured
Bill facility 14,100 14,100 14,100 14,100
Lease liabilities 76 33 - -
Other loans 80 98 - -
Total non-current secured borrowings 14,256 14,231 14,100 14,100
Unsecured
Bank Loan 704 734 - -
Interest annuity bond 63,732 62,846 63,732 62,846
Total non-current unsecured borrowings 64,436 63,580 63,732 62,846
Total non-current borrowings 78,692 77,811 77,832 76,946
Total borrowings 78,786 78,048 77,832 76,946
(a) Assets pledged as security
The bank loan of the parent entity are secured by first mortgages over the Parent’s freehold land and buildings.
The carrying amounts of assets pledged as security for current and non-current borrowings are:
Consolidated(Economic Entity)
University of Wollongong(Parent Entity)
2011 2010 2011 2010
$’000 $’000 $’000 $’000
non-current
First mortgage
Land and buildings 13,700 13,700 13,700 13,700
13,700 13,700 13,700 13,700

122 University of Wollongong
(b) Financing arrangements
Unrestricted access was available at balance date to the following lines of credit:
Consolidated(Economic Entity)
University of Wollongong(Parent Entity)
2011 2010 2011 2010
$’000 $’000 $’000 $’000
Credit standby arrangements
Total facilities
Bank overdrafts 750 750 - -
Credit card facilities 2,300 2,350 2,000 2,000
Flexible Rate Facility 14,100 14,100 14,100 14,100
Lease Facility 3,070 2,570 1,500 1,500
International Facility 1,100 1,325 1,100 325
Bills - - - -
Margin on guarantee - 76 - -
Bank guarantee 2,150 1,979 1,900 1,729
23,470 23,150 20,600 19,654
Used at balance date
Bank overdrafts - - - -
Credit card facilities 500 72 500 4
Flexible Rate Facility 14,100 14,100 14,100 14,100
Lease Facility 97 801 - -
International Facility - - - -
Bills - - - -
Margin on guarantee - 76 - -
Bank guarantee 21 1,729 21 1,729
14,718 16,778 14,621 15,833
Unused at balance date
Bank overdrafts 750 750 - -
Credit card facilities 1,800 2,278 1,500 1,996
Flexible Rate Facility - - - -
Lease Facility 2,973 1,769 1,500 1,500
International Facility 1,100 1,325 1,100 325
Bills - - - -
Margin on guarantee - - - -
Bank guarantee 2,129 250 1,879 1
8,752 6,372 5,979 3,822
(c) Class of borrowings
The short term bill facility was entered into by the University of Wollongong to fund the construction of the Campus East student accommodation building and facilities.
The interest annuity bond represents two bonds issued to fund capital works on the University Main and Innovation Campuses. The first bond of $42.5m was issued in August 2008 for a term of 30 years. The second bond of $20m was issued in December 2010 for a term of 25 years. Both bonds are instruments where the periodic interest rate applicable to the loan is indexed to the CPI.
Covenants and conditions in relation to borrowings have been complied with.
fiNaNcial stateMeNts

2011 Annual Report 123
(d) Fair value
The carrying amounts and fair values of borrowings at balance date are:
(Economic Entity)
2011 2010
Carrying amount Fair value Carrying amount Fair value
$’000 $’000 $’000 $’000
On-statement of financial position
Bank loans 704 704 654 654
Bills payable 14,100 14,100 14,100 14,100
Interest bearing loan 76 76 139 139
Interest Annuity Bond 63,732 63,732 62,183 62,183
Other loans 98 (114) 116 116
Lease liabilities 76 76 113 113
78,786 78,574 77,305 77,305
(Parent Entity)
2011 2010
Carrying amount Fair value Carrying amount Fair value
$’000 $’000 $’000 $’000
On-statement of financial position
Non-traded financial liabilities
Bill facility 14,100 14,100 14,100 14,100
Interest annuity bond 63,732 63,732 62,183 62,183
77,832 77,832 76,283 76,283
Other than those classes of borrowings denoted as ‘’traded’’, none of the classes are readily traded on organised markets in standardised form.
The carrying amounts of the Group’s borrowings are denominated in the following currencies:
Consolidated(Economic Entity)
University of Wollongong(Parent Entity)
2011 2010 2011 2010
$’000 $’000 $’000 $’000
Australian Dollars 78,786 78,048 77,832 76,946
78,786 78,048 77,832 76,946
For an analysis of the sensitivity of borrowings to interest rate risk and foreign exchange refer to note 43.

124 University of Wollongong
30 ProvisionsConsolidated
(Economic Entity)University of Wollongong
(Parent Entity)
2011 2010 2011 2010
Notes $’000 $’000 $’000 $’000
Current provisions expected to be settled within 12 months
Employee benefits
Annual leave 10,711 6,570 8,238 4,102
Long service leave 5,662 5,167 3,056 2,698
Provision for self funded workers compensation 346 316 346 318
Provision for voluntary redundancy schemes - 305 - 305
Onerous contracts 65 - - -
Subtotal 16,784 12,358 11,640 7,423
Current provisions expected to be settled after more than 12 months
Employee benefits
Annual leave 7,820 4,064 7,820 4,064
Long service leave 33,435 27,392 33,435 27,392
Subtotal 41,255 31,456 41,255 31,456
Total current provisions 58,039 43,814 52,895 38,879
non-current provisions
Employee benefits
Long service leave 6,306 7,141 5,002 6,052
Deferred Government benefits for superannuation 44 202,933 134,035 202,933 134,035
Provision for self funded workers compensation 1,384 1,530 1,384 1,530
Provision for restoration 364 138 227 -
Total non-current provisions 210,987 142,844 209,546 141,617
Total provisions 269,026 186,658 262,441 180,496
(a) movements in provisions
Movements in each class of provision during the financial year, other than employee benefits, are set out below:
(Economic Entity) - 2011Onerous contracts
Provision for restoration
Provision for self funded workers compensation Total
$’000 $’000 $’000 $’000
Carrying amount at start of year - 138 1,848 1,986
Additional provisions recognised 65 226 1,461 1,752
Amounts used - - (1,579) (1,579)
Carrying amount at end of year 65 364 1,730 2,159
fiNaNcial stateMeNts

2011 Annual Report 125
31 Current tax liabilitiesConsolidated
(Economic Entity)University of Wollongong
(Parent Entity)
2011 2010 2011 2010
$’000 $’000 $’000 $’000
Current tax liabilities
Income tax 6 176 - -
Total current tax liabilities 6 176 - -
32 Other liabilitiesConsolidated
(Economic Entity)University of Wollongong
(Parent Entity)
2011 2010 2011 2010
$’000 $’000 $’000 $’000
Current
Income in Advance 43,897 46,178 35,307 36,091
Department of Family & Community Services (DFCS) 18 18 18 18
Other - - - -
Lease incentive 393 - 393 -
Other 1,225 762 1,243 700
Total current other current liabilities 45,533 46,958 36,961 36,809
non-current
Contribution to occupancy - - 10,263 8,641
Department of Family & Community Services (DFCS) 78 96 78 96
Developer contributions in advance 11,058 9,661 11,058 9,661
Lease incentive 3,208 - 3,208 -
Other 440 683 476 680
Total non-current other current liabilities 14,784 10,440 25,083 19,078
Total other liabilities 60,317 57,398 62,044 55,887
The non-current contribution to occupancy represents the contribution to occupancy from subsidiaries for infrastructure and building improvements and the subsequent right of use of the same. Subsidiaries record a corresponding fixed asset which is eliminated on consolidation.
33 Reserves and retained earningsConsolidated
(Economic Entity)University of Wollongong
(Parent Entity)
2011 2010 2011 2010
$’000 $’000 $’000 $’000
(a) Reserves
Financial assets at fair value revaluation reserve 908 969 - -
Available for sale revaluation reserve (9,759) (1,193) (9,759) (1,193)
Foreign currency translation reserve 1,224 1,049 - -
(7,627) 825 (9,759) (1,193)

126 University of Wollongong
33 Reserves and retained earnings (continued)Consolidated
(Economic Entity)University of Wollongong
(Parent Entity)
2011 2010 2011 2010
$’000 $’000 $’000 $’000
movements:
Financial assets at fair value revaluation reserve
Balance 1 January 969 1,570 - -
Revaluation - gross (87) (859) - -
Deferred tax 26 258 - -
Balance 31 December 908 969 - -
movements:
Foreign currency translation reserve
Balance 1 January 1,049 382 - -
Currency translation differences arising during the year : 175 667 - -
Balance 31 December 1,224 1,049 - -
movements:
Available for sale revaluation reserve
Balance 1 January (1,193) (624) (1,193) (624)
Increase in non current assets held for sale (420) 5,663 (420) 5,663
(Gain) / loss recognised in the income statement (555) (149) (555) (149)
Dividend recognised in the income statement (7,591) (6,083) (7,591) (6,083)
Balance 31 December (9,759) (1,193) (9,759) (1,193)
(b) Retained earnings
Movements in retained earnings were as follows:
Retained surplus at 1 January 697,257 598,031 674,302 574,588
Operating result for the period 37,765 100,461 38,173 100,400
Actuarial gains(losses) on defined benefit plans recognised directly in retained earnings (1,454) (686) (1,454) (686)
Acquisition of non controlling interest in subsidiary - - - -
Transfer of reserve to retained earnings - (549) - -
Other movement - - - -
Retained earnings at 31 December 733,568 697,257 711,021 674,302
(i) Non current assets held for sale revaluation reserveThe Non current assets held for sale revaluation reserve is used to record increments and decrements on the revaluation of non-current assets, as described in note 1(m).
(ii) Available-for-sale investments revaluation reserveChanges in the fair value and exchange differences arising on translation of investments, such as equities, classified as available-for-sale financial assets, are taken to the available-for-sale investments revaluation reserve, as described in note 1(m). Amounts are recognised in profit and loss when the associated assets are sold or impaired.
(iii) Foreign currency translation reserveExchange differences arising on translation of the foreign controlled entity are taken to the foreign currency translation reserve, as described in note 1(c). The reserve is recognised in profit and loss when the net investment is disposed of.
fiNaNcial stateMeNts

2011 Annual Report 127
34 non-controlling interestConsolidated
(Economic Entity)University of Wollongong
(Parent Entity)
2011 2010 2011 2010
$’000 $’000 $’000 $’000
Interest in:
Retained surplus - (2) - -
Total non-controlling interest - (2) - -
35 Key management personnel disclosures
(a) names of responsible persons and executive officers
The following persons were responsible persons and executive officers of University of Wollongong during the financial year:
Ms J Broadbent, AO (Chancellor) Professor G Sutton (Vice-Chancellor) (resigned December 2011) Dr S Andersen (Deputy Chancellor) Mr S AlSalumi Ms K Callaway The Hon D Campbell MLA (resigned May 2011) Mr N Cornish Mr D Figliomeni Mr P Fitzgerald Professor D Kelly Professor S Zhu Ms K Knowles Dr E Magassey Mr G O’Donnell Mr R Ryan Ms R Sinclair (resigned March 2011) Mr G Ward Mr C Whittaker Professor D King (from August 2011) Mr R Perrin (from January 2011) Professor R Castle Professor J Patterson Professor J Raper Professor J Chicharo Professor D Iverson Mr C Grange Mr D Israel Professor P Wellings commenced as Vice Chancellor on 1 January 2012

128 University of Wollongong
35 Key management personnel disclosures (continued)
(b) Remuneration of Council members and Executives
Consolidated(Economic Entity)
University of Wollongong(Parent Entity)
2011 2010 2011 2010
$’000 $’000 $’000 $’000
Income paid or payable, or otherwise made available, to Council and Board Members by entities in the consolidated entity and related parties in connection with the management of affairs of the parent entity or its controlled entities: 1,550 1,346 1,550 1,346
1,550 1,346 1,550 1,346
Consolidated(Economic Entity)
University of Wollongong(Parent Entity)
2011 2010 2011 2010
Remuneration of Council members
Nil to $9,999 15 13 15 13
$40,000 to $49,999 - 1 - 1
$100,000 to $109,999 - 1 - 1
$120,000 to $129,999 - 1 - 1
$140,000 to $149,999 2 - 2 -
$160,000 to $169,999 - 1 - 1
$170,000 to $179,999 - 1 - 1
$180,000 to $189,999 1 - 1 -
$200,000 to $209,999 1 - 1 -
$720,000 to $729,999 - 1 - 1
$850,000 to $859,999 1 - 1 -
20 19 20 19
Consolidated(Economic Entity)
University of Wollongong(Parent Entity)
2011 2010 2011 2010
$’000 $’000 $’000 $’000
Income paid or payable, or otherwise made available, to executive officers by entities in the consolidated entity and related parties: 2,879 2,429 2,879 2,429
2,879 2,429 2,879 2,429
fiNaNcial stateMeNts

2011 Annual Report 129
35 Key management personnel disclosures (continued)Consolidated
(Economic Entity)University of Wollongong
(Parent Entity)
2011 2010 2011 2010
Remuneration of executive officers
$280,000 to $289,999 - 1 - 1
$340,000 to $349,999 1 3 1 3
$360,000 to $369,999 - 1 - 1
$370,000 to $379,999 - 2 - 2
$400,000 to $409,999 3 - 3 -
$410,000 to $419,999 1 - 1 -
$420,000 to $429,999 1 - 1 -
$470,000 to $479,999 1 - 1 -
7 7 7 7
(c) Key management personnel compensation
Consolidated(Economic Entity)
University of Wollongong(Parent Entity)
2011 2010 2011 2010
$’000 $’000 $’000 $’000
Short-term employee benefits 3,793 3,228 3,793 3,228
Post-employment benefits 636 547 636 547
Termination benefits - - - -
4,429 3,775 4,429 3,775
36 Remuneration of auditorsDuring the year, the following fees were paid or payable for services provided by the auditor of the parent entity, its related practices and non-related audit firms:
Consolidated(Economic Entity)
University of Wollongong(Parent Entity)
2011 2010 2011 2010
$’000 $’000 $’000 $’000
Assurance services
(a) Audit services
Fees paid to the Audit Office of NSW for the audit of financial statements 454 458 216 208
Fees paid to non-Audit Office of NSW audit firms for the audit or review of financial statements of any entity in the consolidated entity 6 6 - -
Total remuneration for audit services 460 464 216 208
37 ContingenciesThe group and parent entity does not have any contingent assets or liabilities.

130 University of Wollongong
38 Commitments
(a) Capital commitments
Capital expenditure contracted for at the reporting date but not recognised as liabilities is as follows:
Consolidated(Economic Entity)
University of Wollongong(Parent Entity)
2011 2010 2011 2010
$’000 $’000 $’000 $’000
Property, plant and equipment
Payable:
Within one year 10,975 36,647 10,975 36,588
10,975 36,647 10,975 36,588
Input tax credits expected to be recovered from the Australian Taxation Office for capital lease commitments is $0.99m.
(b) lease commitments
(i) Operating leases
This represents non-cancellable operating leases contracted for but not capitalised in the accounts for motor vehicles, photocopiers and computer equipment.
Consolidated(Economic Entity)
University of Wollongong(Parent Entity)
2011 2010 2011 2010
$’000 $’000 $’000 $’000
Commitments for minimum lease payments in relation to non-cancellable operating leases are payable as follows:
Within one year 8,986 12,506 8,904 7,949
Later than one year but not later than five years 7,598 8,933 7,566 7,761
16,584 21,439 16,470 15,710
The weighted average interest rate implicit in the non-cancellable operating leases is 10.55% (2010 - 11.0%).
Input tax credits expected to be recovered from the Australian Taxation Office for operating lease commitments is $1.51m.
(ii) Finance leases
The consolidated entity leases plant and equipment under non-cancellable financial leases expiring from one to five years. The leases generally provide the consolidated entity with a right of renewal at which time all terms are renegotiated.
fiNaNcial stateMeNts
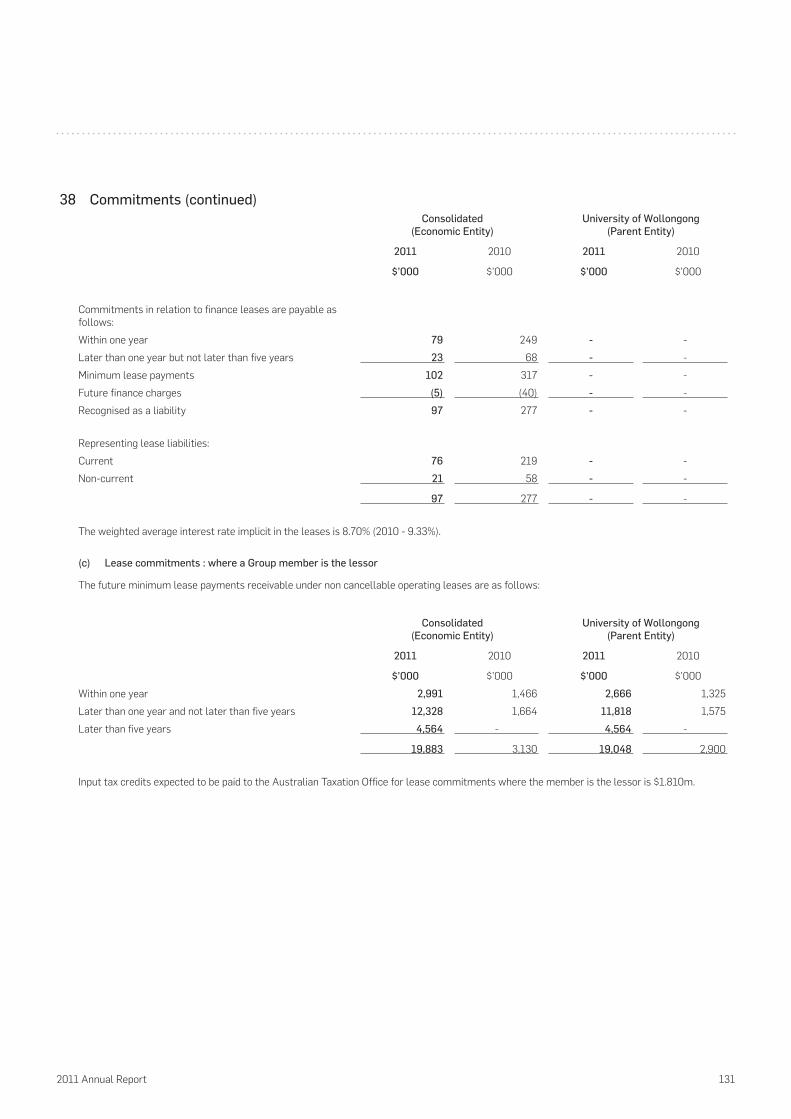
2011 Annual Report 131
38 Commitments (continued)Consolidated
(Economic Entity)University of Wollongong
(Parent Entity)
2011 2010 2011 2010
$’000 $’000 $’000 $’000
Commitments in relation to finance leases are payable as follows:
Within one year 79 249 - -
Later than one year but not later than five years 23 68 - -
Minimum lease payments 102 317 - -
Future finance charges (5) (40) - -
Recognised as a liability 97 277 - -
Representing lease liabilities:
Current 76 219 - -
Non-current 21 58 - -
97 277 - -
The weighted average interest rate implicit in the leases is 8.70% (2010 - 9.33%).
(c) lease commitments : where a Group member is the lessor
The future minimum lease payments receivable under non cancellable operating leases are as follows:
Consolidated(Economic Entity)
University of Wollongong(Parent Entity)
2011 2010 2011 2010
$’000 $’000 $’000 $’000
Within one year 2,991 1,466 2,666 1,325
Later than one year and not later than five years 12,328 1,664 11,818 1,575
Later than five years 4,564 - 4,564 -
19,883 3,130 19,048 2,900
Input tax credits expected to be paid to the Australian Taxation Office for lease commitments where the member is the lessor is $1.810m.

132 University of Wollongong
(d) Other expenditure commitments
Consolidated(Economic Entity)
University of Wollongong(Parent Entity)
2011 2010 2011 2010
$’000 $’000 $’000 $’000
Commitments for other operating expenditure in existence at the reporting date but not recognised as liabilities, payable:
Within one year 3,338 3,974 3,338 3,974
3,338 3,974 3,338 3,974
Input tax credits expected to be recovered from the Australian Taxation Office for other expenditure commitments is $0.303m.
(e) Letter of Support
The University of Wollongong provided a letter of unconditional financial support for the ongoing operations of the University of Wollongong Recreation & Aquatic Centre Ltd for a period of at least 12 months.
39 Subsidiaries
The consolidated financial statements incorporate the assets, liabilities and results of the following subsidiaries in accordance with the accounting policy described in note 1(b):
Equity holding
Name of entity Country of incorporation
Class of shares 2011%
2010%
ITC Ltd Australia Ordinary 100 100
ITC Education Ltd Australia Ordinary 100 100
ITC New Zealand Ltd NZ Ordinary 100 100
Sydney International Film School Pty Limited Australia Ordinary 100 100
ITC Aviation Pty Ltd Australia Ordinary 100 100
Australian School of European Aviation (JAA) Pty Limited Australia Ordinary - 60
Wollongong UniCentre Limited Australia Ordinary 100 100
University of Wollongong Recreation & Aquatic Centre Limited Australia Ordinary 100 100
The Sydney Business School Pty Ltd Australia Ordinary 100 100
FINANCIAL STATEMENTS

2011 Annual Report 133
Note:
Basis for control of the above entities is as follows:
ITC Ltd
- 100% equity in 2 (two) fully paid shares of $ 1.00. - University Council appoints the Board of Directors of the Company. - ITC Education Ltd the ITC Ltd is the sole member of the company.
- On 20 August 2010 ITC Limited acquired a 100% shareholding in ITC Aviation Pty Ltd.
- On 4 February 2009 ITC Limited was issued with 296,969 additional shares in International Film School Sydney Pty Ltd, increasing the shareholding from 60% to 67%. On 1 October 2010 ITC Limited acquired the remaining issued shares in International Film School Sydney Pty Ltd, increasing its shareholding from 67% to 100%.
- On 26 May 2010 ITC (Middle East) Ltd was deregistered.
- On 10 December 2010 ITC Emirates Ltd was deregistered.
- On 23 December 2011 ITC Limited ceased the operations of ITC Aviation Pty Ltd.
Wollongong UniCentre Limited
- General Manager of the UniCentre is appointed by the University. - The UniCentre budget is approved by the University Council. - No alteration to the constitution of the UniCentre can be made without the approval of the Council. - UniCentre constitution indicates it is an integral part of the University.
University of Wollongong Recreation & Aquatic Centre Limited
- URAC budget is approved by the University Council. - No alteration to the constitution of URAC can be made without the approval of the Council.
The Sydney Business School Pty Ltd
- The Sydney Business School Pty Ltd is a non trading entity of the University of Wollongong. - Commenced registration on the 17th February 2005.
40 Contributions to controlled entities and financial arrangements
illawarra Technology Corporation ltd (iTC)
- Free use of some buildings and land
Wollongong UniCentre limited
- Part salary of General Manager paid by the University - Free use of buildings - Contribution towards Conference Manager’s salary & car - Operating Grant to Kids Uni of $0.180m.
University of Wollongong Recreation and Aquatic Centre limited
- Free use of buildings and land used for sporting facilities.
The University of Wollongong is committed to ensuring that it’s subsidiaries have adequate cash reserves to meet all commitments as and when they fall due. The University will assist its subsidiaries by allowing flexible short term arrangements for balances owing by them to the University.
The assistance provided to these organisations is offset by the benefits accruing to the University, its students and staff through enhanced facilities, community relations, marketing, funding and/or repute.
All other identifiable costs and services relating to companies and organisations associated with the University are charged out to those entities under normal commercial terms and conditions.
There is no material expenditure or assets provided by other government bodies or statutory bodies at no cost to the University.

134 University of Wollongong
41 Events occurring after the statement of financial position date
Other than the matters described above, there has not been any matter or circumstances that has arisen since the end of the financial year that has significantly affected, or may significantly affect the operations of the Group, the results of those operations, or the state of affairs of the Group, in future financial years.
42 Reconciliation of operating result after income tax to net cash flows from operating activities
Consolidated(Economic Entity)
University of Wollongong(Parent Entity)
2011 2010 2011 2010
$’000 $’000 $’000 $’000
Operating result for the period 37,766 100,567 38,173 100,400
Depreciation and amortisation 29,405 25,102 26,606 23,059
Unrealised impairment of investment assets (173) 968 (40) 43
Non-cash retirement benefits expense (1,454) (686) (1,454) (686)
Dividend and interest income (7,591) (7,115) (10,391) (8,883)
Net (gain) / loss on sale of non-current assets (646) (200) (636) (181)
Non cash capital contributions - - 37 -
Payment of finance lease liability 80 - - -
Fair value gains on loans - (466) - -
Net exchange differences (163) (456) 7 (45)
Subtotal 57,224 117,714 52,302 113,707
(Increase) / decrease in trade debtors (78,786) (22,458) (81,921) (20,967)
(Increase) / decrease in inventories 221 37 175 (118)
Decrease / (increase) in accrued income (116) (1,008) (116) (1,008)
Increase / (decrease) in student fees received in advance (1,425) 2,170 152 1,780
(Increase) / decrease in other operating assets 3,675 1,950 2,613 547
(Increase) / decrease in deferred tax assets - (748) - -
Increase / (decrease) in trade creditors 1,424 5,141 (213) 3,121
Increase / (decrease) in current tax payable (170) (357) - -
Increase / (decrease) increase in other operating liabilities 3,596 2,767 5,400 2,153
(Increase) / decrease in prepayments 605 (501) 605 (501)
Increase / (decrease) in other provisions 82,368 20,365 81,944 19,885
Subtotal 11,392 7,358 8,639 4,892
net cash provided by / (used in) operating activities 68,616 125,072 60,941 118,599
fiNaNcial stateMeNts

2011 Annual Report 135
43 Financial risk management
The Group’s activities expose it to a variety of financial risks: market risk (including currency risk, fair value interest rate risk, cash flow interest rate risk and price risk), credit risk and liquidity risk. The Group’s overall risk management program focuses on the unpredictability of financial markets and seeks to minimise potential adverse effects on the financial performance of the Group. The Group uses derivative financial instruments such as foreign exchange contracts and interest rate swaps to hedge certain risk exposures. The Group uses different methods to measure different types of risk to which it is exposed. These methods include sensitivity analysis in the case of interest rate, foreign exchange and other price risks and aging analysis for credit risk and beta analysis in respect of investment portfolios to determine market risk.
The University Council has overall responsibility for the establishment and oversight of the risk management framework. The Council has established the Audit Management and Review Committee, which is responsible for developing and monitoring risk management policies. The Committee reports to the Council on its activities.
The Audit Management and Review Committee oversees how University management monitor compliance with the group’s risk management policies and procedures, and reviews the adequacy of the risk management framework, including financial risk management in relation to the risks faced by the group.
For the University’s investment portfolio, the Administrative Committee is the delegated authority under the University Council to monitor the University’s finance and investment direction. The Administrative Committee reviews and recommends to Council new policies and strategies covering the investments of the University. Performance of the University’s investment portfolio are reported at each committee meeting. The Administrative Committe reports to the Council on its activities.
The group and the parent entity have the following financial instruments:
Consolidated(Economic Entity)
University of Wollongong(Parent Entity)
2011 2010 2011 2010
$’000 $’000 $’000 $’000
Financial assets
Cash and cash equivalents 32,214 33,870 6,541 11,122
Trade and other receivables 238,481 159,405 242,053 160,096
Available-for-sale financial assets 110,082 55,141 109,037 54,009
Held-to-maturity investments 104,108 110,604 104,108 110,604
Assets held for sale 334 55,408 - 55,408
485,219 414,428 461,739 391,239
Financial liabilities
Trade and other payable 29,108 27,703 23,130 23,361
Borrowings 151,405 161,388 150,451 160,286
Other financial liabilities 1,321 876 96 814
181,834 189,967 173,677 184,461
(a) market risk
(i) Foreign exchange risk
Foreign exchange risk arises when future commercial transactions and recognised financial assets and financial liabilities are denominated in a currency that is not the Group’s functional currency. The risk is measured using sensitivity analysis and cash flow forecasting.
Exposure to foreign currency is managed by overseas operations transacting in the prevailing currency in the region and a US dollar cash hedging policy to protect against any large change in the Australian to US dollar exchange rate.
For sensitivity analysis of the foreign exchange risk, see (iv) Summarised sensitivity analysis below
(ii) Price risk
The Group and the parent entity are exposed to equity securities price risk. This arises from investments held by the Group and classified on the statement of financial position either as available for sale or assets held for sale. Neither the Group nor the parent entity are exposed to commodity price risk.
To manage its price risk arising from investments in equity securities, the Group diversifies its portfolio. Diversification of the portfolio is performed in accordance with the limits set by the Group.
The exposure to price risk arises with the group’s MLC investments classified as assets available for sale (MLC reserve portfolio) and assets held for sale (MLC medium term portfolio).

136 University of Wollongong
43 Financial risk management (continued)Each portfolio is diversified across a variety of investment types consistent with the risk/return/timeframe objectives of the portfolio and the University’s broader investment management objectives which can be found in the University’s Investment Policy.
(iii) Cash flow and fair value interest rate risk
Group
For the groups assets, the groups exposure to market interest rates relates primarily to the groups cash and cash equivalents, held to maturity investments and borrowings. The group’s trade and other receivables are non interest bearing and all related party loans and receivable are interest free.
For the group’s liabilities, the interest rate risk arises from long-term borrowings. Borrowings issued at variable rates expose the Group to cash flow interest rate risk. Borrowings issued at fixed rates expose the Group to fair value interest rate risk.
The group does not currently use any hedging instruments when dealing with interest rates.
(iv) Summarised sensitivity analysis
The following tables summarises the sensitivity of the Group’s financial assets and financial liabilities to interest rate risk, foreign exchange risk and other price risk.
fiNaNcial stateMeNts

2011 Annual Report 137
43 Financial risk management (continued)
(Economic Entity) interest rate risk Foreign exchange risk Other price risk-1% +1% -10% +10% -10% +10%
31 December 2011Carrying amount Result Equity Result Equity Result Equity Result Equity Result Equity Result Equity$’000 $’000 $’000 $’000 $’000 $’000 $’000 $’000 $’000 $’000 $’000 $’000 $’000
Financial assetsCash and cash equivalents
32,214 (322) (322) 322 322 (60) (60) 60 60 - - - -
Accounts receivable
238,481 - - - - (35) (35) 35 35 - - - - Available for sale financial assets
110,082 - - - - - - - - - (11,008) - 11,008
Held to maturity investments
104,108 (1,041) (1,041) 1,041 1,041 - - - - - - - -
Non current assets classified as held for sale - - - - - - - - - - - - - Sub Total (1,363) (1,363) 1,363 1,363 (95) (95) 95 95 - (11,008) - 11,008
Financial liabilities
Trade payables
29,108 - - - - - - - - - - - -
Borrowings
151,405 71 71 (71) (71) - - - - - - - -
Other liabilities
1,321 - - - - - - - - - - - - Sub Total 71 71 (71) (71) - - - - - - - - Total increase/ (decrease) (1,292) (1,292) 1,292 1,292 (95) (95) 95 95 - (11,008) - 11,008
(Economic Entity) interest rate risk Foreign exchange risk Other price risk-1% +1% -10% +10% -10% +10%
31 December 2010Carrying amount Result Equity Result Equity Result Equity Result Equity Result Equity Result Equity$’000 $’000 $’000 $’000 $’000 $’000 $’000 $’000 $’000 $’000 $’000 $’000 $’000
Financial assetsCash and cash equivalents
33,870 (339) (339) 339 339 (54) (54) 54 54 - - - -
Accounts receivable
159,405 - - - - (117) (117) 117 117 - - - - Available for sale financial assets
55,141 - - - - - - - - - (5,514) - 5,514
Held to maturity investments
110,604 (1,106) (1,106) 1,106 1,106 - - - - - - - -
Non current assets classified as held for sale
55,408 - - - - - - - - - (5,541) - 5,541
Financial assets at fair value through profit or loss - - - - - - - - - - - - - Sub Total (1,445) (1,445) 1,445 1,445 (171) (171) 171 171 - (11,055) - 11,055
Financial liabilities
Trade payables
27,703 - - - - - - - - - - - -
Borrowings
161,388 71 71 (71) (71) - - - - - - - -
Other liabilities
876 - - - - - - - - - - - - Sub Total 71 71 (71) (71) - - - - - - - - Total increase/ (decrease) (1,374) (1,374) 1,374 1,374 (171) (171) 171 171 - (11,055) - 11,055

138 University of Wollongong
43 Financial risk management (continued)
(Parent Entity) interest rate risk Foreign exchange risk Other price risk
-1% +1% -10% +10% -10% +10%
31 December 2011Carrying amount Result Equity Result Equity Result Equity Result Equity Result Equity Result Equity
$’000 $’000 $’000 $’000 $’000 $’000 $’000 $’000 $’000 $’000 $’000 $’000 $’000
Financial assetsCash and cash equivalents
6,541 (65) (65) 65 65 (60) (60) 60 60 - - - -
Accounts receivable
242,053 - - - - (35) (35) 35 35 - - - - Available for sale financial assets
109,037 - - - - - - - - - (10,904) - 10,904
Held to maturity investments
104,108 (1,041) (1,041) 1,041 1,041 - - - - - - - -
Sub Total (1,106) (1,106) 1,106 1,106 (95) (95) 95 95 - (10,904) - 10,904
Financial liabilities
Trade payables
23,130 - - - - - - - - - - - -
Borrowings
150,451 71 71 (71) (71) - - - - - - - -
Other liabilities
96 - - - - - - - - - - - -
Sub Total 71 71 (71) (71) - - - - - - - - Total increase/ (decrease) (1,035) (1,035) 1,035 1,035 (95) (95) 95 95 - (10,904) - 10,904
(Parent Entity) interest rate risk Foreign exchange risk Other price risk
-1% +1% -10% +10% -10% +10%
31 December 2010Carrying amount Result Equity Result Equity Result Equity Result Equity Result Equity Result Equity
$’000 $’000 $’000 $’000 $’000 $’000 $’000 $’000 $’000 $’000 $’000 $’000 $’000
Financial assetsCash and cash equivalents
11,122 (111) (111) 111 111 (54) (54) 54 54 - - - -
Accounts receivable
160,096 - - - - (112) (112) 112 112 - - - - Available for sale financial assets
54,009 - - - - - - - - - (5,401) - 5,401
Held to maturity investments
110,604 (1,106) (1,106) 1,106 1,106 - - - - - - - -
Non current assets classified as held for sale
55,408 - - - - - - - - - (5,541) - 5,541
Sub Total (1,217) (1,217) 1,217 1,217 (166) (166) 166 166 - (10,942) - 10,942
Financial liabilities
Trade payables
23,361 - - - - - - - - - - - -
Borrowings
160,286 71 71 (71) (71) - - - - - - - -
Other liabilities
814 - - - - - - - - - - - -
Sub Total 71 71 (71) (71) - - - - - - - - Total increase/ (decrease) (1,146) (1,146) 1,146 1,146 (166) (166) 166 166 - (10,942) - 10,942
fiNaNcial stateMeNts

2011 Annual Report 139
43 Financial risk management (continued)The tables above summarise the sensitivity of the financial assets against movements in interest rates, foreign exchange and other price risk. Based on economic forecasts available at the end of 2011, the following outlines the expected movements in these financial instruments through 2012.
interest Rates
The forecast at the end of 2012 is a decrease in the current RBA cash rate of 4.25% to 4.00%, a decrease of 0.25%. With this decrease, the financial instruments are forecast to decrease by $0.323m.
Foreign Exchange
The exposure to foreign exchange is predominately in the AUD / USD rates. The AUD / USD rate is forecast to be 1.00 at the end of 2012 a decrease of 5% on 2011. The impact will be an decrease in the financial instruments of $0.048m.
Other
The University’s available-for-sale assets are diversified into debt trusts, equity, property securities and cash. The available-for-sale portfolio performance is assessed against strategic benchmarks.
The returns expected are in accordance with the University’s Investment Policy and strategy settings of the individual portfolios.
(b) Credit risk
Credit risk arises from the financial assets of the group, which comprise cash and cash equivalents, trade and other receivables, assets available for sale, held to maturity investments and assets held for sale. The group’s exposure to credit risk arises from potential default of the counter party. The carrying amount of the group’s financial assets represent the maximum credit exposure. Exposure at balance date is addressed in each applicable note to the financial statements.
The group trades with students, government and other educational organisations and as such, collateral is not requested nor is it the group’s policy to securitise its trade and other receivables.
Receivable balances are monitored on an ongoing basis with the result that the group’s exposure to bad debts is not significant.
The group’s exposure to credit risk is influenced mainly by the individual characteristics of each customer.
The consolidated entity does not have any significant exposure to any individual customer, counter party or shareholding.
No credit limits were exceeded during the reporting period and management does not expect any losses from non-performance by these counterparties. This information is prepared on a consolidated basis only and no similar information is provided to the key management personnel for the parent entity.
(c) liquidity risk
Liquidity risk is the risk the group will not be able to meet its financial obligations as they fall due. The groups approach to managing the liquidity is to ensure, as far as possible, it will always have sufficient liquidity to meet its liabilities when due, under both normal and stressed conditions.
Management monitors rolling forecasts of the Group’s liquidity reserve on the basis of expected cash flow.
Maturities of financial assets and liabilities
The following tables summarise the maturity of the Group’s financial assets and financial liabilities:
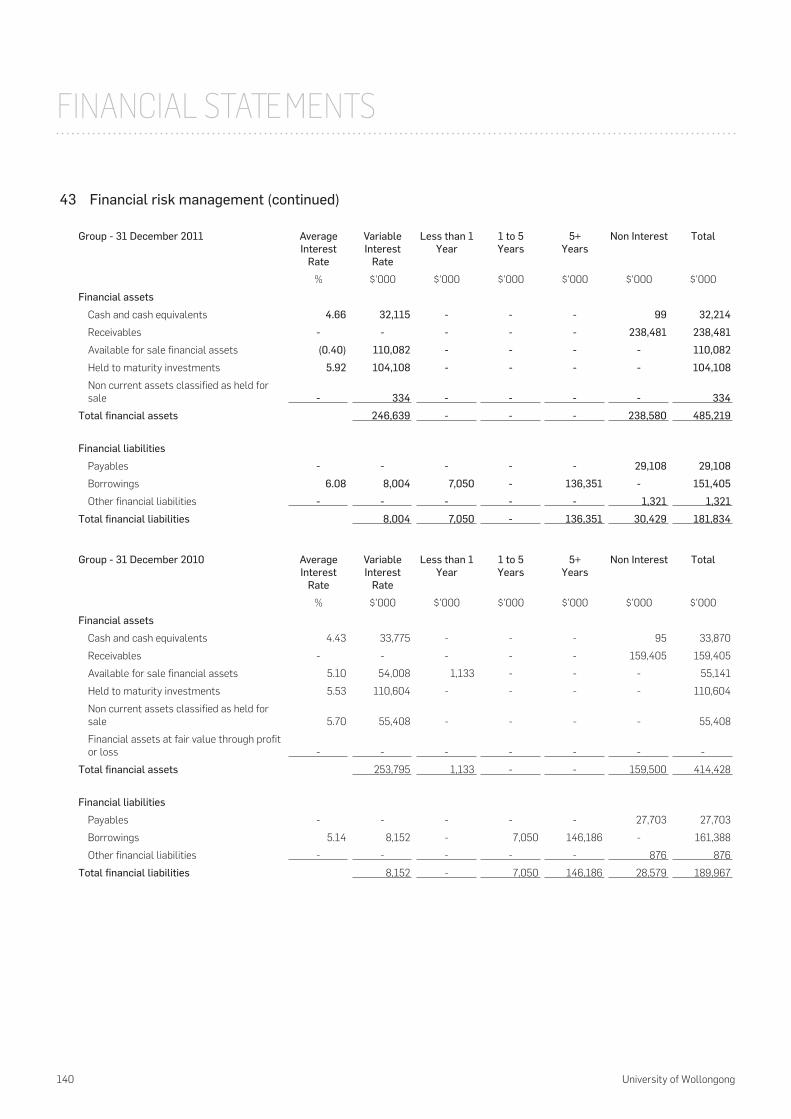
140 University of Wollongong
43 Financial risk management (continued)
Group - 31 December 2011 Average interest
Rate
Variable interest
Rate
less than 1 year
1 to 5 years
5+ years
non interest Total
% $’000 $’000 $’000 $’000 $’000 $’000
Financial assets
Cash and cash equivalents 4.66 32,115 - - - 99 32,214
Receivables - - - - - 238,481 238,481
Available for sale financial assets (0.40) 110,082 - - - - 110,082
Held to maturity investments 5.92 104,108 - - - - 104,108
Non current assets classified as held for sale - 334 - - - - 334
Total financial assets 246,639 - - - 238,580 485,219
Financial liabilities
Payables - - - - - 29,108 29,108
Borrowings 6.08 8,004 7,050 - 136,351 - 151,405
Other financial liabilities - - - - - 1,321 1,321
Total financial liabilities 8,004 7,050 - 136,351 30,429 181,834
Group - 31 December 2010 Average interest
Rate
Variable interest
Rate
less than 1 year
1 to 5 years
5+ years
non interest Total
% $’000 $’000 $’000 $’000 $’000 $’000
Financial assets
Cash and cash equivalents 4.43 33,775 - - - 95 33,870
Receivables - - - - - 159,405 159,405
Available for sale financial assets 5.10 54,008 1,133 - - - 55,141
Held to maturity investments 5.53 110,604 - - - - 110,604
Non current assets classified as held for sale 5.70 55,408 - - - - 55,408
Financial assets at fair value through profit or loss - - - - - - -
Total financial assets 253,795 1,133 - - 159,500 414,428
Financial liabilities
Payables - - - - - 27,703 27,703
Borrowings 5.14 8,152 - 7,050 146,186 - 161,388
Other financial liabilities - - - - - 876 876
Total financial liabilities 8,152 - 7,050 146,186 28,579 189,967
fiNaNcial stateMeNts

2011 Annual Report 141
43 Financial risk management (continued)
Parent - 31 December 2011 Average interest
Rate
Variable interest
Rate
less than 1 year
1 to 5 years
5+ years
non interest Total
% $’000 $’000 $’000 $’000 $’000 $’000
Financial assets
Cash and cash equivalents 4.66 6,490 - - - 51 6,541
Receivables - - - - - 242,053 242,053
Available for sale financial assets (0.60) 109,037 - - - - 109,037
Held to maturity investments 5.92 104,108 - - - - 104,108
Total financial assets 219,635 - - - 242,104 461,739
Financial liabilities
Payables - - - - - 23,130 23,130
Borrowings 6.08 7,050 7,050 - 136,351 - 150,451
Other financial liabilities - - - - - 96 96
Total financial liabilities 7,050 7,050 - 136,351 23,226 173,677
Parent - 31 December 2010 Average interest
Rate
Variable interest
Rate
less than 1 year
1 to 5 years
5+ years
non interest Total
% $’000 $’000 $’000 $’000 $’000 $’000
Financial assets
Cash and cash equivalents 4.43 11,073 - - - 49 11,122
Receivables - - - - - 160,096 160,096
Available for sale financial assets 5.10 54,009 - - - - 54,009
Held to maturity investments 5.53 110,604 - - - - 110,604
Non current assets classified as held for sale 5.70 55,408 - - - - 55,408
Total financial assets 231,094 - - - 160,145 391,239
Financial liabilities
Payables - - - - - 23,361 23,361
Borrowings 5.14 7,050 - 7,050 146,186 - 160,286
Other financial liabilities - - - - - 814 814
Total financial liabilities 7,050 - 7,050 146,186 24,175 184,461
(d) Fair value estimation
The fair value of financial assets and financial liabilities must be estimated for recognition and measurement or for disclosure purposes.
The fair value of financial instruments traded in active markets (such as publicly traded derivatives) is based on quoted market prices at the statements of financial position date. The quoted market price used for financial assets held by the Group is the current bid price.
The fair value of financial instruments that are not traded in an active market (for example, over-the-counter derivatives) is determined using valuation techniques. The Group uses a variety of methods and makes assumptions that are based on market conditions existing at each balance date. Quoted market prices or dealer quotes for similar instruments are used for long-term debt instruments held. Other techniques, such as estimated discounted cash flows, are used to determine fair value for the remaining financial instruments. The fair value of interest rate swaps is calculated as the present value of the estimated future cash flows. The fair value of forward exchange contracts is determined using forward exchange market rates at the end of the reporting period.
The carrying value less impairment provision of trade receivables and payables is a reasonable approximation of their fair values due to the short-term nature of trade receivables. The fair value of financial liabilities for disclosure purposes is estimated by discounting the future contractual cash flows at the current market interest rate that is available to the Group for similar financial instruments.

142 University of Wollongong
43 Financial risk management (continued)Due to the short-term nature of the current receivables, their carrying value is assumed to approximate their fair value and based on credit history it is expected that the receivables that are neither past due nor impaired will be received when due.
Fair value measurements recognised in the statements of financial position are categorised into the following levels:
(Economic Entity) 31 December 2011 Level 1 Level 2 Level 3
$’000 $’000 $’000 $’000
Financial assets
Managed funds 108,760 - 108,760 -
Equity securities 1,045 - - 1,045
Total 109,805 - 108,760 1,045
(Economic Entity) 31 December 2010 Level 1 Level 2 Level 3
$’000 $’000 $’000 $’000
Financial assets
Managed funds 109,180 - 109,180 -
Equity securities 1,132 - - 1,132
Total 110,312 - 109,180 1,132
(Parent Entity) 31 December 2011 Level 1 Level 2 Level 3
$’000 $’000 $’000 $’000
Financial assets
Managed funds 108,760 - 108,760 -
Total 108,760 - 108,760 -
(Parent Entity) 31 December 2010 Level 1 Level 2 Level 3
$’000 $’000 $’000 $’000
Financial assets
Managed funds 109,180 - 109,180 -
Total 109,180 - 109,180 -
Reconciliation of Financial Assets categorised as level 3:
level 3 Financial Assets 2011 Equity securities Total
$’000 $’000
(Economic Entity)
Opening balance 1,132 1,132
Losses recognised in other comprehensive income (87) (87)
Closing balance 1,045 1,045
level 3 Financial Assets 2010 Equity securities Total
$’000 $’000
(Economic Entity)
Opening balance 1,991 1,991
Losses recognised in other comprehensive income (859) (859)
Closing balance 1,132 1,132
fiNaNcial stateMeNts

2011 Annual Report 143
44 Defined benefit Plans
(a) Fund specific disclosure
The Group expects to make a contribution of $2.869 million (2010: $3.037 million) to the defined benefit plan during the next financial year.
The principal assumptions used for the purposes of the actuarial valuations were as follows (expressed as weighted averages):
2011 (%) 2010 (%)
Discount rate(s) 3.71 5.59
Expected return on plan assets 8.50 8.60
Expected rate(s) of salary increase 2.55 3.50
The analysis of the plan assets and the expected rate of return at the statements of financial position date is as follows:
2011 (%) 2010 (%)
Australian equity 2.70 2.90
Overseas equity 2.50 2.50
Australian fixed interest 0.50 0.50
Overseas fixed interest 0.20 0.30
Australian property 0.80 0.80
Cash 0.60 0.50
Other 1.20 1.10
Weighted average expected return 8.50 8.60
The overall expected rate of return is a weighted average of the expected returns of the various categories of plan assets held. The Group’s assessment of the expected returns is based on historical return trends and actuarial predictions of the market for the asset in the next twelve months
The history of experience adjustments is as follows:
2011 2010 2009 2008 2007
$’000 $’000 $’000 $’000 $’000
Fair value of plan assets (122,880) (133,430) (136,544) (131,805) (171,681)
Present value of defined benefit obligation 322,829 261,419 248,284 274,605 212,923
(Surplus)/Deficit in Fund 199,949 127,989 111,740 142,800 41,242
Experience adjustments on plan liabilities 57,541 9,848 (24,768) 61,742 (8,621)
Experience adjustments on plan assets 11,378 4,096 (5,475) 40,111 (4,594)
(b) Financial impact for defined benefit plans
SASS SAnCS SSS PSF Total
$’000 $’000 $’000 $’000 $’000
Present value obligations - 2011
Opening defined benefit obligation 36,342 7,672 212,953 4,452 261,419
Current service cost 1,369 330 225 217 2,141
Interest cost 1,943 399 11,579 194 14,115
Contributions from plan participants 626 - 798 - 1,424
Actuarial losses/(gains) 1,408 419 56,150 304 58,281
Benefits paid (2,253) (769) (10,965) (564) (14,551)
Closing defined benefit obligation 39,435 8,051 270,740 4,603 322,829

144 University of Wollongong
44 Defined benefit Plans (continued)
SASS SAnCS SSS PSF Total
$’000 $’000 $’000 $’000 $’000
Present value of plan assets - 2011
Opening fair value of plan assets 42,388 3,033 83,597 4,412 133,430
Expected return on plan assets 3,509 320 6,688 334 10,851
Actuarial gains/(losses) (3,408) (378) (7,237) (353) (11,376)
Contributions from the employer 1,382 437 700 408 2,927
Contributions from plan participants 626 - 798 - 1,424
Benefits paid (2,253) (769) (10,965) (564) (14,551)
Closing fair value of plans assets 42,244 2,643 73,581 4,237 122,705
Reimbursement rights - 2011
Opening value of reimbursement right (6,046) - 129,356 - 123,310
Change in value 3,237 - 67,803 - 71,040
Closing value of reimbursement right (2,809) - 197,159 - 194,350
net liability - 2011
Defined benefit obligation 39,435 8,051 270,740 4,603 322,829
Fair value of plan assets (42,244) (2,643) (73,581) (4,412) (122,880)
Total liability/(asset) in statement of financial position (2,809) 5,408 197,159 191 199,949
Expense recognised 2011
Current service cost 1,369 329 225 217 2,140
Interest on obligation 1,943 399 11,578 194 14,114
Expected return on plan assets (3,509) (320) (6,688) (334) (10,851)
Expense/(income) (197) 408 5,115 77 5,403
Actual returns - 2011
Actual return on plan assets (871) (58) (1,621) (19) (2,569)
(871) (58) (1,621) (19) (2,569)
Other comprehensive income - 2011
Actuarial losses/(gains) on defined benefit - 797 - 657 1,454
Recognised in other comprehensive income - 797 - 657 1,454
fiNaNcial stateMeNts

2011 Annual Report 145
44 Defined benefit Plans (continued)
SASS SAnCS SSS PSF Total
$’000 $’000 $’000 $’000 $’000
Present value obligations - 2010
Opening defined benefit obligation 33,799 7,794 202,308 4,383 248,284
Current service cost 1,316 356 586 189 2,447
Interest cost 1,886 421 11,426 198 13,931
Contributions from plan participants 614 - 1,040 - 1,654
Actuarial losses/(gains) 1,330 51 8,332 213 9,926
Benefits paid (2,603) (950) (10,739) (531) (14,823)
Closing defined benefit obligation 36,342 7,672 212,953 4,452 261,419
Present value of plan assets - 2010
Opening fair value of plan assets 40,849 3,203 88,046 4,446 136,544
Expected return on plan assets 3,397 340 7,082 332 11,151
Actuarial gains/(losses) (1,098) (193) (2,576) (228) (4,095)
Contributions from the employer 1,229 634 744 393 3,000
Contributions from plan participants 614 - 1,040 - 1,654
Benefits paid (2,603) (951) (10,739) (531) (14,824)
Closing fair value of plans assets 42,388 3,033 83,597 4,412 133,430
Reimbursement rights - 2010
Opening value of reimbursement right (7,050) - 114,262 - 107,212
Change in value 1,004 - 15,094 - 16,098
Closing value of reimbursement right (6,046) - 129,356 - 123,310
net liability - 2010
Defined benefit obligation 36,342 7,672 212,953 4,452 261,419
Fair value of plan assets (42,388) (3,033) (83,597) (4,412) (133,430)
Total liability/(asset) in statement of financial position (6,046) 4,639 129,356 40 127,989
Expense recognised 2010
Current service cost 1,316 356 586 189 2,447
Interest on obligation 1,886 421 11,426 198 13,931
Expected return on plan assets (3,397) (340) (7,082) (332) (11,151)
Expense/(income) (195) 437 4,930 55 5,227
Actual returns - 2010
Actual return on plan assets 1,846 147 3,864 104 5,961
Actual return on reimbursement right - - - - -
Closing defined benefit obligation 1,846 147 3,864 104 5,961
Other comprehensive income - 2010
Actuarial losses/(gains) on defined benefit - 245 - 441 686
Recognised in other comprehensive income - 245 - 441 686
146 University of Wollongong
44 Defined benefit Plans (continued)
Superannuation Scheme for Australian Universities
The parent entity also contributes to UniSuper Defined Benefit Division (UniSuper), formerly known as Superannuation Scheme for Australian Universities (SSAU) for academic staff appointed since 1 March 1988 and all other staff from 1 July 1991.
Clause 34 of the UniSuper Trust Deed outlines the process UniSuper must undertake (including employer notifications and (notice periods) in order to request additional contributions from employers if the UniSuper assets are considered by the Trustee to be insufficient to provide benefits payable under the Deed. At least four years notice that such a request may be made is required. If such a request was agreed to be all employers then members had to also contribute additional contributions. If all employers did not agree to increase contributions the Trustee had to reduce benefits on a fair and equitable basis. The Trustee notified employers during 2003 that such a request may be made in the future but considered that this was unlikely at the time.
Should the balance of UniSuper Fund become a deficit, the Group is not liable to make any payments to UniSuper unless all the universities (including the University of Wollongong) who are members of the UniSuper Fund unanimously agree to make additional contributions to the Fund. It is only on this basis that the group would be liable for the agreed additional contribution. Management of the parent entity believes it is unlikely that any additional contribution will be required in the foreseeable future.
Historically, surpluses in UniSuper have been used to improve members’ benefits and have not affected the amount of participating employers’ contributions.
As at 30 June 2011, the total assets of UniSuper Defined Benefit Division were estimated to be $906,500,000 (2010: $1,217,000,000 deficit) in deficiency of vested benefits. The vested benefits are benefits which are not conditional upon continued membership (or any factor other than leaving the service of the participating institution) and include the value of CPI indexed pensions being provided by the Defined Benefit Division.
As at 30 June 2011, the total assets of UniSuper Defined Benefit Division were estimated to be $426,700,000 (2010: $312,000,000 deficit) in excess of accrued benefits. The accrued benefits have been calculated as the present value of expected future benefits payments to members and CPI indexed pensioners which arise from membership of UniSuper up to the reporting date.
The Defined Benefit Division as at 30 June 2011 is therefore in an “unsatisfactory financial position” as defined by SIS Regulation 9.04. An “unsatisfactory financial position” for a defined benefit fund is defined as when ‘the value of the assets of the Fund is inadequate to cover the value of the liabilities of the Fund in respect of benefits vested in the members of the Fund’. The Actuary and the Trustee have followed the procedure required by Section 130 of the SIS Act when funds are found to be in an unsatisfactory financial position.
The actuary currently believes, in respect of the long-term financial condition of the Fund, that assets as at 30 June 2011, together with current contribution rates, are expected to be sufficient to provide for the current benefit levels for both existing members and anticipated new members if experience follows the “best estimate” assumptions.
fiNaNcial stateMeNts

2011 Annual Report 147
45
Acq
uitt
al o
f Aus
tral
ian
Gov
ernm
ent fi
nanc
ial a
ssis
tanc
e
45.1
DEE
WR
- CG
S an
d O
ther
DEE
WR
Gra
nts
Pare
nt E
ntity
(Uni
vers
ity)
On
ly C
omm
onw
ealth
gr
ants
sch
eme1
indi
geno
us s
uppo
rt
prog
ram
Dis
abili
ty s
uppo
rt
prog
ram
Wor
kpla
ce re
form
pr
ogra
mW
orkp
lace
pro
duct
ivity
pr
ogra
mle
arni
ng &
teac
hing
pe
rfor
man
ce fu
ndin
dige
nous
sup
port
pr
ogra
m
2011
2010
2011
2010
2011
2010
2011
2010
2011
2010
2011
2010
2011
2010
$’00
0$’
000
$’00
0$’
000
$’00
0$’
000
$’00
0$’
000
$’00
0$’
000
$’00
0$’
000
$’00
0$’
000
Fina
ncia
l ass
ista
nce
rece
ived
in
CA
SH d
urin
g th
e re
port
ing
perio
d (t
otal
cas
h re
ceiv
ed fr
om
the
Aus
tral
ian
Gov
ernm
ent f
or
the
Prog
ram
mes
)
114,
583
11
2,27
8
861
76
3
119
14
0
73
41
-
505
-
-
18
8
386
Reve
nue
for t
he p
erio
d
114,
583
11
2,27
8
861
76
3
119
14
0
73
41
-
505
-
-
18
8
386
Surp
lus
/ (de
ficit)
from
the
prev
ious
yea
r
-
-
-
-
-
-
-
-
829
98
6
-
4,44
1
-
-
Tota
l rev
enue
incl
udin
g ac
crue
d re
venu
e
114,
583
11
2,27
8
861
76
3
119
14
0
73
41
829
1,
491
-
4,
441
18
8
386
Less
exp
ense
s in
clud
ing
accr
ued
expe
nses
(11
4,58
3)
(112
,278
)
(861
)
(763
)
(119
)
(140
)
(73)
(4
1)
(829
)
(662
)
-
(4,4
41)
(1
88)
(3
86)
Surp
lus
/ (de
ficit)
for r
epor
ting
perio
d
-
-
-
-
-
-
-
-
-
829
-
-
-
-
Pare
nt E
ntity
(Uni
vers
ity) O
nly
Col
labo
ratio
n &
st
ruct
ural
refo
rm
prog
ram
me
Tota
l
2011
2010
2011
2010
$’00
0$’
000
$’00
0$’
000
Fina
ncia
l ass
ista
nce
rece
ived
in C
ASH
du
ring
the
repo
rtin
g pe
riod
(tot
al c
ash
rece
ived
from
the
Aus
tral
ian
Gov
ernm
ent
for t
he P
rogr
amm
es)
14
1
-
115,
965
11
4,11
3
Reve
nue
for t
he p
erio
d
141
-
11
5,96
5
114,
113
Surp
lus
/ (de
ficit)
from
the
prev
ious
yea
r
3,05
4
4,02
9
3,88
3
9,45
6
Tota
l rev
enue
incl
udin
g ac
crue
d re
venu
e
3,19
5
4,02
9
119,
848
12
3,56
9
Less
exp
ense
s in
clud
ing
accr
ued
expe
nses
(3
,195
)
(975
) (
119,
848)
(1
19,6
86)
Surp
lus
/ (de
ficit)
for r
epor
ting
perio
d
-
3,05
4
-
3,88
3
1 Incl
udes
the
basi
c C
GS
gran
t am
ount
, CG
S-Re
gion
al L
oadi
ng, C
GS-
Enab
led
Load
ing,
Mat
hs a
nd S
cien
ce T
rans
ition
Loa
ding
and
Ful
l Fee
Pla
ces
Tran
sitio
n Lo
adin
g.

148 University of Wollongong
45
Acq
uitt
al o
f Aus
tral
ian
Gov
ernm
ent fi
nanc
ial a
ssis
tanc
e (c
ontin
ued)
45.2
hig
her E
duca
tion
loan
Pro
gram
mes
(exc
l OS-
hEl
P)
Pare
nt E
ntity
(Uni
vers
ity) O
nly
hEC
S-h
ElP
- Aus
tral
ian
Gov
ernm
ent p
aym
ents
(A
ustr
alia
n G
over
nmen
t pa
ymen
ts o
nly)
FEE-
hEl
PTo
tal
2011
2010
2011
2010
2011
2010
$’00
0$’
000
$’00
0$’
000
$’00
0$’
000
Fina
ncia
l ass
ista
nce
rece
ived
in C
ASH
du
ring
the
repo
rtin
g pe
riod
(tot
al c
ash
rece
ived
from
the
Aus
tral
ian
Gov
ernm
ent
for t
he P
rogr
amm
es)
68
,496
65
,275
3,
605
4,
069
72
,101
69
,344
Reve
nue
for t
he p
erio
d
68,4
96
65,2
75
3,60
5
4,06
9
72,1
01
69,3
44
Surp
lus
/ (de
ficit)
from
the
prev
ious
yea
r
-
-
-
-
-
-
Tota
l rev
enue
incl
udin
g ac
crue
d re
venu
e
68,4
96
65,2
75
3,60
5
4,06
9
72,1
01
69,3
44
Less
exp
ense
s in
clud
ing
accr
ued
expe
nses
(6
8,49
6)
(65,
275)
(3
,605
)
(4,0
69)
(7
2,10
1)
(69,
344)
Surp
lus
/ (de
ficit)
for r
epor
ting
perio
d
-
-
-
-
-
-
45.3
Sch
olar
ship
s
Pare
nt E
ntity
(Uni
vers
ity)
On
ly
Aus
tral
ian
post
grad
uate
aw
ards
inte
rnat
iona
l po
stgr
adua
te
rese
arch
sc
hola
rshi
p
Com
mon
wea
lth
educ
atio
n co
st
scho
lars
hips
Com
mon
wea
lth
acco
mm
odat
ion
scho
lars
hips
indi
geno
us a
cces
s sc
hola
rshi
psn
atio
nal p
riorit
y sc
hola
rshi
psTo
tal
2011
2010
2011
2010
2011
2010
2011
2010
2011
2010
2011
2010
2011
2010
$’00
0$’
000
$’00
0$’
000
$’00
0$’
000
$’00
0$’
000
$’00
0$’
000
$’00
0$’
000
$’00
0$’
000
Fina
ncia
l ass
ista
nce
rece
ived
in C
ASH
dur
ing
the
repo
rtin
g pe
riod
(tot
al
cash
rece
ived
from
the
Aus
tral
ian
Gov
ernm
ent f
or
the
Prog
ram
mes
)
3,95
3
3,14
4
399
36
5
64
50
32
1,91
3
43
64
1,20
5
-
5,69
6
5,53
6
Reve
nue
for t
he p
erio
d
3,95
3
3,14
4
399
36
5
64
50
32
1,91
3
43
64
1,20
5
-
5,69
6
5,53
6
Surp
lus
/ (de
ficit)
from
the
prev
ious
yea
r
347
26
6
215
13
2
-
369
1,
635
56
4
1
-
20
20
2,21
8
1,35
1
Tota
l rev
enue
incl
udin
g ac
crue
d re
venu
e
4,30
0
3,41
0
614
49
7
64
419
1,
667
2,
477
44
64
1,
225
20
7,
914
6,
887
Less
exp
ense
s in
clud
ing
accr
ued
expe
nses
(3
,631
)
(3,0
63)
(3
12)
(2
82)
(2
9)
(419
)
(1,0
31)
(8
42)
(2
2)
(63)
(5
)
-
(5,0
30)
(4
,669
)
Surp
lus
/ (de
ficit)
for
repo
rtin
g pe
riod
66
9
347
30
2
215
35
-
63
6
1,63
5
22
1
1,22
0
20
2,88
4
2,21
8
fiNaNcial stateMeNts
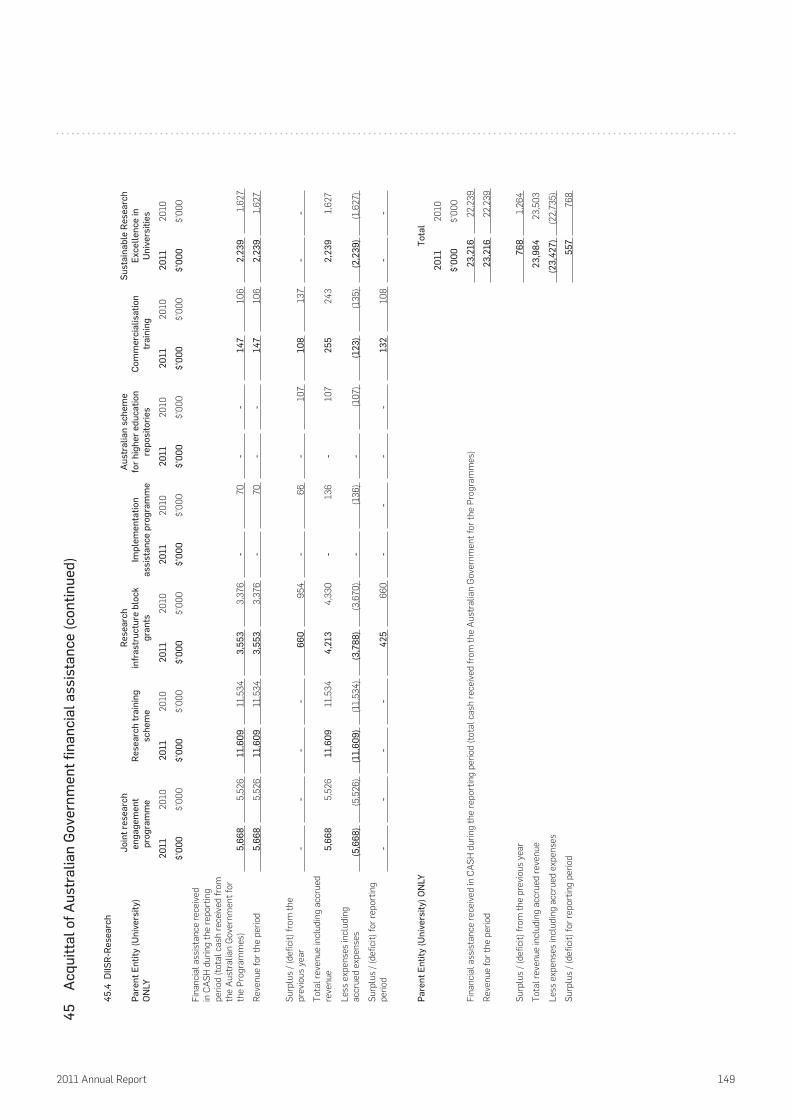
2011 Annual Report 149
45
Acq
uitt
al o
f Aus
tral
ian
Gov
ernm
ent fi
nanc
ial a
ssis
tanc
e (c
ontin
ued)
45.4
DiiS
R-Re
sear
ch
Pare
nt E
ntity
(Uni
vers
ity)
On
ly
Joi
nt re
sear
ch
enga
gem
ent
prog
ram
me
Rese
arch
trai
ning
sc
hem
e
Rese
arch
in
fras
truc
ture
blo
ck
gran
tsim
plem
enta
tion
assi
stan
ce p
rogr
amm
e
Aus
tral
ian
sche
me
for h
ighe
r edu
catio
n re
posi
torie
sC
omm
erci
alis
atio
n tr
aini
ng
Sust
aina
ble
Rese
arch
Ex
celle
nce
in
Uni
vers
ities
2011
2010
2011
2010
2011
2010
2011
2010
2011
2010
2011
2010
2011
2010
$’00
0$’
000
$’00
0$’
000
$’00
0$’
000
$’00
0$’
000
$’00
0$’
000
$’00
0$’
000
$’00
0$’
000
Fina
ncia
l ass
ista
nce
rece
ived
in
CA
SH d
urin
g th
e re
port
ing
perio
d (t
otal
cas
h re
ceiv
ed fr
om
the
Aus
tral
ian
Gov
ernm
ent f
or
the
Prog
ram
mes
)
5,66
8
5,52
6
11,6
09
11,5
34
3,55
3
3,37
6
-
70
-
-
147
10
6
2,23
9
1,62
7
Reve
nue
for t
he p
erio
d
5,66
8
5,52
6
11,6
09
11,5
34
3,55
3
3,37
6
-
70
-
-
147
10
6
2,23
9
1,62
7
Surp
lus
/ (de
ficit)
from
the
prev
ious
yea
r
-
-
-
-
660
95
4
-
66
-
107
10
8
137
-
-
Tota
l rev
enue
incl
udin
g ac
crue
d re
venu
e
5,66
8
5,52
6
11,6
09
11,5
34
4,21
3
4,33
0
-
136
-
10
7
255
24
3
2,23
9
1,62
7
Less
exp
ense
s in
clud
ing
accr
ued
expe
nses
(5
,668
)
(5,5
26)
(1
1,60
9)
(11,
534)
(3
,788
)
(3,6
70)
-
(1
36)
-
(1
07)
(1
23)
(1
35)
(2
,239
)
(1,6
27)
Surp
lus
/ (de
ficit)
for r
epor
ting
perio
d
-
-
-
-
425
66
0
-
-
-
-
132
10
8
-
-
Pare
nt E
ntity
(Uni
vers
ity) O
nly
Tota
l
2011
2010
$’00
0$’
000
Fina
ncia
l ass
ista
nce
rece
ived
in C
ASH
dur
ing
the
repo
rtin
g pe
riod
(tot
al c
ash
rece
ived
from
the
Aus
tral
ian
Gov
ernm
ent f
or th
e Pr
ogra
mm
es)
23
,216
22
,239
Reve
nue
for t
he p
erio
d
23,2
16
22,2
39
Surp
lus
/ (de
ficit)
from
the
prev
ious
yea
r
768
1,
264
Tota
l rev
enue
incl
udin
g ac
crue
d re
venu
e
23,9
84
23,5
03
Less
exp
ense
s in
clud
ing
accr
ued
expe
nses
(2
3,42
7)
(22,
735)
Surp
lus
/ (de
ficit)
for r
epor
ting
perio
d
557
76
8

150 University of Wollongong
45 Acquittal of Australian Government financial assistance (continued)
45.5 Other Capital Funding
Parent Entity (University) OnlyTeaching and learning
Capital FundEducation investment
FundTotal
2011 2010 2011 2010 2011 2010
$’000 $’000 $’000 $’000 $’000 $’000
Financial assistance received in CASH during the reporting period (total cash received from the Australian Government for the Programmes) - - 34,600 47,800 34,600 47,800
Net accrual adjustments - - - - - -
Revenue for the period - - 34,600 47,800 34,600 47,800
Surplus / (deficit) from the previous year 2,466 9,431 10,563 7,852 13,029 17,283
Total revenue including accrued revenue 2,466 9,431 45,163 55,652 47,629 65,083
Less expenses including accrued expenses (2,466) (6,965) (32,447) (45,089) (34,913) (52,054)
Surplus / (deficit) for reporting period - 2,466 12,716 10,563 12,716 13,029
45.6 Australian Research Council Grants
(a) Discovery
Parent Entity (University) Only Project Fellowships Federation fellowships
Super Science Fellowships Total
2011 2010 2011 2010 2011 2010 2011 2010 2011 2010
$’000 $’000 $’000 $’000 $’000 $’000 $’000 $’000 $’000 $’000
Financial assistance received in CASH during the reporting period (total cash received from the Australian Government for the Programmes) 8,626 8,220 3,494 2,160 174 343 189 - 12,483 10,723
Revenue for the period 8,626 8,220 3,494 2,160 174 343 189 - 12,483 10,723
Surplus / (deficit) from the previous year 3,722 4,257 1,181 891 15 18 - - 4,918 5,166
Total revenue including accrued revenue 12,348 12,477 4,675 3,051 189 361 189 - 17,401 15,889
Less expenses including accrued expenses (8,441) (8,755) (2,768) (1,870) (189) (346) (126) - (11,524) (10,971)
Surplus / (deficit) for reporting period 3,907 3,722 1,907 1,181 - 15 63 - 5,877 4,918
fiNaNcial stateMeNts

2011 Annual Report 151
45 Acquittal of Australian Government financial assistance (continued)
(b) linkages
Parent Entity (University) Only infrastructure international Projects Total
2011 2010 2011 2010 2011 2010 2011 2010
$’000 $’000 $’000 $’000 $’000 $’000 $’000 $’000
Financial assistance received in CASH during the reporting period (total cash received from the Australian Government for the Programmes) 890 1,050 - 85 4,195 3,791 5,085 4,926
Revenue for the period 890 1,050 - 85 4,195 3,791 5,085 4,926
Surplus / (deficit) from the previous year - 521 85 282 1,608 2,395 1,693 3,198
Total revenue including accrued revenue 890 1,571 85 367 5,803 6,186 6,778 8,124
Less expenses including accrued expenses (890) (1,571) (66) (282) - (4,578) (956) (6,431)
Surplus / (deficit) for reporting period - - 19 85 5,803 1,608 5,822 1,693
(c) networks and Centres
Parent Entity (University) Only Centres Total
2011 2010 2011 2010
$’000 $’000 $’000 $’000
Financial assistance received in CASH during the reporting period (total cash received from the Australian Government for the Programmes) 2,327 2,499 2,327 2,499
Revenue for the period 2,327 2,499 2,327 2,499
Surplus / (deficit) from the previous year 1,988 790 1,988 790
Total revenue including accrued revenue 4,315 3,289 4,315 3,289
Less expenses including accrued expenses (2,476) (1,301) (2,476) (1,301)
Surplus / (deficit) for reporting period 1,839 1,988 1,839 1,988
45.7 OS-hElP
Parent Entity (University) Only 2011 2010
$’000 $’000
Cash Received during the reporting period 1,005 1,337
Cash Spent during the reporting period (1,191) (1,001)
Net Cash received (186) 336
Cash Surplus / (deficit) from the previous period 80 (256)
Cash Surplus / (deficit) for reporting period (106) 80
END OF AUDITED FINANCIAL STATEMENTS

152 University of Wollongong
Academic Promotions 9, 36, 42, 64-65
Academic Senate 8, 9, 11-12, 19, 20, 59
Accommodation 58, 10, 20-21, 33, 40, 45, 46, 66, 102, 103, 104, 122, 148
Address of Principle Office Back Cover
Alumni 8, 19, 23, 30, 34
Committee Structure 9
Community 3, 5, 8, 9, 16, 20, 21, 23, 27, 30-31, 33, 38, 39, 49, 52, 53, 58, 60, 73, 78, 125, 133
Complaints 15, 43, 49
Contact Details Back Cover
Controlled Entities 42, 43, 44, 51-53, 58, 72, 89, 91, 96, 117, 128, 133
Council Membership 10, 50, 73-74
Council Role and Function 58
Courses 3, 9, 11, 13, 14, 15, 17, 29, 32, 33, 51, 58, 73
Disability 22, 23, 39, 40, 63, 102, 147
Employment, Equity and Diversity 8, 9, 36-37, 39-40, 63
Engagement and Partnerships 30-31
Engagement of Consultants 67
Enrolment 13, 14, 15, 16, 21, 29, 32, 33, 34, 36, 43, 51, 52, 57, 69, 75
Environment 9, 11, 46-48, 74
Faculties 3, 8, 54
Financial Statements 82-151
Freedom of Information 49-50, 60-62
Governance 8-12, 15, 19, 53, 58-59, 73, 78
Heritage Management 46
Human Resources 8, 35-40
Higher Degree Research 23, 24-29
ITC Limited 43, 51, 52, 68, 75, 91, 95, 110, 132, 133
Indigenous 3, 8, 21-22, 23, 35, 36-37, 39, 40, 54, 102, 147, 148
Information Technology Services 49
Innovation Campus 3, 5, 6, 7, 8, 9, 11, 27, 29, 45, 48, 49, 57, 58, 66, 67, 68, 70, 74, 99, 115, 122
International 3, 4, 5, 8, 9, 11, 14, 17-18, 19, 20, 21, 22, 23, 24, 25, 27, 28, 29, 30, 31, 32-34, 35, 38, 41, 42, 43, 44, 50,
51, 52, 57, 69, 72, 75, 76, 102, 103, 148, 151
Land Disposal and Acquisition 66
Legislative Changes 39, 50
Letter of Submission Inside Cover
Library 5, 8, 9, 11, 18-19, 43, 46, 52, 92, 95, 104, 107, 116, 117
Major Works 66
Mission 3
Multicultural Policies and Services Program Report 40
NSW Auditor’s Report 80-81
Occupational Health and Safety 37, 38-39
Offshore 3, 5, 14, 17-18, 20, 32, 33, 34, 57
Opening Hours Back Cover
Organisational Chart 8
Overseas Visits 38
Performance of Executive Officers 57
Principles 3
Privacy 43, 49
Quality 4, 8, 9, 10, 11, 12, 13, 14, 15, 17, 20, 25, 28, 32, 33, 34, 35, 36, 37, 41-53, 57
Research 3, 4, 5, 6, 7, 8, 9, 11, 12, 19, 24-29, 31, 32, 33, 36, 38, 42, 43, 45, 49, 51, 57, 67, 68, 69, 70, 71, 73, 78, 87, 95,
102, 103, 104, 105, 148, 149, 150
Risk Management 11, 42, 58, 78, 135-142
Senior University Officers 55-56
Strategic Planning 8, 12, 23, 35
Student Numbers 3, 15, 16, 18
Travel 33, 38, 71, 75, 78, 108
UniAdvice 8, 51, 52
UniCentre 11, 43, 45, 46, 47, 53, 66, 68, 91, 95, 110, 112, 132, 133
University of Wollongong Act 1989 (NSW) 50, 58, 73
University Recreation and Aquatic Centre 11, 43, 52-53, 68, 71, 95, 133
UOW College 9, 11, 22, 23, 51-52
Vice-Chancellor’s Message 4-5
Vision 3
COST OF PRODUCTIONThe Annual Report was produced internally by the University. The cost of production of the 2011 UOW Annual Report was approximately $11,000.
CORRECTIONSSince submission to Parliament, typographical corrections have been made on page 132.
INDEX

EXCELLENCELEADERSHIPINNOVATIONCONNECT:ANNUAL REPORT2011
CONTACT INFORMATIONFor more information about the University, please visit: www.uow.edu.au Enquiries about courses and subjects may be directed to:
Wollongong UniAdviceTel: 1300 367 869Fax: +61 2 4221 4392Email: [email protected]
Other enquiries can be made during office hours to:
The SwitchboardTel: +61 2 4221 3555Fax: +61 2 4221 4322Switchboard 8.30am – 5.30pmOffice hours Monday to Friday
Written Enquiries should be addressed to the:
Vice‑Principal (Administration)University of WollongongNorthfields Avenue Wollongong NSW 2522 Australia
The 2011 Annual Report is available on the University’s website: www.uow.edu.au/about/annualreport
© 2012 University of Wollongong.
The University of Wollongong attempts to ensure that the information contained in this publication is correct at the time of production (April 2012), however sections may be amended without notice by the University in response to changing circumstances or for any other reason.
CRICOS Provider No.: 00102E. ISSN 1 2345 6789.
UN
IVERSITY OF WOLLON
GONG
2011 AN
NUA
L REPORT