Embed Size (px)
Citation preview
Exceptional ocean surface conditions on the SEGreenland shelf during the MedievalClimate AnomalyArto Miettinen1, Dmitry V. Divine1,2, Katrine Husum1, Nalan Koç1, and Anne Jennings3
1Norwegian Polar Institute, Tromsø, Norway, 2Department of Mathematics and Statistics, Arctic University of Norway,Tromsø, Norway, 3INSTAAR and Department of Geological Sciences, University of Colorado Boulder, Boulder, Colorado, USA
Abstract Diatom inferred 2900 year long records of August sea surface temperature (aSST) and Aprilsea ice concentration (aSIC) are generated from a marine sediment core from the SE Greenland shelf witha special focus on the interval ca. 870–1910 Common Era (C.E.) reconstructed in subdecadal temporalresolution. The Medieval Climate Anomaly (MCA) between 1000 and 1200 C.E. represents the warmest oceansurface conditions of the SE Greenland shelf over the late Holocene (880 B.C.E. (before the Common Era) to1910 C.E.). It was characterized by abrupt, decadal to multidecadal changes, such as an abrupt warming of~2.4°C in 55 years around 1000 C.E. Temperature changes of these magnitudes are rare on the North Atlanticproxy data. Compared to regional air temperature reconstructions, our results indicate a lag of about 50 yearsin ocean surface warming either due to increased freshwater discharge from the Greenland ice sheet orintensified sea ice export from the Arctic as a response to atmospheric warming at the beginning of the MCA.A cool phase, from 1200–1890 C.E., associated with the Little Ice Age, ends with the rapid warming ofaSST and diminished aSIC in the early twentieth century. The results show that the periods of warm aSST andaSIC minima are coupled with solar minima suggesting that solar forcing possibly amplified by atmosphericforcing have been behind the variability of surface conditions on the SE Greenland over the last millennium.The results indicate that the SE Greenland shelf is a climatologically sensitive area where extremely rapidchanges are possible and highlights the importance of the area under the present warming conditions.
1. Introduction
Both freshwater and sea ice export from the Arctic Ocean by the cold East Greenland Current (EGC) as well asfreshwater discharge from the Greenland ice sheet (GIS) affect sea surface temperature (SST) in the NorthAtlantic. This affects in turn the surface circulation in the North Atlantic subpolar gyre, and the intensity ofthe North Atlantic Deep Water formation both in the Greenland and Labrador Seas with major implicationsfor the Atlantic Meridional Overturning Circulation (AMOC) and the North Atlantic climate [e.g., Blascheket al., 2015; Yu et al., 2015].
Despite the potential climatic impacts of changes in freshwater balance from the SE Greenland area, very fewgeological proxy records of ocean surface conditions covering the last millennium exist from this area.Studies at a low temporal resolution indicate that the Neoglacial interval from ca. 3.0 to 0.2 cal ka B.P. was coldand variable with increased freshwater forcing from the Arctic Ocean [Andersen et al., 2004a, 2004b; Jenningset al., 2011] though characterized by a slow warming trend [Jennings et al., 2011]. Andresen et al. [2012] foundfrom cores Fox04G/05R near Sermilik Fjord that the area was dominated by cold low-salinity water massesfrom 1.5 cal ka B.P., until the subsurface conditions turned warmer at 0.7 cal ka B.P. Lithofacies and benthicforaminiferal analyses from Nansen Fjord, eastern Greenland, suggest that the climate in the area waswarmer and more stable than today during the MCA ca. 730–1100 Common Era (C.E.), whereas variableclimatic conditions with frequent intervals of severe cold characterize a Little Ice Age (LIA)-type interval ca.1630–1900 C.E. [Jennings and Weiner, 1996]. Only one SST study from the SE Greenland shelf has focusedon decadal- to centennial-scale variability of the last millennium. In the diatom-based study on the coreMD99-2322 for the time interval 1150–1740 Common Era (C.E.), Justwan et al. [2009] did not observe any clearwarm or cold phases associated with the known climate anomalies of the last millennium. Farther to thesouthwest, in the ca. 1500 yearlong record from Igaliku Fjord, SSW Greenland [Jensen et al., 2004], a coldclimate regime changed to the warm Medieval Climate Anomaly (MCA) observed between 800 and 1250C.E. and characterized by cooling events between 960 and 1140 C.E. The MCA was followed by a variable
MIETTINEN ET AL. THE MCA ON THE SE GREENLAND SHELF 1657
PUBLICATIONSPaleoceanography
RESEARCH ARTICLE10.1002/2015PA002849
Key Points:• Ocean surface conditions werereconstructed from the SE Greenlandshelf for the last millennium
• The Medieval Climate Anomaly 1000to 1200 C.E. represents the warmestperiod of the late Holocene
• Solar forcing amplified by atmosphericforcing was behind the surfaceconditions
Supporting Information:• Figures S1–S5
Correspondence to:A. Miettinen,[email protected]
Citation:Miettinen, A., D. V. Divine, K. Husum,N. Koç, and A. Jennings (2015),Exceptional ocean surface conditionson the SE Greenland shelf duringthe Medieval Climate Anomaly,Paleoceanography, 30, 1657–1674,doi:10.1002/2015PA002849.
Received 23 JUN 2015Accepted 26 NOV 2015Accepted article online 2 DEC 2015Published online 26 DEC 2015
©2015. American Geophysical Union.All Rights Reserved.
transitional period, and cold conditions during the Little Ice Age (LIA) prevailed for 1580–1850 C.E. Overall, noclear MCA signal of warm sea surface conditions have not been reported in the SE Greenland shelf areaaccording to previous studies.
The climate of the last millennium featured distinct centennial- to decadal-scale variability with well-documented societal impacts. As future climate changes will be a result of an interaction between the naturaland anthropogenic forcing, better understanding of the mechanisms behind recent natural climate anomalieswill improve predictions of future variability. TheMCA and the LIA are commonly considered to occupy the timeperiods of ca. 950–1250 C.E. and 1400–1900 C.E. in the North Atlantic region [e.g., Lamb, 1965; Grove, 1988;Mann et al., 2009; Berner et al., 2011; Graham et al., 2011; Goosse et al., 2012]. Many regional aspects of theseanomalies require further investigations, such as the timing of the anomalies in the Holocene climatic context,the spatial extent and local expression, associated forcing factors, and their relative magnitudes compared withthe modern instrumental temperature records and the twentieth century warming [e.g., Xoplaki et al., 2011].
Although several marine high-resolution SST proxy records have been published from the northern NorthAtlantic during the last few years [e.g., Berner et al., 2008, 2011; Miettinen et al., 2011, 2012; Ran et al., 2011;Sicre et al., 2011, 2014; Jiang et al., 2015], these records are still too sparse for inferring the decadal- tomultidecadal-scale spatial manifestation of the MCA and LIA in the northern North Atlantic realm. The situa-tion is even worse with sea ice proxy data as few quantitative high-resolution records exist [e.g., Justwan andKoç, 2008; Masse et al., 2008; Sha et al., 2014]. Therefore, we have reconstructed August sea surface tempera-ture (aSST) and April sea ice concentration (aSIC) at subdecadal temporal resolution based on diatomassemblages from sediment core MD99-2322 from the Kangerlussuaq Trough, SE Greenland shelf in orderto investigate the variability of summer sea surface conditions along with possible forcing factors on theclimatologically sensitive SE Greenland shelf during the last 1130 years (Figure 1). While several climateproxies have already been published from the core, e.g., ice-rafted detritus (IRD), biogenic calcium carbonate,benthic and planktonic foraminiferal assemblages and δ18O, planktonic foraminiferal derived summersubsurface temperatures for the Holocene [Jennings et al., 2011; Andrews and Jennings, 2014], and diatom-derived SST reconstruction for interval 1150–1740 C.E. [Justwan et al., 2009], this is the first effort to quantita-tively reconstruct surface conditions in the area over the two major climate anomalies of the last millenniumwith subdecadal-scale time resolution.
2. Oceanographic Setting
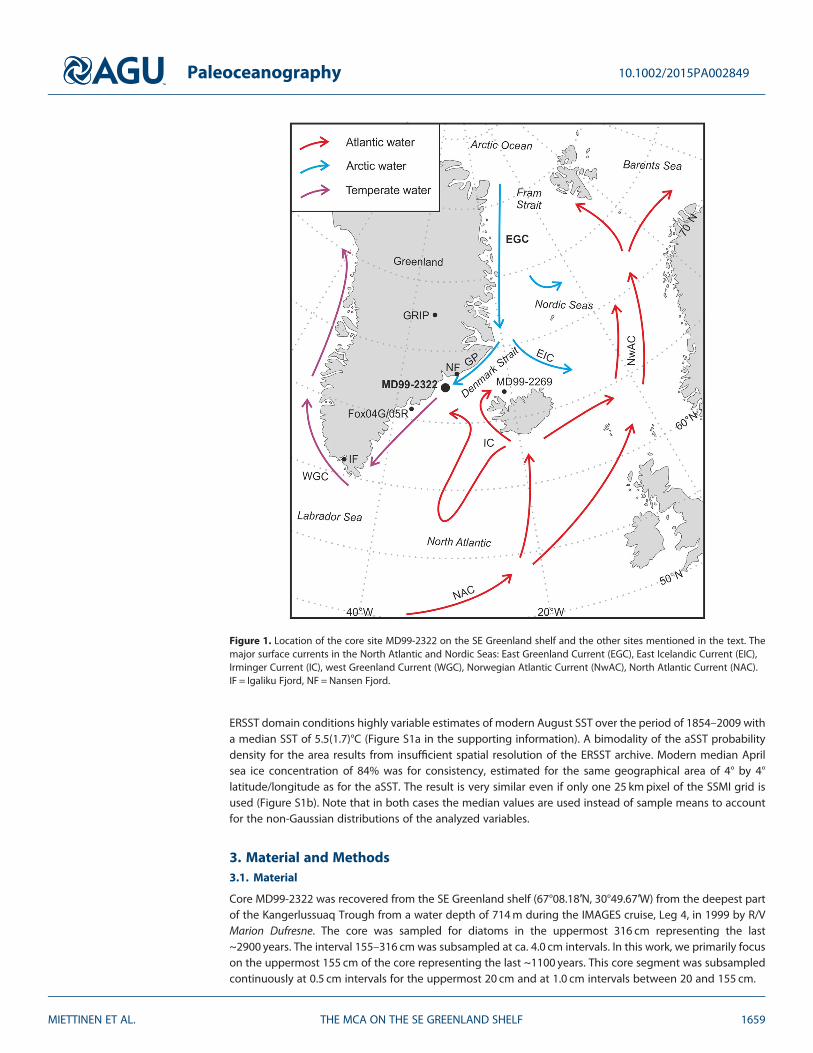
The studied core site in the Kangerlussuaq Trough is located on the SE Greenland shelf, adjacent to DenmarkStrait, and is primarily influenced at the sea surface by the cold East Greenland Current (EGC) (Figure 1). TheEGC is an important link between the Arctic Ocean and the North Atlantic Ocean. It is the major southwardflowing cold surface ocean current in the Greenland Sea and North Atlantic. It transports Arctic Ocean watermasses, recirculating Atlantic Water, and>90% of the ice exported from the Arctic Ocean [Rudels et al., 1999;Woodgate et al., 1999]. The EGC flows southward along the eastern coast of Greenland from Fram Strait toCape Farewell through the Greenland Sea and the Denmark Strait [Woodgate et al., 1999]. Part of the EGCbranches toward the east in the north of Iceland forming the East Iceland Current (EIC). Within theDenmark Strait, the EGC converges with the southwest flowing Irminger Current (IC) forming the marinePolar Front. The IC is the continuation of the western branch of the North Atlantic Current (NAC) and a partof the North Atlantic subpolar gyre. It is composed of warm and saline Atlantic waters from the eastern NorthAtlantic. These Atlantic waters enter the Kangerlussuaq Trough as Irminger Atlantic Water (IAW), an inter-mediate layer between the Polar Water and Atlantic Intermediate Water of the EGC [Jennings andHelgadottir, 1994]. The IAW is a distinctly warmer and more saline water mass than the return AtlanticWater of the EGC [Jennings et al., 2011]. South of Greenland, the waters of the EGC and IC are incorporatedinto the West Greenland Current (WGC) which finally enters the Labrador Sea. Variability in fresh water exportwith WGC has further implications for the strength of deep water formation in the Greenland and LabradorSeas and thus exerts a general influence on climate through the associated changes in the vigor of the AMOC.
Modern climate conditions at the core site were assessed using NOAA’s Extended Reconstruction SST archivefor 1854–2014 (ERSSTv3b) [Smith et al., 2008] and the satellite-based SSM/I sea ice concentrations for1979–2014 [Cavalieri et al., 1996]. Proximity of the oceanographic frontal zone (polar front) associated withlarge spatial temperature gradient together with the site location on the border of the four grid cells in the
Paleoceanography 10.1002/2015PA002849
MIETTINEN ET AL. THE MCA ON THE SE GREENLAND SHELF 1658
ERSST domain conditions highly variable estimates of modern August SST over the period of 1854–2009 witha median SST of 5.5(1.7)°C (Figure S1a in the supporting information). A bimodality of the aSST probabilitydensity for the area results from insufficient spatial resolution of the ERSST archive. Modern median Aprilsea ice concentration of 84% was for consistency, estimated for the same geographical area of 4° by 4°latitude/longitude as for the aSST. The result is very similar even if only one 25 kmpixel of the SSMI grid isused (Figure S1b). Note that in both cases the median values are used instead of sample means to accountfor the non-Gaussian distributions of the analyzed variables.
3. Material and Methods3.1. Material
Core MD99-2322 was recovered from the SE Greenland shelf (67°08.18′N, 30°49.67′W) from the deepest partof the Kangerlussuaq Trough from a water depth of 714m during the IMAGES cruise, Leg 4, in 1999 by R/VMarion Dufresne. The core was sampled for diatoms in the uppermost 316 cm representing the last~2900 years. The interval 155–316 cm was subsampled at ca. 4.0 cm intervals. In this work, we primarily focuson the uppermost 155 cm of the core representing the last ~1100 years. This core segment was subsampledcontinuously at 0.5 cm intervals for the uppermost 20 cm and at 1.0 cm intervals between 20 and 155 cm.
Figure 1. Location of the core site MD99-2322 on the SE Greenland shelf and the other sites mentioned in the text. Themajor surface currents in the North Atlantic and Nordic Seas: East Greenland Current (EGC), East Icelandic Current (EIC),Irminger Current (IC), west Greenland Current (WGC), Norwegian Atlantic Current (NwAC), North Atlantic Current (NAC).IF = Igaliku Fjord, NF = Nansen Fjord.
Paleoceanography 10.1002/2015PA002849
MIETTINEN ET AL. THE MCA ON THE SE GREENLAND SHELF 1659
3.2. Chronology
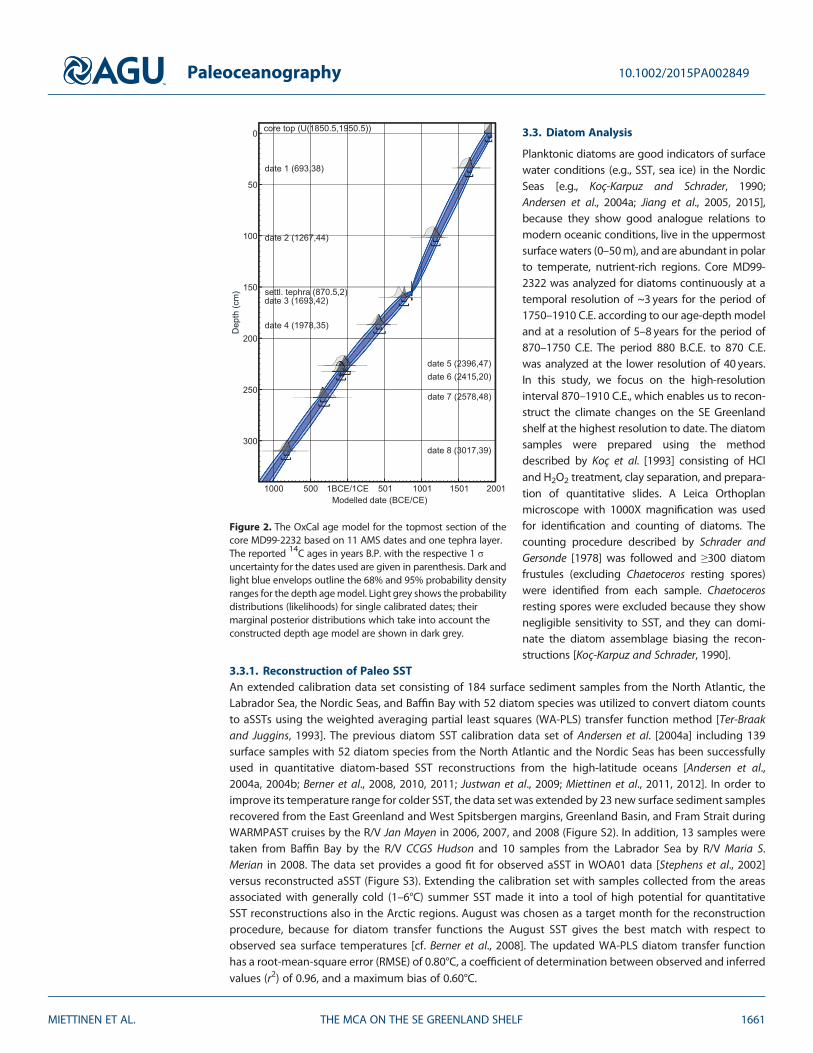
The agemodel for the topmost section of coreMD99-2322 is based on five acceleratormass spectrometry (AMS)14C datings on benthic foraminifers and mollusks [see Stoner et al., 2007; Jennings et al., 2011] (Table 1). Due tocalcification in Atlantic Water, benthic foraminifera and mollusks are suitable for dating on the SE Greenlandshelf as the problems with radiocarbon dating from the deep sea sediments showing very old ages for benthicforaminifera do not appear in this area. The age control was further improved by including seven dates fromcore MD99-2269 retrieved from the north Iceland shelf. These AMS dates comprise a subset of dates fromStoner et al. [2007] used for the construction of the entire 2617 cm long commingled core chronology viasynchronization of the respective paleomagnetic secular variation series for the two sediment cores [Stoneret al., 2007]. Note, however, that here the uppermost date C5734 from 2.5 cm core depth was discarded fromthe analysis as providing unrealistically high sedimentation rate for the most recent 300 years. The age modelis supplemented by a tephra layer at 154.5 cm core depth associated with a Vatnaöldur eruption (Settlementtephra) and dated to 871±2 C.E. [Jennings et al., 2014].
We applied the OxCal 4.2 [Bronk Ramsey, 2008, 2009] software for raw AMS dates calibration using the radiocar-bon calibration curve IntCal13 [Reimer et al., 2013] and calculation of the age-depth model. A marine reservoircorrection of 400 years was assumed for coreMD99-2322. The agemodel provides a goodmatch in age betweenthe known age settlement tephra and the neighboring AMS date. OxCal was initiated with a Poisson processdeposition model [Bronk Ramsey, 2008; Bronk Ramsey and Lee, 2013] with k parameter of the model set tok=1, to allow for fluctuations in the sedimentation rate at a characteristic scale of 1 cm and the core top ageset to U(1850,1950) corresponding to any arbitrary date within the interval of 1850–1950 C.E. The age distribu-tions for points between the dated horizons were also generated with a regular depth interval of 0.5 cm.
Previous studies from a nearby area north of Iceland affected by polar water indicate that reservoir ages ofthese waters can be even up to 450 years older than the standard model ocean [Eiríksson et al., 2004,2011]. The dated foraminifera and mollusks of this study have been calcified in well-equilibrated AtlanticWater that originates from the NAC. Since they have not dwelled in the “old” polar water, we did not intro-duce any additional reservoir correction, i.e., set ΔR= 0. We however admit that a higher and variable ΔRmight have occurred through time also in our data. Since this cannot be inferred explicitly from the availabledata, a common reservoir correction of 400 years was used consistently in the MD99-2322 age modelthroughout the entire Holocene section of the core [Jennings et al., 2006; Stoner et al., 2007]. The use of thismarine reservoir correction is further supported by three tephra layers: 12,000 year old Vedde Ash, the 10,200year old early Holocene Saksunarvatn tephra [Grönvold et al., 1995; Jennings et al., 2002], and the Settlementtephra (871 ± 2 C.E.) [Jennings et al., 2014]. We note, however, that the regional variability of ΔR is large. Forexample, a larger ΔR was used in the northern Denmark Strait [Jennings et al., 2002, 2006] to account for astronger influence of Polar Water in the area.
The resulting age model for the core MD99-2232 features a smooth almost linear sedimentation throughoutthe last 3800 years with an average sedimentation rate for this period of ~0.1 cmyr�1 (Figure 2).
Table 1. Accelerator Mass Spectrometer Radiocarbon Measurements, Tephra, and Calibrated Calendar Dates for Core MD99-2232, Including Depth-CorrelatedDates From Core MD99-2269
Depth(cm)
CoreID
RadiocarbonLaboratory Number
MaterialDated
14C Age(year B.P.)
Med. Calibr. Date(year A.D.)
Sigma(years)
Modeled 95% CI(A.D. from)
Modeled 95% CI(A.D. to)
0 (top) 2322 1917 26 1863 195134 2322 AA40050 Colus turgidulus 693 ± 38 1649 25 1591 1693101.5 2322 AA49380 Mixed forams 1267 ± 44 1191 29 1132 1251154.5 2322 Settlement tephra 870 2 865 874160 2269 AA47785 Macoma sp. 1693 ± 42 765 29 701 825187 2269 AA57895 cf. Yoldia glacialis 1978 ± 35 427 37 356 511227 2269 AA54590 cf. Macoma balthica 2396 ± 47 �30 33 �96 36232.5 2322 CURL-15479 Mixed benthic forams 2415 ± 20 �85 30 �148 �29258 2269 AA38586 Yoldia cf. myalis 2578 ± 48 �326 36 �389 �247310 2269 AA57896 Yoldia sp. 3017 ± 39 �828 33 �898 �772360 2269 AA54592 Mixed benthic forams 3375 ± 80 �1303 41 �1380 �1219368 2322 AA49382 bivalve 3451 ± 39 �1380 39 �1451 �1296415 2269 AA57897b Arca glacialis 3840 ± 33 �1822 48 �1917 �1732
Paleoceanography 10.1002/2015PA002849
MIETTINEN ET AL. THE MCA ON THE SE GREENLAND SHELF 1660
3.3. Diatom Analysis
Planktonic diatoms are good indicators of surfacewater conditions (e.g., SST, sea ice) in the NordicSeas [e.g., Koç-Karpuz and Schrader, 1990;Andersen et al., 2004a; Jiang et al., 2005, 2015],because they show good analogue relations tomodern oceanic conditions, live in the uppermostsurface waters (0–50m), and are abundant in polarto temperate, nutrient-rich regions. Core MD99-2322 was analyzed for diatoms continuously at atemporal resolution of ~3 years for the period of1750–1910 C.E. according to our age-depth modeland at a resolution of 5–8 years for the period of870–1750 C.E. The period 880 B.C.E. to 870 C.E.was analyzed at the lower resolution of 40 years.In this study, we focus on the high-resolutioninterval 870–1910 C.E., which enables us to recon-struct the climate changes on the SE Greenlandshelf at the highest resolution to date. The diatomsamples were prepared using the methoddescribed by Koç et al. [1993] consisting of HCland H2O2 treatment, clay separation, and prepara-tion of quantitative slides. A Leica Orthoplanmicroscope with 1000X magnification was usedfor identification and counting of diatoms. Thecounting procedure described by Schrader andGersonde [1978] was followed and ≥300 diatomfrustules (excluding Chaetoceros resting spores)were identified from each sample. Chaetocerosresting spores were excluded because they shownegligible sensitivity to SST, and they can domi-nate the diatom assemblage biasing the recon-structions [Koç-Karpuz and Schrader, 1990].
3.3.1. Reconstruction of Paleo SSTAn extended calibration data set consisting of 184 surface sediment samples from the North Atlantic, theLabrador Sea, the Nordic Seas, and Baffin Bay with 52 diatom species was utilized to convert diatom countsto aSSTs using the weighted averaging partial least squares (WA-PLS) transfer function method [Ter-Braakand Juggins, 1993]. The previous diatom SST calibration data set of Andersen et al. [2004a] including 139surface samples with 52 diatom species from the North Atlantic and the Nordic Seas has been successfullyused in quantitative diatom-based SST reconstructions from the high-latitude oceans [Andersen et al.,2004a, 2004b; Berner et al., 2008, 2010, 2011; Justwan et al., 2009; Miettinen et al., 2011, 2012]. In order toimprove its temperature range for colder SST, the data set was extended by 23 new surface sediment samplesrecovered from the East Greenland and West Spitsbergen margins, Greenland Basin, and Fram Strait duringWARMPAST cruises by the R/V Jan Mayen in 2006, 2007, and 2008 (Figure S2). In addition, 13 samples weretaken from Baffin Bay by the R/V CCGS Hudson and 10 samples from the Labrador Sea by R/V Maria S.Merian in 2008. The data set provides a good fit for observed aSST in WOA01 data [Stephens et al., 2002]versus reconstructed aSST (Figure S3). Extending the calibration set with samples collected from the areasassociated with generally cold (1–6°C) summer SST made it into a tool of high potential for quantitativeSST reconstructions also in the Arctic regions. August was chosen as a target month for the reconstructionprocedure, because for diatom transfer functions the August SST gives the best match with respect toobserved sea surface temperatures [cf. Berner et al., 2008]. The updated WA-PLS diatom transfer functionhas a root-mean-square error (RMSE) of 0.80°C, a coefficient of determination between observed and inferredvalues (r2) of 0.96, and a maximum bias of 0.60°C.
Figure 2. The OxCal age model for the topmost section of thecore MD99-2232 based on 11 AMS dates and one tephra layer.The reported 14C ages in years B.P. with the respective 1 σuncertainty for the dates used are given in parenthesis. Dark andlight blue envelops outline the 68% and 95% probability densityranges for the depth agemodel. Light grey shows the probabilitydistributions (likelihoods) for single calibrated dates; theirmarginal posterior distributions which take into account theconstructed depth age model are shown in dark grey.
Paleoceanography 10.1002/2015PA002849
MIETTINEN ET AL. THE MCA ON THE SE GREENLAND SHELF 1661
3.3.2. Reconstruction of Paleo Sea Ice ConditionsA subset of the main calibration set comprising 89 surface sediment samples from the northern NorthAtlantic, the Nordic Seas, Baffin Bay, and northwestern Labrador Sea was created for a quantitativereconstruction of April sea ice concentrations in the study area. For calibration we used modern satellite-based sea ice concentrations from the sampling locations and the WA-PLS transfer function method. In total,19 surface sediment samples were selected from the East Greenland and West Spitsbergen margins,Greenland Basin, and Fram Strait, 13 samples from Baffin Bay, and 8 samples from the Labrador Sea(Figure S4). The remaining 49 samples from the Nordic Seas were adopted from the data set published earlierby Andersen et al. [2004a]. Some of these samples were also used by Justwan and Koç, [2008] in their sea icetransfer function built using a different modern sea ice training data set (based on surface samples takenprior to 2004 and May sea ice concentration from 1998 as a modern environmental variable) and a differentreconstruction technique (maximum likelihood). In our data set, modernmonthly sea ice concentrations from1979 to 2012 were obtained from the National Snow and Ice Data Center (NSIDC, www.nsidc.com) [Cavalieriet al., 1996]. Compilations of monthly sea ice data were made for interval 1979–1999 for the sites in the dataset of Andersen et al. [2004a], for intervals of 1979–2006, 1979–2007, and 1979–2008 for the surface samplestaken in 2006, 2007, and 2008, respectively. A five-component WA-PLS model was selected for the transferfunction. The novel WA-PLS diatom sea ice transfer function has a RMSE of 13.1%, r2 of 0.86, and a maximumbias of 13.1% with respect to observed sea ice concentrations. The sea ice data set provides a good fit forobserved April sea ice data versus reconstructed aSIC (Figure S5).
In addition, the occurrence of two sea-ice-related diatom species Fragilariopsis cylindrus and F. oceanica(hereafter Fragilariopsis spp.) was qualitatively used in order to get more information about sea iceconditions. Fragilariopsis spp. are common species in the pack ice and in the water column near the ice edge,especially during Arctic spring blooms, often associated with the onset of melting sea ice [e.g., von Quillfeldt,2001]. They appear to have the strongest loadings in sea-ice-associated assemblages among diatoms in thisregion [e.g., Jiang et al., 2001; Ran et al., 2011].
3.4. Other Statistical Analysis
The wavelet-transform-based technique was applied for the bandpass filtering and visualization of thequasiperiodic behavior in the analyzed data series [Torrence and Compo, 1998]. We used the Morlet waveletas a basis function which is believed to be an optimal choice to provide a good balance between time andfrequency localization for features in wavelet spectra. Prior to analysis, the data series were resampled usingthe time interval of 10 years; the gaps in the resampled series were filled using spline interpolation forcreating a time scale with a regular time increment.
Wavelet coherence analysis [Grinsted et al., 2004] was also used to examine relationships between the pairs ofrecords on different time scales. The method shows how coherent two wavelet spectra being analyzed areand can be thought of as a localized correlation coefficient in time frequency space.
4. Results and Discussion
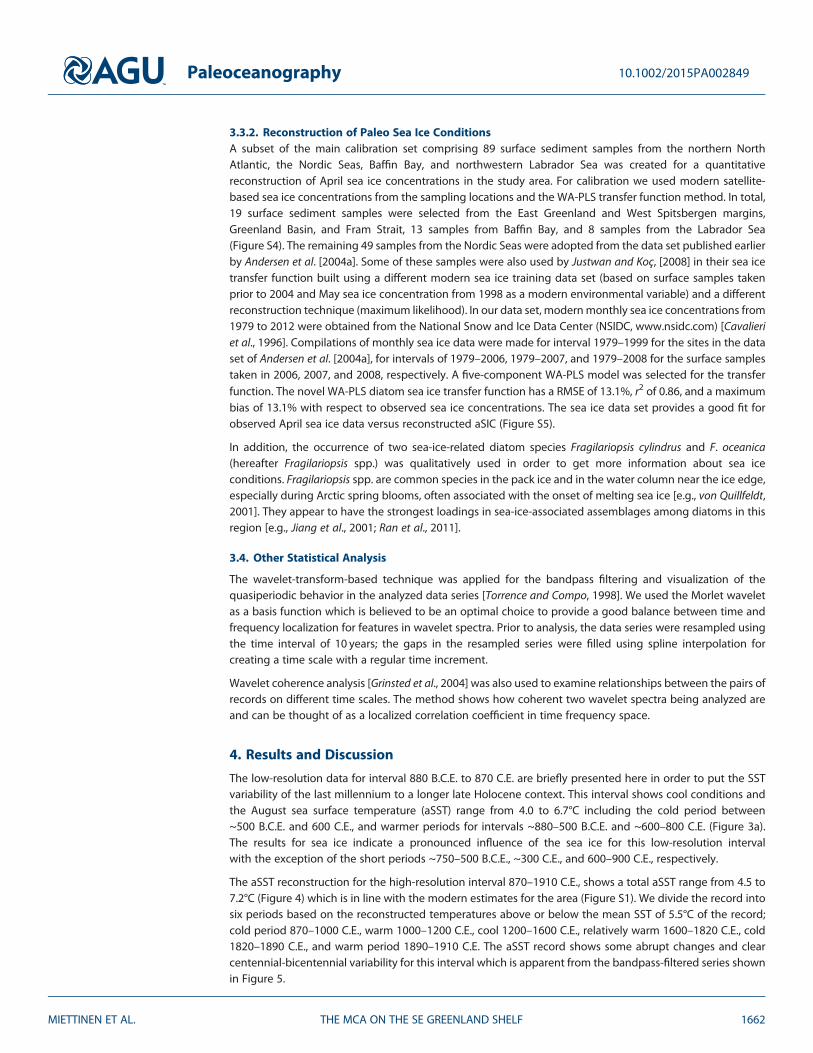
The low-resolution data for interval 880 B.C.E. to 870 C.E. are briefly presented here in order to put the SSTvariability of the last millennium to a longer late Holocene context. This interval shows cool conditions andthe August sea surface temperature (aSST) range from 4.0 to 6.7°C including the cold period between~500 B.C.E. and 600 C.E., and warmer periods for intervals ~880–500 B.C.E. and ~600–800 C.E. (Figure 3a).The results for sea ice indicate a pronounced influence of the sea ice for this low-resolution intervalwith the exception of the short periods ~750–500 B.C.E., ~300 C.E., and 600–900 C.E., respectively.
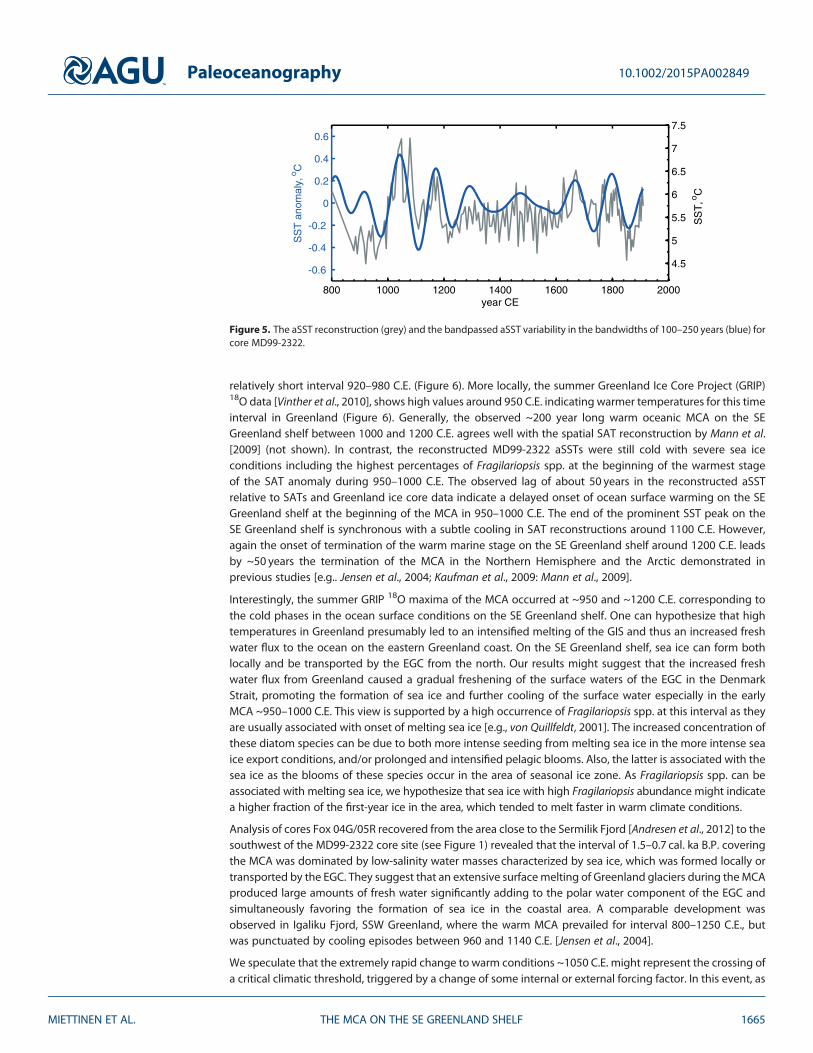
The aSST reconstruction for the high-resolution interval 870–1910 C.E., shows a total aSST range from 4.5 to7.2°C (Figure 4) which is in line with the modern estimates for the area (Figure S1). We divide the record intosix periods based on the reconstructed temperatures above or below the mean SST of 5.5°C of the record;cold period 870–1000 C.E., warm 1000–1200 C.E., cool 1200–1600 C.E., relatively warm 1600–1820 C.E., cold1820–1890 C.E., and warm period 1890–1910 C.E. The aSST record shows some abrupt changes and clearcentennial-bicentennial variability for this interval which is apparent from the bandpass-filtered series shownin Figure 5.
Paleoceanography 10.1002/2015PA002849
MIETTINEN ET AL. THE MCA ON THE SE GREENLAND SHELF 1662
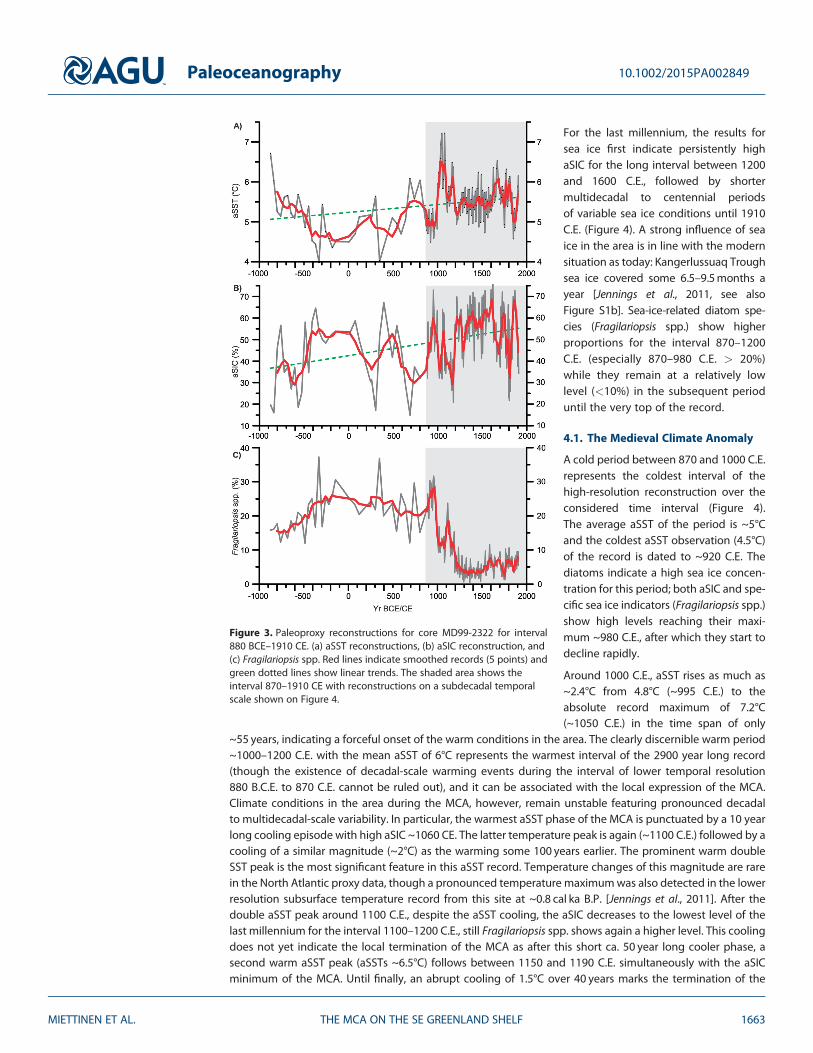
For the last millennium, the results forsea ice first indicate persistently highaSIC for the long interval between 1200and 1600 C.E., followed by shortermultidecadal to centennial periodsof variable sea ice conditions until 1910C.E. (Figure 4). A strong influence of seaice in the area is in line with the modernsituation as today: Kangerlussuaq Troughsea ice covered some 6.5–9.5months ayear [Jennings et al., 2011, see alsoFigure S1b]. Sea-ice-related diatom spe-cies (Fragilariopsis spp.) show higherproportions for the interval 870–1200C.E. (especially 870–980 C.E. > 20%)while they remain at a relatively lowlevel (<10%) in the subsequent perioduntil the very top of the record.
4.1. The Medieval Climate Anomaly
A cold period between 870 and 1000 C.E.represents the coldest interval of thehigh-resolution reconstruction over theconsidered time interval (Figure 4).The average aSST of the period is ~5°Cand the coldest aSST observation (4.5°C)of the record is dated to ~920 C.E. Thediatoms indicate a high sea ice concen-tration for this period; both aSIC and spe-cific sea ice indicators (Fragilariopsis spp.)show high levels reaching their maxi-mum ~980 C.E., after which they start todecline rapidly.
Around 1000 C.E., aSST rises as much as~2.4°C from 4.8°C (~995 C.E.) to theabsolute record maximum of 7.2°C(~1050 C.E.) in the time span of only
~55 years, indicating a forceful onset of the warm conditions in the area. The clearly discernible warm period~1000–1200 C.E. with the mean aSST of 6°C represents the warmest interval of the 2900 year long record(though the existence of decadal-scale warming events during the interval of lower temporal resolution880 B.C.E. to 870 C.E. cannot be ruled out), and it can be associated with the local expression of the MCA.Climate conditions in the area during the MCA, however, remain unstable featuring pronounced decadalto multidecadal-scale variability. In particular, the warmest aSST phase of the MCA is punctuated by a 10 yearlong cooling episode with high aSIC ~1060 CE. The latter temperature peak is again (~1100 C.E.) followed by acooling of a similar magnitude (~2°C) as the warming some 100 years earlier. The prominent warm doubleSST peak is the most significant feature in this aSST record. Temperature changes of this magnitude are rarein the North Atlantic proxy data, though a pronounced temperature maximumwas also detected in the lowerresolution subsurface temperature record from this site at ~0.8 cal ka B.P. [Jennings et al., 2011]. After thedouble aSST peak around 1100 C.E., despite the aSST cooling, the aSIC decreases to the lowest level of thelast millennium for the interval 1100–1200 C.E., still Fragilariopsis spp. shows again a higher level. This coolingdoes not yet indicate the local termination of the MCA as after this short ca. 50 year long cooler phase, asecond warm aSST peak (aSSTs ~6.5°C) follows between 1150 and 1190 C.E. simultaneously with the aSICminimum of the MCA. Until finally, an abrupt cooling of 1.5°C over 40 years marks the termination of the
Figure 3. Paleoproxy reconstructions for core MD99-2322 for interval880 BCE–1910 CE. (a) aSST reconstructions, (b) aSIC reconstruction, and(c) Fragilariopsis spp. Red lines indicate smoothed records (5 points) andgreen dotted lines show linear trends. The shaded area shows theinterval 870–1910 CE with reconstructions on a subdecadal temporalscale shown on Figure 4.
Paleoceanography 10.1002/2015PA002849
MIETTINEN ET AL. THE MCA ON THE SE GREENLAND SHELF 1663
warm MCA around 1200 C.E. At the same time, the aSIC rises rapidly to a high level. Fragilariopsis spp. donot follow the robust rise of the aSIC. Instead, they show a rapid decline in parallel with the terminationof the warm period and remain at a considerably lower level than was seen during the MCA until theend of record.
Based on the Northern Hemisphere spatial surface air temperature (SAT) reconstruction, Mann et al. [2009]identify the MCA as a 300 year long interval from 950 to 1250 C.E. with the warmest phase between 950and 1100 C.E. In the Arctic SAT reconstruction [Kaufman et al., 2009], the MCA spans the same interval asthe Northern Hemisphere SAT 950–1250, but the highest Arctic temperatures are reconstructed for the
Figure 4. High-resolution paleoceanographic reconstructions for core MD99-2322 for the interval 870–1910 CE. (a) aSSTreconstruction, (b) aSIC reconstruction, and (c) Fragilariopsis spp. Red lines indicate smoothed records (5 points). Shadedareas show warm periods inferred from the aSST record.
Paleoceanography 10.1002/2015PA002849
MIETTINEN ET AL. THE MCA ON THE SE GREENLAND SHELF 1664
relatively short interval 920–980 C.E. (Figure 6). More locally, the summer Greenland Ice Core Project (GRIP)18O data [Vinther et al., 2010], shows high values around 950 C.E. indicating warmer temperatures for this timeinterval in Greenland (Figure 6). Generally, the observed ~200 year long warm oceanic MCA on the SEGreenland shelf between 1000 and 1200 C.E. agrees well with the spatial SAT reconstruction by Mann et al.[2009] (not shown). In contrast, the reconstructed MD99-2322 aSSTs were still cold with severe sea iceconditions including the highest percentages of Fragilariopsis spp. at the beginning of the warmest stageof the SAT anomaly during 950–1000 C.E. The observed lag of about 50 years in the reconstructed aSSTrelative to SATs and Greenland ice core data indicate a delayed onset of ocean surface warming on the SEGreenland shelf at the beginning of the MCA in 950–1000 C.E. The end of the prominent SST peak on theSE Greenland shelf is synchronous with a subtle cooling in SAT reconstructions around 1100 C.E. However,again the onset of termination of the warm marine stage on the SE Greenland shelf around 1200 C.E. leadsby ~50 years the termination of the MCA in the Northern Hemisphere and the Arctic demonstrated inprevious studies [e.g.. Jensen et al., 2004; Kaufman et al., 2009: Mann et al., 2009].
Interestingly, the summer GRIP 18O maxima of the MCA occurred at ~950 and ~1200 C.E. corresponding tothe cold phases in the ocean surface conditions on the SE Greenland shelf. One can hypothesize that hightemperatures in Greenland presumably led to an intensified melting of the GIS and thus an increased freshwater flux to the ocean on the eastern Greenland coast. On the SE Greenland shelf, sea ice can form bothlocally and be transported by the EGC from the north. Our results might suggest that the increased freshwater flux from Greenland caused a gradual freshening of the surface waters of the EGC in the DenmarkStrait, promoting the formation of sea ice and further cooling of the surface water especially in the earlyMCA ~950–1000 C.E. This view is supported by a high occurrence of Fragilariopsis spp. at this interval as theyare usually associated with onset of melting sea ice [e.g., von Quillfeldt, 2001]. The increased concentration ofthese diatom species can be due to both more intense seeding from melting sea ice in the more intense seaice export conditions, and/or prolonged and intensified pelagic blooms. Also, the latter is associated with thesea ice as the blooms of these species occur in the area of seasonal ice zone. As Fragilariopsis spp. can beassociated with melting sea ice, we hypothesize that sea ice with high Fragilariopsis abundance might indicatea higher fraction of the first-year ice in the area, which tended to melt faster in warm climate conditions.
Analysis of cores Fox 04G/05R recovered from the area close to the Sermilik Fjord [Andresen et al., 2012] to thesouthwest of the MD99-2322 core site (see Figure 1) revealed that the interval of 1.5–0.7 cal. ka B.P. coveringthe MCA was dominated by low-salinity water masses characterized by sea ice, which was formed locally ortransported by the EGC. They suggest that an extensive surfacemelting of Greenland glaciers during theMCAproduced large amounts of fresh water significantly adding to the polar water component of the EGC andsimultaneously favoring the formation of sea ice in the coastal area. A comparable development wasobserved in Igaliku Fjord, SSW Greenland, where the warm MCA prevailed for interval 800–1250 C.E., butwas punctuated by cooling episodes between 960 and 1140 C.E. [Jensen et al., 2004].
We speculate that the extremely rapid change to warm conditions ~1050 C.E. might represent the crossing ofa critical climatic threshold, triggered by a change of some internal or external forcing factor. In this event, as
Figure 5. The aSST reconstruction (grey) and the bandpassed aSST variability in the bandwidths of 100–250 years (blue) forcore MD99-2322.
Paleoceanography 10.1002/2015PA002849
MIETTINEN ET AL. THE MCA ON THE SE GREENLAND SHELF 1665
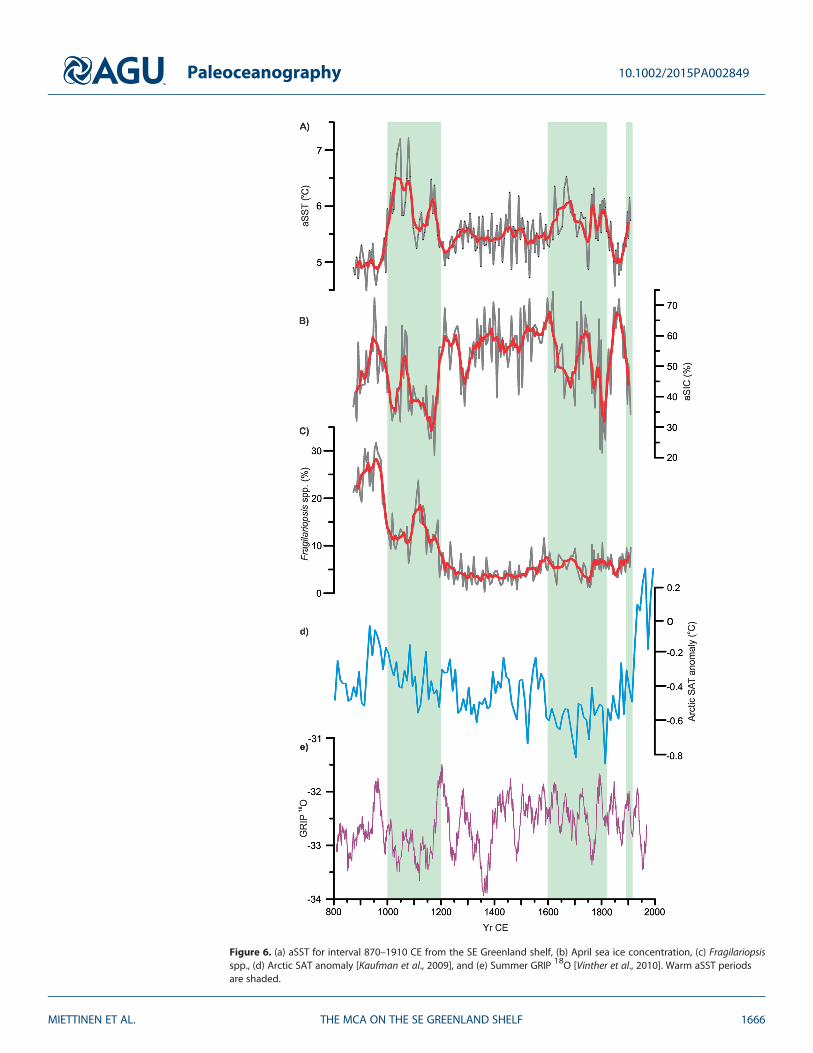
Figure 6. (a) aSST for interval 870–1910 CE from the SE Greenland shelf, (b) April sea ice concentration, (c) Fragilariopsisspp., (d) Arctic SAT anomaly [Kaufman et al., 2009], and (e) Summer GRIP 18O [Vinther et al., 2010]. Warm aSST periodsare shaded.
Paleoceanography 10.1002/2015PA002849
MIETTINEN ET AL. THE MCA ON THE SE GREENLAND SHELF 1666
the amount of melting sea ice decreased on the SE Greenland shelf after the most prominent SAT peakaround 1000 C.E., the oceanic factor (i.e., the warmer EGC) was finally able to overcome the sea ice influenceand initiated a rapid warming of surface water.
Historically, the MCA represents the well-known period of human expansion in the North Atlantic sector;Norse colonized the North Atlantic islands and eastern North America from 800 to 1000 C.E., Iceland wassettled ~874 C.E., and Greenland ~985 C.E. [Arneborg, 2000]. Interestingly, the Norse settled areas in theSouthern and Western Greenland but not areas in the SE Greenland though it is located closer to Iceland.We speculate that this has been due to the sea ice conditions in the area. A pronounced variation in seaice conditions inferred from MD99-2322 during the onset and termination of MCA agrees well withhistorical evidence from Iceland, specifically a timing of maxima/minima of annual temperatures estimatedfrom the occurrence of drift ice in the area [Bergthorsson, 1969]. A few centuries later, around 1350–1400C.E., the Norse left southern Greenland [Pringle, 1997]. According to Kuijpers et al. [2014], this was due tothe colder climate and increased sea ice in the Southern and Western Greenland since ~1200 C.E. Hence,our results on the transition to the cooler conditions on the SE Greenland shelf correspond well with thedepopulation of Greenland.
4.2. The Little Ice Age
A shift to persistently colder conditions ~1200 C.E. when aSST dropped rapidly almost to the temperaturelevel that prevailed before the MCA signifies a transition to the cold LIA on the SE Greenland shelf. For theperiod 1200–1600 C.E., aSST points to cool (the mean aSST ~5.4°C) and variable conditions with decadal-scalevariability of relatively high magnitude associated with the LIA. The interval 1200–1260 C.E. initiating the LIAis the second coldest one (with a mean of 5.2°C) over the entire cool climate anomaly indicating a substantialchange in ocean surface conditions on the SE Greenland shelf at the transition stage to the LIA. However,aSSTs do not generally decrease to the level that prevailed prior to the MCA. The cool period 1200–1600 ispunctuated by two short-term warm phases around 1300 C.E. and ~1440–1510 C.E. After the end of the firstwarm phase ~1300 C.E., the record shows (sub)decadal variability until 1600 C.E. The second warmer phase(maximum aSST > 6°C) between ~1440 and 1510 C.E. features a pronounced (sub)decadal aSST variabilitywith magnitude exceeding 1°C. At the same time the aSIC indicates a relatively high (sub)decadal variabilityand increasing sea ice conditions toward the end of the cool period ~1600 C.E. excluding the warmer periodsshown by aSST (e.g., ~1300 C.E.). A relatively high climate variability at the shorter time scales in the first partof the LIA was also recorded in the historical Icelandic sources via a more frequent occurrence of both severeand mild seasons in the area [Ogilvie et al., 2000], although a consistency of this relationship throughout thewhole period is not apparent.
The time interval of 1600–1820 C.E. was relatively warm with aSST being at the same level as the latter half ofthe MCA with several superimposed peaks on the decadal to multidecadal time scale. The period is charac-terized by a high-temperature variability as aSST varies between 4.9°C (~1750 C.E.) and 6.5°C (1670 C.E.). TheaSIC shows that sea ice conditions were less severe during this period, except for a short period between1700 and 1750 C.E. Although also this interval is commonly associated with the LIA between 1400 and1900 C.E. [e.g., Grove, 1988; Kaufman et al., 2009], several studies indicate warmer conditions for this interval,e.g., warmer spell 1700–1800 C.E. [Mann et al., 2009; Zorita et al., 2010]. However, this warm phase on the SEGreenland shelf does not indicate the lasting shift to the warm conditions as the following interval from1820–1890 C.E. was the second coldest of the last millennium with the mean 5.2°C. The coldest aSSTs ofthe LIA prevailed at the end of this cold anomaly, between 1840 and 1880 C.E. with the coldest aSST value(~4.6°C ~1850 C.E.) since 920 C.E. Also, the aSIC attains its highest levels throughout the late Holocene record~1850 C.E. The record ends on rapidly rising aSST and diminishing of sea ice that can be associated with arecovery from the LIA and the onset of contemporary warming that commenced in the beginning of thetwentieth century. During this Warm period ~1890–1910 C.E., the aSST reaches 6.2°C, with an average of5.8°C for the period.
From the historical perspective, relatively mild sea ice conditions during the extended periods in the 1600sand 1700s are much in line with a lack of sea ice observations around Iceland as was recorded in variouswritten accounts of that period [Ogilvie, 1996]. A sea ice maximum during interval 1850–1890 C.E. followedby a strongly diminished sea ice is in agreement with Divine and Dick [2006] and Alonso-García et al.,[2013], who suggest predominantly perennial sea ice conditions for the SE Greenland shelf between
Paleoceanography 10.1002/2015PA002849
MIETTINEN ET AL. THE MCA ON THE SE GREENLAND SHELF 1667
1850 and 1910 C.E., followed by more open water conditions. The high sea ice period is a manifestationof the salinity anomaly (GSA) of the early twentieth century, because there was a clearly registeredincreased fresh water export from the Arctic at this time [Divine and Dick, 2006]. Its magnitude was similarto (if not higher than) the GSA of the 1960s and the 1970s [Belkin et al., 1998]. The origin of these GSAshas been thought to be the increased outflow of sea ice and freshwater from the Arctic that propagatedownstream through the anticlockwise circulation system around the North Atlantic [Dickson et al.,1988; Belkin, 2004].
4.3. Forcing Factors Behind the Surface Conditions on the SE Greenland Shelf Over theLast Millennium
The climatological conditions on the SE Greenland shelf are driven by a large number of factors, such as thestrength and temperature of the EGC and IC, sea ice formation, fresh water input via iceberg calving,discharge from the Greenland ice sheet, sea ice export from the Arctic, and variable atmospheric and externalforcing making the area challenging for paleoceanographic studies [e.g., Alonso-García et al., 2013]. Here weassess the possible contribution/influence of the different factors on the reconstructed surface condition inthe study area.4.3.1. Atmospheric ForcingSeveral proxy records indicate that globally the MCA was characterized by coherent shifts in large-scaleNorthern Hemisphere atmospheric circulation patterns [e.g., Graham et al., 2011]. The positive phase of theArctic Oscillation (AO)/North Atlantic Oscillation (NAO) has been proposed to play a strong role in theobserved changes during the MCA [Shindell et al., 2001, 2003; Seidenkrantz et al., 2007; Mann et al., 2009;Trouet et al., 2009; Sicre et al., 2014]. Goosse et al. [2012] found significant changes in the oceanic near-surfacecirculation between the MCA and the LIA, e.g., a clear intensification and the northward shift of the subpolargyre and the Gulf Stream system occurred during the MCA. They also suggested that only a weak forcing wasneeded to trigger the shift from the MCA to the LIA, with changes in the AMOC playing a relatively minor rolein the transition between these two climate anomalies.
Over the last millennium, it is believed that the NAO system has been variable, with a strongly positive NAOmode during the MCA and a neutral to slightly negative mode during the LIA [Trouet et al., 2009]. The positivemode is associated with the increased sea ice export in the East Greenland Current through Fram Strait [e.g.,Dickson et al., 2000; Wanner et al., 2001; Olsen et al., 2012; Andrews and Jennings, 2014; Sicre et al., 2014]. Theatmospheric forcing might at least partly explain the observed combination of the aSST and the aSIC on theSE Greenland shelf, as under the influence of northerly winds, the cold polar waters and sea ice advancesouthward freshening the surface water layer, increasing its stratification, and favoring the local sea iceformation [Justwan et al., 2009]. As the increased sea ice export by the +NAO is usually associated withstronger northerly winds and cooling of the surface waters in the Greenland Sea, it is remarkable that thewarm aSST period of 1000–1200 C.E. on the SE Greenland shelf partly coincides with the positive NAO mode.However, it is noteworthy that the double-peaked aSST event ends ~1090, i.e., at the same time when theNAO reaches the high positive phase. Thus, the NAO might be behind the cooling of surface waters on theSE Greenland shelf after 1100 C.E.4.3.2. Ocean CirculationThe range of aSST variability between the aSST maxima of the MCA and the coldest aSST registered duringthe LIA is considerably high, ~2.7°C. Yet the corresponding difference between the longer-term averagesfor the two periods is relatively low, ~0.5°C, indicating a relatively mild summer climate during the LIA inthe area. The latter can be clearly seen in a longer ~2900 year long context; the LIA cannot be qualified asan exceptionally cold period on the SE Greenland shelf. The ~1100 year long period (500 B.C.E. to 600 C.E.)preceding the MCA was considerably colder than the LIA in the area (Figure 3). This might indicate theinfluence of the warm Irminger waters on the SE Greenland shelf during the LIA or some other regional factorbehind the aSST variability. According to Miettinen et al. [2012], the Irminger waters in the south of Icelandwere relatively warm during the LIA due to the intensified subpolar gyre. Also, Andresen et al. [2012] suggestthat the warm LIA conditions farther southwest on the SE Greenland shelf were caused by the intensified IC,most likely related to the subpolar gyre variability. A hypothesis of abrupt intensification of the SPG at theMCA/LIA transition in response to intensified volcanic forcing was recently supported by modeling resultsof Schleussner et al. [2015].
Paleoceanography 10.1002/2015PA002849
MIETTINEN ET AL. THE MCA ON THE SE GREENLAND SHELF 1668
4.3.3. Linkages of the Sea Ice Export and Formation and Fresh Water DischargeFor the last millennium, the results for sea ice indicate the highest reconstructed aSIC for the LIA, i.e., for thelong interval between 1200 and 1600 C.E. and for shorter multidecadal periods around 1750 and 1850 C.E.This high-LIA sea ice concentration is a dominant feature also in the longer 2900 year long context. This issurprising in the context of a generally higher aSST during the LIA than the time prior to MCA. This inconsis-tency might be linked to a different source or/andmechanism for the sea ice formation in the area during theLIA and the time before that anomaly. A high aSIC might be due to the combination of the subpolar gyrevariability (which was supposed to be behind the warm aSST) and the intensified EGC polar water transportduring the LIA as suggested by Andresen et al. [2012]. Near the Greenland coast, this combination wouldresult in stronger stratification favoring sea ice formation as opposed to previous colder aSST periods.
Large variations in the polar planktonic foraminifera Neogloboquadrina pachyderma sinistral δ18O in coreMD99-2322 after 6 cal ka B.P. suggest inconsistent temperature and salinity conditions at the pycnocline[Jennings et al., 2011]. This may reflect a local freshening of the upper water column by themixing of IAWwithPolar Water in the Kangerlussuaq Trough or with an overall increase in Polar Water as δ18O values of benthicforaminifera show cooling trend for this interval, indicating a progressively increased water column stratifica-tion through the Neoglacial interval.
Sea ice diatom species Fragilariopsis spp. show higher abundance for the interval 880 B.C.E. to 1200 C.E., i.e.,before and during the MCA, whereas its abundance dramatically decreases with the onset of the LIA and neverrecovers. This observation might indicate a higher fraction of first-year ice (with faster melting rate) during theMCA, whereas the very low abundance of Fragilariopsis spp. during the LIA indicates a clearly lower melting rateassociated with preferentially thicker multiyear sea ice. This hypothesis is supported by IRD data from the core[Andrews and Jennings, 2014]. The quartz wt % reaches its maximum ~1200 C.E. and has a distinct low duringthe LIA. This may indicate that the IRD export of sediment from the quartz-rich areas of East Greenland(Figure 1) was restricted either by pervasive landfast sea ice [Reeh et al., 2001; Andrews and Jennings, 2014] orthat the increased sea ice in the EGC originated from the Arctic Ocean during the LIA [Andresen et al., 2012].
The proposed hypothesis linking GIS, aSIC, and aSST in the area might be appropriate also for the 1200 yearlong interval preceding the MCA showing cool aSST and fairly severe aSIC conditions for the interval between500 B.C.E. and 600 C.E. although temperatures were relatively high in Greenland at this time [Kobashi et al.,2011]. High and intense local ice production was behind the cool surface conditions on the SE Greenlandshelf also at this time. This could explain the late Holocene warming trend on the SE Greenland shelf whichis an opposite pattern compared with the regular cooling trend of the Atlantic SST pattern that started at thetermination of the Holocene thermal optimum around 6000 years ago [e.g., Andersen et al., 2004a].
We cannot rule out the possibility that the warming of the area is due to the overall warming of the northernsubpolar Atlantic [Berner et al., 2008; Miettinen et al., 2012; Schleussner et al., 2015] associated with long-termlate Holocene changes of the subpolar gyre extent and strength. Yet with the data available at hand, assess-ment of the relative roles of the freshwater flux from the north and the Irminger waters in the variability ofsurface conditions on the SE Greenland shelf at different time scales remains difficult.4.3.4. External ForcingBoth solar variability and volcanism have been considered the primary external forcing factors behind the LIAcooling [e.g., Crowley, 2000; Shindell et al., 2003; Jiang et al., 2005, 2015; Miller et al., 2012; Schleussner et al.,2015] though their relative roles are still under discussion [e.g., Hegerl et al., 2003; Otterå et al., 2010:Moffa-Sánchez et al., 2014]. Shindell et al. [2003] suggest that the global mean LIA signal can be attributedto both volcanic and solar forcing, but while volcanic forcing may have played a major role in global-scalecooling, the much larger regional changes and probable changes in the frequency of extreme cold eventswere likely driven primarily by solar variability. Hegerl et al. [2003] indicate that volcanism is substantiallymore important explaining 40% of the decadal-scale variability during the LIA. However, our aSST data donot demonstrate any apparent agreement with known volcanic eruptions.
The aSST and the aSIC reconstructions for core MD99-2322 have been compared to total solar irradiance (TSI)[Steinhilber et al., 2012] and to the known solar maximum and minima of the last millennium; the Oort mini-mum (1010–1050 C.E.), the Medieval solar maximum (1075–1240 C.E.), the Wolf minimum (1280–1350 C.E.),the Spörer minimum (1460–1550 C.E.), the Maunder minimum (1645–1715 C.E.), and the Dalton minimum(1790–1820 C.E.) [Eddy, 1978; Schröder, 2005] (Figure 7).
Paleoceanography 10.1002/2015PA002849
MIETTINEN ET AL. THE MCA ON THE SE GREENLAND SHELF 1669
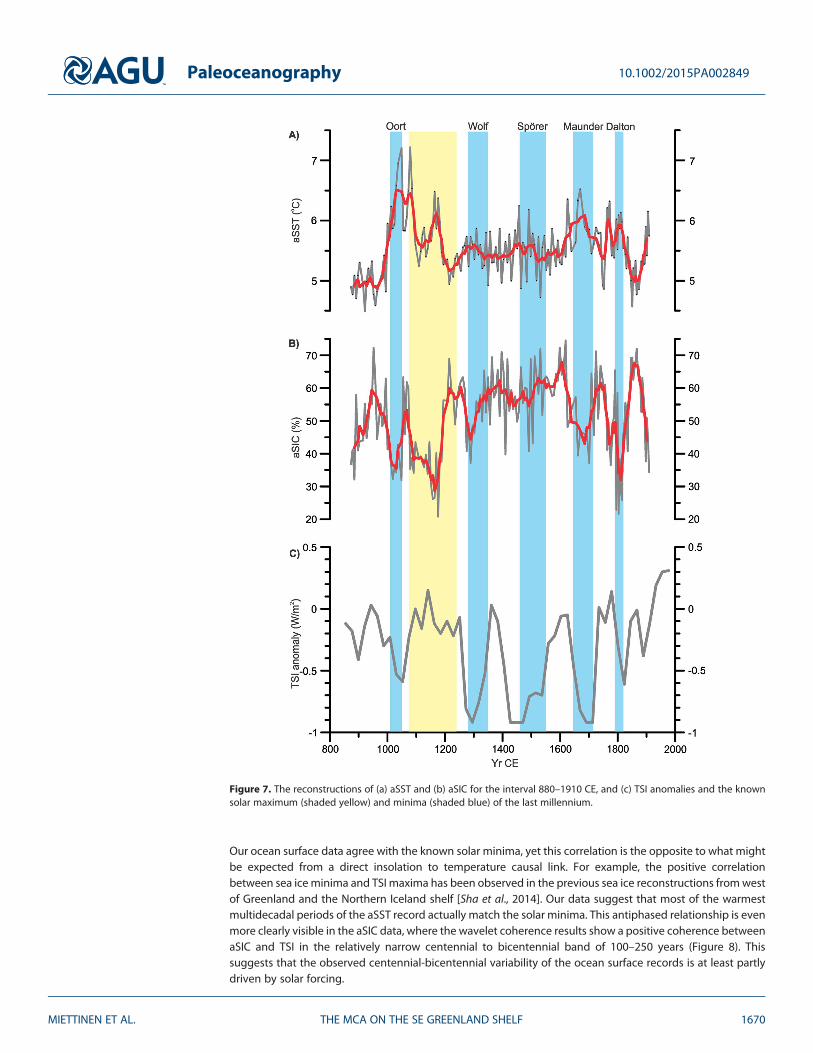
Our ocean surface data agree with the known solar minima, yet this correlation is the opposite to what mightbe expected from a direct insolation to temperature causal link. For example, the positive correlationbetween sea iceminima and TSI maxima has been observed in the previous sea ice reconstructions fromwestof Greenland and the Northern Iceland shelf [Sha et al., 2014]. Our data suggest that most of the warmestmultidecadal periods of the aSST record actually match the solar minima. This antiphased relationship is evenmore clearly visible in the aSIC data, where the wavelet coherence results show a positive coherence betweenaSIC and TSI in the relatively narrow centennial to bicentennial band of 100–250 years (Figure 8). Thissuggests that the observed centennial-bicentennial variability of the ocean surface records is at least partlydriven by solar forcing.
Figure 7. The reconstructions of (a) aSST and (b) aSIC for the interval 880–1910 CE, and (c) TSI anomalies and the knownsolar maximum (shaded yellow) and minima (shaded blue) of the last millennium.
Paleoceanography 10.1002/2015PA002849
MIETTINEN ET AL. THE MCA ON THE SE GREENLAND SHELF 1670
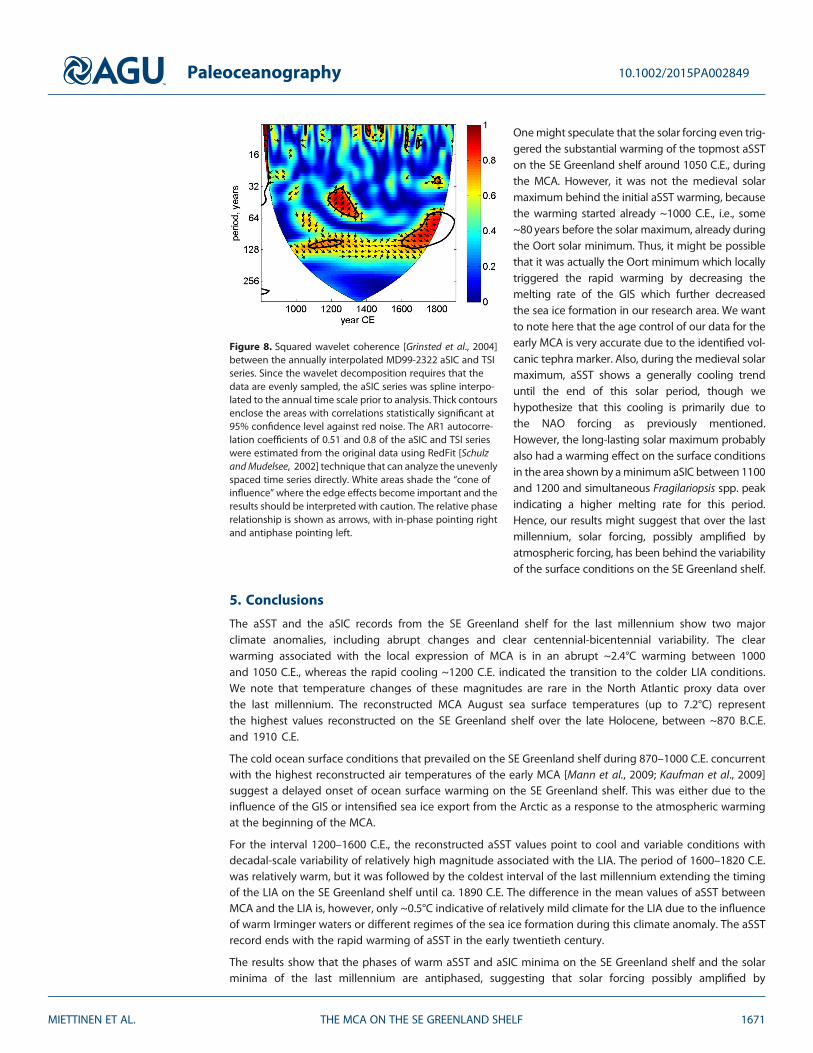
Onemight speculate that the solar forcing even trig-gered the substantial warming of the topmost aSSTon the SE Greenland shelf around 1050 C.E., duringthe MCA. However, it was not the medieval solarmaximum behind the initial aSST warming, becausethe warming started already ~1000 C.E., i.e., some~80years before the solar maximum, already duringthe Oort solar minimum. Thus, it might be possiblethat it was actually the Oort minimum which locallytriggered the rapid warming by decreasing themelting rate of the GIS which further decreasedthe sea ice formation in our research area. We wantto note here that the age control of our data for theearly MCA is very accurate due to the identified vol-canic tephra marker. Also, during the medieval solarmaximum, aSST shows a generally cooling trenduntil the end of this solar period, though wehypothesize that this cooling is primarily due tothe NAO forcing as previously mentioned.However, the long-lasting solar maximum probablyalso had a warming effect on the surface conditionsin the area shown by aminimumaSIC between 1100and 1200 and simultaneous Fragilariopsis spp. peakindicating a higher melting rate for this period.Hence, our results might suggest that over the lastmillennium, solar forcing, possibly amplified byatmospheric forcing, has been behind the variabilityof the surface conditions on the SE Greenland shelf.
5. Conclusions
The aSST and the aSIC records from the SE Greenland shelf for the last millennium show two majorclimate anomalies, including abrupt changes and clear centennial-bicentennial variability. The clearwarming associated with the local expression of MCA is in an abrupt ~2.4°C warming between 1000and 1050 C.E., whereas the rapid cooling ~1200 C.E. indicated the transition to the colder LIA conditions.We note that temperature changes of these magnitudes are rare in the North Atlantic proxy data overthe last millennium. The reconstructed MCA August sea surface temperatures (up to 7.2°C) representthe highest values reconstructed on the SE Greenland shelf over the late Holocene, between ~870 B.C.E.and 1910 C.E.
The cold ocean surface conditions that prevailed on the SE Greenland shelf during 870–1000 C.E. concurrentwith the highest reconstructed air temperatures of the early MCA [Mann et al., 2009; Kaufman et al., 2009]suggest a delayed onset of ocean surface warming on the SE Greenland shelf. This was either due to theinfluence of the GIS or intensified sea ice export from the Arctic as a response to the atmospheric warmingat the beginning of the MCA.
For the interval 1200–1600 C.E., the reconstructed aSST values point to cool and variable conditions withdecadal-scale variability of relatively high magnitude associated with the LIA. The period of 1600–1820 C.E.was relatively warm, but it was followed by the coldest interval of the last millennium extending the timingof the LIA on the SE Greenland shelf until ca. 1890 C.E. The difference in the mean values of aSST betweenMCA and the LIA is, however, only ~0.5°C indicative of relatively mild climate for the LIA due to the influenceof warm Irminger waters or different regimes of the sea ice formation during this climate anomaly. The aSSTrecord ends with the rapid warming of aSST in the early twentieth century.
The results show that the phases of warm aSST and aSIC minima on the SE Greenland shelf and the solarminima of the last millennium are antiphased, suggesting that solar forcing possibly amplified by
Figure 8. Squared wavelet coherence [Grinsted et al., 2004]between the annually interpolated MD99-2322 aSIC and TSIseries. Since the wavelet decomposition requires that thedata are evenly sampled, the aSIC series was spline interpo-lated to the annual time scale prior to analysis. Thick contoursenclose the areas with correlations statistically significant at95% confidence level against red noise. The AR1 autocorre-lation coefficients of 0.51 and 0.8 of the aSIC and TSI serieswere estimated from the original data using RedFit [SchulzandMudelsee, 2002] technique that can analyze the unevenlyspaced time series directly. White areas shade the “cone ofinfluence”where the edge effects become important and theresults should be interpreted with caution. The relative phaserelationship is shown as arrows, with in-phase pointing rightand antiphase pointing left.
Paleoceanography 10.1002/2015PA002849
MIETTINEN ET AL. THE MCA ON THE SE GREENLAND SHELF 1671
atmospheric forcing has been behind the aSST variability on the SE Greenland over the last millennium. Theresults might indicate decreased sea ice formation on the SE Greenland shelf due to diminished freshwaterinput from the GIS during the cold climate periods.
The composition of surface water is climatically an important factor because the exchange of heat betweenthe ocean and atmosphere takes place on the ocean surface. The results show that the SE Greenland shelf is aclimatologically sensitive area where extremely rapid changes are possible. The regional influence of theGreenland ice sheet can be prominent in specific conditions, as seen during the early MCA. Because theseoceanic changes can have a global impact through their potential influence on the AMOC, this highlightsthe importance of Greenland ice sheet and the neighboring ocean with its major surface current, the EastGreenland Current, under the present warming conditions.
ReferencesAlonso-García, M., J. T. Andrews, S. T. Belt, P. Cabedo-Sanz, D. Darby, and J. Jaeger (2013), A comparison between multiproxy and historical
data (AD 1990–1840) of drift ice conditions on the East Greenland Shelf (~66°N), Holocene, 23, 1672–1683.Andersen, C., N. Koç, A. Jennings, and J. T. Andrews (2004a), Nonuniform response to the major surface currents in the Nordic Seas to
insolation forcing: Implications for the Holocene climate variability, Paleoceanography, 19, PA2003, doi:10.1029/2002PA000873.Andersen, C., N. Koç, and M. Moros (2004b), A highly unstable Holocene climate in the subpolar North Atlantic: Evidence from diatoms, Quat.
Sci. Rev., 23, 2155–2166.Andresen, C. S., M. J. Hansen, M.-S. Seidenkrantz, A. E. Jennings, M. D. Knudsen, N. Nørgaard-Pedersen, N. K. Larsen, A. Kuijpers, and C. Pearce
(2012), Mid- to late-Holocene oceanographic variability of the Southeast Greenland shelf, Holocene, 23, 167–178.Andrews, J. T., and A. E. Jennings (2014), Multidecadal to millennial marine climate oscillations across the Denmark Strait (~66°N) over the
last 2000 cal yr BP, Clim. Past, 10, 325–343.Arneborg, J. (2000), Greenland and Europe, in Vikings: The North Atlantic Saga, edited by W. F. Fitzhugh and E. Ward, pp. 304–317,
Smithsonian Inst. Press, London.Belkin, I. M. (2004), Propagation of the “Great Salinity Anomaly” of the 1990s around the North Atlantic, Geophys. Res. Lett., 31, L08306,
doi:10.1029/2003GL019334.Belkin, I. M., S. Levitus, J. Antonov, S.-A. Malmberg, and A. J. Lee (1998), “Great Salinity Anomalies” in the North Atlantic, Prog. Oceanogr., 41,
1–68.Bergthorsson, P. (1969), An estimate of drift ice and temperature in Iceland in 1000 years, Jokull, 19, 94–101.Berner, K. S., N. Koç, D. Divine, F. Godtliebsen, and M. Moros (2008), A decadal-scale Holocene sea surface temperature record from the
subpolar North Atlantic constructed using diatoms and statistics and its relation to other climate parameters, Paleoceanography, 23,PA2210, doi:10.1029/2006PA001339.
Berner, K. S., N. Koç, and F. Godtliebsen (2010), High frequency climate variability of the Norwegian Atlantic Current during the earlyHolocene period and a possible connection to the Gleissberg cycle, Holocene, 20, 245–255.
Berner, K. S., N. Koç, F. Godtliebsen, and D. Divine (2011), Holocene climate variability of the Norwegian Atlantic Current during high and lowsolar insolation forcing, Paleoceanography, 26, PA2220, doi:10.1029/2010PA002002.
Blaschek, M., P. Bakker, and H. Renssen (2015), The influence of Greenland ice sheet melting on the Atlantic meridional overturningcirculation during past and future warm periods: A model study, Clim. Dyn., 44, 2137–2157.
Bronk Ramsey, C. (2008), Deposition models for chronological records, Quat. Sci. Rev., 27, 42–60.Bronk Ramsey, C. (2009), Bayesian analysis of radiocarbon dates, Radiocarbon, 51, 337–360.Bronk Ramsey, C., and S. Lee (2013), Recent and planned developments of the program OxCal, Radiocarbon, 55, 720–730.Cavalieri, D., C. Parkinson, P. Gloersen, and H. J. Zwally (1996), Sea Ice Concentrations from Nimbus-7 SMMR and DMSP SSM/I-SSMIS Passive
Microwave Data, NASA DAAC at the Natl. Snow and Ice Data Cent., Boulder, Colo.Crowley, T. J. (2000), Causes of climate change over the past 1000 years, Science, 289, 270–277.Dickson, R. R., J. Meincke, S.-A. Malmberg, and A. J. Lee (1988), The “Great Salinity Anomaly” in the North Atlantic, 1968–1982, Prog. Oceanogr.,
20, 103–151.Dickson, R. R., T. J. Osborn, J. W. Hurrell, J. Meincke, J. Blindheim, B. Adlandsvik, T. Vinje, G. Alekseev, and W. Maslowski (2000), The Arctic
ocean response to the North Atlantic Oscillation, J. Clim., 13, 2671–2696.Divine, D. V., and D. Dick (2006), Historical variability of sea ice edge position in the Nordic Seas, J. Geophys. Res., 111, C01001, doi:10.1029/
2004JC002851.Eddy, J. A. (1978), The maunder minimum, Science, 192, 1189–1202.Eiríksson, J., G. Larsen, K. L. Knudsen, J. Heinemeier, and L. A. Símonarson (2004), Marine reservoir age variability and water mass distribution
in the Iceland Sea, Quat. Sci. Rev., 23, 2247–2268.Eiríksson, J., K. L. Knudsen, G. Larsen, J. Olsen, J. Heinemeier, H. B. Bartels-Jónsdóttir, H. Jiang, L. Ran, and L. A. Símonarson (2011), Coupling of
palaeoceanographic shifts and changes in marine reservoir ages off North Iceland through the last millennium, Palaeogeogr.Palaeoclimatol. Palaeoecol., 302, 95–108.
Goosse, H., E. Crespin, S. Dubinkina, M. F. Loutre, M. E. Mann, H. Renssen, Y. Sallaz- Damaz, and D. Shindell (2012), The role of forcing andinternal dynamics in explaining the “Medieval Climate Anomaly”, Clim. Dyn., 39, 2847–2866.
Graham, N. E., C. M. Ammann, D. Fleitmann, K. M. Cobb, and J. Luterbacher (2011), Support for global climate reorganization during the“Medieval Climate Anomaly”, Clim. Dyn., 37, 1217–1245.
Grinsted, A., J. C. Moore, and S. Jevrejeva (2004), Application of the cross wavelet transform and wavelet coherence to geophysical timeseries, Nonlinear Process. Geophys., 11, 561–566.
Grönvold, K., N. Oskarsson, S. J. Johnsen, H. B. Clausen, C. U. Hammer, G. Bond, and E. Bard (1995), Ash layers from Iceland in the GreenlandGRIP ice core correlated with oceanic and land sediments, Earth Planet. Sci. Lett., 135, 149–155.
Grove, J. M. (1988), The Little Ice Age, pp. 520, Methuen, London.Hegerl, G. C., T. J. Crowley, S. K. Baum, K.-Y. Kim, and W. T. Hyde (2003), Detection of volcanic, solar and greenhouse gas signals in
paleo-reconstructions of Northern Hemispheric temperature, Geophys. Res. Lett., 30(5), 1242, doi:10.1029/2002GL016635.
Paleoceanography 10.1002/2015PA002849
MIETTINEN ET AL. THE MCA ON THE SE GREENLAND SHELF 1672
AcknowledgmentsWe want to acknowledge Olga Pavlovafrom the Norwegian Polar Institute forcollecting the data for the modern seaice concentrations used in the sea icetransfer function. This paper is acontribution to the International PolarYear (IPY) project “Arctic Natural Climateand Environmental Changes andHuman Adaption: From Science toPublic Awareness” (SciencePub) fundedby the Research Council of Norway,the University of Tromsø, and theNorwegian Polar Institute. The work waspartly financed by the Kone Foundation.Thank you to Marit-Solveig Seidenkrantzand an anonymous reviewer for theiruseful suggestions to improve themanuscript. The reconstructed aSST andaSIC data are available through thedatabank of NOAA (http://www.ncdc.noaa.gov/paleo/).
Jennings, A. E., and G. Helgadottir (1994), Foraminiferal assemblages from the fjords and shelf of Eastern Greenland, J. Foraminiferal Res., 24,123–144.
Jennings, A. E., and N. J. Weiner (1996), Environmental change in eastern Greenland during the last 1300 years: Evidence from foraminiferaand lithofacies in Nansen Fjord, 68°N, Holocene, 6, 179–191.
Jennings, A. E., K. Grønvold, R. Hilberman, M. Smith, and M. Hald (2002), High resolution study of Icelandic tephras in the KangerlussuaqTrough, SE East Greenland during the last deglaciation, J. Quat. Sci., 7, 747–757.
Jennings, A. E., M. Hald, M. Smith, and J. T. Andrews (2006), Freshwater forcing from the Greenland ice sheet during the Younger Dryas:Evidence from southeastern Greenland shelf cores, Quat. Sci. Rev., 25, 282–298.
Jennings, A., J. Andrews, and L. Wilson (2011), Holocene environmental evolution of the SE Greenland Shelf North and South of the DenmarkStrait: Irminger and Greenland current interactions, Quat. Sci. Rev., 30, 980–998.
Jennings, A., T. Thordarson, K. Zalzal, J. Stoner, C. Hayward, Á. Geirsdóttir, and G. Miller (2014), Holocene tephra from Iceland and Alaska in SEGreenland Shelf Sediments, in Marine Tephrochronology, edited by W. E. N. Austin et al., Geol. Soc. London, Spec. Publ., 398, doi:10.1144/SP398.6.
Jensen, K. G., A. Kuijpers, N. Koç, and J. Heinemeier (2004), Diatom evidence of hydrographic changes and ice conditions in Igaliku Fjord,South Greenland, during the past 1500 years, Holocene, 14, 152–164.
Jiang, H., M.-S. Seidenkrantz, K. L. Knudsen, and J. Eiríksson (2001), Diatom surface sediment assemblages around Iceland and theirrelationship to oceanic environmental variables, Mar. Micropaleontol., 41, 73–96.
Jiang, H., J. Eiriksson, M. Schultz, K.-L. Knudsen, and M.-S. Seidenkrantz (2005), Evidence for solar forcing of sea-surface temperature on theNorth Icelandic Shelf during the Late Holocene, Geology, 33, 73–76.
Jiang, H., et al. (2015), Solar forcing of Holocene summer sea-surface temperatures in the northern North Atlantic, Geology, 43, 203–206.Justwan, A., and N. Koç (2008), A diatom based transfer function for reconstructing sea ice concentrations in the North Atlantic,
Mar. Micropaleontol., 66, 264–278.Justwan, A., N. Koç, and A. Jennings (2009), Evolution of the East Greenland Current between 1150 and 1740 AD, revealed by diatom-based
sea surface temperature and sea-ice concentration reconstructions, Polar Res., 28, 165–176.Kaufman, D. S., et al. (2009), Recent warming reverses long-term Arctic cooling, Science, 325, 1236–1239.Kobashi, T., K. Kawamura, J. P. Severinghaus, J.-M. Barnola, T. Nkaegawa, B. M. Vinther, S. J. Johnsen, and J. E. Box (2011), High variability of
Greenland surface temperature over the past 4000 years estimated from trapped air in an ice core, Geophys. Res. Lett., 38, L21501,doi:10.1029/2011GL049444.
Koç, N., E. Jansen, and H. Haflidason (1993), Paleoceanographic reconstruction of surface ocean conditions in the Greenland, Iceland andNorwegian Seas through the last 14 ka based on diatoms, Quat. Sci. Rev., 12, 115–140.
Koç-Karpuz, N., and H. Schrader (1990), Surface sediment diatom distribution and Holocene paleo-temperature variations in the Greenland,Iceland and Norwegian Seas through the last 14 ka based on diatoms, Paleoceanography, 5, 557–580.
Kuijpers, A., N. Mikkelsen, S. Ribeiro, and M.-S. Seidenkrantz (2014), Impact of medieval fjord hydrography and climate on the Western andEastern Settlements in Norse Greenland, J. North Atlantic, 6, 1–13.
Lamb, H. H. (1965), The early medieval warm epoch and its sequel, Palaeogeogr. Palaeoclimatol. Palaeoecol., 1, 13–37.Mann, M. E., Z. Zhang, S. Rutherford, R. S. Bradley, M. K. Hughes, D. Shindell, D. C. Ammann, G. Faluvegi, and F. Ni (2009), Global signatures and
dynamical origins of the Little Ice Age and Medieval Climate Anomaly, Science, 326, 1256–1260.Masse, G., S. J. Rowland, M.-A. Sicre, J. Jacob, E. Jansen, and S. T. Belt (2008), Abrupt climate changes for Iceland during the last millenium:
Evidence from high resolution sea ice reconstructions, Earth Planet. Sci. Lett., 269, 565–569.Miettinen, A., N. Koç, I. R. Hall, F. Godtliebsen, and D. Divine (2011), North Atlantic sea surface temperatures and their relation to the North
Atlantic Oscillation during the last 230 years, Clim. Dyn., 36, 533–543.Miettinen A., D. Divine, N. Koç¸ F. Godtliebsen, and I. R. Hall (2012), Multicentennial variability of the sea surface temperature gradient across
the subpolar North Atlantic over the last 2.8 kyr, J. Clim., 25, 4205–4219.Miller, G. H., et al. (2012), Abrupt onset of the Little Ice Age triggered by volcanism and sustained by sea-ice/ocean feedbacks, Geophys. Res.
Lett., 39, L02708, doi:10.1029/2011GL050168.Moffa-Sánchez, P., A. Born, I. R. Hall, D. J. R. Thornalley, and S. Barker (2014), Solar forcing of North Atlantic surface temperature and salinity
over the past millennium, Nat. Geosci., 7, 275–278.Ogilvie, A. E. J. (1996), Sea-ice conditions off the coasts of Iceland A.D. 1601–1850 with special reference to part of the Maunder Minimumperiod
(1675–1715), in North European Climate Data in the Latter Part of the Maunder Minimum Period A.S. 1675–1715, edited by E. S. Pedersen,pp. 9–12, Museum of Archaeology, Stravanger AmS-Varia 25, Extended abstracts for the Regional North-European sub-group meeting onhistorical climatology in Stavanger, Norway.
Ogilvie, A. E. J., L. K. Barlow, and A. Jennings (2000), North Atlantic climate c. A.D. 1000: Millennial reflections on the Viking discoveries ofIceland, Greenland and North America, Weather, 55, 34–45.
Olsen, J., N. J. Anderson, and M. F. Knudsen (2012), Variability of the North Atlantic Oscillation over the last 5,200 years, Nat. Geosci., 5, 808–812.Otterå, O. H., M. Bensen, H. Drange, and L. Suo (2010), External forcing as a metronome for Atlantic multidecadal variability, Nat. Geosci., 3,
688–694.Pringle, H. (1997), Death in Norse Greenland, Science, 275, 924–926.Ran, L., H. Jiang, K. L. Knudsen, and J. Eiríksson (2011), Diatom-based reconstruction of palaeoceanographic changes on the North Icelandic
shelf during the last millennium, Palaeogeogr. Palaeoclimatol. Palaeoecol., 302, 109–119.Reeh, N., H. H. Thomsen, A. K. Higgins, and A. Weidick (2001), Sea ice and the stability of north and northeast Greenland floating glaciers,
in Annals of Glaciology, vol. 33, edited by M. O. Jeffries and H. Eicken, pp. 474–480, International Glaciological Society, Cambridge.Reimer, P. J., et al. (2013), IntCal13 and Marine13 radiocarbon age calibration curves 0–50,000 years cal BP, Radiocarbon, 55, 1869–1887.Rudels, B., H. J. Friedrich, and D. Quadfasel (1999), The Arctic Circumpolar Current, Deep Sea Res., Part II, 1023–1062.Schleussner, C.-F., D. Divine, J. F. Donges, A. Miettinen, and R. Donner (2015), Indications for a North Atlantic Ocean circulation regime shift at
the onset of the Little Ice Age, Clim. Dyn., doi:10.1007/s00382-015-2561-x.Schrader, H. J., and R. Gersonde (1978), Diatoms and silicoflagellates. Micropaleontological counting methods and techniques—An exercise
on an eight meters section of the lower Pliocene of Capo Rossello, Utrecht Micropaleontol. Bull., 17, 129–176.Schulz, M., and M. Mudelsee (2002), REDFIT: Estimating red-noise spectra directly from unevenly spaced paleoclimatic time series,
Comput. Chem., 28, 421–426.Schröder, W. (2005), Case Studies on the Spörer, Maunder, and Dalton Minima, Science Edition, Bremen.Seidenkrantz, M. S., S. Aagaard-Sørensen, H. Sulsbrück, A. Kuijpers, K. G. Jensen, and H. Kunzendorf (2007), Hydrography and climate of the
last 4400 years in a SW Greenland, Holocene, 17, 387–401.
Paleoceanography 10.1002/2015PA002849
MIETTINEN ET AL. THE MCA ON THE SE GREENLAND SHELF 1673
Sha, L., H. Jiang, M.-S. Seidenkrantz, K. L. Knudsen, J. Olsen, A. Kuijpers, and Y. Liu (2014), A diatom-based sea-ice reconstruction for the VaigatStrait (Disko Bugt,West Greenland) over the last 5000 yr, Palaeogeogr. Palaeoclimatol. Palaeoecol., 403, 66–79.
Shindell, D. T., G. A. Schmidt, M. E. Mann, D. Rind, and A. Waple (2001), Solar forcing of regional climate change during the MaunderMinimum, Science, 294, 2149–2152.
Shindell, D. T., G. Schmidt, R. I. Miller, and M. E. Mann (2003), Volcanic and solar forcing of climate change during the preindustrial era, J. Clim.,16, 4094–4107.
Sicre, M.-A., I. R. Hall, J. Mignot, M. Khodri, U. Ezat, M. X. Truong, J. Eiríksson, and K. L. Knudsen (2011), Sea surface temperature variability in thesubpolar Atlantic over the last two millennia, Paleoceanography, 26, PA4218, doi:10.1029/2011PA002169.
Sicre, M.-A., et al. (2014), Labrador Current variability over the last 2000 years, Earth Planet. Sci. Lett., 400, 26–32.Smith, T. M., R. W. Reynolds, T. C. Peterson, and J. Lawrimore (2008), Improvements NOAAs historical merged land–ocean temp analysis
(1880–2006), J. Clim., 21, 2283–2296.Steinhilber, F., et al. (2012), 9,400 years of cosmic radiation and solar activity from ice cores and tree rings, Proc. Natl. Acad. Sci. U.S.A., 109,
5967–5971.Stephens, C., J. I. Antonov, T. P. Boyer, M. E. Conkright, R. A. Locarnini, T. D. O’Brien, and H. E. Garcia (2002), inWorld Ocean Atlas 2001, Volume
1: Temperature, NOAA Atlas NESDIS, vol. 49, edited by S. Levitus, 167 pp., U.S. Gov. Print. Off., Washington, D. C.Stoner, J. S., A. Jennings, G. B. Kristjándóttir, G. Dunhill, J. T. Andrews, and J. Hardardóttir (2007), A paleomagnetic approach toward reflecting
Holocene radiocarbon based chronologies: Palaeoceanographic records from the north Iceland (MD99-2269) and east Greenland(MD99-2322) margins, Paleoceanography, 22, PA1209, doi:10.1029/2006PA001285.
Ter-Braak, C. J. F., and S. Juggins (1993), Weighted averaging partial least squares regression (WA-PLS): An improved method forreconstructing environmental variables from species assemblages, Hydrobiologia, 269–270, 485–502.
Torrence, C., and G. Compo (1998), A practical guide to wavelet analysis, Bull. Am. Meteorol. Soc., 79, 61–78.Trouet, V., J. Esper, N. E. Graham, A. Baker, J. D. Scourse, and D. C. Frank (2009), Persistent positive North Atlantic Oscillation mode dominated
the Medieval Climate Anomaly, Science, 324, 78–80.Vinther, B. M., P. D. Jones, K. R. Briffa, H. B. Clausen, K. K. Andersen, D. Dahl-Jensen, and S. J. Johnsen (2010), Climatic signals in multiple highly
resolved stable isotope records from Greenland, Quat. Sci. Rev., 29, 522–538.von Quillfeldt, C. H. (2001), Identification of some easily confused diatom species in Arctic spring blooms, Bot. Mar., 44, 375–389.Wanner, H., S. Bronnimann, C. Casty, D. Gyalistras, J. Luterbacher, C. Schmutz, D. B. Stephenson, and E. Xoplaki (2001), North Atlantic
Oscillation—Concepts and studies, Surv. Geophys., 22, 321–382.Woodgate, R. A., E. Fahrbach, and G. Rohardt (1999), Structure and transport of the East Greenland Current at 75°N from moored current
meters, J. Geophys. Res., 104, 18,059–18,072, doi:10.1029/1999JC900146.Xoplaki, E., D. Fleitmann, and H. F. Diaz (2011), Medieval climate anomaly. PAGES news 19, 4.Yu, L., Y. Gao, and O. H. Ottero (2015), The sensitivity of the Atlantic meridional overturning circulation to enhanced freshwater discharge
along the entire, eastern and western coast of Greenland, Clim. Dyn., doi:10.1007/s00382-015-2651-9.Zorita, E., et al. (2010), European temperature records of the past five centuries based on documentary/instrumental information compared
to climate simulations, Clim. Change, 101, 143–168.
Paleoceanography 10.1002/2015PA002849
MIETTINEN ET AL. THE MCA ON THE SE GREENLAND SHELF 1674


![Establishing a Greenland Ice Sheet Ocean Observing System ......glacier retreat [Straneo et al. 2013; Straneo and Heimbach 2013]. In addition to the impact of the ocean on the Greenland](https://img.pdfslide.net/doc/110x75/612862679562702124543bc8/establishing-a-greenland-ice-sheet-ocean-observing-system-glacier-retreat.jpg)