Embed Size (px)
Citation preview
Excerpt
TABLES AND CHARTS
BUDGET 2017-2018March 2017
2
Sources: Institut de la statistique du Québec, Statistics Canada and Ministère des Finances du Québec.
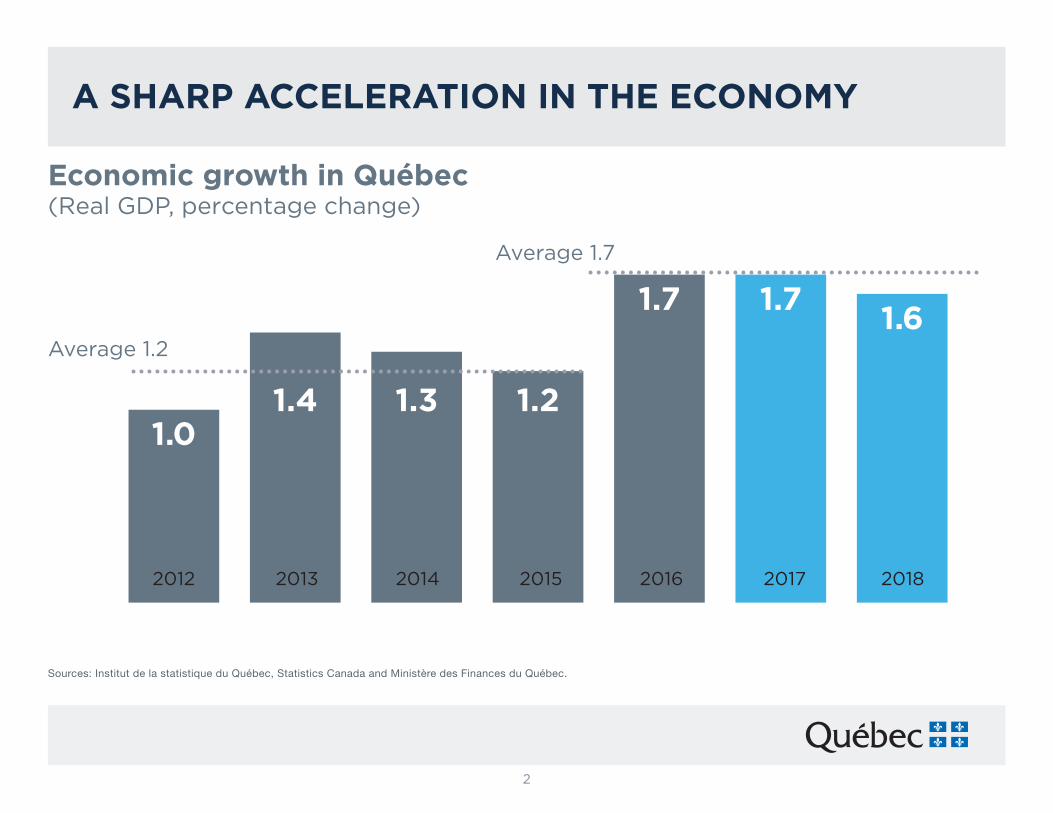
A SHARP AccElERAtion in tHE EconoMY
Economic growth in Québec (Real GDP, percentage change)
Average 1.7
Average 1.2
1.01.4 1.3 1.2
1.7 1.71.6
2012 2013 2014 2015 2016 2017 2018
3
(1) Forecasts of the Ministère des Finances du Québec for Québec and Canada and forecasts of the Conference Board of Canada for Ontario.Sources: Institut de la statistique du Québec, Statistics Canada, Conference Board of Canada and Ministère des Finances du Québec.
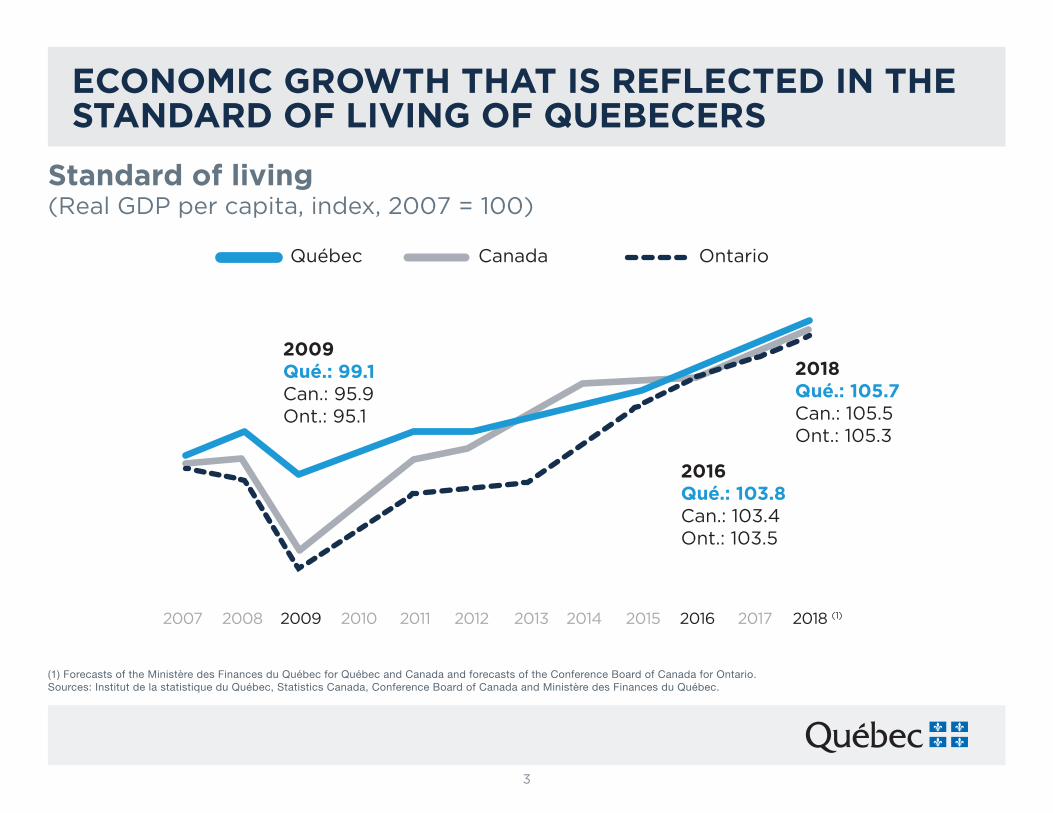
EconoMic GRoWtH tHAt iS REFlEctED in tHE StAnDARD oF liVinG oF QUEBEcERS
Standard of living(Real GDP per capita, index, 2007 = 100)
2007 2008 2009 2010 2011 2012 2013 2014 2015 2016 2017 2018 (1)
Québec Canada Ontario
2018Qué.: 105.7Can.: 105.5Ont.: 105.3
2016Qué.: 103.8Can.: 103.4Ont.: 103.5
2009Qué.: 99.1Can.: 95.9Ont.: 95.1
4
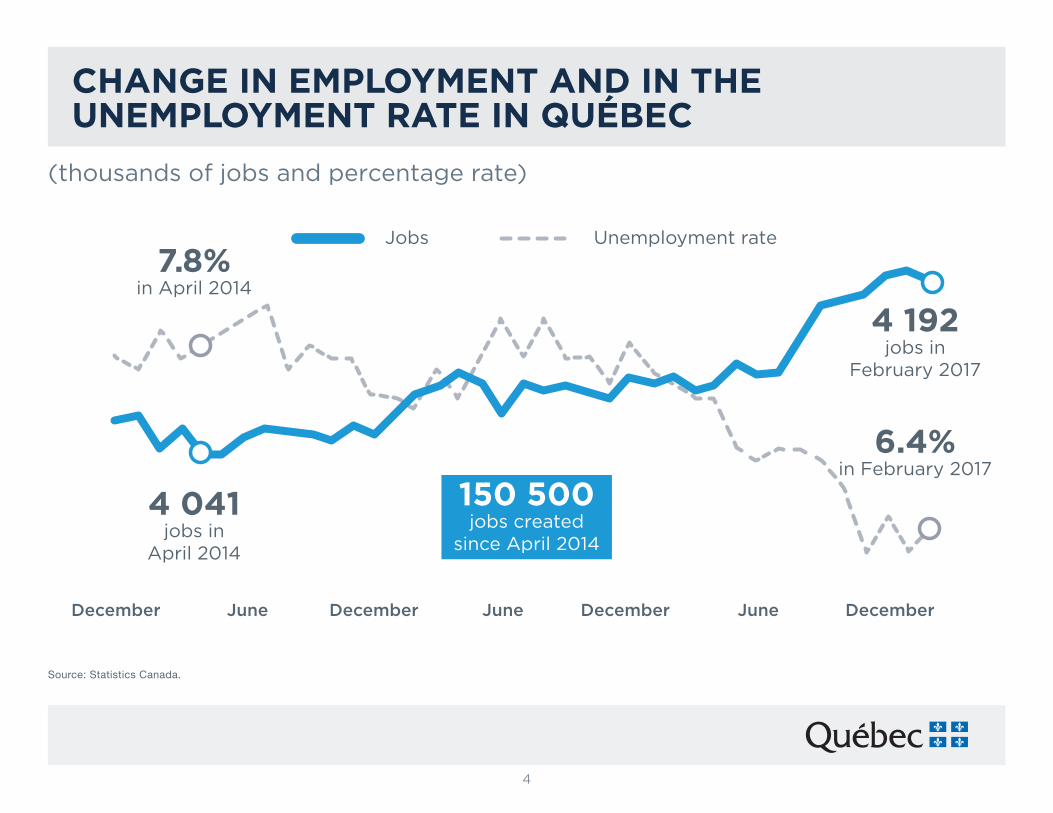
Source: Statistics Canada.
cHAnGE in EMPloYMEnt AnD in tHE UnEMPloYMEnt RAtE in QUÉBEc
(thousands of jobs and percentage rate)
6.4%in February 2017
4 192jobs in
February 2017
7.8% in April 2014
4 041 jobs in
April 2014
Unemployment rate
150 500 jobs created
since April 2014
Jobs
December June December June December June December
5
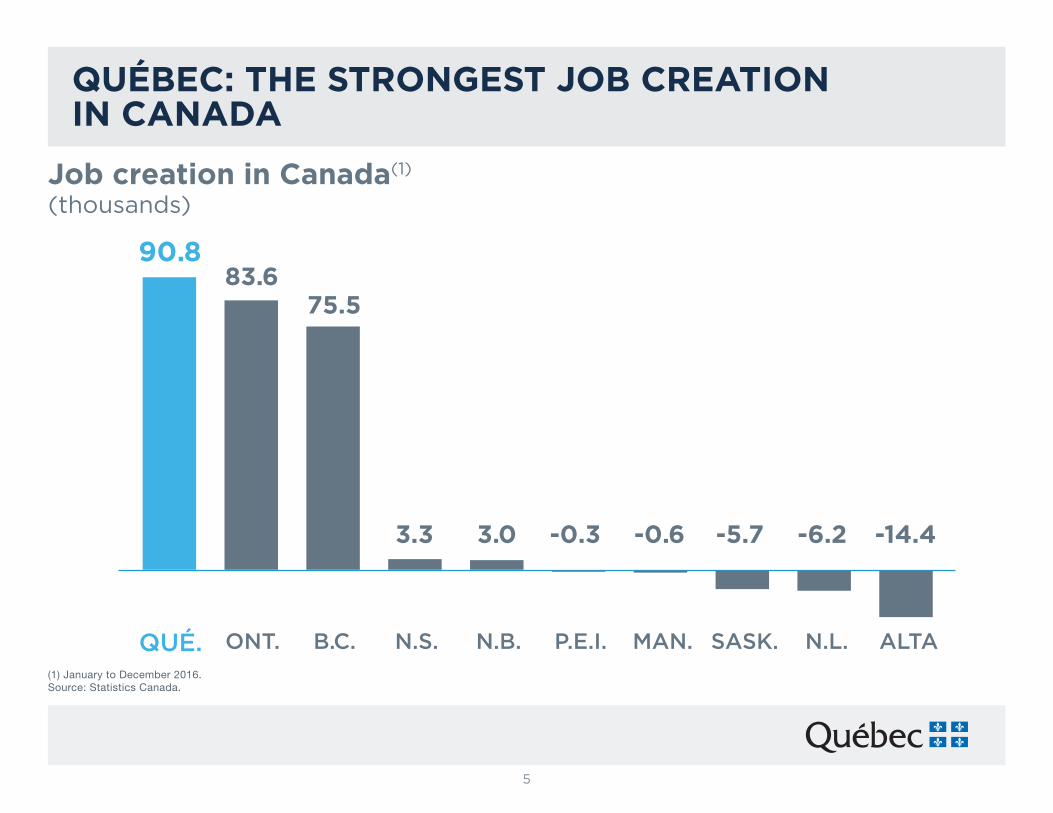
(1) January to December 2016.Source: Statistics Canada.
QUÉBEc: tHE StRonGESt JoB cREAtion in cAnADA
90.883.6
75.5
3.3 3.0 -0.3 -0.6 -5.7 -6.2 -14.4
QUÉ. N.S. MAN.ONT. N.B. SASK.B.C. P.E.I. N.L. ALTA
Job creation in canada(1)
(thousands)
6
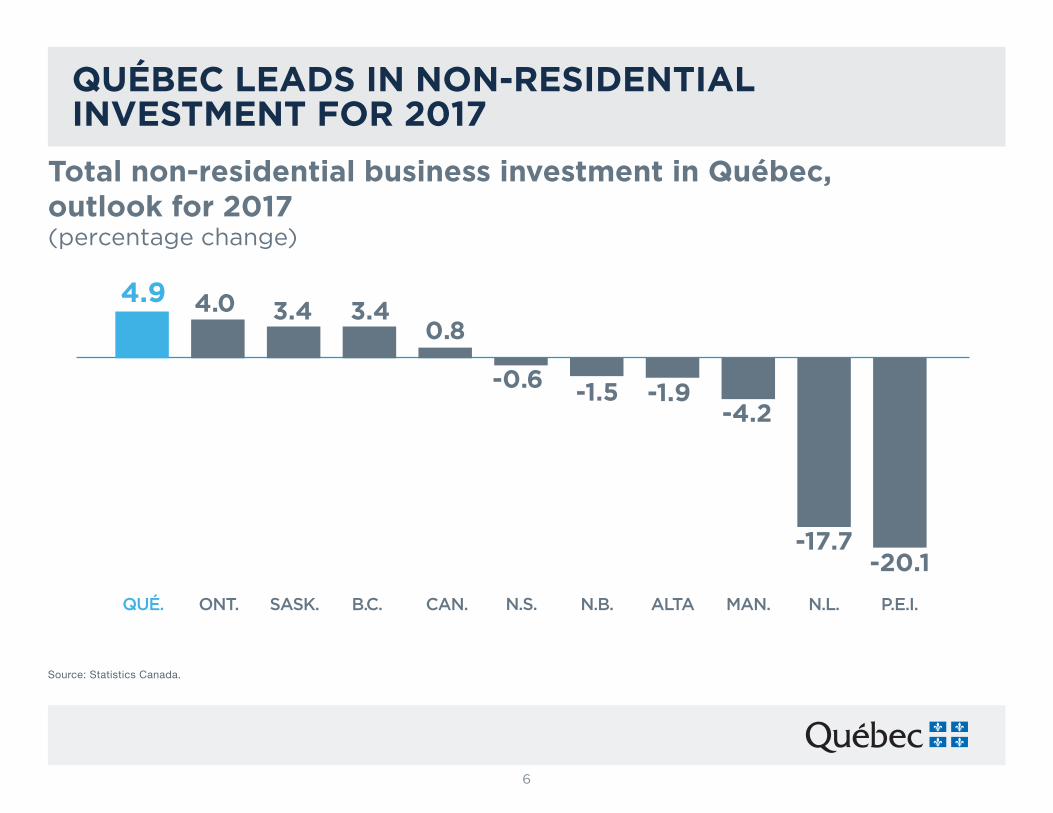
Source: Statistics Canada.
QUÉBEc lEADS in non-RESiDEntiAl inVEStMEnt FoR 2017
4.9 4.0 3.43.40.8
-0.6 -1.5 -1.9-4.2
-17.7-20.1
QUÉ. N.S. MAN.ONT. N.B.SASK. CAN.B.C. P.E.I.N.L.ALTA
total non-residential business investment in Québec, outlook for 2017(percentage change)
7
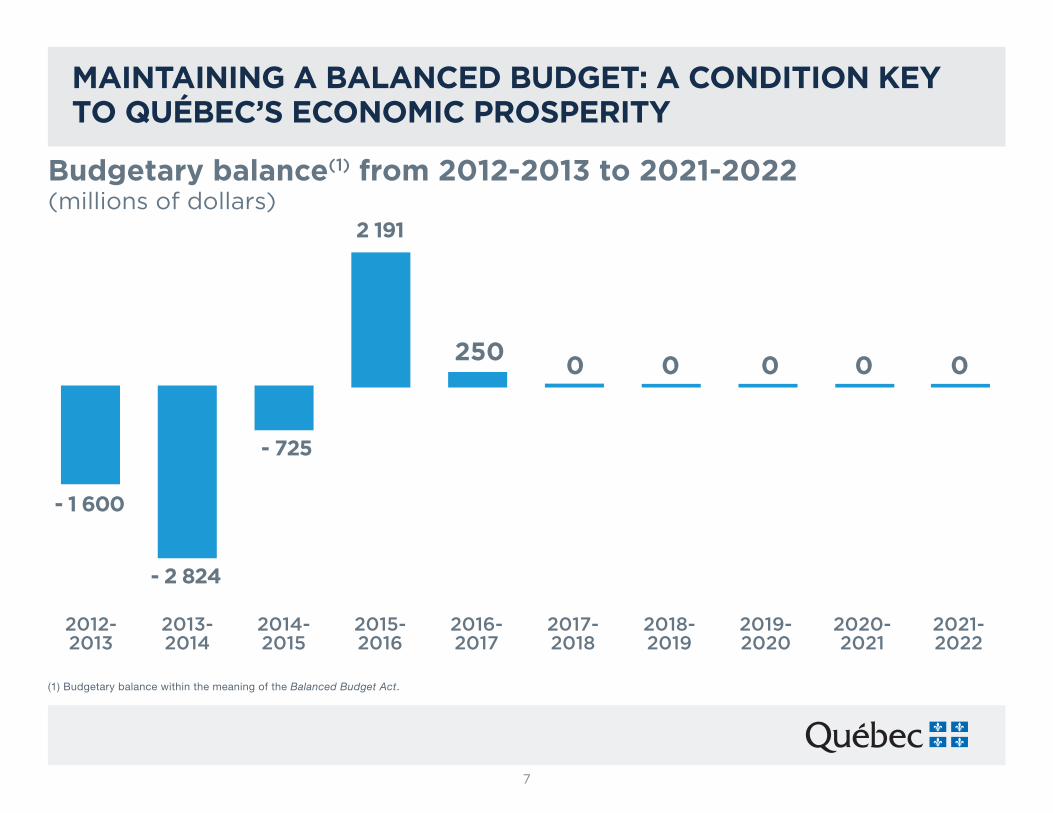
MAintAininG A BAlAncED BUDGEt: A conDition KEY to QUÉBEc’S EconoMic PRoSPERitY
(1) Budgetary balance within the meaning of the Balanced Budget Act.
Budgetary balance(1) from 2012-2013 to 2021-2022(millions of dollars)
- 1 600
- 2 824
- 725
2 191
250 0 0 0 0 0
2012- 2013
2013- 2014
2014- 2015
2015- 2016
2016- 2017
2017- 2018
2018- 2019
2019- 2020
2020- 2021
2021- 2022
8
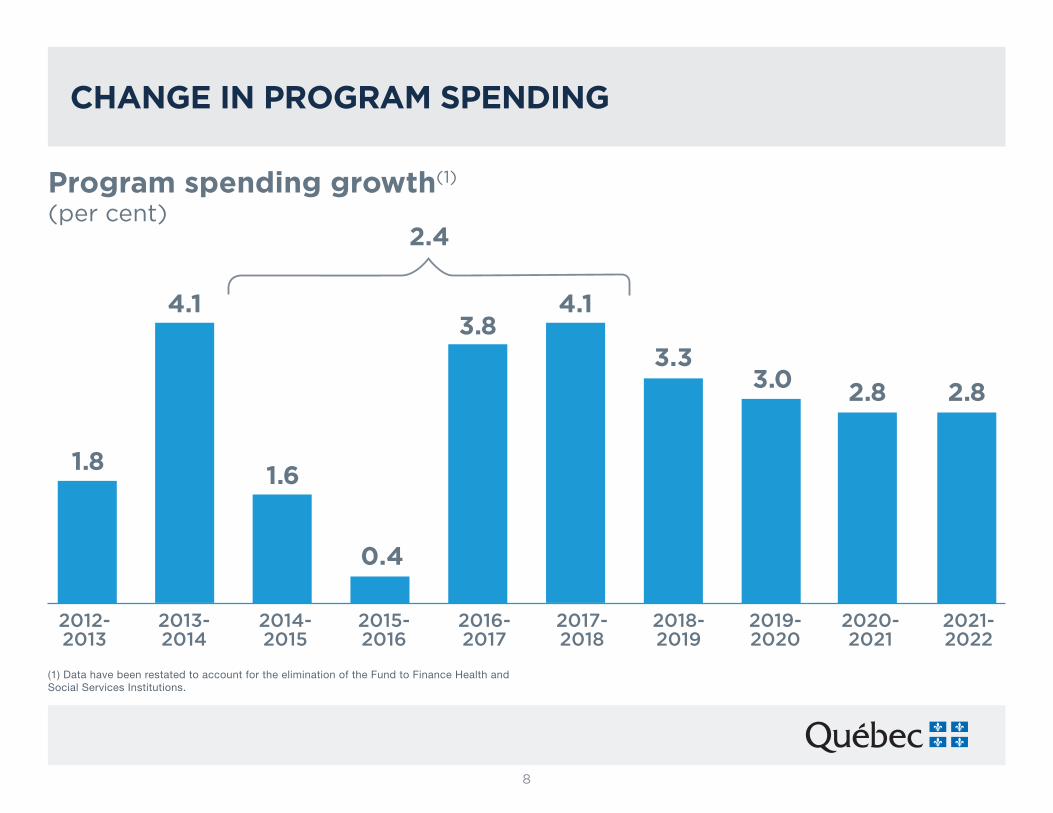
(1) Data have been restated to account for the elimination of the Fund to Finance Health and Social Services Institutions.
Program spending growth(1) (per cent)
1.61.8
0.4
3.84.14.1
2.4
3.33.0 2.8 2.8
2014- 2015
2012- 2013
2015- 2016
2013- 2014
2016- 2017
2017- 2018
2018- 2019
2019- 2020
2020- 2021
2021- 2022
cHAnGE in PRoGRAM SPEnDinG
9
(1) Consolidated expenditure excluding debt service.Sources: Department of Finance Canada and Ministère des Finances du Québec.
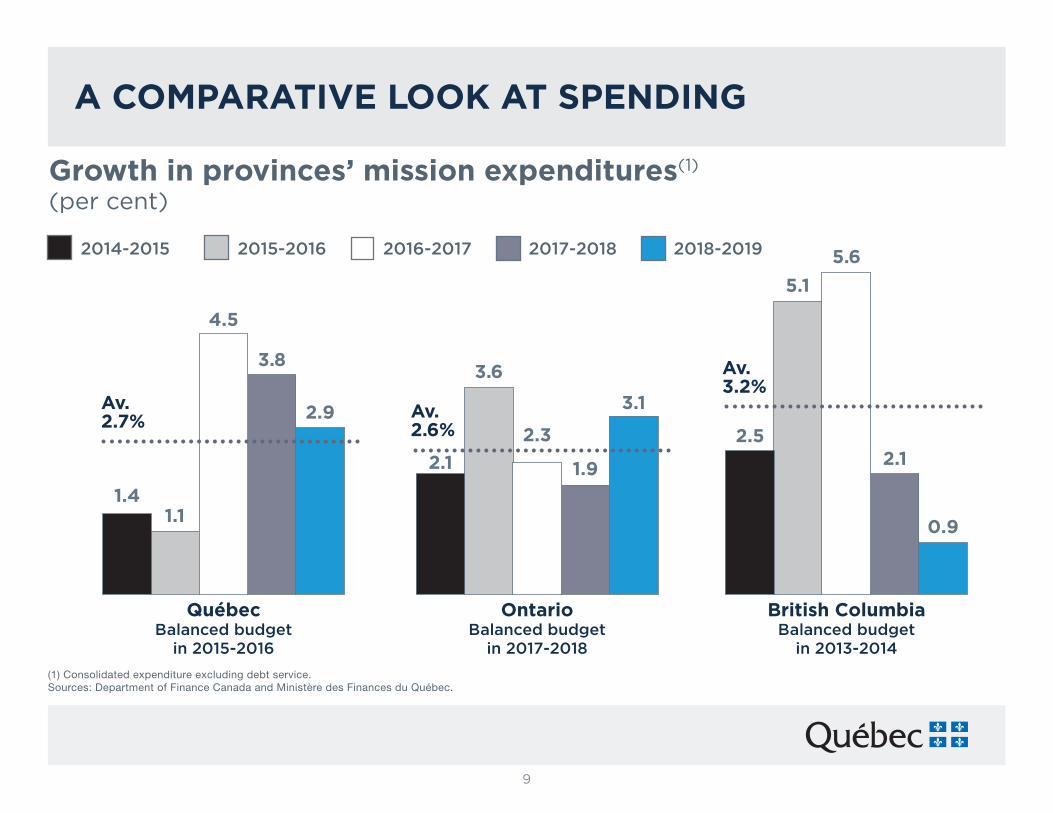
Growth in provinces’ mission expenditures(1) (per cent)
A coMPARAtiVE looK At SPEnDinG
2014-2015 2015-2016 2017-20182016-2017 2018-2019
Québec Balanced budget
in 2015-2016
Av.2.7%
1.41.1
4.5
3.8
2.9
British columbia Balanced budget
in 2013-2014
Av.3.2%
2.5
5.1
5.6
2.1
0.9
ontario Balanced budget
in 2017-2018
Av.2.6%
2.1
3.6
2.3
1.9
3.1
10
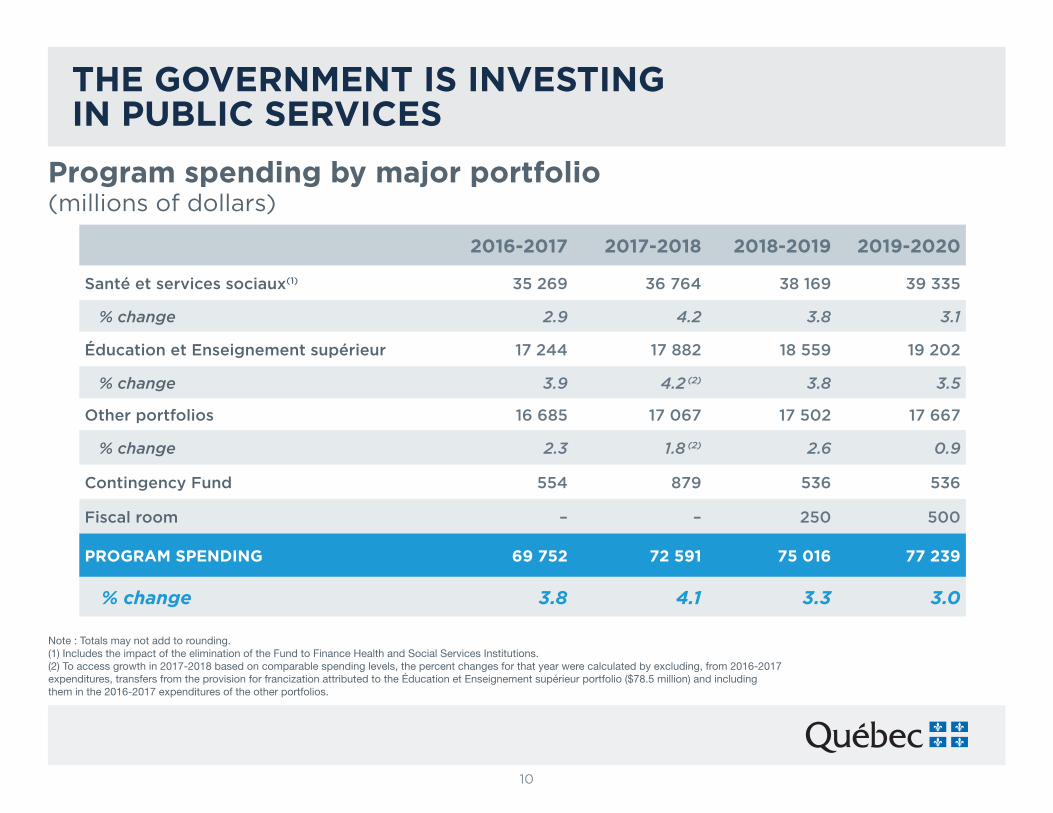
tHE GoVERnMEnt iS inVEStinG in PUBlic SERVicES
Note : Totals may not add to rounding.(1) Includes the impact of the elimination of the Fund to Finance Health and Social Services Institutions.(2) To access growth in 2017-2018 based on comparable spending levels, the percent changes for that year were calculated by excluding, from 2016-2017 expenditures, transfers from the provision for francization attributed to the Éducation et Enseignement supérieur portfolio ($78.5 million) and including them in the 2016-2017 expenditures of the other portfolios.
2016-2017 2017-2018 2018-2019 2019-2020
Santé et services sociaux(1) 35 269 36 764 38 169 39 335
% change 2.9 4.2 3.8 3.1
Éducation et Enseignement supérieur 17 244 17 882 18 559 19 202
% change 3.9 4.2 (2) 3.8 3.5
Other portfolios 16 685 17 067 17 502 17 667
% change 2.3 1.8 (2) 2.6 0.9
Contingency Fund 554 879 536 536
Fiscal room – – 250 500
PRoGRAM SPEnDinG 69 752 72 591 75 016 77 239
% change 3.8 4.1 3.3 3.0
Program spending by major portfolio(millions of dollars)
11
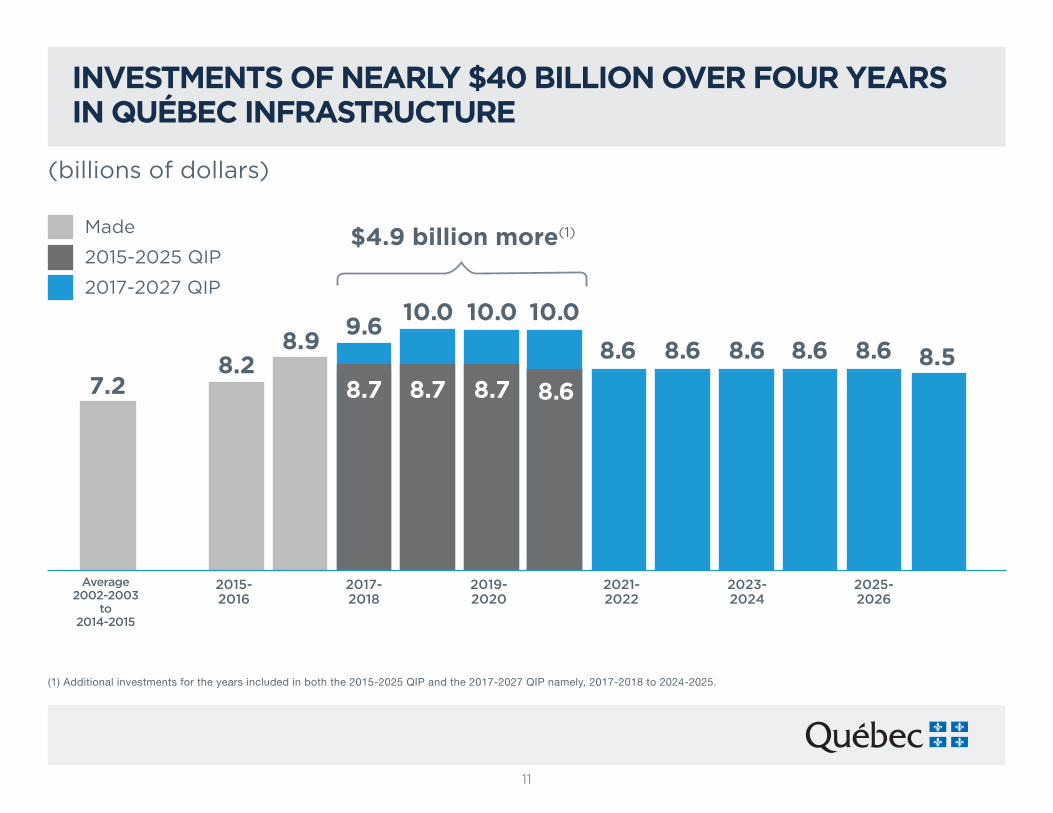
inVEStMEntS oF nEARlY $40 Billion oVER FoUR YEARS in QUÉBEc inFRAStRUctURE
8.58.68.6 8.68.68.68.9
2015-2016
2017-2018
2019-2020
2021-2022
2023-2024
2025-2026
8.2
$4.9 billion more(1)
7.2
Made
2015-2025 QIP
2017-2027 QIP
Average 2002-2003
to2014-2015
(billions of dollars)
10.0
8.6
10.0
8.7
10.0
8.7
9.6
8.7
(1) Additional investments for the years included in both the 2015-2025 QIP and the 2017-2027 QIP namely, 2017-2018 to 2024-2025.
12
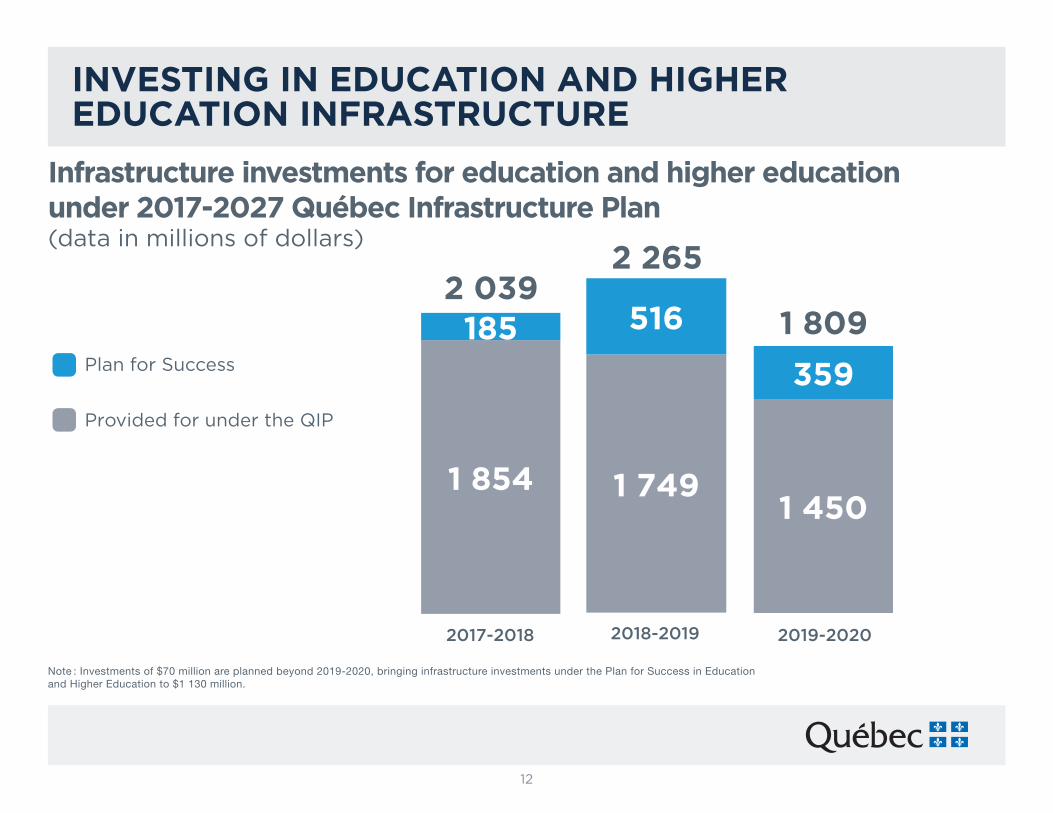
Note : Investments of $70 million are planned beyond 2019-2020, bringing infrastructure investments under the Plan for Success in Education and Higher Education to $1 130 million.
inVEStinG in EDUcAtion AnD HiGHER EDUcAtion inFRAStRUctURE
Plan for Success
Provided for under the QIP
2017-2018 2018-2019 2019-2020
1 7491 450
516
1 854
185
359
1 809
2 2652 039
infrastructure investments for education and higher education under 2017-2027 Québec infrastructure Plan(data in millions of dollars)
13
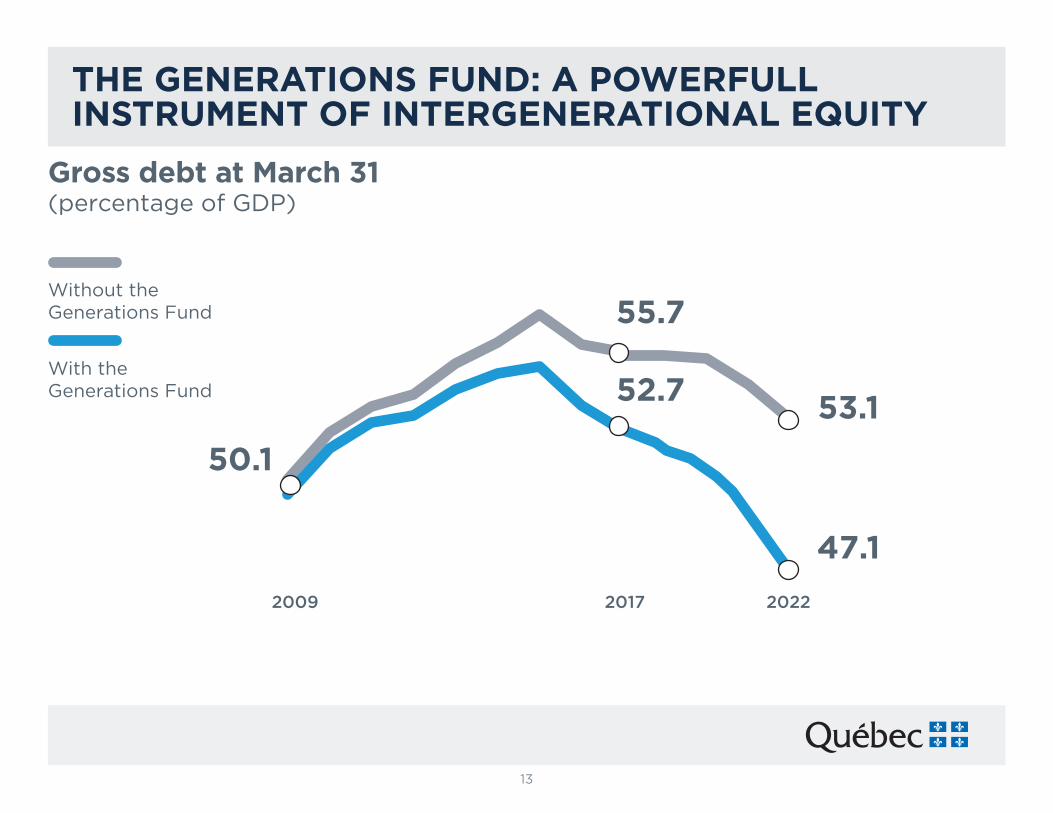
tHE GEnERAtionS FUnD: A PoWERFUll inStRUMEnt oF intERGEnERAtionAl EQUitY
202220172009
Without the Generations Fund
With the Generations Fund
50.1
52.7
47.1
55.7
53.1
Gross debt at March 31(percentage of GDP)
14
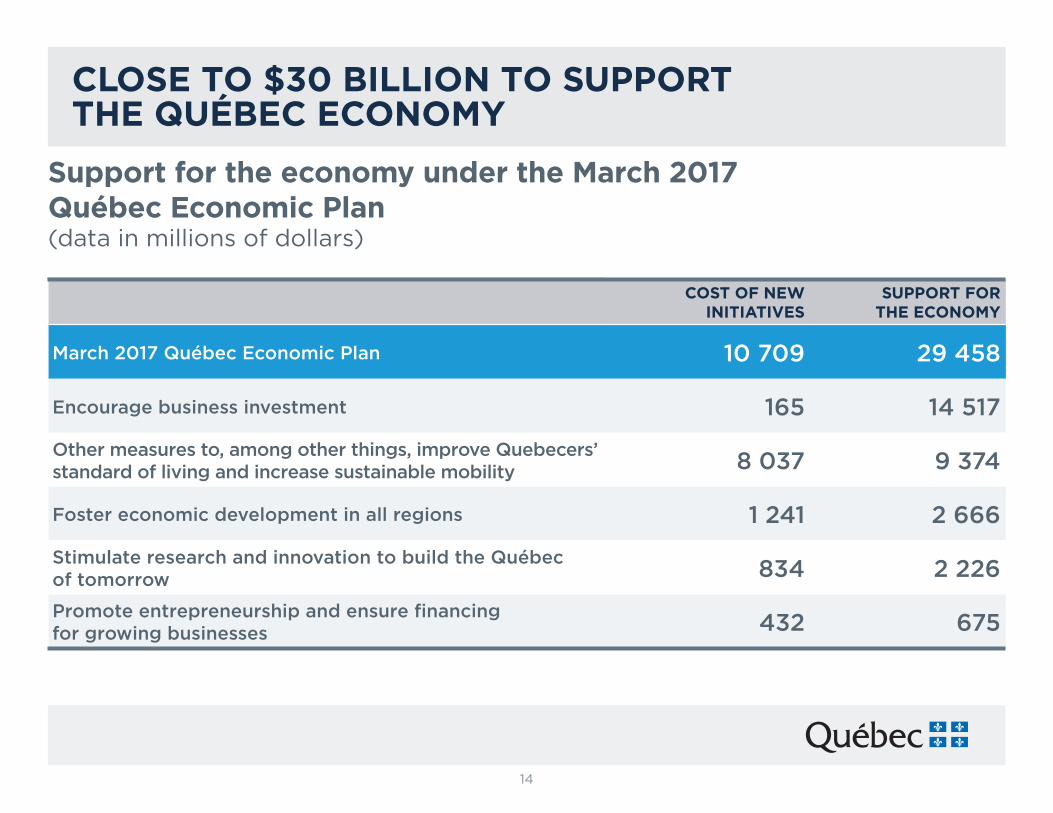
cloSE to $30 Billion to SUPPoRt tHE QUÉBEc EconoMY
coSt oF nEW initiAtiVES
SUPPoRt FoR tHE EconoMY
March 2017 Québec Economic Plan 10 709 29 458
Encourage business investment 165 14 517
Other measures to, among other things, improve Quebecers’ standard of living and increase sustainable mobility 8 037 9 374
Foster economic development in all regions 1 241 2 666
Stimulate research and innovation to build the Québec of tomorrow 834 2 226
Promote entrepreneurship and ensure financing for growing businesses 432 675
Support for the economy under the March 2017 Québec Economic Plan(data in millions of dollars)
15
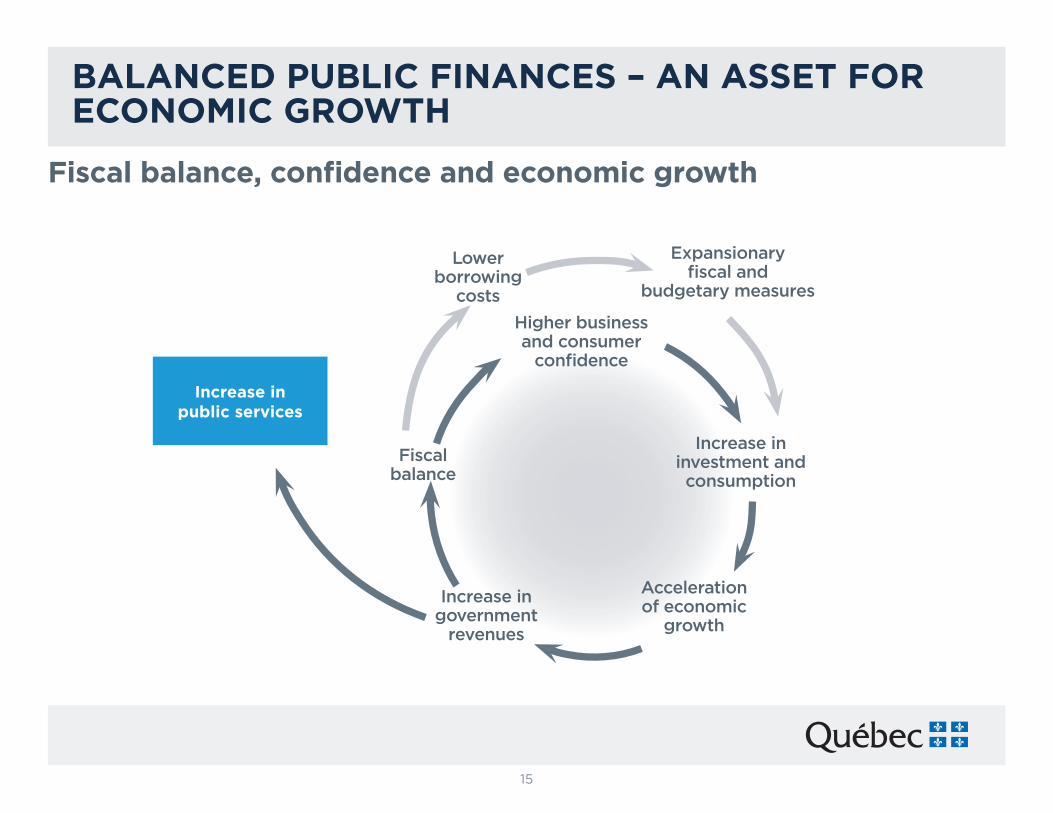
increase inpublic services
BAlAncED PUBlic FinAncES – An ASSEt FoR EconoMic GRoWtH
Fiscal balance, confi dence and economic growth
Fiscal balance
Increase in investment and consumption
Acceleration of economic
growth
Increase in government
revenues
Higher business and consumer
confi dence
Expansionary fi scal and
budgetary measures
Lower borrowing
costs
16
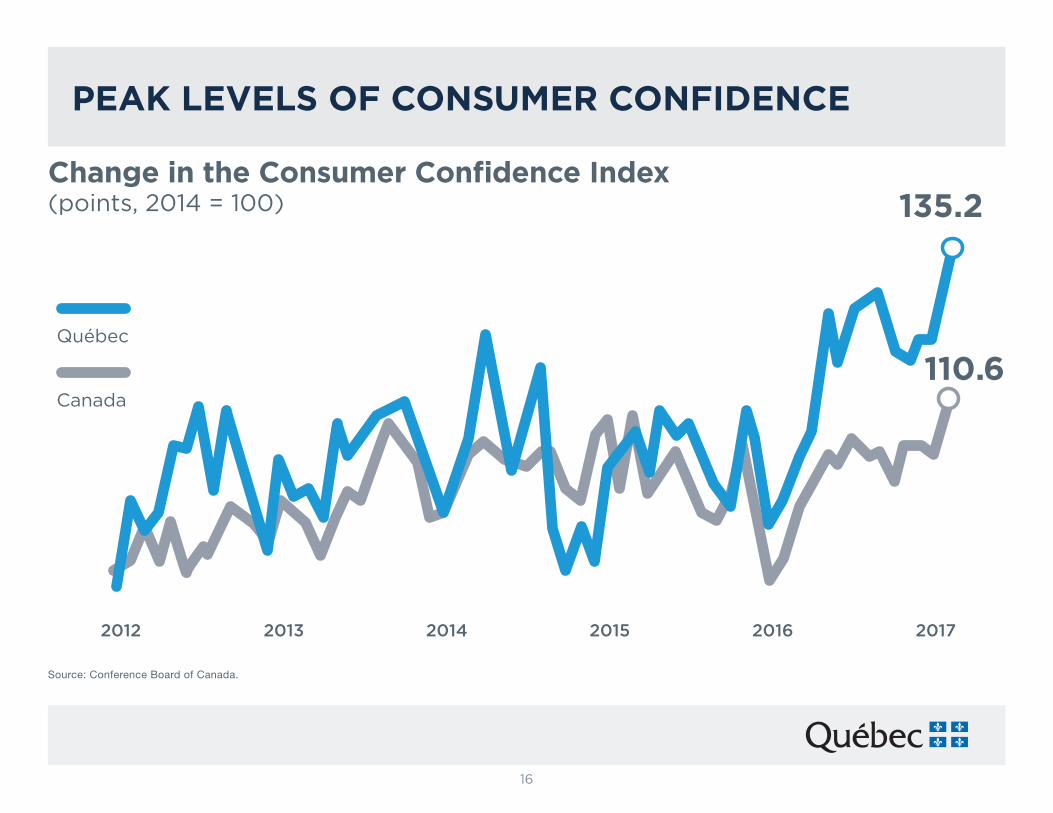
Source: Conference Board of Canada.
110.6
135.2
Canada
Québec
20172012 20142013 2015 2016
PEAK lEVElS oF conSUMER conFiDEncE
Change in the Consumer Confidence Index(points, 2014 = 100)
17
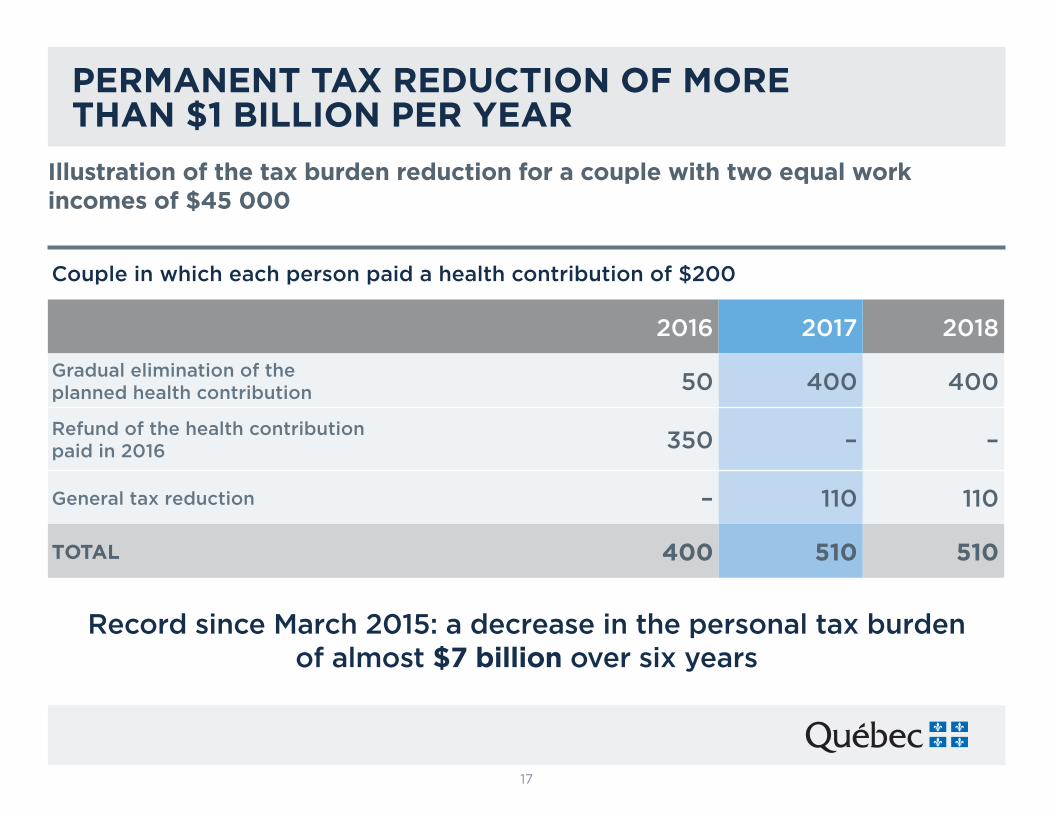
PERMAnEnt tAX REDUction oF MoRE tHAn $1 Billion PER YEAR
Couple in which each person paid a health contribution of $200
2016 2017 2018
Gradual elimination of the planned health contribution 50 400 400
Refund of the health contribution paid in 2016 350 – –
General tax reduction – 110 110
totAl 400 510 510
Record since March 2015: a decrease in the personal tax burden of almost $7 billion over six years
illustration of the tax burden reduction for a couple with two equal work incomes of $45 000