Embed Size (px)
Citation preview

Excess and Surplus Lines Insurance Market and Structuring Complex Property Insurance Programs
Impact of Hurricane Harvey
November 14th, 2017

Impact to Houston
City of Houston Response
Property Insurance Program ◦ $10.9B TIV – 2000+ Insured Properties
◦ Current Policy: $175M Loss Limit with $100M Flood Sub-Limit
◦ Current Damage Estimate: $170M+
◦ Flood Reinstatement


Estimated losses from 2017 Hurricanes
Harvey - $35bn-$40bn ($10bn to NFIP) Irma - $32bn - $50bn Maria - $70bn-$85bn Nate - $500m - $1bn
Carrier losses from 2017 Hurricanes
Lloyds - $7bn Swiss Re - $3.6bn AIG - $3bn Chubb - $1.5bn Everest Re - $1.3bn Axis - $600m
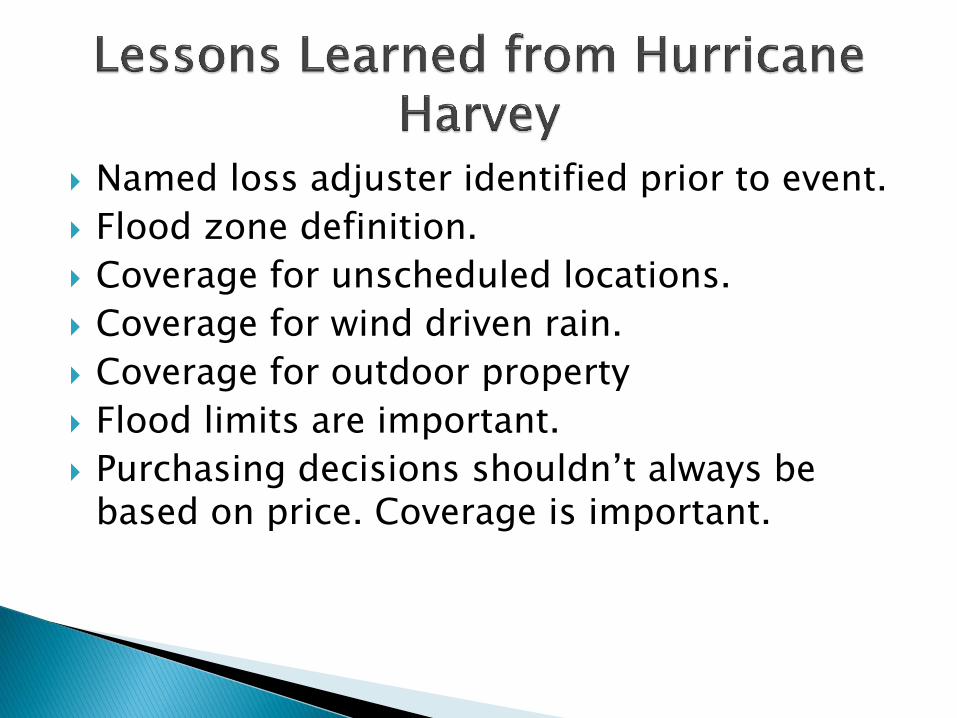
Named loss adjuster identified prior to event.
Flood zone definition.
Coverage for unscheduled locations.
Coverage for wind driven rain.
Coverage for outdoor property
Flood limits are important.
Purchasing decisions shouldn’t always be based on price. Coverage is important.

E+S=Wholesale market=specialty lines =surplus lines =non admitted.
Non admitted carriers are NOT bound by the rate and form regulations imposed on standard market companies.
Allows for flexibility in rate and form.
Non admitted carriers are not licensed by the state but they are regulated and allowed to do business in the state. States maintain a list of approved surplus lines companies.
Not part of the state guarantee fund.

Your risk does not meet the guidelines of the standard market due to age, location or loss history .
The policy limits exceed the guidelines for the standard market.
The risk is “outside the box” of what the standard carriers are comfortable writing.
The risk is an unusual risk or extraordinary and standard markets are not comfortable writing.
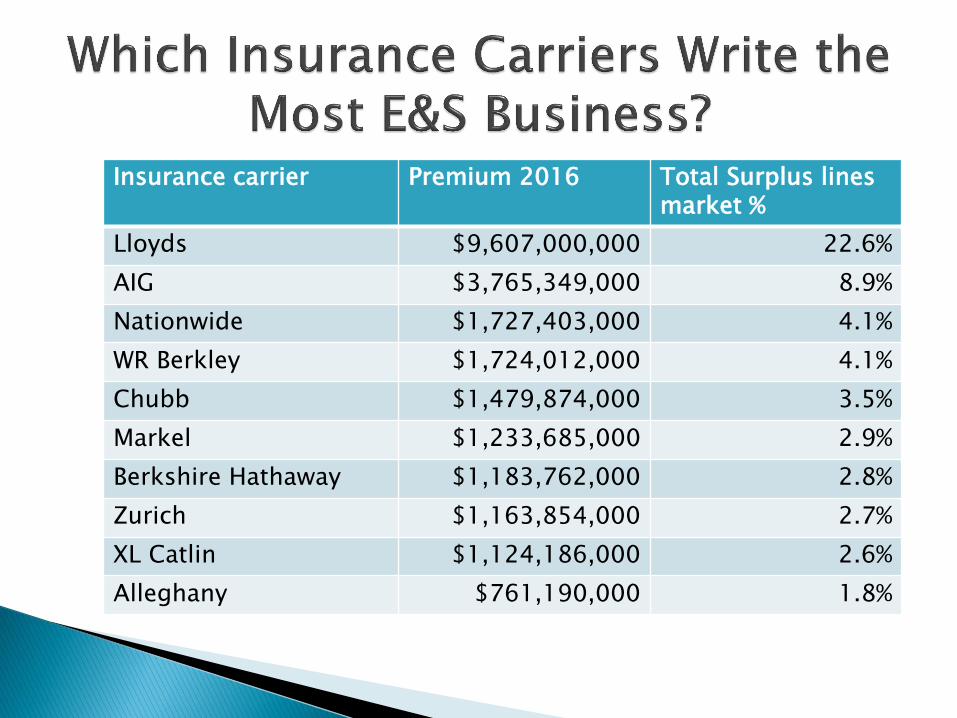
Insurance carrier Premium 2016 Total Surplus lines market %
Lloyds $9,607,000,000 22.6%
AIG $3,765,349,000 8.9%
Nationwide $1,727,403,000 4.1%
WR Berkley $1,724,012,000 4.1%
Chubb $1,479,874,000 3.5%
Markel $1,233,685,000 2.9%
Berkshire Hathaway $1,183,762,000 2.8%
Zurich $1,163,854,000 2.7%
XL Catlin $1,124,186,000 2.6%
Alleghany $761,190,000 1.8%

Florida
Texas
California
New York
These four states make up 75% of all the E+S business in the U.S.

There are two main modeling companies used – RMS and AIR.
Garbage in, garbage out.
Most important numbers on your modeling results are: -250 and 500 year event -Annual Average Loss (AAL) -Top location drivers of AAL
AAL results are the most directly linked to premiums.
Event results are most directly linked to how much coverage to purchase and where insurance carriers will support a placement.
No reliable flood model at this time.


Varies significantly depending upon size, occupancy, loss record and geographic location.
Accounts that are coastal tend to be more structured that inland accounts.
When placements are layered this will tend to be based around the modeled results. Some carriers will only attach excess of a 250 year PML.


Still too early to tell until reinsurance treaties renew in the first quarter of 2018, but market is hardening.
Rate increases likely – amount of increase determined by loss experience
and Gulf Coast/Catastrophic exposures.
Deductible increases likely – deductible buy-down options may need to be considered.
Carriers will likely offer less flood limits - excess flood coverage options
may need to be considered. Underwriters likely to re-focus attention on values and underwriting data
reported on Property Schedule of Values. Accounts that have had losses will need to present a summary of locations that have been damaged.

Questions????
THANK YOU!

Tina Paquet – Assistant Director of ARA, Risk Management Division, City of Houston.
Robert Waggoner – Senior Vice President, Public Entity Division, McGriff, Seibels & Williams, Inc.
Johnny Fontenot – Executive Vice President, McGriff, Seibels & Williams, Inc.
Emma Garner – Executive Vice President, CRC Swett
Matthew Yallop – Director, Besso Ltd.