Embed Size (px)
Citation preview
CryptoCompare Exchange Benchmark Report February 2021
Mission Statement
Our Exchange Benchmark was established in 2019 as a tool to bring clarity to the cryptoasset exchange sector by providing a framework for assessing risk, bringing transparency and accountability to a complex and rapidly evolving market. It has since become an industry standard for evaluating exchanges. Our methodology has since expanded and is now approached in several dimensions using a comprehensive data set, covering more than 160 exchanges across 8 categories of evaluation:
● Legal/Regulation● KYC/Transaction Risk● Data Provision● Security● Team/Exchange● Asset Quality/Diversity● Market Quality ● Negative Events Penalty
We adopt an innovative ranking methodology that utilises a combination of qualitative and quantitative metrics. We assign a grade to each exchange which helps identify the lowest risk exchanges in the industry. The Benchmark is backed by thousands of research hours and covers 68 qualitative and quantitative metrics.
2
What do the grades mean?
The Exchange Benchmark ranks exchanges from AA-E. We classify a Top-Tier exchange as any in the AA-B bracket and Lower-Tier exchanges as those graded C-E. Exchanges in the Top-Tier meet our minimum threshold for acceptable risk.
What the grading is not
This grading does not connote overall superiority, rather represents a means of ranking exchanges according to risk. The Exchange Benchmark does not serve as a guide to which platform is superior for trading, nor the reliability of reported volumes.

CryptoCompare Exchange Benchmark Report February 2021
Who is the Benchmark for?
3
Exchanges looking to conduct more thorough competitor analysis, understand industry trends and areas for competitive parity.
Funds looking to assess counterparty risk and opportunities in digital asset markets.
Exchange service providers such as insurers, custodians and compliance services who want to gain a better understanding of the industry and identify potential customers.
Regulators who are looking to develop policy, or better understand the global digital asset landscape.
Investors and Traders who want to identify the least risky venues for trading.

CryptoCompare Exchange Benchmark Report February 2021
Thanks to Our Collaborators
4

CryptoCompare Exchange Benchmark Report February 2021 5
CryptoCompare Exchange Benchmark Report February 2021
4.E CipherTrace Interaction Risk Score
Our ranking also awards points to exchanges according to CipherTrace’s Interaction Risk Score. This score classifies exchanges according to the percentage of its transactions which are conducted with entities deemed high risk. These are entities which are:
● Criminal● Dark Market● Dark Vendor● Gambling● High Risk Exchange● Malware● Mixer● Ransomware● OFAC Sanctioned Addresses
Accordingly, an exchange where 0-10% of its transactions are conducted with high risk entities, is awarded 4 points. An exchange where 10-25% of its transactions are conducted with high risk entities is awarded 2 points, and an exchange where more than 25% of its transactions are conducted with high risk entities is awarded 0 points.
CipherTrace Classification Points
0-10% 4
10-25% 2
>25% 0
6

CryptoCompare Exchange Benchmark Report February 2021
Security
7
of exchanges possess an ISO 27001 or SOC2 certificate
of exchanges state they hold more than 95% of crypto in cold wallets
of exchanges have been hacked in the last year
of exchanges scored below an A in our web security test
of exchanges offer 2-factor authentication
of exchanges utilise the services of a custody provider to store user assets
MORE THAN 66%
4% 7%
15% 95% 12%

CryptoCompare Exchange Benchmark Report February 2021
Contents
1. Key Highlights2. Ranking Methodology Overview3. Results
a. Exchange Ranking Toplistb. Macro Findingsc. Category Stats
4. Contact5. Appendix
a. Appendix A - Due Diligence Methodology b. Appendix B - Market Quality Methodologyc. Appendix C - Points and Grading Summary
8

Key Highlights
9

CryptoCompare Exchange Benchmark Report February 2021
Key Highlights
10
Lowest Risk Exchanges. Coinbase, Gemini, Bitstamp, Kraken, itBit and Luno are the lowest risk exchanges with AA ratings.
Top-Tier Exchanges Gained 13% Market Share in the Last 4 Months. From October 2020 to January 2021 (based on July 2020 grades) Top-Tier exchange market share grew from 61% ($347bn) to 74% ($1.41tn). Based on the most recent grading, market share for January 2021 would amount to 85% for Top-Tier exchanges.
The Number of Top-Tier Exchanges Increased. 84 exchanges have met the threshold for Top-Tier status in the latest update (vs 68 in July 2020). Exchanges have increased their operational standards and transparency due to regulatory requirements and a competitive marketplace.
Fewer Hackings and Improved Security. 20% of exchanges state that they hold more than 95% of crypto in cold wallets (vs 15% in July 2020). 1% of exchanges have been hacked in the last year (vs 4% as of July 2020). 18% of exchanges use a third party custody provider to store user assets, up from 12% in July 2020 and 9% in our Q4 2019 Benchmark.
The methodology and rankings themselves are free and transparent and serve as a tool for market participants to choose the lowest risk platforms. The underlying data and custom research is also available to those looking to gain deeper insights. Get in touch by contacting us at [email protected]
Data Transparency Has Increased. 44% of exchanges offer the ability to query full historical trade data via a public API endpoint (vs 37% in July 2020). 81% of exchanges offer at least a level 2 order book via REST or Websocket connection (vs 71% in July 2020)
KYC Stringency and Transaction Monitoring Has Increased. 25% of exchanges use an external on-chain transaction monitoring provider (vs 16% in the July 2020 Benchmark). 33% of exchanges were rated as having poor or inadequate KYC programs according to CipherTrace’s KYC grading system (vs 44% in July 2020).
Legal/Regulation. 9% of exchanges formally offer some form of cryptocurrency insurance (vs 5% in July 2020). 37% of exchanges are registered as an MSB or possess a crypto exchange license (vs 30% in July 2020).

CryptoCompare Exchange Benchmark Report February 2021
What has changed since the last ranking?
CipherTrace Transaction Risk Scores
In the previous Benchmark Update (July 2020), CipherTrace provided a transaction risk score based on the percentage of exchange transactions with higher-risk entities per exchange. However, this has now been updated to a more representative methodology which takes into account the % of transactions received and sent to higher risk entities. The latter can be controlled by the exchange whereas the former cannot.
Exchange Removals and Additions
17 previously unranked exchanges have received new grades following integration on CryptoCompare. Several exchanges have closed down or no longer trade, and have therefore been removed from the Benchmark.
11

Ranking Methodology Overview
12
CryptoCompare Exchange Benchmark Report February 2021
Methodology Overview - Scope
13
Scope and Objectives
We combine 68 qualitative and quantitative metrics to assign a grade to over 160 active spot exchanges. Each metric is converted into a series of points based on clearly defined criteria. Metrics were categorised into several buckets (see p.14) and distributed fairly to arrive at a final robust score, ensuring that no one metric overly influences the overall exchange ranking.
Market Quality
We measure the market quality of each exchange using a combination of 5 metrics (derived from trade and order book data) that aim to measure the cost to trade, liquidity, market stability, behaviour towards sentiment, and “natural” trading behaviour. Exchanges were rated based on a combination of the most liquid BTC and ETH markets. Points were distributed using a rating system that compares each exchange with its peers for each metric, on each applicable market. We then arrive at an overall ranking that is robust across several markets for each exchange.
The market quality points should be considered most instructive below a minimum threshold - with those scoring below 7.5 considered higher risk.
*For further information on our methodologies, please contact [email protected]
Grading
A grading system was implemented to assign each exchange a grade (AA, A, BB, B, C, D, E, F) based on its total cumulative score out of 100. Top-Tier exchanges refer to those that have scored at least 45 points (B and above).

CryptoCompare Exchange Benchmark Report February 2021
Methodology Overview - Ranking Components
The overall ranking consists of the following components and subsequent weightings:
1. Legal/Regulation2. Data Provision3. Security4. Team/Exchange5. Market Quality6. KYC/Transaction Risk7. Asset Quality/Diversity8. Penalty Factor: Negative Events
(-5%)
14
8. Negative Events Penalty-5.0%

CryptoCompare Exchange Benchmark Report February 2021
*We have made our best effort to collect data accurately, but appreciate that certain data points might be outdated or incomplete due to lack of public availability. We are committed to updating and correcting any data point proven to be outdated or incorrect on a timely basis, and will update our Exchange Ranking accordingly.
Methodology Overview - Data Collection
15
Market Quality(Order Book)
Time Period: 1 January 2021 - 31 January 2021
Sources: Exchange REST APIs (Order Book)
Method: REST API polling snapshots
Frequency: ~ Every 10 mins
Due Diligence
Time Period: 01 Dec 2020- 15 Feb 2021
Sources: World Bank (2019 Data)Transparency International (2019)LinkedIn ProfilesCrunchbase ProfilesExchange WebsitesGithub/Other API DocumentationCompanies HouseMedia websites (Coindesk, Bloomberg)Various MSB RegistriesCipherTrace (Jan 2021)FlipsideCrypto (Jan 2021)
Method: Manual Data Collection, Google Form, Collaborators
Market Quality (Trade)
Time Period: 1 January 2021 - 31 January 2021
Sources: Exchange REST APIs (Trade Endpoint)
Method: REST API polling on exchanges
Frequency: At exchange rate limits
Markets: BTC-USD, BTC-USDT, BTC-ETH, BTC-KRW, BTC-JPY, ETH-USD, ETH-USDT, ETH-KRW, ETH-JPY…+OTHER SIGNIFICANT FIAT MARKETS
Number of Exchanges: 100+

CryptoCompare Exchange Benchmark Report February 2021
Methodology Overview - Components I.
16
Security
● Formal Security Certificate● SSL Rating● Use of a Cold Wallet● % Funds in Cold Wallets● Geographical Distribution of Keys● 2FA● Custody Provider● Number of Hacks (within 2 years)● Any Recent Hacks (within 1 year)
Legal/Regulatory
● Legal Company Name● Registered as an MSB/Licensed● Part of Regulatory/Industry Group● Insurance Against Losses (Fiat,
Crypto, Self-Insured)● Country Rating● Cryptocurrency Regulatory
Stringency● Sanctions Compliance Statement● PEP Compliance Statement● Chief Compliance Officer +
Experience
KYC/Transaction Risk
● Has Market Surveillance System in Place
● Conducted Internally or via a Formal External Provider
● On-chain Transaction Monitoring● Strict KYC/AML Procedures● CipherTrace KYC Score● CipherTrace Transaction Risk
Score

CryptoCompare Exchange Benchmark Report February 2021
Methodology Overview - Components II.
17
Team/Exchange
● Identity of CEO, CTO, COO, CFO, CCO, CISO (or equivalent)
● Education - Masters Degree/Formal Post-Graduate Certification
● Experience in Years● Exchange Age Since Launch● Funding by Large VC or
Non-Crypto Established Company● Funding by Smaller VC Companies
Data Provision
● API Average Response Time (ms)● Ability to Query Historical Trades● Historical Candlestick Data● Granularity of Candlestick Data● Offers Websocket Connection OR
FIX Connection● Provides Order Book API Endpoint● Maximum Order Book Level
Offered● API Rate Limits
Asset Quality/Diversity
● Average Asset Quality based on FCAS scores by Flipside
● Number of Assets Available on the Platform
CryptoCompare Exchange Benchmark Report February 2021
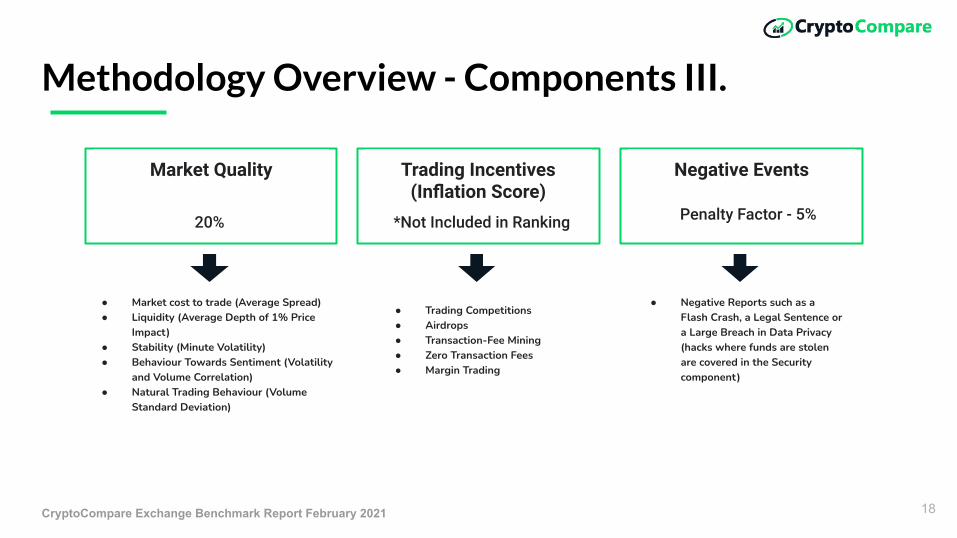
Methodology Overview - Components III.
18
Trading Incentives (Inflation Score)
● Trading Competitions● Airdrops● Transaction-Fee Mining● Zero Transaction Fees● Margin Trading
Market Quality
● Market cost to trade (Average Spread)● Liquidity (Average Depth of 1% Price
Impact)● Stability (Minute Volatility)● Behaviour Towards Sentiment (Volatility
and Volume Correlation)● Natural Trading Behaviour (Volume
Standard Deviation)
Negative Events
● Negative Reports such as a Flash Crash, a Legal Sentence or a Large Breach in Data Privacy (hacks where funds are stolen are covered in the Security component)

CryptoCompare Exchange Benchmark Report February 2021
Methodology Overview - Aggregation and Grading
Scores from each category were aggregated to form a total cumulative score. The maximum score is 100.
19
Threshold Grade
Above 75 AA
65-75 A
55-65 BB
45-55 B
35-45 C
20-35 D
10-20 E
<10 F
Category Maximum Points
Security 15
Legal 15
KYC/Transaction Risk 15
Management/Company 15
Data Provision 15
Asset Quality/Diversity 5
Market Quality 20
Total Cumulative Points Available
100
Results
20

CryptoCompare Exchange Benchmark Report February 2021
Exchange Ranking Toplist
21
ExchangeKYC/Transaction
RiskQuality/Diversity of
AssetsLegal/Regulation Data Provision Security Team/Exchange
Negative Reports
Market Quality
Total Grade
Coinbase 13.3 4.8 12.9 8.8 15.0 13.7 0.0 17.0 85.31 AA
Gemini 15.0 4.5 12.5 10.6 13.8 12.1 0.0 14.4 82.87 AA
Bitstamp 15.0 4.3 11.4 10.3 11.8 12.3 0.0 15.4 80.54 AA
Kraken 9.9 4.8 11.4 10.6 10.9 13.7 0.0 14.6 75.86 AA
itBit 13.3 4.0 10.7 10.6 10.7 14.7 0.0 11.6 75.60 AA
Luno 9.9 4.0 11.8 11.1 12.0 12.6 0.0 14.0 75.38 AA
Liquid 13.3 3.5 13.6 11.1 4.3 13.9 0.0 14.0 73.76 A
Cex.io 11.1 4.8 10.4 10.6 12.5 11.0 0.0 13.2 73.54 A
LMAX Digital 13.3 4.0 11.4 10.3 10.7 11.0 0.0 12.4 73.11 A
Bitfinex 13.6 3.5 9.6 11.4 7.1 10.7 0.0 15.6 71.57 A
eToroX 11.6 4.5 10.7 10.1 11.8 12.3 0.0 10.4 71.45 A
bitFlyer 11.9 4.0 14.6 8.5 5.8 11.5 0.0 14.8 71.27 A
Binance 11.9 3.5 7.9 11.1 11.0 8.8 0.0 16.0 70.25 A
Currency.com 13.3 5.0 8.2 11.1 10.6 9.4 0.0 12.6 70.18 A
Bittrex 15.0 3.5 13.2 8.0 7.1 10.2 0.0 12.8 69.82 A
OKCoin 9.9 4.8 12.1 11.1 7.0 12.9 0.0 12.0 69.74 A
AAX 13.6 4.8 10.4 12.2 9.6 6.7 0.0 12.2 69.43 A
GOPAX 11.9 4.0 8.9 11.4 10.8 8.6 0.0 13.6 69.23 A
Huobi Global 10.6 3.5 7.9 8.5 9.2 11.8 0.0 17.6 69.04 A
Bitpanda Pro 13.3 4.3 7.5 11.1 8.6 11.0 0.0 12.8 68.59 A
FTX 8.5 5.0 6.4 12.9 10.3 7.2 0.0 16.4 66.78 A

CryptoCompare Exchange Benchmark Report February 2021
Top-Tier Volumes - Grades B and Above
22
CryptoCompare has established the notion of Top-Tier volume whereby investors can segment the market into higher and lower risk volumes.
We currently define Top-Tier volume as volume derived from exchanges scoring a B and above.
This equates to a total of 84 exchanges (vs 68 in the July 2020 Benchmark) that we have rated Top-Tier for the current review.
of total volume was
from Top-Tier
exchanges in January
2021 based on
updated grading
85%

CryptoCompare Exchange Benchmark Report February 2021
Top-Tier Exchanges Gained 13% Market Share
Top-Tier Exchanges Gained 13% Market Share
Top-Tier Exchanges (based on the July 2020 Benchmark Grading) have increased their market share from 61% ($347bn) in Oct-2020 to 74% ($1.41tn) in Jan 2021 as both retail and professional traders utilized lower risk exchanges during the current Bitcoin bull market.
However, based on the most recent ranking update the proportion of Top-Tier exchange volume in Jan 2021 would be 85% to reflect the increase in the number of Top Tier exchanges meeting the minimum threshold - 68 in July 2020 vs 84 in current update.
Exchange Standards Have Improved Due to Regulatory Requirements and a Competitive Marketplace
These standards involve toughened KYC and transaction monitoring requirements for AML compliance, improved security practices, and increased transparency in terms of the data provision.
23
Category Stats
24

CryptoCompare Exchange Benchmark Report February 2021
Regulation/Legal
25
of exchanges are registered as an MSB or possess a crypto exchange license (vs 30% in July 2020)
of exchanges do not openly reveal the legal entities associated with their exchange (vs 8% in July 2020)
of exchanges formally offer some form of cryptocurrency insurance (vs 5% in July 2020)
of exchanges informally insure users in the case of breach (insurance fund) - (vs 2% in July 2020)
3%
7% 37%
9%

CryptoCompare Exchange Benchmark Report February 2021
KYC/Transaction Risk
26
of exchanges impose strict ID verification requirements on users (vs 56% in July 2020)
of exchanges were found to send funds to higher risk entities for more than 4% (High Risk Range) of transactions according to CipherTrace
of exchanges use an external on-chain transaction monitoring provider (vs 16% in July 2020)
of exchanges formally engage with an external trade monitoring provider (vs 4% in July 2020)
of exchanges were rated as having poor or inadequate KYC programs according to CipherTrace (vs 44% in July 2020)
ONLY
*For a more detailed explanation of the metrics in the below charts, please see Page 62: 4. KYC/Transaction Risk. These metrics have been sourced using CipherTrace’s proprietary risk assessment dataset.
25% 66%
5% 33%
28%

CryptoCompare Exchange Benchmark Report February 2021
Security
27
of exchanges possess an ISO 27001 or SOC2 certificate or similar (vs 7% in July 2020)
of exchanges state they hold more than 95% of crypto in cold wallets (vs 15% in July 2020)
of exchanges have been hacked in the last year (vs 4% as of July 2020) of exchanges scored
below an A in our web security test (vs 66% in July 2020)
of exchanges offer 2-factor authentication (vs 95% in July 2020)
of exchanges utilise the services of a custody provider to store user assets (vs 12% in July 2020)
1% 10%
20% 97% 18%
60%
CryptoCompare Exchange Benchmark Report February 2021
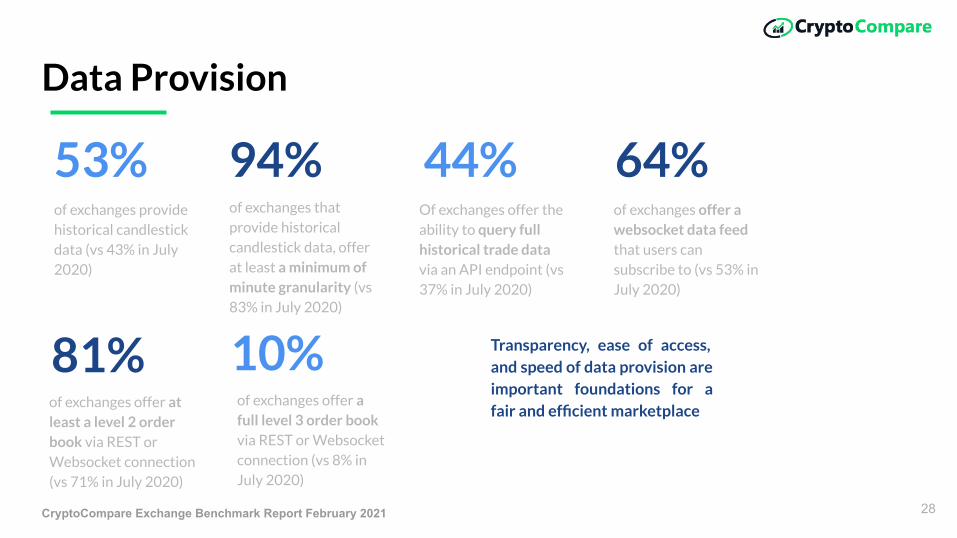
Data Provision
28
of exchanges provide historical candlestick data (vs 43% in July 2020)
of exchanges that provide historical candlestick data, offer at least a minimum of minute granularity (vs 83% in July 2020)
Of exchanges offer the ability to query full historical trade data via an API endpoint (vs 37% in July 2020)
of exchanges offer a websocket data feed that users can subscribe to (vs 53% in July 2020)
of exchanges offer at least a level 2 order book via REST or Websocket connection (vs 71% in July 2020)
of exchanges offer a full level 3 order book via REST or Websocket connection (vs 8% in July 2020)
Transparency, ease of access, and speed of data provision are important foundations for a fair and efficient marketplace
53% 94% 44% 64%
81% 10%
CryptoCompare Exchange Benchmark Report February 2021
ContactCryptoCompare Research
Team
Constantine Tsavliris
Jimena Leon
Special thanks to the CryptoCompare content and support teams for their data collection assistance.
29
The Benchmark is backed by thousands of research hours and covers 68 qualitative and quantitative metrics. Updated twice annually to reflect the fast-changing cryptoasset landscape, we work hard to ensure the accuracy of all the data comprising the Benchmark. If there is any part of the Benchmark that you would like to discuss, please reach out to us.
Speak to us if you are interested in any of the following:

Appendix
30

CryptoCompare Exchange Benchmark Report February 2021
Appendix Contents
31
Appendix A - Due Diligence Methodology1. Trading Incentives2. Security3. Legal/Regulation4. KYC/Transaction Risk5. Team and Company6. Data Provision7. Asset Quality/Diversity8. Negative Events
Appendix B - Market Quality Methodology1. Cost to Trade2. Liquidity3. Stability4. Behaviour Towards Market Movements5. “Natural” Market Behaviour
Appendix C - Ranking Points System Summary

Appendix A - Due Diligence Methodology
32
CryptoCompare Exchange Benchmark Report February 2021
Qualitative Data Metrics
33
1. Trading Incentives2. Security3. Legal/Regulation4. KYC/Transaction Risk5. Team and Company6. Data Provision7. Asset Quality/Diversity8. Negative Events
Data Collection. Qualitative data was collected and/or updated manually between 01 Dec - 15 Feb 2021. The metrics within each category were collected from a variety of sources, which include but are not limited to: the World Bank (2019 Data), LinkedIn Profiles, Crunchbase Profiles, Twitter, Exchange Websites, Github API Documentation, Companies Houses, Media websites (Coindesk, Bloomberg), and Various MSB Registries.
An effort was made to collect each metric as accurately as possible. However, we acknowledge that due to restrictions in terms of public data availability and transparency from certain exchanges, data may be outdated or incomplete. For those who are unhappy with the current ranking, or feel that any data is not up to standard we are committed to providing the most reliable data set and will ensure that any errors are dealt with quickly and the exchange ranking updated accordingly.

CryptoCompare Exchange Benchmark Report February 2021
1. Trading Incentives
Exchanges implement various incentive schemes for several reasons, which might include: attracting additional users to the platform, incentivising trading to drive fee income, and raising the profile of the exchange or of certain coins via high volumes to top the volume rankings tables.
Incentive Schemes. In the context of the current study, we have compiled a list of five main incentive schemes that we believe encourage additional trading and are often implemented by several exchanges:
A. Trading CompetitionsB. AirdropsC. Transaction-Fee MiningD. Zero Transaction FeesE. Margin Trading
Inflation Score. The presence of any of these incentive schemes does not penalise exchanges in the current ranking system, but only serves as a means of identifying the extent of potential “volume inflation” relative to volumes without such models in place. The reason for this is that incentive schemes do not necessarily imply a lower quality exchange. Each metric acts as a flag for “inflated volume” and contributes to a final “inflation score”.
34

CryptoCompare Exchange Benchmark Report February 2021
1.A Trading Competitions
Trading competitions are sometimes implemented by exchanges to attract more users to the platform, to incentivise trading and hence drive fee income, or to raise the profile of the exchange via volume rankings.
The exchange will reward participants with cryptocurrencies such at BTC or ETH or other lower profile tokens based on their performances in each competition. Bithumb for example, has implemented a number of events known as “Super Airdrop Festivals” in the past, which have had a clear effect on trading volumes for the duration of each competition.
Competitions vary considerably by structure, and by exchange, and can result in erratic trading behaviour. Once a competition is over, this can cause a drop in volumes to “normal” levels.
Offering trading competitions does not penalise exchanges in our current ranking system, however their presence is used to flag potential “volume inflation”. We add 5 points to the current “inflation score” if a competition has occurred in the last year. It should be noted that this metric does not serve to detect current inflation given that a competition may not necessarily be ongoing, but rather serves as an indication of potential and past inflation as a result of competitions.
Competitions Inflation Points
YES 5
NO 0
35

CryptoCompare Exchange Benchmark Report February 2021
1.B Airdrops
An airdrop is a token distribution mechanism in which free tokens are deposited into a users wallet based on several requirements. Most airdrops are deposited to users based on their holdings of a particular cryptoasset such as BTC at the time of a designated “snapshot” of holdings. However, some airdrops are only offered to users provided that they trade a minimum quota of a given market volume per day.
Airdrops can therefore be used as an incentive mechanism. We assume that exchanges that enable the airdrops of various tokens - whether as a competition reward or as a promotional event - will encourage users to trade on markets they may not have engaged with, had there not been an airdrop offering.
For this reason, we designate 2.5 “inflation points” to exchanges that offer airdrops. We do not penalise exchanges for the presence of airdrops in our current ranking system.
Offers Airdrop Events
Inflation Points
YES 2.5
NO 0
36

CryptoCompare Exchange Benchmark Report February 2021
1.C Transaction-Fee Mining
An exchange that implements a transaction-fee mining model, will distribute their proprietary exchange token in exchange for trading fees. In other words, they offer up a trading fee rebate, paid back in the form of their own token.
This is very similar to an ICO in terms of structure, as users pay fees in the form of BTC, ETH, USDT etc. and receive a specific quantity of exchange tokens in return.
This trading incentive scheme first rose to prominence in mid-2018 and was used by exchanges such as FCoin, BigONE and CoinBene whose volumes topped exchange volume rankings overnight as a result.
The more trading that occurs, the more tokens can be earned by individual traders. There is therefore an incentive to trade more, given that these tokens have particular properties.
This metric is therefore used as an additional proxy for “exchange inflation”. Given the clear impact on volumes that has been seen with this model, exchanges that operate under this model will be assigned an additional 15 inflation points.
Transaction Fees
Implements a Transaction-Fee Mining Model Inflation Points
YES 15
NO 0
37

CryptoCompare Exchange Benchmark Report February 2021
1.D Zero Transaction Fees
Several exchanges might implement a zero trading fee model, the ultimate aim of which is to incentivise additional trading activity and attract users. With fees eliminated, the costs of trading are effectively eliminated and therefore traders are incentivised to trade more.
It is common for exchanges to offer a zero fee model to market makers, whose presence adds important liquidity to a given market. This effectively makes a market more active and stable. However, for market takers this is far less common. Hence, in our model, zero transaction fee models refer to fees offered to takers rather than makers.
Given that transaction fees are eliminated, an exchange must earn revenue by some other means which may include charging listing fees for new coins, offering margin trading and earning interest on leveraged funds, or implementing paid marketing campaigns for certain projects.
In our ranking points system, exchanges are not penalised for offering zero fees. However, a zero fee model will be reflected in a general “trading inflation score” for each exchange.
Implements a Zero-Fee Trading Model
Inflation Points
YES 5
NO 0
38
CryptoCompare Exchange Benchmark Report February 2021
1.E Margin Trading
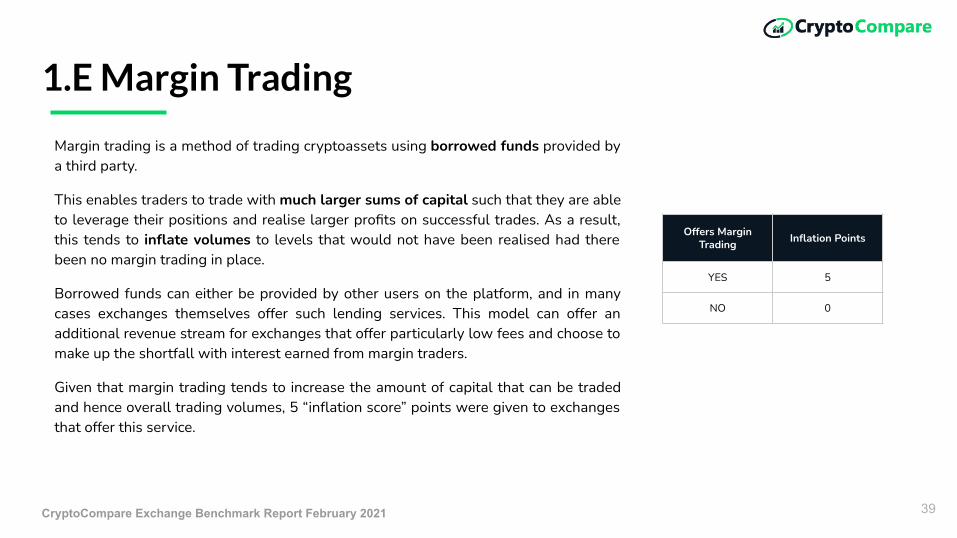
Margin trading is a method of trading cryptoassets using borrowed funds provided by a third party.
This enables traders to trade with much larger sums of capital such that they are able to leverage their positions and realise larger profits on successful trades. As a result, this tends to inflate volumes to levels that would not have been realised had there been no margin trading in place.
Borrowed funds can either be provided by other users on the platform, and in many cases exchanges themselves offer such lending services. This model can offer an additional revenue stream for exchanges that offer particularly low fees and choose to make up the shortfall with interest earned from margin traders.
Given that margin trading tends to increase the amount of capital that can be traded and hence overall trading volumes, 5 “inflation score” points were given to exchanges that offer this service.
Offers Margin Trading Inflation Points
YES 5
NO 0
39

CryptoCompare Exchange Benchmark Report February 2021
2. Security
A. Formal Security CertificateB. SSL RatingC. Use of a Cold WalletD. % Funds in Cold WalletsE. Geographical Distribution of KeysF. 2FA
G. Custody Provider
H. Number of HacksI. Any Recent Hacks
40
Exchanges are key targets for cyber security attacks. They deal with sensitive user data and private keys, which exchanges must protect. Although security is one area where less transparency can mean more safety, we have curated a series of high level metrics that we believe help to highlight exchanges that have paid particularly close attention to platform and user security.

CryptoCompare Exchange Benchmark Report February 2021
2A. Formal Security Certification
Security Certificate: There are two primary certifications (or attestation standards) we focus on that are used to attest to a company’s effectiveness at controlling and protecting the data they use. In North America, this is the SOC 2, which reports on controls at a Service Organization relevant to security, availability, processing integrity, confidentiality or privacy. Its purpose is to help ensure that a company has met established security criteria and is adequately protected against unauthorized access.
41
Formal Security Certification Security Points
YES 5
IN PROGRESS 1.5
NO 0
At an international level, this is the ISO 27001, which is designed to give a best practice framework for implementing an information security management system at an organization. Both standards are internationally recognised. We award 5 points for possessing formal standards and 1.5 points for those in the process of obtaining them.
CryptoCompare Exchange Benchmark Report February 2021
2B. SSL Rating
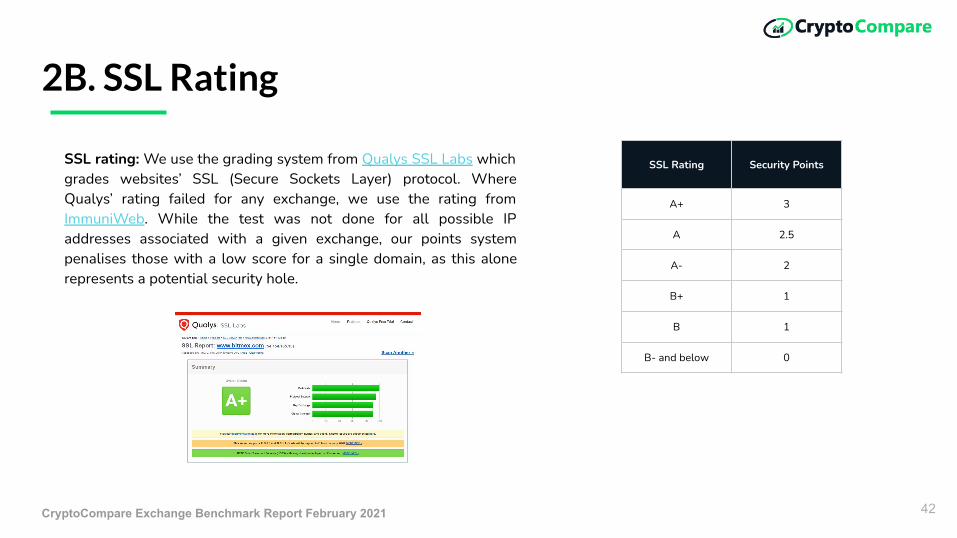
SSL rating: We use the grading system from Qualys SSL Labs which grades websites’ SSL (Secure Sockets Layer) protocol. Where Qualys’ rating failed for any exchange, we use the rating from ImmuniWeb. While the test was not done for all possible IP addresses associated with a given exchange, our points system penalises those with a low score for a single domain, as this alone represents a potential security hole.
42
SSL Rating Security Points
A+ 3
A 2.5
A- 2
B+ 1
B 1
B- and below 0

CryptoCompare Exchange Benchmark Report February 2021
2C & D. Cold Wallet Storage and Ratio
43
Offline Storage: Whether an exchange makes use of offline - or ‘cold’ - storage, widely considered a more secure means of storing cryptoassets (i.e. cryptoasset private keys). Cold storage is considered more secure as keys are siloed away from internet access, with most historical hacks having taken place via hot wallets.
Offline Storage Security Points
YES 2
NO 0
Offline Storage Security Points
100% Cold 3
Majority Cold 2
Some Cold 1
No Evidence 0
Cold Wallet Ratio: The ratio of an exchange’s cold to hot wallets, i.e. how many of its cryptoassets are stored online vs. offline. We assume that the higher the ratio the more secure an exchange. For exchanges that have stated a specific percentage, a scaling factor of 3 has been applied.
For example, if an exchange states 90% of funds are stored in cold wallets, the points awarded will be 0.9 * 3 = 2.7.
If an exchanges states that the majority of funds are in cold wallets, a score of 2 is awarded. If there is some indication that a cold wallet is used, a score of 1 is awarded.

CryptoCompare Exchange Benchmark Report February 2021
2E/F/G. Geographical Key Distribution, 2FA and Custody Provision
E. Geo-Key Distribution: Whether an exchange implements geographical distribution of cryptoasset private keys: we assume that distribution entails greater security. Our assessment is based on the exchange’s own statement of the distribution of keys. We award 1 point for an exchange that distributes its keys.
44
F. 2FA: Whether an exchange offers 2 Factor Authentication for individual account security. A widely-recognised security standard which safeguards customer information, we consider an exchange without 2FA to have a serious security flaw. We award 2 points to an exchange for implementing 2FA.
Geo Distribution Security PointsYES 1NO 0
2FA Authentication Security PointsYES 2NO 0
G. Custody Provider: Whether an exchange makes use of a custody provider to store their cryptoassets. In addition to offering greater security measures, some custody providers such as Bitso, also adhere to ISO 27001 standards.
We assume that in general, the use of a competent custody provider entails a greater standard of security and therefore will score a higher rating. We award 3 points to an exchange that makes use of a custody provider.
Custody Provider Security Points
YES 3
NO 0

CryptoCompare Exchange Benchmark Report February 2021
2H & I. Hacks
Number of hacks/Recent hacks: This refers to whether an exchange has been hacked in its core infrastructure - with funds or vital information extracted. While some exchanges have had social media accounts compromised, this does not form part of this assessment.
Because we are aware that exchanges can improve their infrastructure, we focus primarily on the number of recent hacks - i.e. hacks in the last year, that likely came about as a result of failure to implement industry best practices. We also assume the number of hacks to be significant as those that have been hacked more than once have likely failed to respond to weaknesses in their infrastructure.
We deduct 3 points for an exchange with more than 1 hack in the last 2 years, and deduct 5 points if a hack has taken place in the last year.
45
No. of hacks in 2 years Security Points
More than 1 -3
NO 0
Hacked Recent Security Points
YES -5
NO 0
CryptoCompare Exchange Benchmark Report February 2021
3. Regulatory/Legal
A. Legal Exchange NameB. Country Risk RatingC. Country Cryptocurrency RegulationD. Country Regulatory StringencyE. Registered as an MSB/LicensedF. Part of Regulatory/Industry GroupG. Insurance Against Losses (fiat, crypto, self-insured)H. Sanctions compliance statementI. PEP compliance statementJ. Chief Compliance Officer + Experience
46

CryptoCompare Exchange Benchmark Report February 2021
3.A Legal Exchange Name
It is important that the legal name of each exchange is available publicly. Firstly, this enables the search of relevant company documents, country/regulatory registrations and licenses. It also allows for identification of which legal parties are necessary to file a complaint/legal dispute and who is legally accountable if such an issue arises.
Ultimately, if no legal name can be found it can also be difficult to assess the quality of an exchange, where it is based, or who runs the company.
Therefore, our ranking takes into account whether a legal operating name for each exchange can be found. If so, it is awarded 5 points. If no name can be found, it receives 0 points.
Legal Exchange/Operator Name Found Points
YES 5
NO 0
47

CryptoCompare Exchange Benchmark Report February 2021
3.B Country Risk Rating
A country risk rating is a proxy for the institutional quality of the jurisdiction in which an exchange is based. It provides an indication of the likelihood of corruption as well as how strong a country’s legal systems are. An exchange based in a high quality jurisdiction is subject to the standards and legal strictures of that country and therefore exposes users to a lower level of risk.
Country Risk Ratings are calculated using a combination of data from the World Bank Worldwide Governance Indicators (WGI Ratings), Transparency International, and Euler Hermes Ratings.
The WGI Rating are based on the following six dimensions of governance, which were rescaled to fit a 0-9 scoring format and averaged: “Rule of Law, Regulatory Quality, Government Effectiveness, Political Stability and Absence of Violence/Terrorism, Control of Corruption, Voice and Accountability.” Transparency International ratings are a similar proxy for institutional quality by providing a rating of corruption levels in each major country. This was again rescaled to fit a 0-9 format. Euler Hermes ratings measure the financial and other credit risk factors in each major country. We score each country based on the average of the above ratings providers.
Exchanges operate from various jurisdictions. Our assumption is that the quality of a country’s institutions will influence exchange standards positively i..e. higher quality institutions enforce higher standards upon the businesses based there.
Based on scores 0-9 - we categorise countries into Low Risk, Medium Risk, High Risk, Very High Risk.
48
Risk Rating
Low 9
Medium 6
High 3
Very High 0

CryptoCompare Exchange Benchmark Report February 2021
3.C/D Crypto Exchange Regulation/Regulatory Stringency Rating
Our cryptocurrency exchange regulation rating relates specifically to the existence of regulatory frameworks that crypto exchanges fit into. This captures the possibility that certain jurisdictions may contain high quality institutions but may not necessarily impose specific regulatory requirements on crypto exchanges (e.g. sandbox environments).
Exchanges might generally choose to locate themselves in jurisdictions that have clear rules regarding cryptocurrency exchange activity, or in those that generally impose very lax or non-existent regulations.
We assume that exchanges based in countries that possess clear regulatory frameworks relevant to cryptocurrency exchanges, generally indicates a more compliant calibre of exchange.
We therefore introduce points scored from 0 to 3 to capture the level of regulation or frameworks that crypto exchanges must meet in order to operate, such as obtaining specific licenses or any registration requirements with regulators.
49
Rating Basic Criteria
3 Exchanges are regulated, licensed and must register with the relevant regulatory authority. Legislation is comprehensive.
2 Regulatory stance is a grey area, some crypto exchange legislation, and some form of registration/licensing may be required.
1 Relatively unregulated, minimal registration required with financial/regulatory authorities. Minimal/no legislation.
0 No regulation or crypto exchange legislation to be found
Regulatory stringency ratings are based on how difficult, in general, it is to receive a license (if applicable), or comply with ongoing reporting or registration requirements in each exchange jurisdiction.
This metric attempts to take into account that certain environments may impose relatively more lenient or stringent regulatory frameworks or licensing requirements in place.
The assumption is that the more difficult the registration/licensing/approval requirements (given existing regulation) for any given exchange, the higher the quality of an exchange. E.g. It is difficult to obtain a BitLicense.
We award points from 0-3, with 3 being difficult to comply with, 2 being moderately difficult, 1 being relatively easy, and 0 being not applicable.
Rating Basic Criteria
3 Difficult
2 Medium
1 Relatively Easy
0 Not Applicable

CryptoCompare Exchange Benchmark Report February 2021
3.E Registered as an MSB (Money Services Business)Several exchanges are registered as Money Services Business (MSBs). Although not obligatory in many jurisdictions, exchanges that are registered are normally subject to stricter reporting standards to those that are not.
For instance, those registered with Financial Crimes Enforcement Network (FinCEN) must identify ownership roles and controlling stakes within the company, establish a formal Anti-Money Laundering (AML) policy, enforce strict KYC procedures, and file any suspicious activity reports among several other obligations. Those registered with the Japanese FSA or the UK Financial Conduct Authority (FCA) may have similar reporting obligations.
Although we realise the not all jurisdictions will require this form of registration or may have different standards, we attempt to reward exchanges that are registered with a regulatory authority that maintains oversight over exchange activities. We attempt to provide a general gauge as to which exchanges have reporting obligations to regulatory authorities over how strict or comprehensive those reporting obligations are at this time. We also note that this metric may be biased in favour of fiat to crypto exchanges, given that crypto to crypto exchanges are generally less exposed to such requirements.
We make the assumption that when exchanges are licenced with a regulatory authority, this is also equivalent to being “registered as an MSB”. We do not assume the reverse however.
Ultimately, our main assumption is that exchanges that are registered as MSB or equivalent, are imposed to stricter reporting standards and hence higher operational quality. Exchanges that are registered, regardless of the regulatory authority are designated maximum of 12 points. However we also apply a multiplier (stringency factor from 0-3) to take into account that certain authorities may be more lenient than others.
Registered as an MSB or Equivalent Points
YES 12 * (stringency factor/3)
NO 0
50
CryptoCompare Exchange Benchmark Report February 2021
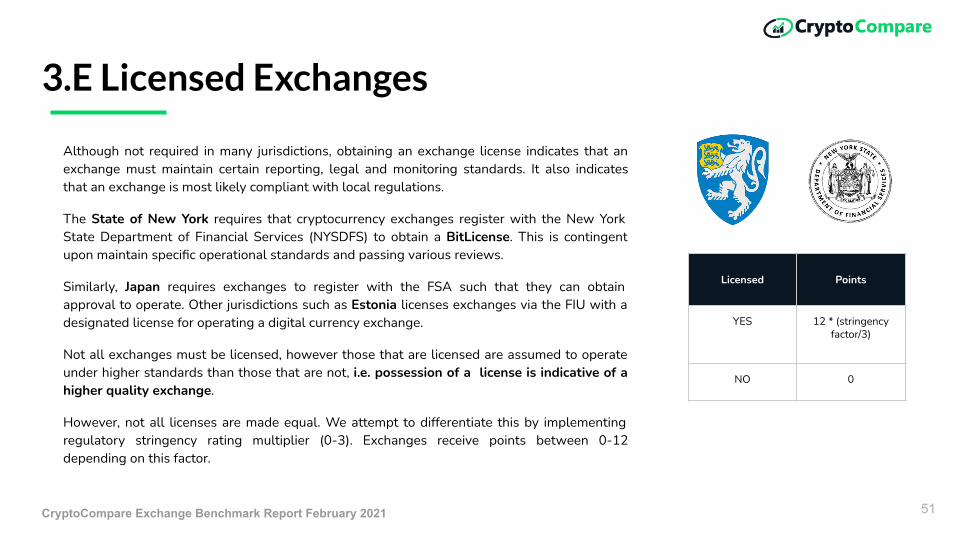
3.E Licensed Exchanges
Although not required in many jurisdictions, obtaining an exchange license indicates that an exchange must maintain certain reporting, legal and monitoring standards. It also indicates that an exchange is most likely compliant with local regulations.
The State of New York requires that cryptocurrency exchanges register with the New York State Department of Financial Services (NYSDFS) to obtain a BitLicense. This is contingent upon maintain specific operational standards and passing various reviews.
Similarly, Japan requires exchanges to register with the FSA such that they can obtain approval to operate. Other jurisdictions such as Estonia licenses exchanges via the FIU with a designated license for operating a digital currency exchange.
Not all exchanges must be licensed, however those that are licensed are assumed to operate under higher standards than those that are not, i.e. possession of a license is indicative of a higher quality exchange.
However, not all licenses are made equal. We attempt to differentiate this by implementing regulatory stringency rating multiplier (0-3). Exchanges receive points between 0-12 depending on this factor.
Licensed Points
YES 12 * (stringency factor/3)
NO 0
51
CryptoCompare Exchange Benchmark Report February 2021
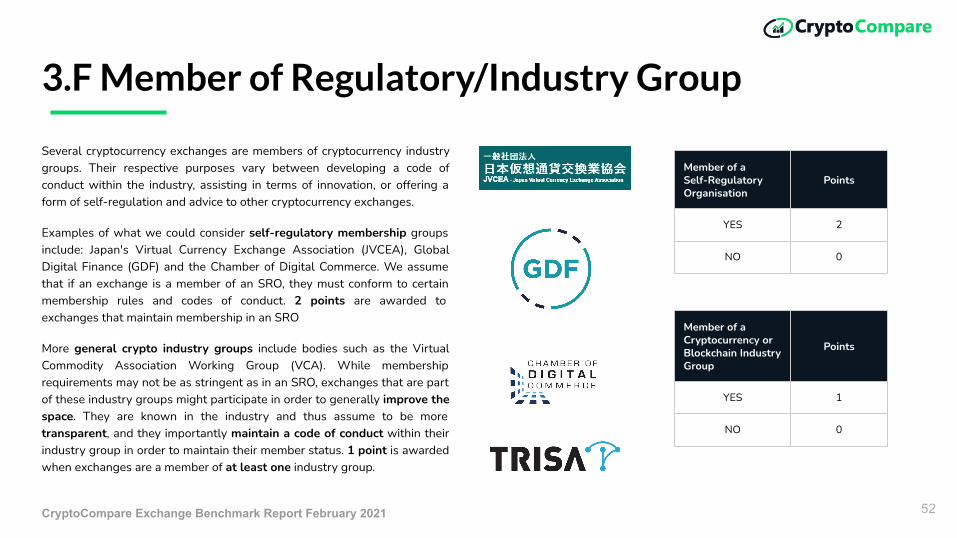
3.F Member of Regulatory/Industry Group
Several cryptocurrency exchanges are members of cryptocurrency industry groups. Their respective purposes vary between developing a code of conduct within the industry, assisting in terms of innovation, or offering a form of self-regulation and advice to other cryptocurrency exchanges.
Examples of what we could consider self-regulatory membership groups include: Japan's Virtual Currency Exchange Association (JVCEA), Global Digital Finance (GDF) and the Chamber of Digital Commerce. We assume that if an exchange is a member of an SRO, they must conform to certain membership rules and codes of conduct. 2 points are awarded to exchanges that maintain membership in an SRO
More general crypto industry groups include bodies such as the Virtual Commodity Association Working Group (VCA). While membership requirements may not be as stringent as in an SRO, exchanges that are part of these industry groups might participate in order to generally improve the space. They are known in the industry and thus assume to be more transparent, and they importantly maintain a code of conduct within their industry group in order to maintain their member status. 1 point is awarded when exchanges are a member of at least one industry group.
Member of a Cryptocurrency or Blockchain Industry Group
Points
YES 1
NO 0
52
Member of a Self-Regulatory Organisation
Points
YES 2
NO 0

CryptoCompare Exchange Benchmark Report February 2021
3.G Insurance Against LossesSeveral exchanges offer insurance for certain funds held in custody by the exchange. It is assumed that for exchanges to seek to offer such a service to their customers, they must first prove that they have met certain standards such that they can solicit the services of an insurer. It also serves as a declaration of taking responsibility for unexpected losses that occur on the part of the exchange.
Exchanges that guaranteed coverage in terms of lost funds will ultimately expose users to a relatively lower risk service than exchanges that are yet to offer such a service. We consider the offering of such a service to be highly indicative of the quality of an exchange.
We grade exchanges based on two main categories of insurance:
1. Formal cybersecurity insurance for cryptoassets2. Self-insured via a “fund” in the case of a hack
We believe that although self-insurance is a way of ensuring clients via their own balance sheet, a public declaration to compensate users in the case of a hack with a pool a funds is one indicator of quality.
We award 3 points for cryptoasset insurance or 1 point for a self insurance fund.
53
Self Insurance Fund Points
YES 1
NO 0
OR
Formal Crypto Insurance Points
YES 3
NO 0

CryptoCompare Exchange Benchmark Report February 2021
3. H/I - Sanctions Compliance/PEP Screening
54
Sanctions Compliance
It is important when assessing exchange quality to note when exchanges comply with sanctions rules and international recommendations. This will vary from country to country, however the ultimate aim is to state compliance with local regulations and to limit funds entering an exchange from any illicit sources.
Although we are unable to check for compliance via public sources, we assume that at the bare minimum that an exchange that states it has complied with certain country restrictions or compliance with UN sanctions lists, indicates at least an intention to comply with certain rules. For this we award 1 point.
PEP Screening
PEP (Politically Exposed Persons) screening refers to screening for a person who serves or has served in a prominent public function (e.g. government), and by virtue of their position and the influence that they may hold, may present a higher risk for potential involvement in corrupt activity. We therefore consider at least a statement suggesting the intention to screen for PEPs as a positive indication of compliance. We therefore award 1 point for this.
Sanctions/Country Restrictions Statement
Points
FOUND 1
NOT FOUND 0
PEP Screening Statement Points
FOUND 1
NOT FOUND 0

CryptoCompare Exchange Benchmark Report February 2021
3.J Chief Compliance Officer
The compliance officer serves an important function in any cryptocurrency exchange, and helps to ensure that any relevant laws are complied with.
We assume that exchanges with an in-house compliance capacity driven by a chief compliance officer will be more capable of ensuring compliance with regulations and other local laws.
We therefore award 1 point if we are able to successfully find the relevant staff member.
If this staff member is found, we also attempt to gauge their competence based on the number of years in compliance or legal roles. We award 1 point for 0-2 years, 2 points for 2-5 years, 3 points for 5-10 years and 4 points for more than 10 years.
55
Professional Experience Points
Years = 0 0
0 < Years< 2 1
2 < Years< 5 2
5 < Years< 10 3
Years>10 4
Chief Compliance Officer Points
FOUND 1
NOT FOUND 0
CryptoCompare Exchange Benchmark Report February 2021
4. KYC/Transaction Risk
56
This category provides an indication of the stringency and effectiveness of KYC procedures, as well as the degree to which exchanges interact with higher risk entities using CipherTrace’s proprietary interaction risk scores. An exchange must also be able to detect and monitor suspicious trading activity; we gauge this based on a trade surveillance score.
The 5 metrics used in this category are summarised as follows:
A. Strict KYC/AML ProceduresB. On-chain transaction monitoringC. CipherTrace KYC Risk ScoreD. CipherTrace Interaction Risk Score (Sent vs
Received)E. Trade Surveillance
About CipherTrace
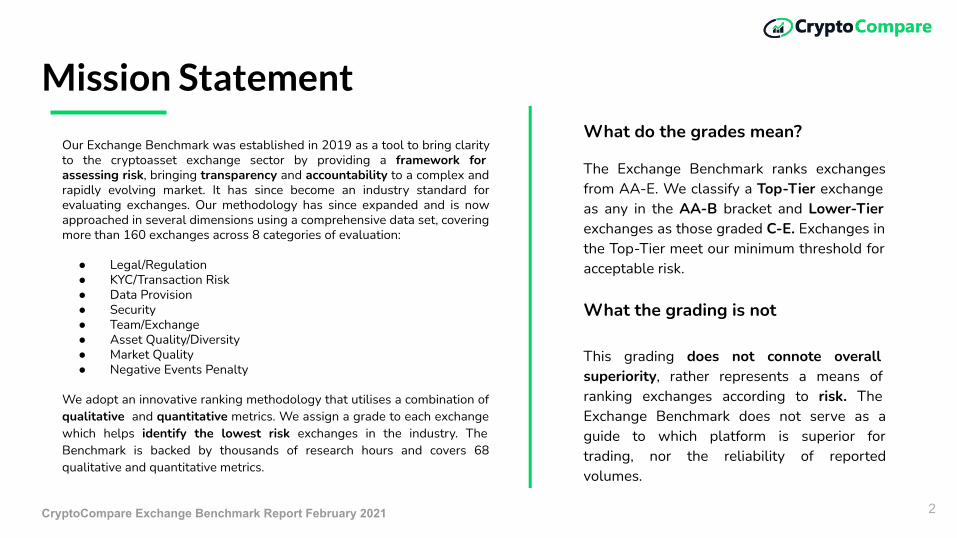
CipherTrace’s anti-money laundering, blockchain analytics, and risk management solutions are powered by advanced cryptocurrency intelligence. Leading exchanges, banks, digital asset businesses, and regulators use CipherTrace to comply with regulation, monitor compliance, and mitigate virtual asset compliance risks

CryptoCompare Exchange Benchmark Report February 2021
4.A Strict KYC/AML
As part of most anti-money laundering regulations, it is important that exchanges identify users before they are able to trade.
Many exchanges now implement strict Know Your Customer (KYC) policies as a means of verifying identity - such that any illicit activity can be monitored and tracked effectively.
As part of our ranking system, exchanges that require identification verification via photo ID before trading is enabled are awarded 5 points, while those that do not are awarded 0 points.
Data collection is based predominantly on terms and conditions pages of various exchanges. If no policy can be found from these pages, the exchange is assumed to implement a policy that does not require identity verification to trade.
Requires Proof of ID to Trade Points
YES 5
NO 0
57
CryptoCompare Exchange Benchmark Report February 2021
4.B On-chain Transaction Monitoring
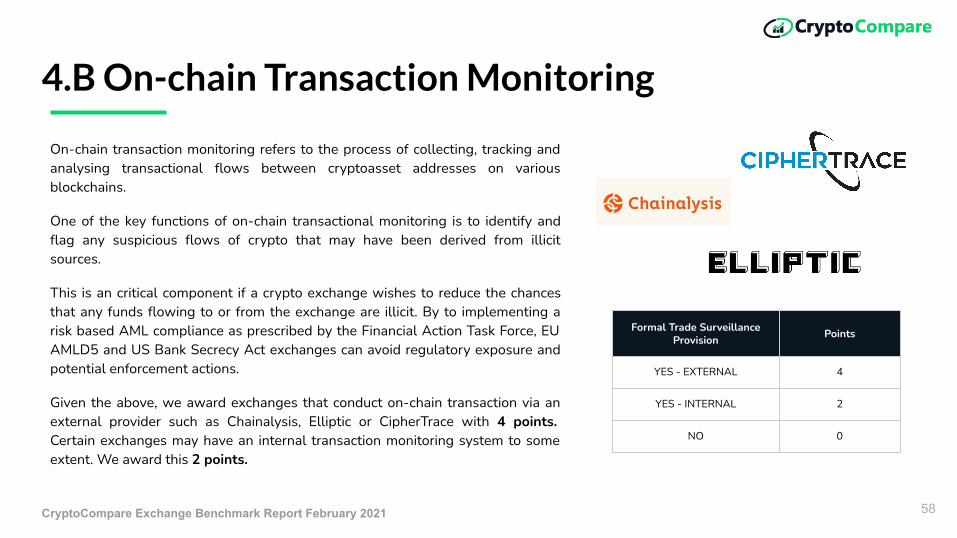
On-chain transaction monitoring refers to the process of collecting, tracking and analysing transactional flows between cryptoasset addresses on various blockchains.
One of the key functions of on-chain transactional monitoring is to identify and flag any suspicious flows of crypto that may have been derived from illicit sources.
This is an critical component if a crypto exchange wishes to reduce the chances that any funds flowing to or from the exchange are illicit. By to implementing a risk based AML compliance as prescribed by the Financial Action Task Force, EU AMLD5 and US Bank Secrecy Act exchanges can avoid regulatory exposure and potential enforcement actions.
Given the above, we award exchanges that conduct on-chain transaction via an external provider such as Chainalysis, Elliptic or CipherTrace with 4 points. Certain exchanges may have an internal transaction monitoring system to some extent. We award this 2 points.
58
Formal Trade Surveillance Provision Points
YES - EXTERNAL 4
YES - INTERNAL 2
NO 0

CryptoCompare Exchange Benchmark Report February 2021
4.C Trade Surveillance
Several high profile exchanges have employed the services of third party trade surveillance providers to monitor and flag any suspicious trading activity. Examples of these providers include Irisium Market Surveillance, Nasdaq SMARTS, Solidus Labs, and NICE Actimize.
In the current exchange ranking model, we make the assumption that exchanges that engage with a formal external market surveillance provider are more transparent and able to detect and report any illicit trading activity, and are therefore of higher quality in terms of trade monitoring.
There are exchanges that implemented their own “internal” trade monitoring systems. Given that this process is not conducted as independently, we assume that it is less indicative of quality than a formal system that is independently administered by a known surveillance provider.
For these reasons, we award 5 points to exchanges that implement external formal trade surveillance provision, and 2.5 points to those that have formally stated the use of their own internal monitoring systems. Exchanges that do not explicitly mention any formal trade monitoring system are awarded 0 points.
59
Formal Trade Surveillance Provision Points
YES - EXTERNAL 5
YES - INTERNAL 2.5
NO 0

CryptoCompare Exchange Benchmark Report February 2021
4.D CipherTrace KYC Classification Score
Our ranking awards points to exchanges according to CipherTrace’s VASP KYC classification for cryptocurrency exchanges. Our ranking translates CipherTrace’s three-tiered colour system for exchanges into points.
CipherTrace’s global team of compliance experts have opened and actively trade on accounts with over 950 Virtual Asset Service Providers to determine their KYC risk level. They evaluate which exchanges require a very strenuous KYC process, requiring little or no KYC at thresholds and flags that have weak KYC.
A Green rating means that a very strenuous amount of KYC is required. ID process and proof of address are required, TAX ID number may be required and a phone call or video chat may be required. We award 4 points for a Green rated exchange.
A Yellow rating means that an exchange will allow deposits and withdrawals up to a specified dollar amount with little to no KYC. CipherTrace deems this risky because structuring and account proliferation can allow money laundering to fly under the radar. Larger amounts may require up to a green level of KYC. We award 2 points for a Yellow rated exchange.
A Red rating means an exchange allows any daily deposit or withdrawal with very minimal to no KYC Usually this involves just an email address, name and perhaps a phone number (which may or may not be real). We award 0 points for a Red rated exchange.
Ratings are based on data for Jan 2021.
CipherTrace Classification Points
Green 4
Yellow 2
Red 0
60
CryptoCompare Exchange Benchmark Report February 2021
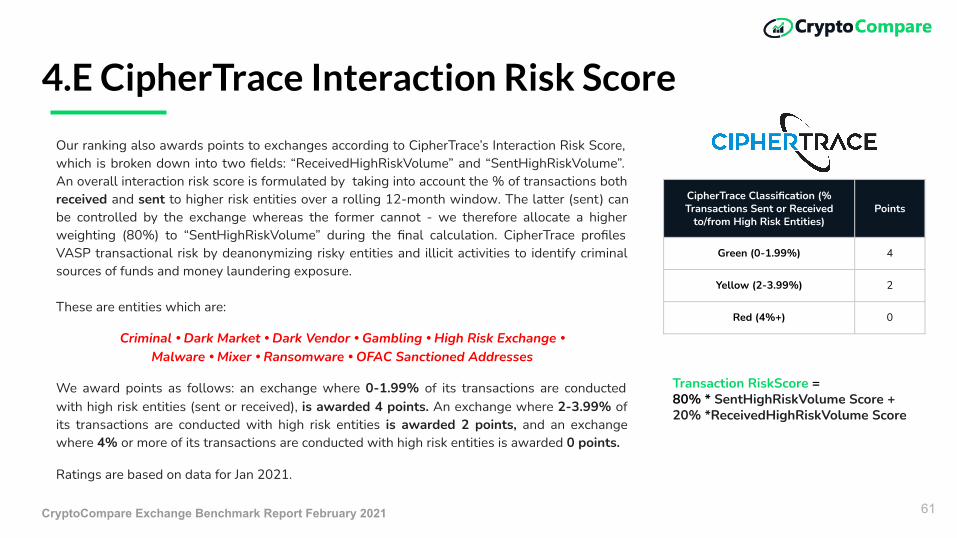
4.E CipherTrace Interaction Risk Score
Our ranking also awards points to exchanges according to CipherTrace’s Interaction Risk Score, which is broken down into two fields: “ReceivedHighRiskVolume” and “SentHighRiskVolume”. An overall interaction risk score is formulated by taking into account the % of transactions both received and sent to higher risk entities over a rolling 12-month window. The latter (sent) can be controlled by the exchange whereas the former cannot - we therefore allocate a higher weighting (80%) to “SentHighRiskVolume” during the final calculation. CipherTrace profiles VASP transactional risk by deanonymizing risky entities and illicit activities to identify criminal sources of funds and money laundering exposure.
These are entities which are:
Criminal • Dark Market • Dark Vendor • Gambling • High Risk Exchange • Malware • Mixer • Ransomware • OFAC Sanctioned Addresses
We award points as follows: an exchange where 0-1.99% of its transactions are conducted with high risk entities (sent or received), is awarded 4 points. An exchange where 2-3.99% of its transactions are conducted with high risk entities is awarded 2 points, and an exchange where 4% or more of its transactions are conducted with high risk entities is awarded 0 points.
Ratings are based on data for Jan 2021.
CipherTrace Classification (% Transactions Sent or Received
to/from High Risk Entities)Points
Green (0-1.99%) 4
Yellow (2-3.99%) 2
Red (4%+) 0
61
Transaction RiskScore = 80% * SentHighRiskVolume Score + 20% *ReceivedHighRiskVolume Score

CryptoCompare Exchange Benchmark Report February 2021
5. Executive Management & Company Quality
The calibre of the executive management team and their level of transparency can be a clear proxy for how well an exchange is managed and accountable to any problems. Furthermore, the age of an exchange can provide us with a second gauge of infrastructure quality based on the assumption that older exchanges may have had the time to develop a more robust technical and legal infrastructure.
The first two metrics relate to identity/transparency, while the subsequent three metrics relate to team/exchange quality:
A. Identity of Executive TeamB. Post-Graduate/Professional DegreesC. Professional ExperienceD. Exchange AgeE. Investment
The assumption here is that the more transparent and experienced/educated an exchange’s executive team, and the older an exchange is, the higher the quality of the exchange.
Finally, in order to expand and develop, many cryptocurrency exchanges have attracted investments from large well-known venture capital firms or prominent technology companies. We assume that the calibre of an investor can provide us with an indication of the quality of the exchange.
62

CryptoCompare Exchange Benchmark Report February 2021
5.A-D Identity of Executive Team, Executive Quality and Exchange Age
A. Identity of Executive Team. The identity of the CEO, CTO, COO, CFO, CCO and CISO is registered in our data set. If no such title is available, the closest match is noted (e.g. VP of Engineering vs CTO). Those responsible for each position are searched for via company pages and LinkedIn. Each Identity that is found will receive 2 points. Those that cannot be found receive 0 points. The maximum points available is therefore 12 points (6 x 2).
Identity of Exec Member (CEO/CTO/CFO/COO/CCO/CISO) Points
Found 2
Not Found 0
63
B. Post-Graduate/Professional Degrees. As a measure of executive quality for each position, those that have attained either a masters-level degree or an additional professional qualification (e.g. CFA) will receive 1 point. Those that have not, will receive 0 points.
C. Professional Experience. This metric assumes that executives with more experience will be better at their respective roles. For the CEO, we gauge the number of years of experience at manager/director to C-level. For the CTO we gauge the number of years of experience in software related roles. For the CFO/COO we measure the number of years of experience in financial/operational roles respectively. For the chief compliance officer, we measure the number of years in legal or compliance roles. Finally for the CISO, we judge based on the number of years of relevant security/software/IT experience. Points are scored using a threshold system.
D. Exchange Age. The number of years of operation since launch can provide us with a measure of infrastructure quality based on the assumption that older exchanges may have had the time to develop a more robust technical and legal infrastructure. Ages are measured in years and scored using a tiered system. Older exchanges are scored higher than younger exchanges.
Post-Graduate/Professional Degree Points
YES 1
NO 0
Professional Experience Points
Years = 0 00 < Years< 2 12 < Years< 5 2
5 < Years< 10 3Years>10 4
Exchange Age Points
Years < 1 11<Years < 3 43 < Years< 5 55 < Years< 7 7
Years>7 10

CryptoCompare Exchange Benchmark Report February 2021
5F. Investment
In order to expand and develop, many cryptocurrency exchanges have
attracted investments from large well-known venture capital firms or
prominent technology companies.
We assume that the calibre of an investor can provide us with an indication of
the quality of the exchange in three ways.
1. High quality investment banks, tech companies or professional VC
firms invest in firms that meet a certain standards.
2. VC firms might invest in companies based on a selection of conditions
or milestones that must be met moving forward. As a result,
exchanges may be required to operate to a certain standard in order
to meet these conditions. Effectively, high quality investors might
impose their quality standards on exchanges that they invest in.
3. Finally, exchanges that receive investments from prominent investors
have larger sums of capital with which to improve their operational
and legal standards.
Large Institutional/Professional VC/Prominent Tech
Investment. We only award points based on investments from
investors that have been operating for a minimum of 5 years and
predominantly invest in non-crypto related industries.
Exchanges that have received investments from these types of
investors are awarded 3 points.
Smaller High Quality Investors. Similar to the above, exchanges
that have received investments from smaller well-known
investors (VC/tech companies) are awarded 1 point.
For each investment category, if no investors could be found,
they recieve zero points.
High Quality Investment Large Investor PointsYES 3NO 0
High Quality Investment Smaller Investor(s) PointsYES 1NO 0
64
CryptoCompare Exchange Benchmark Report February 2021
6. Data Provision
This section assesses the quality of the API of an exchange. The following metrics were collected:
A. API Average Response Time (ms)B. Ability to Query Historical TradesC. Historical Candlestick DataD. Granularity of Candlestick DataE. Offers Websocket or FIX ConnectionF. Provides Order Book API Endpoint
G. Maximum Order Book Level OfferedH. API Rate Limits
65

CryptoCompare Exchange Benchmark Report February 2021
6.A/B Average API Response Time, Ability to Query Historical Trades
A. API Response Time: Defined as the average time taken for a user requesting order book data from an exchange’s public REST API endpoint to fully receive the requested data end to end. This was designed to measure the efficiency of an exchange’s infrastructure.
We measure this across all available exchange markets in 10 minute intervals between 01 Jan- 31 Jan 2021 where possible.
For high frequency traders, this metric is particularly important as it is critical to the ability react to new market information swiftly and to place orders at low latency.
The lower the average response time, the better the rating. This metric was scored using the basic threshold system on the right.
B. Ability to Query Historical Trades: refers to whether an exchange offers any public API endpoints that allow users to query for historical trades at any point in the past.
This is an important metric in terms of transparency and accountability as it allows users or authorities to cross-check any calculated values at certain points in time.
Ratings were assigned based based on a YES or NO response. Exchanges that offer the ability to query historical trades were awarded 5 points, while those that do not were awarded 0.
Threshold Points
0 < Time < 150 5
150 < Time < 400 4
400 < Time < 700 3
700 < Time < 1000 2
1000 < Time < 2000 1
2000 <Time 0
66
Ability to Query Historical Trades
Points
YES 5
NO 0
CryptoCompare Exchange Benchmark Report February 2021
6.C/D Historical Candlestick Data
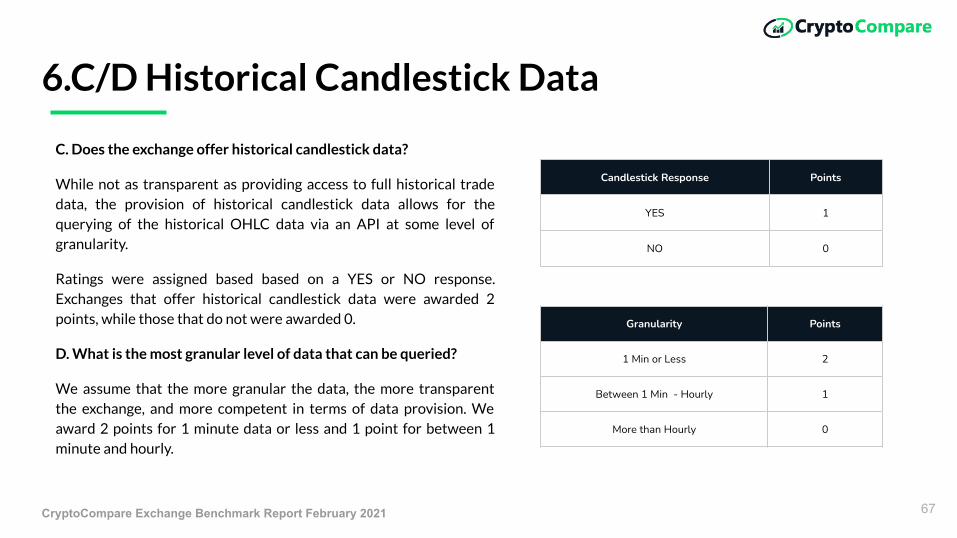
C. Does the exchange offer historical candlestick data?
While not as transparent as providing access to full historical trade data, the provision of historical candlestick data allows for the querying of the historical OHLC data via an API at some level of granularity.
Ratings were assigned based based on a YES or NO response. Exchanges that offer historical candlestick data were awarded 2 points, while those that do not were awarded 0.
D. What is the most granular level of data that can be queried?
We assume that the more granular the data, the more transparent the exchange, and more competent in terms of data provision. We award 2 points for 1 minute data or less and 1 point for between 1 minute and hourly.
Candlestick Response Points
YES 1
NO 0
67
Granularity Points
1 Min or Less 2
Between 1 Min - Hourly 1
More than Hourly 0
CryptoCompare Exchange Benchmark Report February 2021
6.E Websocket or FIX Connection
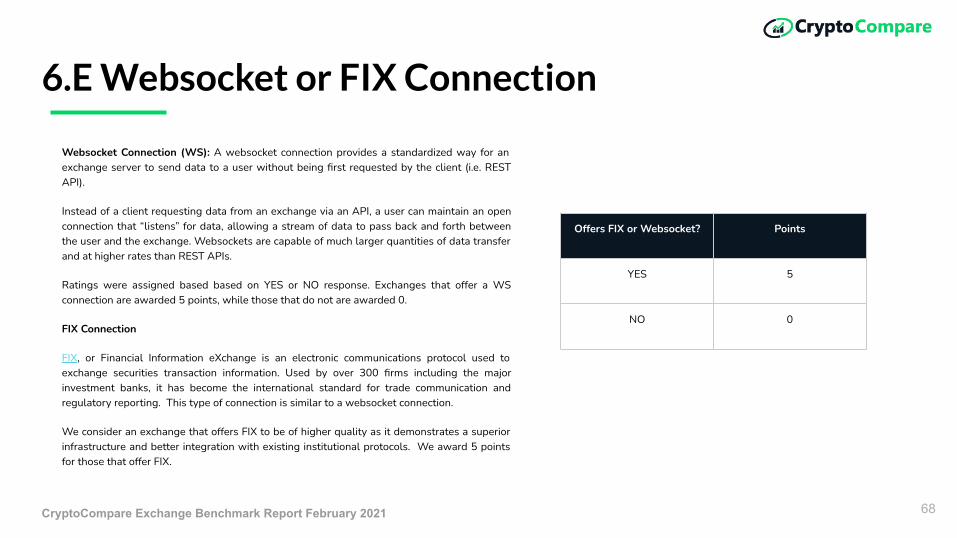
Websocket Connection (WS): A websocket connection provides a standardized way for an exchange server to send data to a user without being first requested by the client (i.e. REST API).
Instead of a client requesting data from an exchange via an API, a user can maintain an open connection that “listens” for data, allowing a stream of data to pass back and forth between the user and the exchange. Websockets are capable of much larger quantities of data transfer and at higher rates than REST APIs.
Ratings were assigned based based on YES or NO response. Exchanges that offer a WS connection are awarded 5 points, while those that do not are awarded 0.
FIX Connection
FIX, or Financial Information eXchange is an electronic communications protocol used to exchange securities transaction information. Used by over 300 firms including the major investment banks, it has become the international standard for trade communication and regulatory reporting. This type of connection is similar to a websocket connection.
We consider an exchange that offers FIX to be of higher quality as it demonstrates a superior infrastructure and better integration with existing institutional protocols. We award 5 points for those that offer FIX.
68
Offers FIX or Websocket? Points
YES 5
NO 0
CryptoCompare Exchange Benchmark Report February 2021
6.F/G Order Book API Endpoint
69
Order Book Endpoint Offered?
Points
YES 1
NO 0
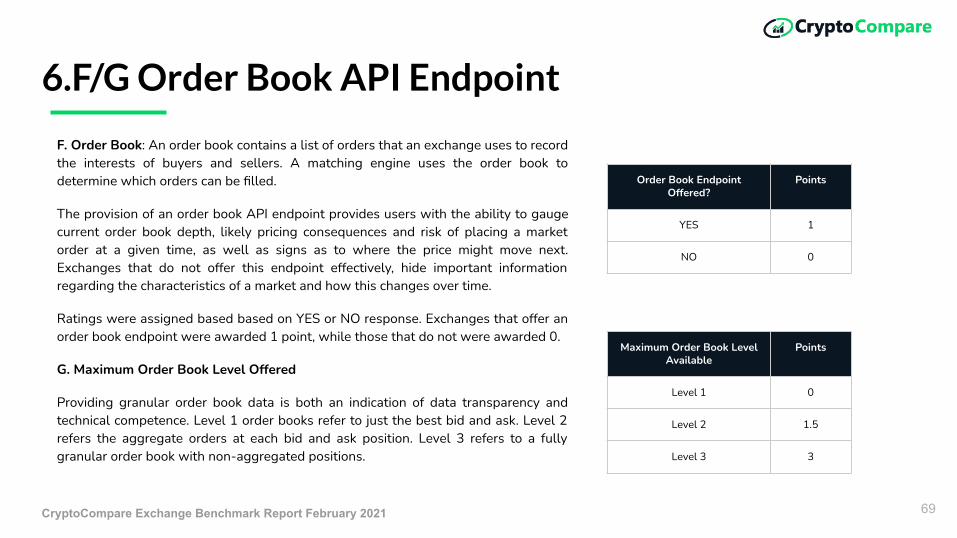
F. Order Book: An order book contains a list of orders that an exchange uses to record the interests of buyers and sellers. A matching engine uses the order book to determine which orders can be filled.
The provision of an order book API endpoint provides users with the ability to gauge current order book depth, likely pricing consequences and risk of placing a market order at a given time, as well as signs as to where the price might move next. Exchanges that do not offer this endpoint effectively, hide important information regarding the characteristics of a market and how this changes over time.
Ratings were assigned based based on YES or NO response. Exchanges that offer an order book endpoint were awarded 1 point, while those that do not were awarded 0.
G. Maximum Order Book Level Offered
Providing granular order book data is both an indication of data transparency and technical competence. Level 1 order books refer to just the best bid and ask. Level 2 refers the aggregate orders at each bid and ask position. Level 3 refers to a fully granular order book with non-aggregated positions.
Maximum Order Book Level Available
Points
Level 1 0
Level 2 1.5
Level 3 3

CryptoCompare Exchange Benchmark Report February 2021
6.H API Rate Limits
H. API Rate Limits
Exchanges make their data public via an API (Application Programming Interface). Users are able to query data using various API endpoints.
Exchanges will vary in terms of the amount of data requests per minute (times a users can query data) they offer publicly to users. If a user exceeds the allocated rate limit (number of maximum requests per API endpoint), they will be unable to access data via the API.
In terms of data provision, exchanges that offer higher rate limits per minute are given a higher score than those that offer lower rate limits. We award 1 point for between 0 and 100 minutes, 2 points for between 100 and 400 minutes, 3 points for between 400 and 700 minutes, 4 points for between 700 and 1000 minutes, and 5 points for more than 1000 minutes.
Threshold (minutes) Points
0 < Rate Limit < 100 1
100 < Rate Limit< 400 2
400 < Rate Limit< 700 3
700 < Rate Limit< 1000 4
Rate Limit>1000 5
70
CryptoCompare Exchange Benchmark Report February 2021
7. Asset Quality/Diversity
71
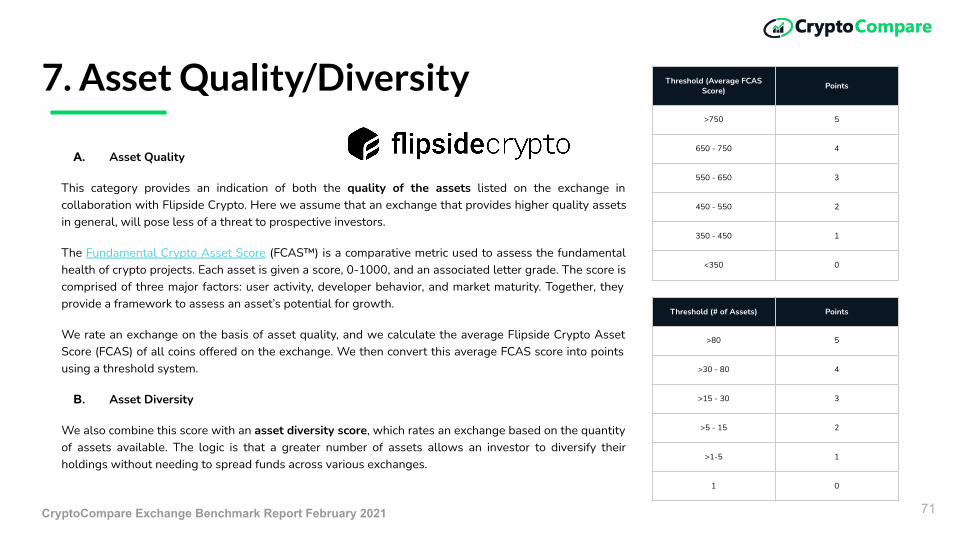
A. Asset Quality
This category provides an indication of both the quality of the assets listed on the exchange in collaboration with Flipside Crypto. Here we assume that an exchange that provides higher quality assets in general, will pose less of a threat to prospective investors.
The Fundamental Crypto Asset Score (FCAS™) is a comparative metric used to assess the fundamental health of crypto projects. Each asset is given a score, 0-1000, and an associated letter grade. The score is comprised of three major factors: user activity, developer behavior, and market maturity. Together, they provide a framework to assess an asset’s potential for growth.
We rate an exchange on the basis of asset quality, and we calculate the average Flipside Crypto Asset Score (FCAS) of all coins offered on the exchange. We then convert this average FCAS score into points using a threshold system.
B. Asset Diversity
We also combine this score with an asset diversity score, which rates an exchange based on the quantity of assets available. The logic is that a greater number of assets allows an investor to diversify their holdings without needing to spread funds across various exchanges.
Threshold (Average FCAS Score) Points
>750 5
650 - 750 4
550 - 650 3
450 - 550 2
350 - 450 1
<350 0
Threshold (# of Assets) Points
>80 5
>30 - 80 4
>15 - 30 3
>5 - 15 2
>1-5 1
1 0

CryptoCompare Exchange Benchmark Report February 2021
8. Negative Events Penalty
Our Benchmark Methodology also takes into account whether the exchange has experienced a significant negative event in the last year that would indicate a higher level of exchange risk.
These events are broad and include:
- Flash crashes- Charges/fines following court proceedings- Arrests/detainment of senior exchange officials- Data breaches or leaks of private information- Other significant events that reasonably indicate a higher level of exchange risk.
We deduct 5 points from the total exchange score in the case of a negative event.
Please note that exchange hackings where funds are stolen are not included in this metric because they are captured in our Security Category.
72
Negative Events Points
YES -5
NO 0
Appendix B - Market Quality Methodology
73

CryptoCompare Exchange Benchmark Report February 2021
Introduction
74
As part of providing an assessment of exchanges, it is important to also include a representative picture of what trading looks like on their markets.
The metrics defined here are designed to separate exchanges which behave differently from the average exchange. Metrics are converted into ranking scores which are aggregated into the total exchange ranking.
We first present common metrics often used to describe a market, followed by metrics which can be shown to isolate specific unusual trading behaviours.
1. Market Cost to Trade (spread)2. Liquidity (depth)3. Stability (volatility)4. Behaviour Towards Market Movement - (volatility & volume correlation)5. “Natural” Market Behaviour (standard deviation of volume)

CryptoCompare Exchange Benchmark Report February 2021
Data Collection
75
Pairs BTC-USD, BTC-USDT, BTC-ETH, BTC-KRW, BTC-JPY ETH-USD, ETH-USDT, and ETH-KRW, ETH-JPY and others.
Time Period 01 Jan- 31 Jan 2021
Trade Data Transaction level data which provides insight into matches between two parties. It is used to calculate minute volatility and to measure an exchange’s volume.
Collection method: REST API polling on exchanges at exchange rate limits.
Order Book Data Provides a view of all limit orders (offers to trade) on a particular market at any given moment. It is used to calculate spread and depth.
Collection method: REST API polling snapshots and websocket connections when this was not possible.*
*CryptoCompare streams order books for the most notable exchanges via websocket connection; however, for the purposes of this report and to allow for the collection of the broadest data set possible we scaled out using the more widely available REST APIs.

CryptoCompare Exchange Benchmark Report February 2021
Used when a metric is completely market agnostic, so a threshold can be applied to fairly rank it across any market.
Pearson’s correlation is one such measure where we can assign a fixed score to any given value.
Scoring Market Quality
76
Used when a metric varies greatly between different markets, so we rank each exchange and market combination relative to its peers on a market by pair basis.
Following an ordered sort (direction is specific to each metric), a score of 0-10 is distributed across the group.
Comparative
● Average spread● 1% depth● Minute volatility
Comparative + Threshold
Each exchange receives an aggregate score based on an average of the markets we tested.
Threshold
● Volatility & volume correlation ● Standard deviation of trading volume
Used when a metric varies greatly between different markets, but also when a logical threshold can be applied.
A threshold might be a fixed figure or one based on a group average or median.
CryptoCompare Exchange Benchmark Report February 2021
A Note on Aggregate Scoring
The pairs that were chosen for this report capture the majority of volume of crypto trading, and as such should give a fairly representative picture of exchanges.
A possible implication of focusing on just the specific markets considered in this report is that exchanges whose primary purpose is to cater to a specific jurisdiction (e.g. an exchange whose most liquid trading pairs are in GBP) may appear to have descriptive market metrics which under-represent the true liquidity on these exchanges. These exchanges will not, however, be penalised by other metrics unless the markets show particularly unusual trading behaviour.
77

CryptoCompare Exchange Benchmark Report February 2021
1.a Market Cost to Trade - Average Spread
Spread is the difference between the best bid (the highest price at which someone is willing to buy) and the best ask (the lowest price at which someone is willing to sell).
Spreads are tight when markets are liquid. While they may widen in times of volatile price movements, the average spread gives an idea of the liquidity of the market, and quantifies how risky market makers believe the exchange is.
Higher spreads make it costlier to trade and increase market friction.
Bid and ask values were collected every 5 seconds (subject to exchange rate limiting) and averaged across Oct 5th to Nov 5th. The long time period used for data collection was chosen to allow for accurate average spread values to be estimated even in the presence of API downtime and differing rate limits.
78

CryptoCompare Exchange Benchmark Report February 2021
1.b Spread Overview
79
Generally, those exchanges which offer incentives to provide liquidity through either low or negative maker fees will achieve the tightest spreads.
Due to the spread being calculated using the best bid and offer, it is misleading to use it as a sole gauge of liquidity and therefore as the market cost to trade; it must be used in conjunction with a depth measurement to find the likely transaction price for any given size of transaction.
The spreads on some notable exchanges are shown on the right hand chart to display their variability even on relatively short time horizons (5 mins).

CryptoCompare Exchange Benchmark Report February 2021
1.c Scoring Average Spread
Higher spread = Lower scoreLower spread = Higher score
80
Exchange Market Metric Metric Score
Exchange A BTC-USD 40 0Exchange B BTC-USD 28 0Exchange C BTC-USD 20 1Exchange D BTC-USD 15 1Exchange E BTC-USD 12 2
... ... ... ...Exchange R BTC-USD 3 8Exchange S BTC-USD 2.3 9Exchange T BTC-USD 1.5 9Exchange U BTC-USD 0.9 10Exchange V BTC-USD 0.8 10
AggregateDefine metric Score across each market
Exchange Markets Aggregated Metric Score
Exchange BBTC-USDETH-USDETH-BTC
8.4
Exchange CETH-USDETH-KRWETH-JPY
8.0
Exchange ABTC-USDBTC-KRWETH-BTC
6.5
Exchange D BTC-JPYETH-BTC 6.2
Exchange EBTC-USDTETH-USDTETH-BTC
5.9
We rank each exchange and market combination relative to its peers on a market by pair basis.
Following an ordered sort (direction is specific to each metric), a score of 0-10 is distributed across the group.
Comparative
CryptoCompare Exchange Benchmark Report February 2021
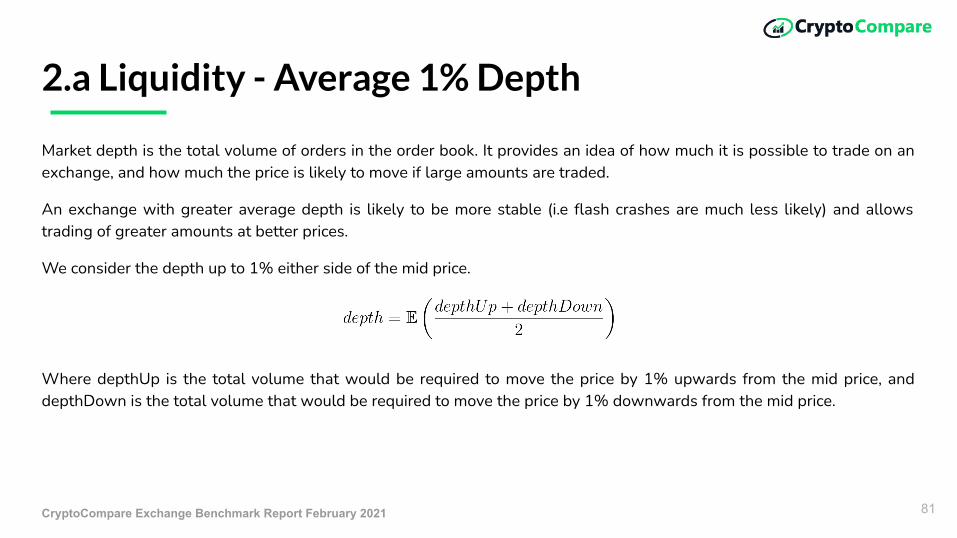
Market depth is the total volume of orders in the order book. It provides an idea of how much it is possible to trade on an exchange, and how much the price is likely to move if large amounts are traded.
An exchange with greater average depth is likely to be more stable (i.e flash crashes are much less likely) and allows trading of greater amounts at better prices.
We consider the depth up to 1% either side of the mid price.
Where depthUp is the total volume that would be required to move the price by 1% upwards from the mid price, and depthDown is the total volume that would be required to move the price by 1% downwards from the mid price.
2.a Liquidity - Average 1% Depth
81

CryptoCompare Exchange Benchmark Report February 2021
2.b Depth Overview
82
Generally, exchanges which offer incentives to provide liquidity, through either low or negative maker fees, will achieve the deepest order books.
Exchanges that attract the most trading activity will naturally have more orders resting on their book at larger sizes, increasing the depth.
There are stark differences in the depth between exchanges, as shown on the right hand chart. Depth tends to stay relatively constant throughout any given day, but news and other price impacting events can cause sharp changes.

CryptoCompare Exchange Benchmark Report February 2021
2.c Scoring Average 1% Depth
83
Less depth = Lower scoreMore depth = Higher score
83
Exchange Market Metric Metric Score
Exchange A BTC-USD 6 0Exchange B BTC-USD 12 0Exchange C BTC-USD 16 1Exchange D BTC-USD 56 1Exchange E BTC-USD 100 2
... ... ... ...Exchange R BTC-USD 500 8Exchange S BTC-USD 534 9Exchange T BTC-USD 611 9Exchange U BTC-USD 900 10Exchange V BTC-USD 1456 10
AggregateDefine metric Score across each market
We rank each exchange and market combination relative to its peers on a market by pair basis.
Following an ordered sort (direction is specific to each metric), a score of 0-10 is distributed across the group.
Comparative Exchange Markets Aggregated Metric Score
Exchange BBTC-USDETH-USDETH-BTC
8.4
Exchange CETH-USDETH-KRWETH-JPY
8.0
Exchange ABTC-USDBTC-KRWETH-BTC
6.5
Exchange D BTC-JPYETH-BTC 6.2
Exchange EBTC-USDTETH-USDTETH-BTC
5.9

CryptoCompare Exchange Benchmark Report February 2021
3.a Stability - Minute Volatility
When trading the same asset across exchanges, it is preferable to have lower volatility. Measures of market risk such as the Sharpe ratio use the volatility of an asset.
As we would prefer lower risk when holding an asset on an exchange, we would also prefer lower volatility.
To calculate the metric, price is bucketed into minutes and the volatility is calculated using the close price of each minute bucket over a rolling 6H period. The volatility is then averaged over the full time period (Oct 5th - Nov 5th).
84

CryptoCompare Exchange Benchmark Report February 2021
3.b Scoring Minute Volatility
85
Higher volatility = Lower scoreLower volatility = Higher score
Exchange Market Metric Metric Score
Exchange A BTC-USD 0.3 0Exchange B BTC-USD 0.18 0Exchange C BTC-USD 0.12 1Exchange D BTC-USD 0.11 1Exchange E BTC-USD 0.10 2
... ... ... ...Exchange R BTC-USD 0.04 8Exchange S BTC-USD 0.03 9Exchange T BTC-USD 0.01 9Exchange U BTC-USD 0.009 10Exchange V BTC-USD 0.003 10
AggregateDefine metric Score across each market
We rank each exchange and market combination relative to its peers on a market by pair basis.
Following an ordered sort (direction is specific to each metric), a score of 0-10 is distributed across the group.
Comparative Exchange Markets Aggregated Metric Score
Exchange BBTC-USDETH-USDETH-BTC
8.4
Exchange CETH-USDETH-KRWETH-JPY
8.0
Exchange ABTC-USDBTC-KRWETH-BTC
6.5
Exchange D BTC-JPYETH-BTC 6.2
Exchange EBTC-USDTETH-USDTETH-BTC
5.9
CryptoCompare Exchange Benchmark Report February 2021
4/5 Metrics to Identify Unusual Behaviour
Recent industry focus has centred around highlighting suspicious trading behaviour on exchanges. There has, however, been a shortage of clear and transparent methodologies published for ascertaining whether trading is suspicious for a given market.
We provide a summary of metrics deemed to give a good assessment of whether the trading on an exchange conforms to behaviour that one might generally expect to see. Each of these metrics are designed to single out specific types of trading behaviour.
Behaviour towards market movement - volatility & volume correlation
We analyse the correlation between volume and volatility and use this to provide insights into the types of market participants trading on exchanges, and consider how this differs from the aggregate average.
Natural trading behavior - standard deviation of trading volume
We analyse the standard deviation of trading volumes over different time periods and show that this metric can be used to separate two very different trading behaviours on an exchange.
86

CryptoCompare Exchange Benchmark Report February 2021
4.a Behaviour Towards Market MovementVolatility & volume correlation
The relationship between market volatility and volume can be used to glean an insight into the sorts of trading activity which are being carried out on an exchange.
To explain the modes of trading behaviour seen on exchanges, we define two types of market participants:
● Market makers operate on exchanges, and aim to make a profit while maintaining a market neutral position. They provide liquidity and narrow spreads on a market . Generally, they make money from payments from the exchange, through arbitrage, or on the bid-ask spread.
● Investors are defined here as traders who take a position in the market. They make money based on the price movements of the asset.
87

CryptoCompare Exchange Benchmark Report February 2021
Investors who take a position in the market are likely to trade more actively in times of volatility.
Price movements may cause limit orders to be filled and new investors will likely join the market to react to price movements.
The end result of this is that volume is positively correlated with price volatility.
4.b An ‘Investor Market’
88

CryptoCompare Exchange Benchmark Report February 2021
4.c A ‘Maker Market‘
In times of high volatility it becomes less certain that market makers are able to hedge any trade they make effectively.
They therefore reduce volumes at each position or increase the spread they are willing to provide for the market. This makes the asset less liquid and means that smaller trades will cause larger price movements.
To avoid large slippage, traders therefore need to trade smaller amounts and the volume becomes negatively correlated to the volatility.
89
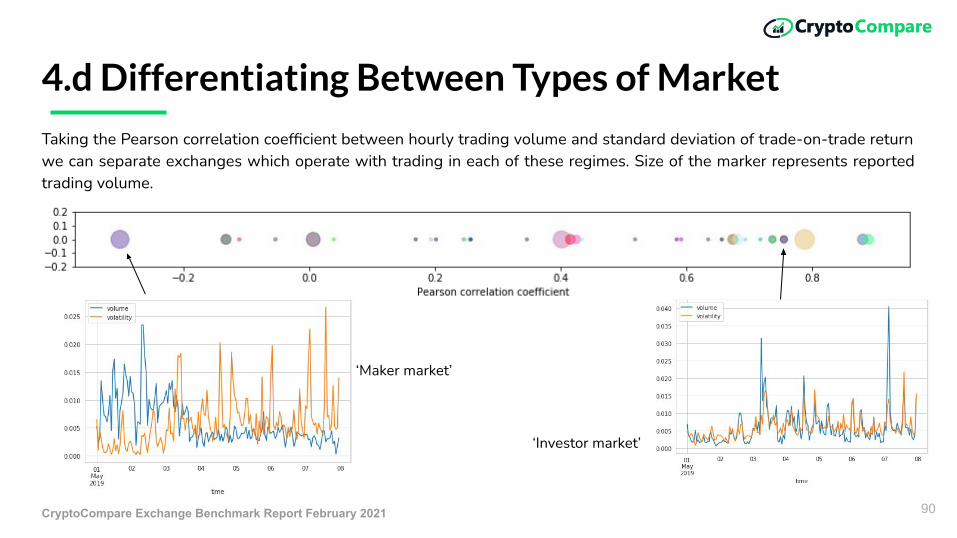
CryptoCompare Exchange Benchmark Report February 2021
Taking the Pearson correlation coefficient between hourly trading volume and standard deviation of trade-on-trade return we can separate exchanges which operate with trading in each of these regimes. Size of the marker represents reported trading volume.
4.d Differentiating Between Types of Market
90
‘Maker market’
‘Investor market’
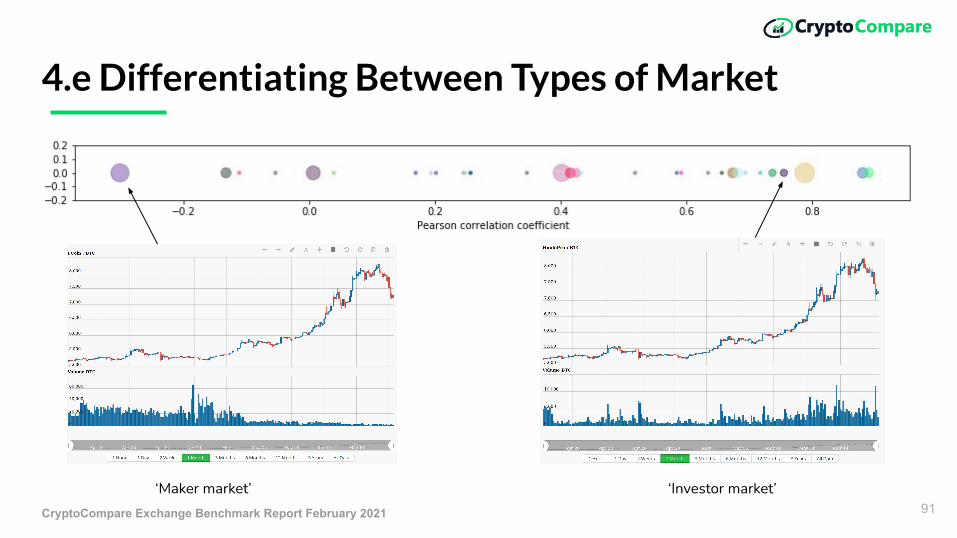
CryptoCompare Exchange Benchmark Report February 2021
4.e Differentiating Between Types of Market
91‘Maker market’ ‘Investor market’
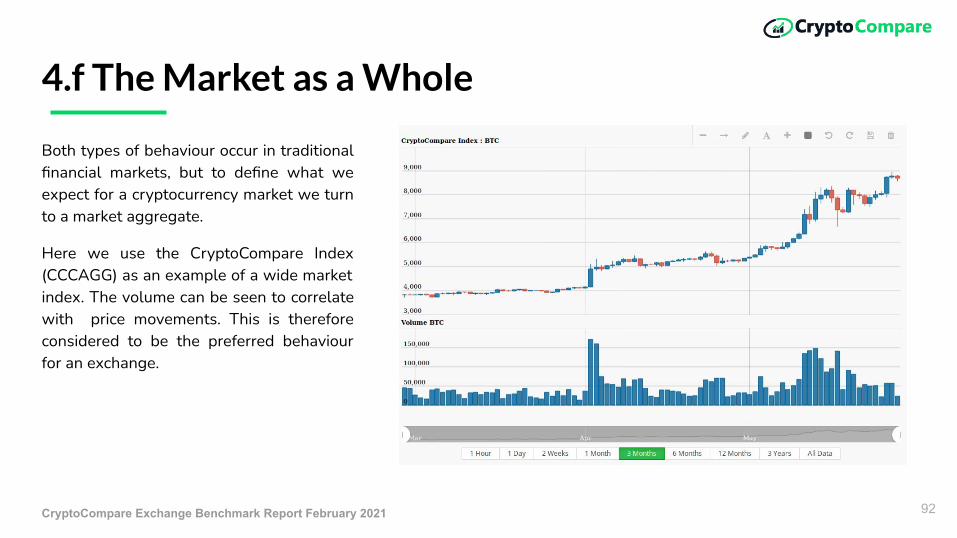
CryptoCompare Exchange Benchmark Report February 2021
4.f The Market as a Whole
Both types of behaviour occur in traditional financial markets, but to define what we expect for a cryptocurrency market we turn to a market aggregate.
Here we use the CryptoCompare Index (CCCAGG) as an example of a wide market index. The volume can be seen to correlate with price movements. This is therefore considered to be the preferred behaviour for an exchange.
92
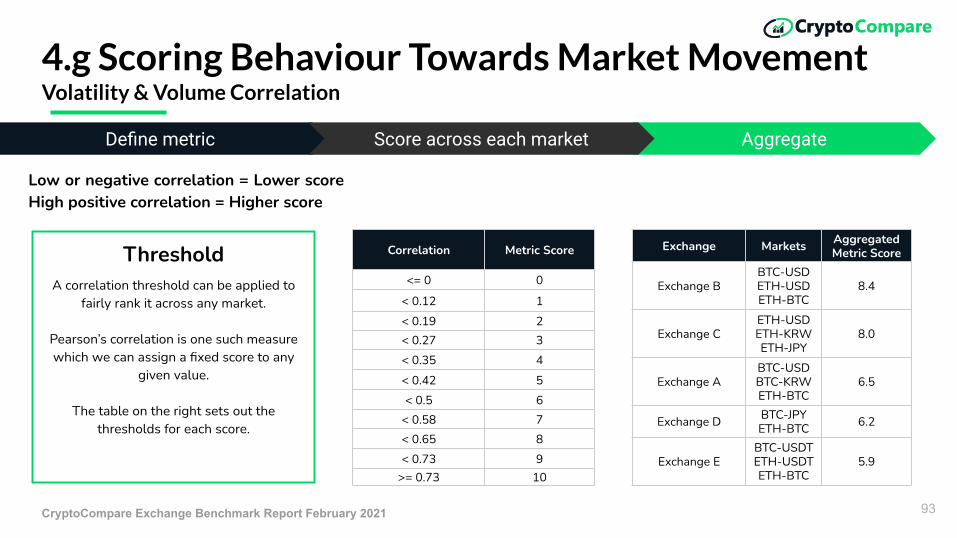
CryptoCompare Exchange Benchmark Report February 2021
4.g Scoring Behaviour Towards Market Movement Volatility & Volume Correlation
93
Low or negative correlation = Lower scoreHigh positive correlation = Higher score
Correlation Metric Score
<= 0 0
< 0.12 1
< 0.19 2< 0.27 3
< 0.35 4
< 0.42 5
< 0.5 6< 0.58 7< 0.65 8
< 0.73 9>= 0.73 10
AggregateDefine metric Score across each market
A correlation threshold can be applied to fairly rank it across any market.
Pearson’s correlation is one such measure which we can assign a fixed score to any
given value.
The table on the right sets out the thresholds for each score.
Threshold Exchange Markets Aggregated Metric Score
Exchange BBTC-USDETH-USDETH-BTC
8.4
Exchange CETH-USDETH-KRWETH-JPY
8.0
Exchange ABTC-USDBTC-KRWETH-BTC
6.5
Exchange D BTC-JPYETH-BTC 6.2
Exchange EBTC-USDTETH-USDTETH-BTC
5.9

CryptoCompare Exchange Benchmark Report February 2021
5.a Natural Trading BehaviorStandard deviation of trading volume
While, as previously discussed, we might expect price volatility to affect trading volume, it is unlikely that in a time of constant price volatility the trading volume would remain constant.
This behaviour is explored by considering how much the minutely, hourly and daily volume vary on average using the standard deviation.
94
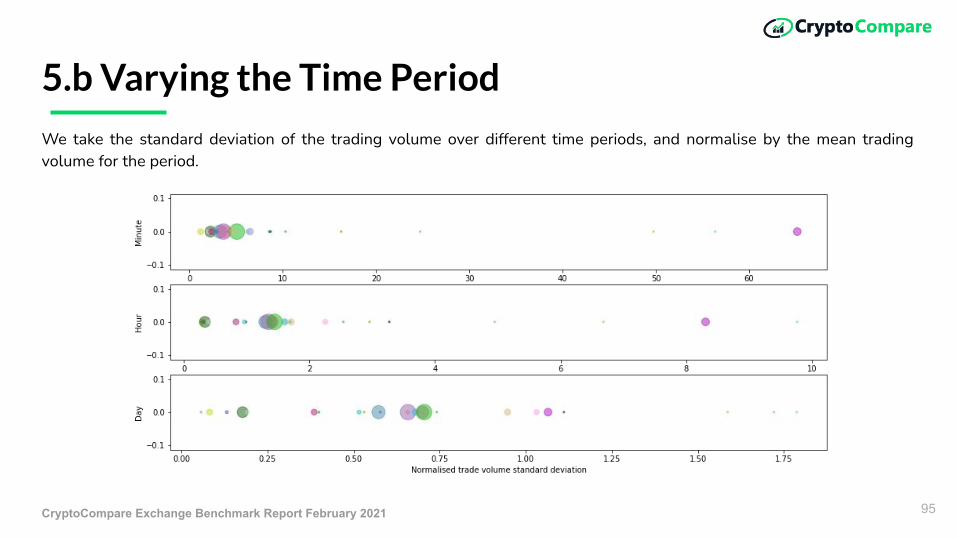
CryptoCompare Exchange Benchmark Report February 2021
5.b Varying the Time Period
We take the standard deviation of the trading volume over different time periods, and normalise by the mean trading volume for the period.
95
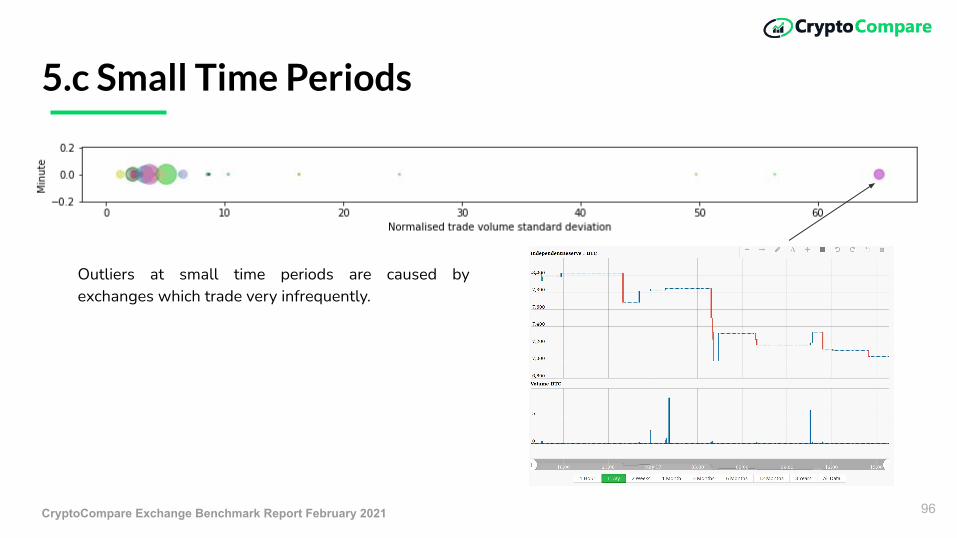
CryptoCompare Exchange Benchmark Report February 2021
5.c Small Time Periods
Outliers at small time periods are caused by exchanges which trade very infrequently.
96
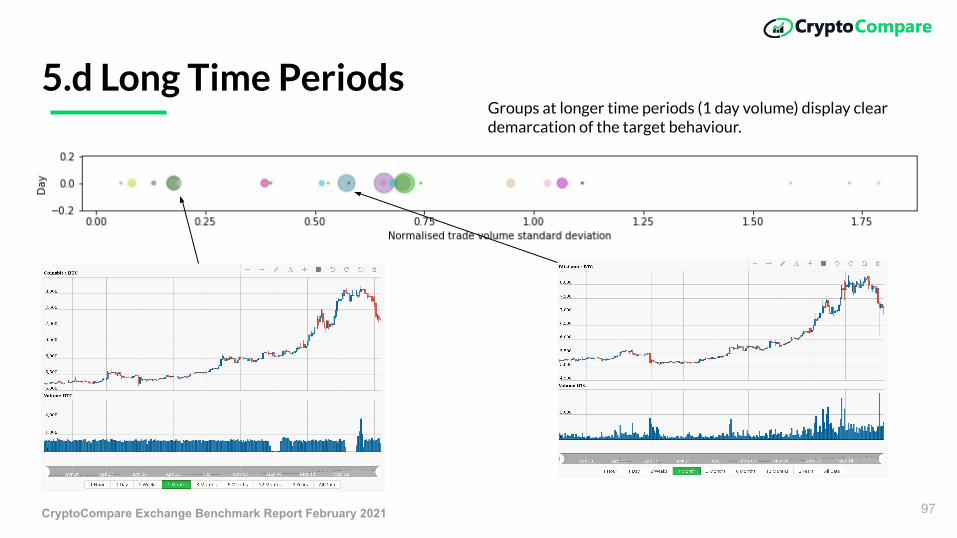
CryptoCompare Exchange Benchmark Report February 2021
5.d Long Time PeriodsGroups at longer time periods (1 day volume) display clear demarcation of the target behaviour.
97
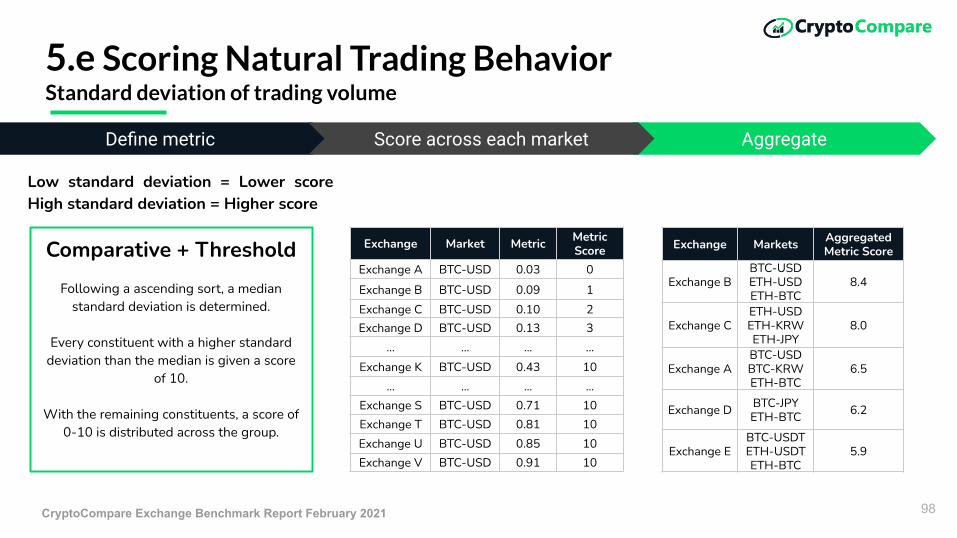
CryptoCompare Exchange Benchmark Report February 2021
5.e Scoring Natural Trading BehaviorStandard deviation of trading volume
98
Low standard deviation = Lower scoreHigh standard deviation = Higher score
Exchange Market Metric Metric Score
Exchange A BTC-USD 0.03 0
Exchange B BTC-USD 0.09 1Exchange C BTC-USD 0.10 2Exchange D BTC-USD 0.13 3
... ... ... ...Exchange K BTC-USD 0.43 10
... ... ... ...Exchange S BTC-USD 0.71 10Exchange T BTC-USD 0.81 10Exchange U BTC-USD 0.85 10Exchange V BTC-USD 0.91 10
AggregateDefine metric Score across each market
Comparative + Threshold
Following a ascending sort, a median standard deviation is determined.
Every constituent with a higher standard deviation than the median is given a score
of 10.
With the remaining constituents, a score of 0-10 is distributed across the group.
Exchange Markets Aggregated Metric Score
Exchange BBTC-USDETH-USDETH-BTC
8.4
Exchange CETH-USDETH-KRWETH-JPY
8.0
Exchange ABTC-USDBTC-KRWETH-BTC
6.5
Exchange D BTC-JPYETH-BTC 6.2
Exchange EBTC-USDTETH-USDTETH-BTC
5.9
Appendix C - Points and Grading Summary
99

CryptoCompare Exchange Benchmark Report February 2021
Points Categories
A. Legal/Regulatory AssessmentB. KYC/Transaction RiskC. SecurityD. Team/ExchangeE. Data ProvisionF. Asset Quality/Diversity
G. Market QualityH. Negative Events (penalty factor)I. Inflation Score (*not used in ranking)
100

CryptoCompare Exchange Benchmark Report February 2021
Points Category A - Legal/Regulation
101
A. Legal/Regulation ScoringLegal Company Name Found: 5, Not Found:0
Registered as an MSB or Licensed as a CryptoCurrency Exchange YES: 12 x Compliance Stringency Factor [0-3]/3* , NO: 0Geography Country Rating Low Risk: 9, Medium Risk: 6, High Risk: 3, Very High Risk: 0Country Regulation Rating Crypto Exchange Regulation: [0-3]
Part of Self-Regulatory Organisation YES: 2, NO: 0Part of Industry Group YES: 1, NO: 0
Crypto Insurance Against Losses OR YES: 3, NO: 0Self-Insurance Fund YES: 1, NO: 0
CCO (Chief Compliance Officer) Found: 1, Not Found: 0CCO Experience (in Compliance or Legal Roles) Years = 0: 0, 0 < Years< 2: 1 , 2 < Years< 5: 2 , 5 < Years< 10: 3 , Years>10: 4
Sections Compliance Statement YES: 1, NO: 0PEP Statement YES: 1, NO: 0
Total Legal/Regulatory Points 0-42Re-Scaled Legal Points Available 20%
*See Compliance Stringency Methodology here for more information on scoring.
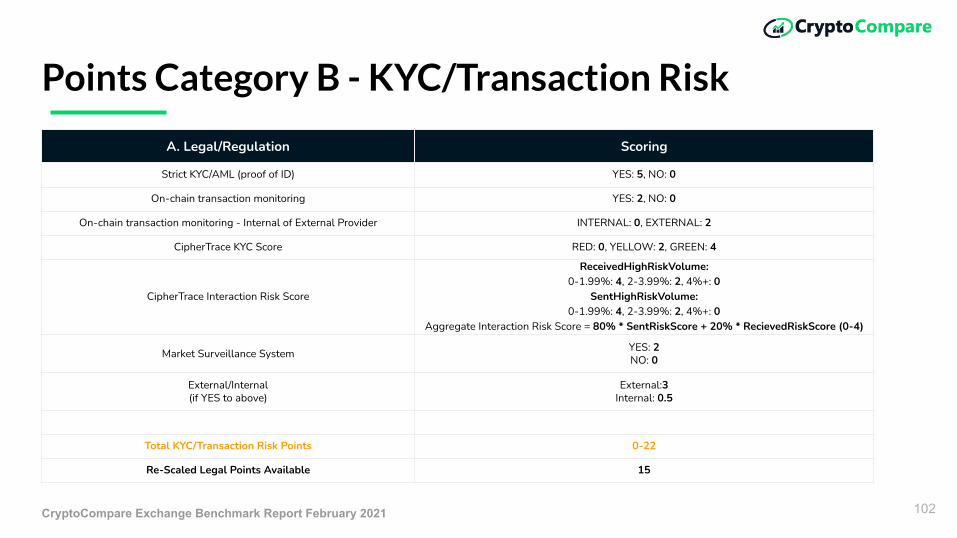
CryptoCompare Exchange Benchmark Report February 2021
Points Category B - KYC/Transaction Risk
102
A. Legal/Regulation Scoring
Strict KYC/AML (proof of ID) YES: 5, NO: 0
On-chain transaction monitoring YES: 2, NO: 0
On-chain transaction monitoring - Internal of External Provider INTERNAL: 0, EXTERNAL: 2
CipherTrace KYC Score RED: 0, YELLOW: 2, GREEN: 4
CipherTrace Interaction Risk Score
ReceivedHighRiskVolume:0-1.99%: 4, 2-3.99%: 2, 4%+: 0
SentHighRiskVolume:0-1.99%: 4, 2-3.99%: 2, 4%+: 0
Aggregate Interaction Risk Score = 80% * SentRiskScore + 20% * RecievedRiskScore (0-4)
Market Surveillance System YES: 2NO: 0
External/Internal(if YES to above)
External:3Internal: 0.5
Total KYC/Transaction Risk Points 0-22
Re-Scaled Legal Points Available 15

CryptoCompare Exchange Benchmark Report February 2021
Points Category C - Security
103
B. Security Scoring
Formally Certified and Compliant with Security Industry Standard (E.g. ISO 27001, SOC2)
YES: 5, NO: 0
SSL Security Rating by Qualys or ImmuniWeb A+ =3, A=2.5, A-=2, B+ or B=1, <B-=0
Offline Storage (Cold Wallet) YES: 2, NO: 0
Cold Wallet % Cold Wallet % * 3 (weighting factor), “Majority”: 2, “Some”: 1, Not Found: 0
Geographical Key Distribution YES: 2, NO: 0
2FA YES: 2, NO: 0
Custody Provider (E.g Bitgo) YES: 3, NO: 0
Number of Hacks in Last 2 Years More than 1: -3, Less than 2: 0
Hacked Recently Yes: -5, No: 0
Total Security Points 0-19
Re-Scaled Investments Points Available 20
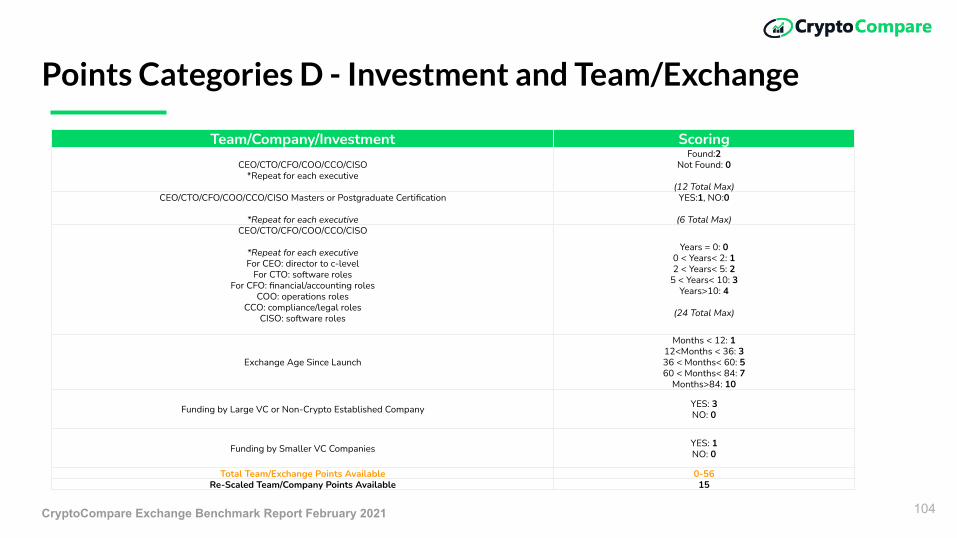
CryptoCompare Exchange Benchmark Report February 2021
Points Categories D - Investment and Team/Exchange
104
Team/Company/Investment ScoringCEO/CTO/CFO/COO/CCO/CISO
*Repeat for each executive
Found:2Not Found: 0
(12 Total Max)CEO/CTO/CFO/COO/CCO/CISO Masters or Postgraduate Certification
*Repeat for each executive
YES:1, NO:0
(6 Total Max)CEO/CTO/CFO/COO/CCO/CISO
*Repeat for each executiveFor CEO: director to c-level
For CTO: software rolesFor CFO: financial/accounting roles
COO: operations rolesCCO: compliance/legal roles
CISO: software roles
Years = 0: 00 < Years< 2: 12 < Years< 5: 2
5 < Years< 10: 3Years>10: 4
(24 Total Max)
Exchange Age Since Launch
Months < 12: 112<Months < 36: 336 < Months< 60: 560 < Months< 84: 7
Months>84: 10
Funding by Large VC or Non-Crypto Established Company YES: 3NO: 0
Funding by Smaller VC Companies YES: 1NO: 0
Total Team/Exchange Points Available 0-56Re-Scaled Team/Company Points Available 15

CryptoCompare Exchange Benchmark Report February 2021
Points Category E - Data Provision
105
E. Data Provision Scoring
API Average Response Time (ms)
0 < Time < 150: 5150 < Time < 400: 4400 < Time < 700: 3
700 < Time < 1000: 21000 < Time < 2000: 1
2000 <Time: 0
Ability to Query Historical Trades YES:5, NO: 0
Historical Candlestick Data YES:1, NO: 0
Minimum Candlestick Data Granularity=<1min = 2
1min - 1hour: 1>1hour: 0
Offers Websocket or FIX Connection YES: 5, NO: 0Provides Order Book API Endpoint YES: 1, NO: 0
Maximum Order Book Level L1=0, L2=1.5, L3=3
API Rate Limits
0 < Rate Limit < 100: 1100 < Rate Limit< 400: 2400 < Rate Limit< 700: 3
700 < Rate Limit< 1000: 4Rate Limit>1000: 5
Total Data Provision Points Available 27
Re-Scaled Data Provision Points Available 15

CryptoCompare Exchange Benchmark Report February 2021
Points Categories G/H/I - Market Quality, Inflation, Negative Events
106
A. Market Quality Scoring B. Inflation Score Scoring Negative Reports Scoring
Market cost to trade (average spread) 0-10 Competitions YES:5NO: 0
Negative Reports Found
YES: -5NO: 0
Liquidity (average depth of 1% price impact) 0-10 Airdrops YES: 2.5
NO: 0
Total Negative News Points Deductible
-5
Stability (minute volatility) 0-10 Transaction Fee Mining YES: 15NO: 0
Behaviour towards sentiment (volatility and volume correlation) 0-10 Margin Trading YES: 5
NO: 0
Natural trading behaviour (volume standard deviation) 0-10 No Fees YES: 5
NO: 0
Total Market Quality Points 0-50 Total Inflation Points 0- 32.5
Re-Scaled Market Quality Points Available 15 Re-Scaled Inflation
Score Available 10Re-Scaled Negative
News Points-5
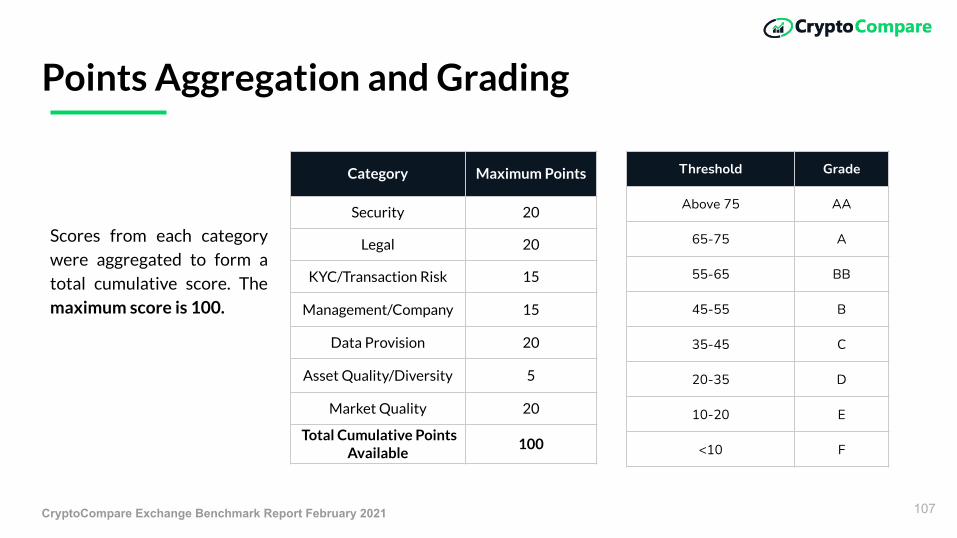
CryptoCompare Exchange Benchmark Report February 2021
Points Aggregation and Grading
Scores from each category
were aggregated to form a
total cumulative score. The
maximum score is 100.
107
Threshold Grade
Above 75 AA
65-75 A
55-65 BB
45-55 B
35-45 C
20-35 D
10-20 E
<10 F
Category Maximum Points
Security 20
Legal 20
KYC/Transaction Risk 15
Management/Company 15
Data Provision 20
Asset Quality/Diversity 5
Market Quality 20
Total Cumulative Points Available
100