Embed Size (px)
Citation preview

Dissertationes Forestales 154
Exchange of volatile organic compounds in the boreal forest floor
Hermanni Aaltonen
Department of Forest Sciences Faculty of Agriculture and Forestry
University of Helsinki
Academic dissertation
To be presented, with the permission of the Faculty of Agriculture and Forestry of the University of Helsinki, for public examination in Auditorium B123, Exactum, Kumpula
(Gustaf Hällströmin katu 2b, Helsinki), on December 10th 2012, at 12 o’clock noon.

2
Title of dissertation: Exchange of volatile organic compounds in the boreal forest floor Author: Hermanni Aaltonen Dissertationes Forestales 154 Thesis Supervisors: Doc. Jukka Pumpanen Department of Forest Sciences, University of Helsinki, Finland Doc. Jaana Bäck Department of Forest Sciences, University of Helsinki, Finland Department of Physics, University of Helsinki, Finland Dr. Mari Pihlatie Department of Physics, University of Helsinki, Finland Pre-examiners: Doc. Aino Smolander The Finnish Forest Research Institute, Finland Ass. Prof. Detlev Helmig Institute of Alpine and Arctic Research, University of Colorado, USA Opponent: Ass. Prof. Riikka Rinnan Department of Biology, University of Copenhagen, Denmark ISSN 1795-7389 ISBN 978-951-651-397-6 (PDF) 2012 Publishers: Finnish Society of Forest Science Finnish Forest Research Institute Faculty of Agriculture and Forestry of the University of Helsinki School of Forest Sciences of the University of Eastern Finland Editorial Office: The Finnish Society of Forest Science P.O. Box 18, FI-01301 Vantaa, Finland http://www.metla.fi/dissertationes
3
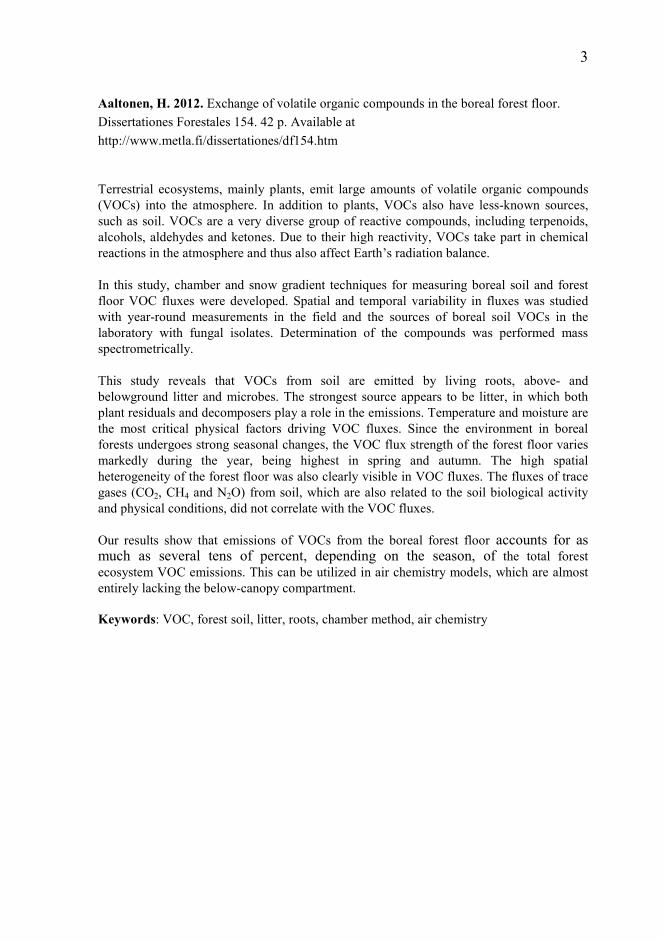
Aaltonen, H. 2012. Exchange of volatile organic compounds in the boreal forest floor. Dissertationes Forestales 154. 42 p. Available at http://www.metla.fi/dissertationes/df154.htm Terrestrial ecosystems, mainly plants, emit large amounts of volatile organic compounds (VOCs) into the atmosphere. In addition to plants, VOCs also have less-known sources, such as soil. VOCs are a very diverse group of reactive compounds, including terpenoids, alcohols, aldehydes and ketones. Due to their high reactivity, VOCs take part in chemical reactions in the atmosphere and thus also affect Earth’s radiation balance. In this study, chamber and snow gradient techniques for measuring boreal soil and forest floor VOC fluxes were developed. Spatial and temporal variability in fluxes was studied with year-round measurements in the field and the sources of boreal soil VOCs in the laboratory with fungal isolates. Determination of the compounds was performed mass spectrometrically. This study reveals that VOCs from soil are emitted by living roots, above- and belowground litter and microbes. The strongest source appears to be litter, in which both plant residuals and decomposers play a role in the emissions. Temperature and moisture are the most critical physical factors driving VOC fluxes. Since the environment in boreal forests undergoes strong seasonal changes, the VOC flux strength of the forest floor varies markedly during the year, being highest in spring and autumn. The high spatial heterogeneity of the forest floor was also clearly visible in VOC fluxes. The fluxes of trace gases (CO2, CH4 and N2O) from soil, which are also related to the soil biological activity and physical conditions, did not correlate with the VOC fluxes. Our results show that emissions of VOCs from the boreal forest floor accounts for as much as several tens of percent, depending on the season, of the total forest ecosystem VOC emissions. This can be utilized in air chemistry models, which are almost entirely lacking the below-canopy compartment. Keywords: VOC, forest soil, litter, roots, chamber method, air chemistry

4
ACKNOWLEDGEMENTS During the five years I have been engaged in working with forest floor volatiles, numerous people have helped me and contributed to the study.
First, special thanks for my supervisors Jukka Pumpanen, Jaana Bäck and Mari Pihlatie. They have aided me in all my endeavours, beginning from building the sampling systems, but especially their efforts in commenting on the manuscripts and correcting my English have been indispensable.
Work with my co-authors has also been very fruitful. Pasi Kolari helped a lot with the chamber system at SMEAR II and the computer skills of Liisa Kulmala have impressed me. I also greatly appreciate Timo Vesala’s help with the micrometeorological equations. Without sharing the same projects, Terhi Rasilo, my office mate, always had the time for helping me with any problems concerning my thesis.
I want to thank the staff at the Hyytiälä Forestry Field Station and SMEAR II for providing excellent working facilities. Toivo Pohja, Heikki Laakso, Janne Levula, Veijo Hiltunen and Erkki Siivola deserve special thanks for their technical support. Juho Aalto offered pleasant company for fieldwork and discussions dealing with everything between Heaven and Earth.
I want to thank my thesis pre-examiners, Doc. Aino Smolander and Ass. Prof. Detlev Helmig, for their valuable comments on improving the quality of the thesis.
The Vilho, Yrjö and Kalle Väisälä Fund, Maj and Tor Nessling Foundation and the Academy of Finland are gratefully acknowledged for financial support.
Finally, I would like to thank my family and friends who offered counterbalance to my work. Especially Jooa, who offered plenty of opportunities to put the thesis completely behind me.

5 LIST OF ORIGINAL ARTICLES The thesis is based on the following four articles, of which three have already been published in peer-reviewed journals. The articles are referred to in the text by their Roman numerals: I Bäck, J., Aaltonen, H., Hellén, H., Kajos, M.K., Patokoski, J., Taipale, R.,
Pumpanen, J. & Heinonsalo, J. 2010. Variable emissions of microbial volatile organic compounds (MVOCs) from root-associated fungi isolated from Scots pine. Atmospheric Environment 44: 3651–3659.
doi: 10.1016/j.atmosenv.2010.06.042 II Aaltonen, H., Pumpanen, J., Pihlatie, M., Hakola, H., Hellén, H., Kulmala,
L., Vesala, T. & Bäck, J. 2011. Boreal pine forest floor biogenic volatile organic compound emissions peak in early summer and autumn. Agricultural and Forest Meteorology 151: 682–691.
doi: 10.1016/j.agrformet.2010.12.010 III Aaltonen, H., Pumpanen, J., Hakola, H., Vesala, T., Rasmus, S. & Bäck, J.
2012. Snowpack concentrations and estimated fluxes of volatile organic compounds in a boreal forest. Biogeosciences 9: 2033–2044.
doi: 10.5194/bg-9-2033-2012 IV Aaltonen, H., Aalto, J., Kolari, P., Pihlatie, M., Pumpanen, J., Kulmala, M.,
Nikinmaa, E., Vesala, T. & Bäck, J. Continuous VOC flux measurements on boreal forest floor. Submitted.
The articles are reprinted with the kind permission of Elsevier (I and II) and Copernicus Publications (III), while the study IV is the author version of the submitted manuscript. Author’s contribution: For the summary of this thesis Hermanni Aaltonen was alone responsible. In Paper I, Hermanni Aaltonen participated in processing of the data, data interpretation and writing the article. In Papers II and III, Hermanni Aaltonen was responsible for the VOC measurements, interpretation of the VOC data and writing the bulk of the article. In Paper IV, Hermanni Aaltonen was responsible for the VOC measurements, participated in the data interpretation and wrote the bulk of the article.

6
TABLE OF CONTENTS INTRODUCTION....................................................................................... 9
Volatile organic compounds.......................................................................................... 9 Linking boreal forest VOCs to climate change.............................................................. 10 Techniques for forest floor VOC exchange measurements........................................... 11 Current knowledge of forest floor and soil VOC production and exchange................. 12
OBJECTIVES.............................................................................................. 14 METHODS.................................................................................................. 14
Study site........................................................................................................................ 14 Field measurements....................................................................................................... 15 Laboratory experiment................................................................................................... 16 Analytical methods........................................................................................................ 16
Sample collection..................................................................................................... 17 TD-GC-MS............................................................................................................... 17 PTR-MS.................................................................................................................... 18
Flux calculations............................................................................................................ 19 RESULTS.................................................................................................... 21
Fungal VOC production................................................................................................. 21 Forest floor fluxes of VOCs........................................................................................... 21 Correspondence between manual and automated chamber methods............................. 24
DISCUSSION.............................................................................................. 26
Role of the boreal forests floor as a VOC source.......................................................... 26 Factors behind seasonal and spatial variation................................................................ 27 Effect of environmental factors and disturbances on VOC fluxes.................................28 Comparison with ecosystem-scale VOC fluxes............................................................. 30 Fluxes of other greenhouse gases in relation to forest floor VOCs............................... 32 Benefits and drawbacks of chamber and snow gradient techniques in determining VOC fluxes from forest floor................................................................ 32
CONCLUSIONS.......................................................................................... 33 REFERENCES……………………………………………………….........36
7 LIST OF TERMS AND ABBREVIATIONS emission a substance emitted from a source exchange conceptual, upward or downward, flow of a substance (cp. flux) flux continuous, upward or downward, flow of a substance C carbon CH4 methane CO2 carbon dioxide EC eddy covariance FID flame ionisation detector H hydrogen H3O+ hydronium ion N nitrogen N2O nitrous oxide NO nitric oxide NO2 nitrogen dioxide NO3˙ nitrate radical NOx nitrogen oxides (NO+NO2) O3 ozone ˙OH hydroxyl radical PTR-MS proton transfer reaction-mass spectrometer SOA secondary organic aerosol TD-GC-MS thermodesorption-gas chromatograph-mass spectrometer VOC volatile organic compound

8

9 INTRODUCTION Volatile organic compounds Volatile organic compounds (VOCs) include a broad spectrum of atmospheric hydrocarbons, including terpenoids, alcohols, aldehydes, alkenes and ketones (Kesselmeier and Staudt 1999). Most VOCs are emitted by vegetation, but oceans, biomass burning, and human activities are also important sources. The terrestrial sources of VOCs have been studied quite widely; however, the emissions originating from soils and aquatic ecosystems are poorly known. Anthropogenic sources have become increasingly recognized, even though over 90% of the total VOC emissions have been estimated to originate from natural sources: 1150 Tg of carbon (C) annually (Guenther et al. 1995). For comparison, the estimated annual terpenoid emissions - the main group of biogenic VOCs - in Finland are 146 Gg (0.146 Tg) (Tarvainen et al. 2007), which is approximately 129 Gg of C. VOC emissions from plants have already been measured for decades, but knowledge of the emissions of single (especially non-woody and non-crop) plant species, is limited. In common with the aboveground part of the forest floor, belowground VOC sources have also been recognized but remain largely unknown. It has been assumed that all living and organic components in soil – roots, microbes, soil animals and above- and belowground litter – may emit VOCs.
The ecophysiological functions of VOCs are not fully understood, but numerous compounds, above- and belowground, are related to signalling within plants, between plants, between plants and insects etc., their other very important role relating to antimicrobial defence mechanisms after wounding (e.g. Kesselmeier and Staudt 1999 and references therein, Dudareva et al. 2004, Lucas-Barbosa et al. 2011 and references therein, Schausberger et al. 2012). In the atmosphere, VOCs are important contributors to chemical reactions related to the formation of tropospheric ozone (O3) (Chameides et al. 1992, Fehsenfeld et al. 1992) and secondary organic aerosols (SOA) (e.g. Kulmala et al. 2001). The importance of biogenic VOC emissions is not related to C balance, but to air chemistry, since most of these compounds are very reactive. The role of VOCs in SOA formation via air chemistry also links them closely to climate change.
Terpenoids are a large group of VOCs emitted by natural sources and consist mainly of hemiterpenes, monoterpenes and sesquiterpenes. Isoprene (a hemiterpene) is globally the most abundant (Guenther et al. 1995, 2006) and intensively studied biogenic VOC, containing five C and eight hydrogen (H) atoms (Figure 1). Monoterpenes are composed of two isoprene units and sesquiterpenes of three isoprene units, both of these groups including numerous isomers (Figure 1). Most terpenoids have one or more cyclic structures, but also acyclic terpenoids exist. Common characteristics for terpenoids are also strong odour and poor water solubility. Monoterpenes binding oxygen in their carbon skeleton (e.g. 1,8-cineol and linalool) are often called monoterpenoids (Kesselmeier and Staudt 1999), but in this context they are grouped as oxygenated VOCs. These monoterpenoids and other oxygenated VOCs, such as alcohols, aldehydes and ketones, are commonly found in primary emissions from natural sources and products of oxidation of other organic species in the atmosphere.

10
Figure 1. Structural formulas of the reactive (i.e. compound having a double bond) terpenoids. Starting from the left: isoprene, monoterpenes α-pinene and limonene, and sesquiterpenes α-humulene and longifolene. Linking boreal forest VOCs to climate change The effect of boreal forests on climate change is complicated; the C sequestration and significant C storage of boreal forests, especially boreal soils, mitigates climate change, whereas the low albedo due to dark-coloured evergreen trees warms the climate with approximately the same intensity (Betts 2000, Bala et al. 2007, Bonan 2008). Moreover, since boreal forests are weak in C uptake compared with tropical and temperate forests, their cooling effects by evaporation are likewise weak (Bonan 2008). In summary, this indicates that the net effect of boreal forests on climate change is close to zero and is dependent on local characteristics. In addition, climate change is expected to increase the occurrence of warm autumns, which will decrease the C sequestering of boreal ecosystems (Piao et al. 2008). Based on this, those VOC fluxes taking part in aerosol and cloud formation may be some of the key characteristics determining the net effects of boreal forests on climate change. Both the direct effect and the effect via cloud formation cause negative radiative forcing, but the level of understanding of these processes is low (Figure 2). VOCs, as reactive compounds, are closely associated with air chemistry in the troposphere; they react rapidly with O3 and hydroxyl (OH) or nitrate (NO3) radicals, and the reaction products formed may condense into aerosol particles or affect the growth of atmospheric aerosols (Kulmala et al. 1998, 2001, 2004).
Since many of these compounds have atmospheric lifetimes from minutes to several hours (e.g. mono- and sesquiterpenes) and originate from the canopy and below-canopy compartments, the air chemistry inside and below the canopy also becomes important (Rinne et al. 2007). Conditions for chemical reactions below the canopy differ from those above the canopy e.g. in lower light levels and lower turbulence (mixing). In addition to the environmental conditions, the composition of the emissions also influences the air chemistry. Compounds with double bonds are significantly more reactive, so their proportion in the total fluxes mainly determines the reactions occurring (Hatfield and Huff Hartz 2011). Partially oxygenated compounds, such as methanol and acetone, which have been measured from decaying plant material, are also important for atmospheric chemistry (Warneke et al. 1999). The measurement of oxidation products above the forest canopy, performed by Holzinger et al. (2010), implies that even emissions of unknown but very reactive VOCs may still be present. In addition to the effects of aerosols on climate change, the exact conditions needed for aerosol formation and growth are also not fully understood. Aerosol formation events in the boreal regions, however, have been observed to peak in early summer and autumn (Dal Maso et al. 2005).

11
Figure 2. Components affecting radiative forcing. The red rectangle highlights the section describing the effect of aerosols on radiative forcing. Modified from IPCC 2007. Techniques for forest floor VOC exchange measurements Traditionally, chamber techniques have been applied for measuring forest floor VOC and greenhouse gas exchange. The chamber measurements can be divided into two methods differing fundamentally. In a steady-state (also dynamic, flow-through) method, the chamber headspace is under continuous flushing during the chamber closure, i.e. zero air or ambient air is continuously introduced into the chamber to compensate for the outflow from the chamber (Hari et al. 1999, Hutchinson & Livingston 2002, Pape et al. 2009). In the non-steady-state method, the chamber is fully closed and the gas concentration inside the chamber stabilizes when it corresponds to the concentration inside the soil (Hutchinson & Livingston 2002). The flux calculation in the non-steady-state method is based only on the gas concentration change inside the chamber during the closure, whereas in the steady-state method the removal or adding effect of the through-flow must also be taken into account. The choice of an optimal chamber method (steady-state vs. non-steady-state) has been studied mainly with soil respiration measurements, wherein chamber and collar designs also influence the fluxes measured (Pumpanen et al. 2003, 2004). Employment of the steady-state method to measure soil trace gas fluxes produces reliable results (Pumpanen et al. 2004, Pape et al. 2009, Kolari et al. 2012). The main reason for choosing the steady-state method over the non-steady-state method for VOC measurements is the need for a large air volume for analysis. With this method, it is possible to collect larger sample volumes

12
without inducing severe pressure, temperature and gas concentration changes inside the soil (Pape et al. 2009, Kolari et al. 2012).
Under certain conditions the chamber techniques mentioned above are not applicable. For example, very low fluxes, fluxes passing the chamber through very porous media, such as snow, or fluxes slowing down as the concentration increases within the chamber headspace may, under certain conditions, complicate the use of chambers for flux measurements. The gradient method is optimal for measuring fluxes on or inside highly porous media and for low fluxes, because the disturbance from this method is minimal for the gases measured. In this method, gas concentrations are measured in several layers and the flux is calculated, based on the concentration differences between the layers. For the calculation, additional information on diffusion coefficients and environmental variables (e.g. temperature, moisture and porosity) is needed. For specific VOC measurements, the gradient method is very applicable, snowpack VOC fluxes serving as an example (Helmig et al. 2009). Current knowledge of forest floor and soil VOC production and exchange Studies of VOC emissions from higher plants abound; e.g. VOCs emitted from the branch and canopy levels in boreal forests have been rather well characterized (e.g. Hakola et al. 2003, 2006, Ruuskanen et al. 2005, Tarvainen et al. 2005, Lappalainen et al. 2009). However, studies of forest floor/soil VOC exchange and processes related to forest floor VOC exchange are rare. In the few existing studies, the variety of VOCs measured from soils is broad, and many of these compounds are not found in aboveground plant parts. In field studies and natural soil microcosms, numerous soil-originating VOCs have been found, including alcohols, aldehydes, ketones, aromatics, carboxylic acids, esters, ethers, nitriles, sulphides, and aliphatic hydrocarbons, in addition to the most common terpenoids (Stotzky et al. 1976, Janson et al. 1999, Hayward et al. 2001, Isidorov and Jdanova 2002, Hellén et al. 2006, Asensio et al. 2007a, McNeal and Herbert 2009, Greenberg et al. 2012). Measurements of VOCs have traditionally been conducted mainly during growing seasons, when the VOC emissions from plants are highest. This also applies to the Boreal Zone, where the soil surface is covered by snow during a substantial part of the year. Although several studies have reported wintertime atmospheric VOC concentrations and fluxes from the forest canopies (e.g. Hakola et al. 2003, 2009, Lappalainen et al. 2009), few have analysed the wintertime processes producing VOCs below snow. Snowpack VOC concentrations have been measured in a few studies (e.g. Kos and Ariya 2006, 2010, Helmig et al. 2009, Ariya et al. 2011), and most of these have been focused mainly on VOCs from anthropogenic sources. Karl et al. (2009) even hypothesized that biogenic VOC emissions are close to zero and negligible during the snow cover period.
Since the first time they were quantified, the origin of soil VOC emissions has been under debate. Some field studies indicate that the majority of them may originate from decomposing organic matter and living plant roots (Janson 1993, Hayward et al. 2001, Asensio et al. 2008a, Leff and Fierer 2008, Gray et al. 2010, Greenberg et al. 2012). Soil microbial activity is correlated with net rates of VOC emissions over a range of different forest soils (Asensio et al. 2007a, 2008b, Leff and Fierer 2008), which stresses the importance of microbes and microbial processes as sources of soil VOCs. However, Smolander et al. (2006) found evidence that some parts of the soil microbial population were also able to utilize VOCs as a C source. Thus, the net VOC flux from soil into the

13 atmosphere is determined by the outcome of production and consumption processes occurring in soil. Comparison of the composition of leaf litter and intact leaves led Isidorov and Jdanova (2002) to suggest that most of the VOCs (especially terpenoids) found in litter emissions actually originated from decomposers, instead of the litter itself. Furthermore, Kanerva et al. (2008) found a significant positive correlation between the terpenoid (not monoterpenes) concentrations in pine and spruce forest soil, soil respiration, and microbial biomass, emphasizing the role of microbes in soil VOC exchange. However, most of the measurements were conducted in systems where it is actually very difficult to distinguish between emissions from living plant roots, decomposing litter and the microbes themselves. For example, soil fungi are known to play an important role in decomposing soil organic matter, but their effect on forest floor VOC fluxes is unknown. Increased monoterpene concentrations in the vicinity of tree trunks (Lin et al. 2007, Owen et al. 2007) suggest either a greater amount of living roots, a greater amount of leaf and root litter, a higher activity of decomposers or all these together being a strong source of VOCs in the soil close to the trunks.
Hellén et al. (2006) observed boreal forest floor VOC fluxes peaking in spring and autumn. This type of seasonal variation in fluxes indicates that environmental conditions also clearly impact these fluxes. During winters, the biological processes contributing to VOC exchange in boreal forests, such as activity of plants and microbes, undergo consequential changes due to the environmental conditions. In addition to the indirect effects on soil environmental/physical conditions, temperature and moisture are also directly associated with soil VOC exchange (Asensio 2007a, 2008b, Insam and Seewald 2010 and references therein). Freezing and thawing cycles are good examples of the physical forces increasing litter breakdown during boreal winters and releasing VOCs from the reservoirs at the same time. Not only temperature and moisture conditions, but also the molecular structure of the compounds and their concentration in the reservoir/organic matter has an effect on the release of VOCs into the atmosphere. Since data on VOC concentrations in root and leaf/needle litter and in soil are poorly available, also estimations on their emission potentials are difficult to create. Kainulainen and Holopainen (2002) measured monoterpene concentrations more than 3 mg g-1 (dw) for fresh Scots pine (Pinus sylvestris) needle litter, while the terpenoid concentration in Ponderosa pine (Pinus ponderosa) needle litter were only one tenth of that (Greenberg et al. 2012). The monoterpene concentrations in Stone pine (Pinus pinea) roots, instead, were approximately 1 mg g-1 (dw) according to Lin et al. (2007). However, measurement of VOC content in conifers is complicated due to resin, which is located in specific organs, resin ducts, and contains substantially higher concentrations of terpenoids than surrounding tissues (Staudt et al. 1997).
The role played by biogenic VOCs in C cycling of boreal forests is negligible, but the importance of VOCs is related to their high levels of reactivity. However, C exchange (photosynthesis, respiration, decomposition) is related to VOC emissions, since VOCs are produced in the metabolism of plants and soil microbes (Eisenreich et al. 1998, Dudareva et al. 2004). Root exudation, driven by efficient photosynthesis, plays a major role in the forest C cycle. Mycorrhizal hyphae, which are important contributors to decomposition of soil organic matter, are largely dependent on recent photosynthate emitted from the roots (Högberg et al. 2008). The importance of the forest floor in C cycling is commonly undervalued, even though many studies have reported significant photosynthesis in ground vegetation (Swanson and Flanagan 2001, Kolari et al. 2006, Kulmala et al. 2008). Mosses and vascular plants growing on the forest floor have adapted to low light conditions,

14
photosynthesizing efficiently for most of the growing season (Kolari et al. 2006). The actively functioning forest floor plant ecosystem, especially the belowground part of it, also maintains diverse and effective soil microbial populations, factors of which are crucial to the forest floor VOC exchange. OBJECTIVES The overall aim of this study was to quantify the sources and rates of the boreal soil/forest floor VOC exchange. To clarify the seasonal and diurnal variations in the VOC fluxes, the measurements were conducted throughout the year with different techniques, time resolutions and analytical methods. To reveal whether common soil fungal species can be responsible for producing VOCs, a laboratory experiment with fungal pure cultures was conducted. Since the VOCs strongly impact air quality and climate change via air chemistry and SOA formation, one aim of this thesis was to provide data on biogenic VOC fluxes from the forest floor for modelling purposes.
The specific objectives in the sub-studies were: - To characterize the various VOCs emitted by root-associated fungal groups
(ectomycorrhizal, endophytic, and decomposing fungi) common in boreal forests (I).
- To specify the VOC compounds and quantify their fluxes from the boreal forest floor and to determine the spatial and temporal variability in the fluxes (II–IV).
- To identify the environmental factors controlling soil VOC exchange (I–IV) and to determine the associations of VOC fluxes with seasonal patterns of other trace gases (II).
METHODS Study site All the field measurements of VOCs presented in this thesis were conducted at SMEAR II (Station for Measuring Forest Ecosystem – Atmospheric Relations) in southern Finland (Hari and Kulmala 2005). The forest stand at SMEAR II is 50 years old and dominated by Scots pine. Before the stand was established in 1962 by sowing, it was treated with prescribed burning. The stand height is now ~18 m and the canopy is open, with an average tree density of ~1170 stems ha-1 (Ilvesniemi et al. 2009). The soil above the homogeneous bedrock is Haplic podzol formed on a glacial till, with an average depth of 0.5–0.7 m. The average annual precipitation at the SMEAR II station is 697 mm and annual mean temperature +2.9 °C (Ilvesniemi et al. 2010). Abundant measured background data on the functioning of the boreal forest ecosystem and the atmosphere for analyses with the VOC data presented here are available at the station. All the most important environmental parameters, as well as H2O and trace gas fluxes between the ecosystem and atmosphere are under continuous observation, including meteorological parameters, soil physical parameters and ecophysiological status of the trees (Vesala et al. 1998, Hari and Kulmala 2005, Ilvesniemi et al. 2009, 2010, http://www.atm.helsinki.fi/~junninen/).

15 Field measurements (II–IV) Since the overall focus of this thesis was to determine the role of VOCs emitted from the forest floor in relation to the total VOC flux, the term forest floor should be defined at the beginning. In this context, the term forest floor includes all the below-canopy vegetation (i.e. dwarf shrubs, grasses, herbs and mosses), excluding trees taller than dwarf shrubs (app. 30 cm), plus the soil with its diverse components. All these components are included in the chamber technique, but the effects of single component cannot be separated. Since the levels of boreal forest floor VOC fluxes were relatively unknown, not to mention the seasonal and diurnal variations in the fluxes, or the compounds these fluxes consist of, the values describing total VOC emissions from the forest floor were valuable improvement for the air chemistry models.
In the measurements of this thesis, the steady-state chambers were used for the forest floor VOC flux measurements, irrespective of the analytical method (Figure 3). Both manually operated and automated chambers were used for sample collection. Evaluation made by Kolari et al. (2012) showed the applicability of these kind of dynamic chambers for VOC flux measurements from forest floor. The chambers were always installed on permanently installed collars, thus minimizing disturbances to the surface soil and forest floor vegetation. Manual chambers were installed on the collars only for the time of the sample collection, i.e. between the samplings the chambers were removed. Automated chambers were installed at the beginning of the measurement period, and the chamber lid was kept open between the samplings. During sampling the automated chambers were closed pneumatically. In the continuous VOC measurements conducted in 2010, three automated chambers were connected to the on-line proton transfer reaction-mass spectrometer (PTR-MS) to increase the sampling frequency for monitoring diurnal and seasonal changes in the forest floor VOC fluxes (IV). With the automated chambers connected directly to the PTR-MS, high-frequency (eight per day, 7 min each closure) continuous measurements were possible from three locations without laborious sample collection.
Figure 3. Techniques used for VOC measurements in this study. Manual chamber for TD-GC-MS analysis (top left), automated chamber connected to PTR-MS (top right) and setup of snowpack profile collector before snowfall (below).

16
These two types of chambers were complementary and focused on different aspects for more comprehensive understanding of the forest floor VOC exchange. Spatial representativeness was better with the easily portable manual chambers, whereas the automated measurements resulted in much higher time resolution for the flux measurements. The differences in sample analytics between the chamber types also broadened the total number of measurable compounds (see Analytical methods).
A gradient method was applied for VOC measurements inside the snowpack (III), since the high porosity of snow made the use of chambers impractical. For these wintertime VOC measurements conducted during the winters of 2008–2009 and 2009–2010, three custom-made profile tubings (Figure 3) were used for collecting air samples from three levels (0, 15 and 30 cm above the ground) within the snowpack. Laboratory experiment (I) To analyse the potential sources of the VOC flux from the forest soil, a laboratory experiment was performed. VOC emission rates from eight typical fungal species common in boreal forest soils (Heinonsalo et al. 2007) were measured under laboratory conditions (I). The eight species studied belonged to three functional groups: decomposers (Gymnopilus penetrans, Ophiostoma abietinum), ectomycorrhizal (Cenococcum geophilum, Piloderma olivaceum, Suillus variegatus, Tomentellopsis submollis) and endophytic fungi (Meliniomyces variabilis, Phialocephala fortinii). All the species were isolated from Scots pine ectomycorrhizal root tips and grown in pure cultures with low-nutrient medium for approximately 1 month. VOC samples from the flasks (mimicking the steady-state chambers) containing the fungal cultures were collected with adsorbent tubes (see sample collection) as well as directed to the PTR-MS. Analytical methods One bottleneck in VOC studies analysing the biogenic fluxes has been the analytical techniques. When relatively low atmospheric concentrations in rural environments are measured, detection limits low enough can be achieved with only a few devices. A gas chromatograph (GC) equipped with a thermodesorption (TD) inlet and either an MS or a flame ionization detector (FID) has been used. A relatively new technique (PTR-MS) gives better time resolution, but it cannot separate compounds with the same nominal mass, e.g. monoterpenes. The clear advantage of the TD-GC-MS is its ability to identify compounds, whereas for the PTR-MS the advantage is its truly on-line detection. The FID is mostly used for light hydrocarbon measurements, when compounds are more easily identified based on their retention times only. However, being large and heavy, none of these devices is designed for field measurements and they require stable indoor conditions.
Due to the advantages and disadvantages between these two analytical methods (TD-GC-MS and PTR-MS), it was possible to increase the number of measurable compounds and the temporal coverage of the measurements by applying both methods in the studies of this thesis. In the field measurements at SMEAR II during the snow-free season in 2008, manual chambers were used to collect VOC samples into adsorbent tubes for the TD-GC-MS analysis to screen the compounds emitted from the forest floor and to estimate the spatial variation in emissions at five measurement locations (II). In 2010, the measurements

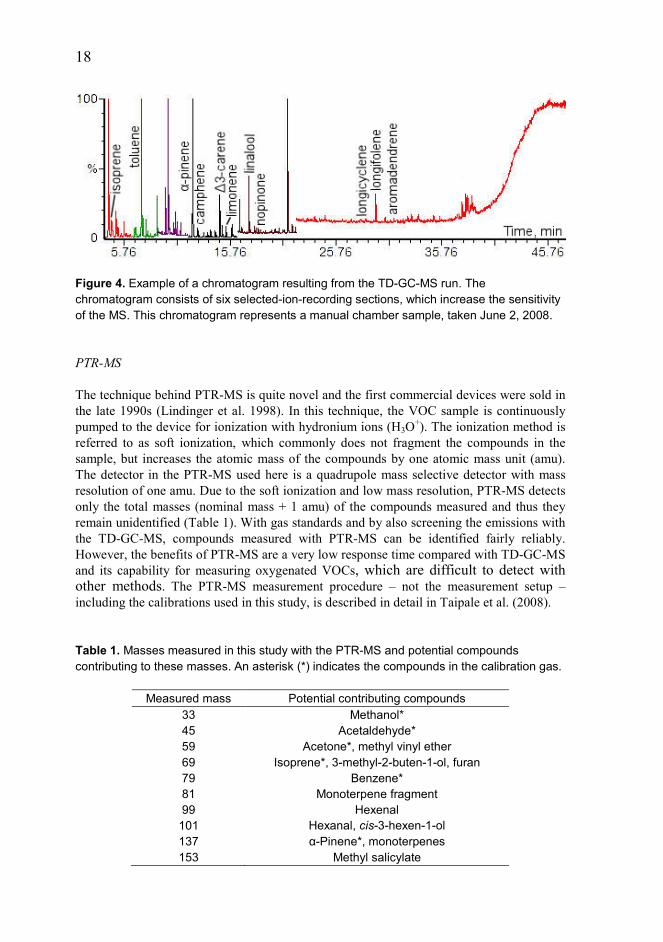
17 were conducted with three chambers connected to the PTR-MS for improving the time resolution of the VOC measurements making it possible to link the fluxes with environmental parameters and to enable the measurements of oxygenated VOCs (IV). The continuous VOC data linked with the environmental parameters was used to explain the processes behind the VOC fluxes. In the laboratory experiment (I), the samples were also collected at the same time for both analytical devices to maximize the spectrum of the compounds measured. Sample collection VOC samples from the fungal cultures (I), manual chambers (II) and snowpack profiles (III) were collected in adsorbent tubes for the TD-GC-MS analysis. The stainless-steel adsorbent tubes contained sections of Tenax TA and Carbopack B adsorbents, in that order. Adsorption with these tubes was optimal at flow rates of approximately 0.1 dm-3 min-1. In the laboratory experiment, only the outlet air from the flasks was collected in the tubes, because zero air was applied for the flushing. From the manual chambers the samples to adsorbent tubes were taken from both inlet and outlet air after the concentration levels of VOCs inside the chamber were stabilized. Samples from snow profiles were collected by circulating air in the profile tubings through the adsorbent tubes. After the sampling, the adsorbent tubes were closed with metal caps and stored under cool conditions (+5 °C), for a maximum of 1 month prior to the analysis. TD-GC-MS GC-MS is a widely used technique for analysing various chemical compounds. It is suitable for liquid- and gas-phase samples with a wide range of molecular masses. An analytical column located in the GC oven separates different compounds in the sample according to their mass, shape and other chemical properties (Figure 4), so the proper column must be chosen according to the type of sample. With proper injector and column, this method has the capacity to analyse hundreds of thousands of different compounds. For VOC analyses, the injector unit is called a thermodesorpter, which evaporates the sample from adsorbent material and concentrates it in a cold trap before injection into the analytical column. Sample concentration by a cold trap lowers the detection limit, commonly a limitation in the low-concentration environmental samples. Before detection, the compounds in the analyte are ionized, which breaks the compounds into certain fragments. According to the unique fragmentation behaviour detected by the MS, the conclusive identification of analytical compounds is possible. However, since the mass spectrum resulting from fragmentation is very similar among the monoterpenes, the retention times determined with standard samples are also applied for identification. The TD-GC-MS calibration procedure with liquid standards used in analyses of this study was evaluated with international intercalibration campaigns (e.g. Global Atmosphere Watch intercalibration).
18
Figure 4. Example of a chromatogram resulting from the TD-GC-MS run. The chromatogram consists of six selected-ion-recording sections, which increase the sensitivity of the MS. This chromatogram represents a manual chamber sample, taken June 2, 2008. PTR-MS The technique behind PTR-MS is quite novel and the first commercial devices were sold in the late 1990s (Lindinger et al. 1998). In this technique, the VOC sample is continuously pumped to the device for ionization with hydronium ions (H3O+). The ionization method is referred to as soft ionization, which commonly does not fragment the compounds in the sample, but increases the atomic mass of the compounds by one atomic mass unit (amu). The detector in the PTR-MS used here is a quadrupole mass selective detector with mass resolution of one amu. Due to the soft ionization and low mass resolution, PTR-MS detects only the total masses (nominal mass + 1 amu) of the compounds measured and thus they remain unidentified (Table 1). With gas standards and by also screening the emissions with the TD-GC-MS, compounds measured with PTR-MS can be identified fairly reliably. However, the benefits of PTR-MS are a very low response time compared with TD-GC-MS and its capability for measuring oxygenated VOCs, which are difficult to detect with other methods. The PTR-MS measurement procedure – not the measurement setup – including the calibrations used in this study, is described in detail in Taipale et al. (2008). Table 1. Masses measured in this study with the PTR-MS and potential compounds contributing to these masses. An asterisk (*) indicates the compounds in the calibration gas.
Measured mass Potential contributing compounds 33 Methanol* 45 Acetaldehyde* 59 Acetone*, methyl vinyl ether 69 Isoprene*, 3-methyl-2-buten-1-ol, furan 79 Benzene* 81 Monoterpene fragment 99 Hexenal
101 Hexanal, cis-3-hexen-1-ol 137 α-Pinene*, monoterpenes 153 Methyl salicylate

19 Flux calculations When VOCs were measured with the steady-state method and adsorbent tube collection (II), the positive or negative emission rate E from the forest floor was determined as a compound mass (μg) per soil surface area (m2) and time (h) according to equation 1.
( )A
FCCE io −= , (1)
where Co is the concentration of VOCs in the air leaving the chamber (μg m−3), Ci is the VOC concentration in the air supplied to the chamber (μg m−3), F is the volumetric flow rate through the chamber (m3 min−1) and A is the enclosed forest floor area (m2). For the PTR-MS analysis, the sample flow was pumped continuously from the chamber to the PTR-MS during the closure. The concentration measurements with the PTR-MS (IV) were started from the very beginning of the chamber closure, and the flux was calculated, using the non-steady-state part of the closures (the first 7 min) by fitting the mass balance equation to these data points when the concentration inside the chamber was approaching the steady state. The change in VOC concentration C inside the chamber during the closure was derived from the mass balance equation
)( oi CCFEdtdCV −+= , (2)
where V is the volume of the chamber. Solving equation 2 for concentration C in the chamber as a function of time t yields a solution
−
+
−+=
−VFt
i eFE
VCCCtC 1)( 0
0 , (3)
where C0 is the VOC concentration at the moment when the chamber closes. VOC emission E from the automated chambers was calculated by fitting equation 2 to the development of the concentration measured during chamber closure (Figure 5). Ordinary least-squares methods were employed in the flux calculation. The ambient concentration C0 was calculated as the average of the PTR-MS readings taken from the open chamber for 30 s before closing the chamber.

20
Figure 5. Examples of fitting of the mass balance equation to the development of measured concentrations of masses 33 (methanol), 59 (acetone) and 137 (monoterpenes). The first two grey dots represent the ambient concentrations of these masses.
For the profile measurements inside the snowpack (III), sampling with adsorbent tubes as well as the analyses were done in a way similar to that with the manual chambers (Figure 3). The emissions flux calculations were made, using the Fick’s law of diffusion, based on the concentration change between the profiles and the diffusion of the target compound(s) between adjacent layers as follows
−=
zCDEδδ
, (4)
where D is the diffusivity of certain compound(s) in air (m2 h−1), δC the difference in gas concentrations (ng m−3) and δz the distance (m) between adjacent profiles. The diffusivity, taking into account the properties of porous media, was estimated by
75.1
0
0
=
TT
PPDD iφτ , (5)
modified from Seok et al. (2009). Here, ϕ is the snowpack porosity and τ the tortuosity, Di is the diffusion coefficient of certain compound(s), which is scaled to the predominant conditions of pressure (P) and temperature (T). However, the snow gradient method also has some disadvantages related to the flux calculation, because it needs some additional information on environmental variables (e.g. temperature, humidity/moisture, porosity of the media) and it is fairly sensitive to the values of the diffusion coefficients, which are poorly available for many compounds and difficult to determine experimentally (Pumpanen et al. 2009).
21
RESULTS With the measurements conducted in the field (II–IV) and in the laboratory (I), tens of different VOCs were detected quantitatively (Table 2), and qualitatively even more. Novel practical measurement techniques increased the level of understanding of these insufficiently studied and poorly known forest floor VOC fluxes. Both analytical methods showed applicability to these kinds of measurements, and complemented each other when used in parallel. The main findings are introduced below and more detailed results are found in the original articles. Fungal VOC production (I) The fungi emitted dozens of compounds in the laboratory experiment. The pure cultured fungi showed clear emissions of several oxygenated VOCs, acetone, acetaldehyde and methanol being the predominant ones. These three compounds clearly constituted the highest proportion of the total emissions, always over 50% and as much as 99%. The emissions of mono- and sesquiterpenes and isoprene were also quantified, but they were very low. The three functional groups (ectomycorrhizal, endophytic and decomposing fungi) represented by the species measured, differed according to their emission profiles. However, the VOC emissions also differed substantially within groups. The differences between the functional groups were highest in the emissions of these three predominant compounds (acetone, acetaldehyde and methanol), ectomycorrhizal fungi emitting substantial amounts of acetone, while acetaldehyde was the major component in emissions from endophytes. Forest floor fluxes of VOCs (II–IV) In the field measurements the terpenoids were the most commonly observed group, of which monoterpenes clearly showed the largest proportion. Approximately 10 different monoterpenes were detected with the field measurements; α-pinene, Δ3-carene and camphene being the compounds most emitted. In addition to monoterpenes, the other members of the terpenoid group, isoprene and sesquiterpenes, were also frequently observed. Usually less than 10 sesquiterpenes were detected and their emissions were always very low. The group accounted for approximately 1% of the terpenoid fluxes in total. With PTR-MS, several oxygenated compounds (e.g. methanol, acetone, and acetaldehyde) were detected frequently, occasionally also in large quantities (IV).

22
Table 2. VOCs, of which the concentrations and/or fluxes were determined quantitatively, and their appearances in the original publications of this thesis. The crosses next to Monoterpenes refer to PTR-MS measurements of M137. If a compound was detected, the number of crosses (one to three) indicates the proportion of the compound in the total concentration/flux: x = low concentration/flux, xx = average concentration/flux and xxx = high concentration/flux.
Paper I Paper II Paper III Paper IV Hemiterpenoids
isoprene x xx xx x methyl butenol x x
Monoterpenes x xxx α-pinene x xxx xxx β-pinene xx xx camphene xxx xxx Δ3-carene x xxx xxx limonene x x x p-cymene x x sabinene x terpinolene x x
Sesquiterpenes α-humulene x x alloaromadendrene x aromadendrene x xx β-caryophyllene x x copaene x iso-longifolene x x xx longicyclene x x x longifolene x x xx
Oxygenated compounds methanol xx xx acetaldehyde xxx x acetone xxx x methyl vinyl ketone xx methyl ethyl ketone xx hexenal x hexanal x x nopinone x x methyl salicylate x 1,8-cineol x x linalool x x x bornylacetate x xx
Aromatic hydrocarbons benzene x x toluene x m- and o-xylene x naphtalene xx

23
The field measurements conducted throughout the year (chamber measurements during the snow-free season and profile measurements inside the snowpack) showed a rather stable emission spectrum, i.e. the compounds followed the same pattern. However, the seasonal variation in the total monoterpene fluxes was substantial, while the sesquiterpene and isoprene fluxes were relatively stable throughout the year (Figure 6). The wintertime and midsummer monoterpene fluxes were fairly low, but in spring and autumn the fluxes were greatly increased. Sesquiterpenes constituted only a minor part of the annual terpenoid fluxes, but since their fluxes were similar throughout the year, winter appears as an important season for sesquiterpenes when the other terpenoid fluxes are lower. During winter, the sesquiterpenes accounted for almost 20% of the terpenoid fluxes (III), while during the other seasons their proportion remained 1%. The forest damages caused by heavy snow loads in winter 2010, resulted in greater understanding of the effects of disturbances. The broken treetops and branches and fallen trees increased the monoterpene concentrations by up to three orders of magnitude and the sesquiterpene concentrations by one order of magnitude. This increased the terpenoid concentrations in the topmost layers to higher levels than those present deeper inside the snowpack.
In addition to the VOC fluxes, the forest floor carbon dioxide (CO2) flux was also measured with automated chambers, which allowed comparison of these fluxes. Excluding a few of the highest values, the forest floor VOC flux was always less than 1% of the CO2 flux (Figure 7). Comparison of C fluxes only is more difficult, since VOCs have varying C content; however, in most of the VOCs the C content is higher than in CO2 (27%). Thus, the proportion of C emitted from the forest floor as VOCs is most probably higher than if only VOCs and CO2 are compared, but still only a few percent at most. The contribution of VOCs to the forest floor C flux was highest basically when the VOC flux was highest (i.e. spring/early summer and autumn), because the highest CO2 flux occurred in midsummer, when the VOC flux was very low. Since the chambers were transparent, the CO2 flux was always highest at night, when the vegetation inside the chambers was not photosynthesizing. While the VOC flux was highest during the afternoon, the diurnal variation in VOC/CO2 flux ratio was always highest during day.

24
Figure 6. Seasonal variation in monoterpene, sesquiterpene and isoprene fluxes measured with two different techniques. a) Monoterpene fluxes measured in 2008 with manual (MC) and in 2010 with automated (AC) chambers during the snow-free season, and from inside the snowpack at two levels (0–15 cm and 15–30 cm above the ground) during winters 2008–2009 and 2009–2010. Note the scale of the AC monoterpene fluxes at the right y-axis. b) Sesquiterpene fluxes measured in 2008 with manual (MC) chambers in the snow-free season and from inside the snowpack at two levels (0–15 cm and 15–30 cm above the ground) during winters 2008–2009 and 2009–2010. c) Isoprene fluxes measured in 2008 with manual (MC) and in 2010 with automated (AC) chambers. Correspondence between manual and automated chamber methods Only about half of the total number of compounds observed was measurable with both manual and automated chambers, since the measurements with the manual chambers were performed by the TD-GC-MS and with the automated chambers by PTR-MS (II, IV). Sesquiterpenes were not measured with the PTR-MS, since this device was tuned for lower masses, and to measure sesquiterpene concentrations near ambient, the integration times needed (Kim et al. 2009) would be too long for our chamber setup. Short-chained

25 oxygenated compounds, such as alcohols, aldehydes and ketones, were lacking from the TD-GC-MS measurements. With isoprene, the results were easily comparable, but comparison between the monoterpene results was more complicated, due to these major analytical differences between the devices. With monoterpenes, the mass 137 in the PTR-MS was compared with the sum of all the monoterpene compounds measured by TD-GC-MS. Thus, some discrepancy in the results between the measurement techniques was expected, since the measurement setups were different and the measurements were conducted in different years (2008 and 2010). However, isoprene showed very similar flux levels with both measurements techniques (Figure 6). PTR-MS showed clearly higher monoterpene fluxes than the manual chambers, but the spatial variation between the chambers within the technique was even more prominent. In the two chambers with low monoterpene flux measured by PTR-MS, the flux levels were similar to those of the manual chambers, indicating the spatial variation in the fluxes being at least as significant a source of variation as the different measurement techniques.
Figure 7. Proportion of forest floor VOC flux in the CO2 flux, measured between May 6 and November 16, 2010.

26
DISCUSSION Role of the boreal forest floor as a VOC source The boreal forest floor emitted measurable amounts of numerous VOCs, but from the standpoint of forest floor C exchange, forest floor VOCs play only a minor role. However, complex processes and high spatial heterogeneity occurring belowground complicate the study of VOC sources. Several studies indicate that living plant roots and decomposing organic matter are the likely sources of forest floor VOCs (Janson 1993, Hayward et al. 2001, Asensio et al. 2008a, Leff and Fierer 2008, Gray et al. 2010). The VOC emissions from above- and belowground litter are perhaps the best example of the diversity of processes taking part in the release of VOCs to the atmosphere. Volatiles are released from the litter either through molecular diffusion or after the VOC storages are exposed, due to physical degradation and active biological decomposition breaking up litter structures. In addition to the sources mentioned previously, decomposing microbes (bacteria and fungi) as well as soil animals most probably emit some compounds (Leff and Fierer 2008, Gray et al. 2010, Insam and Seewald 2010, Isidorov et al. 2003) and some microbial populations in soil may also uptake VOCs (Smolander et al. 2006).
All the field measurements in this study showed the highest fluxes for compounds belonging to the terpenoid group, of which the major part consisted of monoterpene compounds. Hellén et al. (2006) also observed that terpenoids constituted the majority of VOC emissions from the boreal forest floor and monoterpenes were the most emitted compounds. However, the maximum flux (373 μg m-2 h-1) measured by Hellén et al. (2006) with adsorbent tubes was notably higher than that quantified with the same technique in this study. Hellén et al. (2006) assumed that needle litter and fine roots in topsoil were the main sources of the terpenoids, which were also suggested by the studies of Janson (1993) and Hayward et al. (2001). The forest floor remained a source of terpenoids not only during the growing season, but also during winter, however, the flux level was clearly lowered, approximately by a factor of ten. A plausible source of terpenoids in winter may be the decomposition process remaining active below the insulating snow cover. The soil temperature below the snowpack, with the exception of the very surface of the soil, usually remains at or above zero throughout the winter, and the decomposition is not completely ceased, even at temperatures below zero (Kähkönen et al. 2001). During winter, the VOC concentrations inside the snowpack were measured with the snow gradient method (III) and the fluxes of mono- and sesquiterpenes through the snowpack were calculated, based on the terpenoid concentration. Since several parameters in the equations were very difficult to determine accurately, these flux values should be regarded more as estimates. Regardless of these uncertainties in wintertime flux measurements, the results indicate undoubtedly that the forest floor was a source of terpenoids also below the snowpack.
Fluxes of sesquiterpenes were observed frequently and the fluxes composed of less than 10 different compounds. The sesquiterpene fluxes observed from the forest floor were generally low; however, they may have been influenced (i.e. lowered) by the high reactivity of these compounds. Since the atmospheric lifetime of sesquiterpenes is on the order of minutes, e.g. less than 2 min for β-caryophyllene (Rinne et al. 2007), they may already have been converted to other compounds by chemical reactions inside the chamber before ending up in the adsorbent tubes. For example, if the main source of sesquiterpenes is in the soil, chemical reactions may substantially consume these compounds before they reach the soil
27 surface and the collection/measurement point. In contrast, isoprene is an example of a less reactive terpenoid with no known sources in the soil. Isoprene is synthesized only in the photosynthetic tissues of vascular plants and mosses (Schnitzler et al. 2002 and references therein). Since the chambers also enclosed the shoots of the vascular forest floor vegetation and soil-covering mosses, some isoprene fluxes were expected. It was expected of detectable isoprene emissions, based on the results of Hanson et al. (1999), that isoprene emission is more common in mosses than in vascular plants. However, the isoprene fluxes from the forest floor under field conditions were minimal. This result led to speculations on the importance of the chemical reactions inside the chamber as a sink of isoprene. Alternatively, isoprene fluxes may also be consumed by uptake into soil.
So far, detailed screenings of fungal VOC production have been conducted mainly for fungal species related to mould damage in buildings, and numerous compounds have been observed (e.g. Sunesson et al. 1995, Korpi et al. 1998, Claeson et al. 2002). However, the pure cultured fungi extracted from boreal forest soil also showed high VOC emissions (I), but mainly of compounds different from those measured from the forest floor. Instead of terpenoids, short-chain oxygenated VOCs were the predominant types in fungal emissions. Even though the compound composition of the emissions was relatively similar between the functional fungal groups, large differences were observed in the emission quantities of single compounds and in total emissions. Within the functional groups, the variation in the emissions was relatively large, making it challenging to apply the VOC emission blend for identification of different functional fungal groups. Nevertheless, the potential for identifying cultured microbes according to the differences in their VOC emissions has awakened interest (Fischer et al. 1999, Ewen et al. 2004). Bunge et al. (2008) obtained promising results, using PTR-MS to identify microbes according to their VOC emission blend. However, in the natural environment the identification of fungal groups according to their VOC emissions would most probably be very difficult or even impossible, due to the higher emission background. In addition, the variation in VOC emissions between species within the same group is most probably more substantial under natural conditions. The changes in substrate quality as well as in the environmental conditions may affect VOC emissions over time and thus make identification even more challenging. Identical growth media and the conditions the fungi experienced in the laboratory experiment were probably more suitable for some but not all of the species, which may also have influenced the VOC emissions, similar to the natural environment, where species meet more or less ideal habitats. Factors behind seasonal and spatial variation The forest floor measurements showed clear seasonal variation in VOC fluxes. The highest fluxes were observed in spring and autumn with both the manual and automated sampling methods. Similar seasonal behaviour in forest floor VOC fluxes was also observed by Hellén et al. (2006). The processes behind this variation are not sufficiently known, but most probably it is linked with the phenology of plants, changes in soil physical environment and availability of decomposable litter. The likely reasons for the higher fluxes in spring and early summer are soil warming and drying, which increase the volatility and diffusion of VOCs. Intensively growing vegetation may also play a significant role behind this phenomenon. Hellén et al. (2006) observed high forest floor monoterpene fluxes in very early spring, assuming them to originate from compounds

28
stored below the snowpack and released after the snowmelt. For high autumnal VOC fluxes, the most probable reason was the fresh needle litter beginning to decompose. A Scots pine drops the oldest needle class in autumn and the volatiles are released slowly from the resin ducts (Staudt et al. 1997) of the fallen needles. The complete decomposition of pine needles requires several years, depending on the conditions, but the release of volatiles from needles also takes time, approximately 1–3 years (Kainulainen and Holopainen 2002).
The wintertime terpenoid fluxes were not high, although clearly detectable. The monoterpene fluxes in winter were only a few percent of the fluxes during the snow-free season, but the sesquiterpene fluxes remained stable throughout the year. From the atmospheric standpoint, the proportion of the sesquiterpenes as highly reactive and potentially very efficient SOA precursors (Johnson and Marston 2007) increases, due to their retaining flux levels, even though the total terpenoid fluxes decrease in winter. Overall, the absence of terpenoid emissions from herbs and deciduous trees and the low emissions from evergreen trees in winter stresses the importance of forest floor fluxes in total boreal forest ecosystem terpenoid fluxes.
The substantial spatial variability in the measurements originates from the great heterogeneity of the environmental variables in the forest floor. Soil and the forest floor are widely recognized as very heterogeneous parts of the forest ecosystem, and were also observable in addition to VOC fluxes as distinguished from fluxes of all the other greenhouse gases (Kolari et al. 2006, Pihlatie et al. 2007, Pumpanen et al. 2008). Plants play an important role in this heterogeneity; roots and litter production largely determine soil processes and structure as a result of their role in soil C and nutrient cycles. Trees also play a major role in controlling microclimatic conditions on the forest floor. Light levels and wind conditions in the below-canopy differ clearly from conditions above the canopy, trees even affect precipitation entering the soil surface. For forest floor VOCs, the ground vegetation plays a contrasting role: leaf measurements show emissions from plants, but fluxes measured with forest floor chambers were lower in locations with high forest floor density. Most probably this relates to increased humidity inside the chamber in locations with more dense vegetation. Effect of environmental factors and disturbances on VOC fluxes In field measurements, the fluxes of the different sources are affected by all the biological and physical factors, and thus the effect of a single factor is difficult to separate. The effects of the most prominent environmental variables (temperature and moisture) on forest floor VOC fluxes are realized basically in two ways. High temperature increases the volatility of these compounds, whereas high moisture reduces diffusivity and traps water-soluble compounds on surfaces (Figure 8). These examples described direct effects. Indirect effects, which are much more difficult to assess, include effects on the physiological status of the potential VOC sources, such as plants and microbes. Radiation has no direct effects on belowground VOC formation, but it affects the fluxes by accelerating diffusion due to heating. For plants, radiation is vital, and soil processes, including processes related to VOC exchange, are largely maintained by root exudates and litter input. The direct and indirect effects of environmental variables may also have different optimal levels for VOC fluxes. For example, the increase in soil moisture always reduces diffusion, but for maintaining plant growth and soil microbial functioning, sufficient moisture conditions are
29 needed. For wintertime VOC fluxes, the structure of snowpack has more prominent effect than the thickness alone, since soil temperature beneath snowpack is relatively stable. Climate change is predicted to increase the number of thawing periods during winters, which generates ice layers inside the snowpack and hinders the diffusion of VOCs. This will also increase the springtime VOC bursts, since accumulated compounds are released after snowmelt. Also changes in the duration of the snow cover period probably play a significant role not only for wintertime but also for late autumn and early spring VOC fluxes.
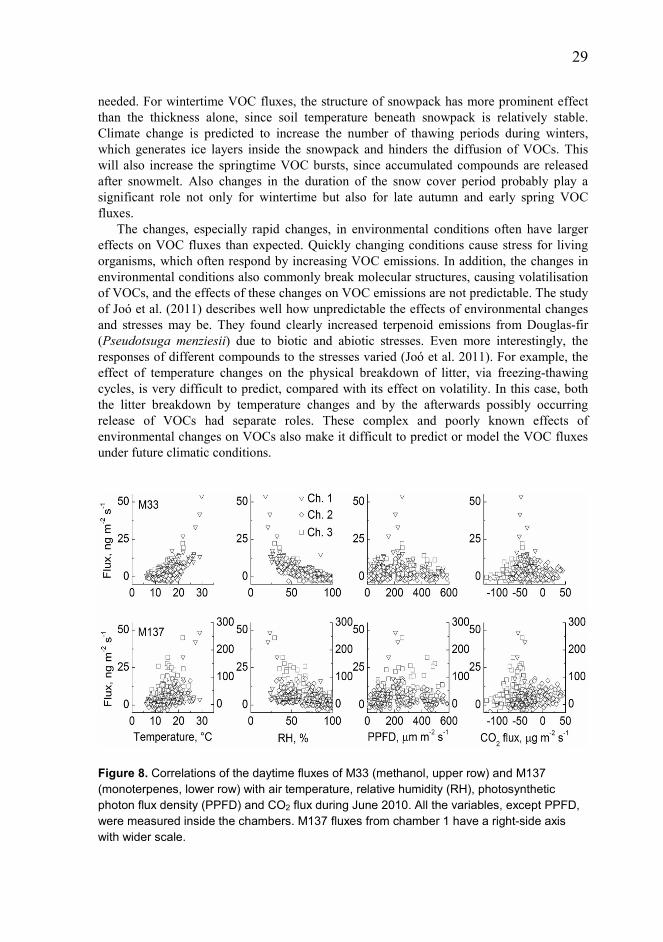
The changes, especially rapid changes, in environmental conditions often have larger effects on VOC fluxes than expected. Quickly changing conditions cause stress for living organisms, which often respond by increasing VOC emissions. In addition, the changes in environmental conditions also commonly break molecular structures, causing volatilisation of VOCs, and the effects of these changes on VOC emissions are not predictable. The study of Joó et al. (2011) describes well how unpredictable the effects of environmental changes and stresses may be. They found clearly increased terpenoid emissions from Douglas-fir (Pseudotsuga menziesii) due to biotic and abiotic stresses. Even more interestingly, the responses of different compounds to the stresses varied (Joó et al. 2011). For example, the effect of temperature changes on the physical breakdown of litter, via freezing-thawing cycles, is very difficult to predict, compared with its effect on volatility. In this case, both the litter breakdown by temperature changes and by the afterwards possibly occurring release of VOCs had separate roles. These complex and poorly known effects of environmental changes on VOCs also make it difficult to predict or model the VOC fluxes under future climatic conditions.
Figure 8. Correlations of the daytime fluxes of M33 (methanol, upper row) and M137 (monoterpenes, lower row) with air temperature, relative humidity (RH), photosynthetic photon flux density (PPFD) and CO2 flux during June 2010. All the variables, except PPFD, were measured inside the chambers. M137 fluxes from chamber 1 have a right-side axis with wider scale.

30
Infrequently occurring disturbances enable a more thorough understanding of the processes behind biological VOC formation. Disturbances can be imagined as laboratory experiments in which one or more environmental factors are altered to a level not regularly met in field measurements. If this type of change could be utilized with representative measurements, the result could clarify the origin of the emissions. At least severe droughts, forest damages and clear-cutting have increased VOC fluxes in field measurements (Strömvall and Petersson 1991, Asensio et al. 2007b, Haapanala et al. 2012). The severe forest damages occurring during the wintertime profile measurements remarkably affected the below-canopy VOC concentrations. Terpenoid concentrations in the top layers of snow and in the air increased dramatically compared to deeper inside the snowpack. Forest management practices seem to have a similar effect; Strömvall and Petersson (1991) and Haapanala et al. (2012) measured clearly increased monoterpene concentrations and fluxes above areas exposed to recent silvicultural practices in boreal forests. In the long run, however, forest damages and clear-cutting most probably decrease the VOC fluxes due to reduced tree biomass, the main origin of VOCs. During the snow-free field measurements in this study, severe disturbances, such as droughts, precipitation events or winds, did not occur. Thus, the flux levels measured here represent those for an average year. The few periods with low soil water content occurring during the measurements did not correlate with high VOC fluxes. Most probably these short-term drought periods were not severe enough to increase the VOC fluxes, as determined by Asensio et al. (2007b). However, they also noted that the drought effects on monoterpene fluxes were compound-specific. Comparison with ecosystem-scale VOC fluxes Ecosystem-scale VOC fluxes in forests are dominated by emissions from the foliage (Guenther et al. 2006, Tarvainen et al. 2007, Greenberg et al. 2012, Noe et al. 2012). In addition to the forest floor, stems and branches of trees also emit VOCs (Figure 9). Traditionally, VOC measurements in forests have focused only on green foliage, while stems, branches, ground vegetation and soil have been almost totally ignored. Aquatic ecosystems inside forests may also play a role in the total VOC flux, but this compartment has been very poorly studied. To determine ecosystem-scale VOC exchange, measurement techniques covering the entire ecosystem are needed, or alternatively the total flux can be modelled, using data from smaller scale (e.g. leaf, branch, soil) measurements if all compartments are included. Disjunct eddy covariance (EC) and flux gradient methods enable measurements of forest ecosystem-scale VOC emissions, while canopy-scale emissions are instead often up-scaled from branch enclosure measurements. Ecosystem-scale measurements provide an overview of the climatic effects of forest-emitted volatiles; however, the quantitative and qualitative results of studies of forest ecosystem volatiles are commonly not very consistent. Rinne et al. (2007) reported boreal forest ecosystem VOC fluxes up to 800 μg m-2 h-1 as measured by disjunct EC coupled with PTR-MS, i.e. clearly higher fluxes than the chamber measurements showed for the forest floor. Several ecosystem-scale monoterpene fluxes measured in the boreal forests of Europe were examined by Rinne et al. (2009), all showing flux levels up to 800 μg m-2 h-1, which is approximately an order of magnitude higher than those from the forest floor. In contrast, Ruuskanen et al. (2005) reported monoterpene emissions from Scots pine branches that were even lower than forest floor monoterpene fluxes. In comparison to the monoterpene fluxes from the boreal Scots pine forest canopy (Hakola et al. 2003, 2006, 2009), the forest
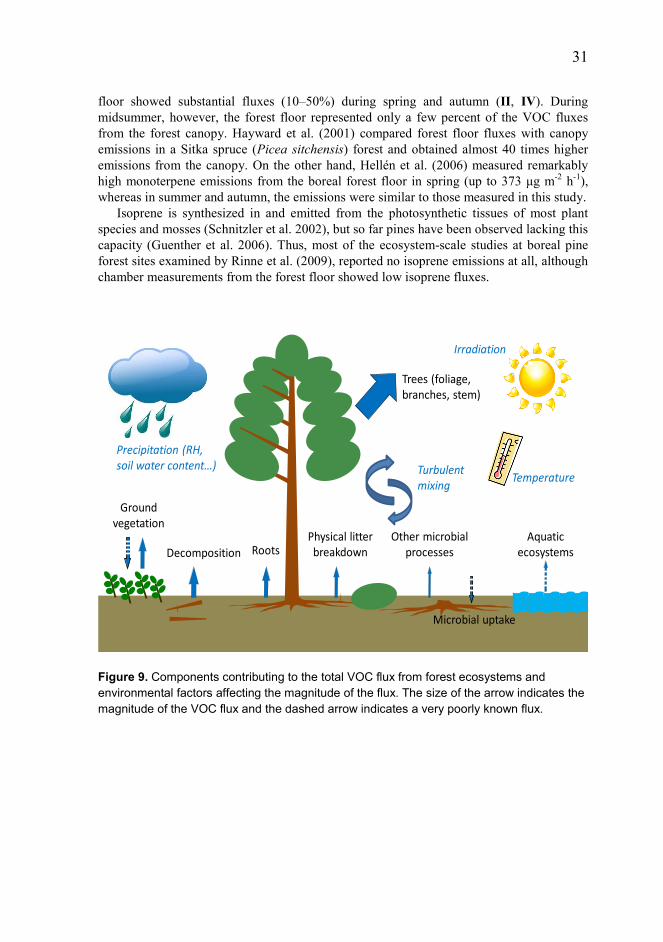
31 floor showed substantial fluxes (10–50%) during spring and autumn (II, IV). During midsummer, however, the forest floor represented only a few percent of the VOC fluxes from the forest canopy. Hayward et al. (2001) compared forest floor fluxes with canopy emissions in a Sitka spruce (Picea sitchensis) forest and obtained almost 40 times higher emissions from the canopy. On the other hand, Hellén et al. (2006) measured remarkably high monoterpene emissions from the boreal forest floor in spring (up to 373 μg m-2 h-1), whereas in summer and autumn, the emissions were similar to those measured in this study.
Isoprene is synthesized in and emitted from the photosynthetic tissues of most plant species and mosses (Schnitzler et al. 2002), but so far pines have been observed lacking this capacity (Guenther et al. 2006). Thus, most of the ecosystem-scale studies at boreal pine forest sites examined by Rinne et al. (2009), reported no isoprene emissions at all, although chamber measurements from the forest floor showed low isoprene fluxes.
Figure 9. Components contributing to the total VOC flux from forest ecosystems and environmental factors affecting the magnitude of the flux. The size of the arrow indicates the magnitude of the VOC flux and the dashed arrow indicates a very poorly known flux.
Physical litter breakdown
Other microbial processes
Ground vegetation
Trees (foliage, branches, stem)
Aquatic ecosystemsDecomposition Roots
Turbulent mixing
Temperature
Irradiation
Precipitation (RH, soil water content…)
Microbial uptake

32
Fluxes of other greenhouse gases in relation to forest floor VOCs Since soil VOC fluxes are evidently associated with several soil processes, it was also expected that some other gas fluxes from soils would follow similar seasonal variation with VOCs. However, soil respiration (i.e. CO2 emission), being basically temperature-dependent only and peaking in midsummer, showed practically no correlation with VOC fluxes (Pearson’s correlation -0.4–0.6) (Figure 8). Methane (CH4) and nitrous oxide (N2O) fluxes, measured at the SMEAR II stand, also showed different exchange patterns (Pumpanen et al. 2003, Pihlatie et al. 2007). The soil at SMEAR II constituted a small sink of CH4 and oxidation occurred when the soil was well aerated. As a result, the VOC fluxes were lowest and CH4 oxidation highest in midsummer and vice versa during spring and autumn, although the variation in the CH4 fluxes was small. The associations between the processes behind the soil VOC and nitrogen (N) fluxes were more expected, since the litterfall was an important source of forest floor VOC fluxes as well as the source for the complex N processes in soils (Pihlatie et al. 2007, Canfield et al. 2010). In the literature, there are speculations on the effects of VOCs on N processes in soil, and some evidence of antagonistic effects has been presented (Smolander et al. 2012 and references therein). Monoterpenes, for example, have been found to inhibit net N mineralisation and nitrification in soils, probably due to changes they induced in microbial communities (White 1994, Paavolainen et al. 1998, Smolander et al. 2006). Since VOCs apparently play a role in N-related processes in soil, they most probably also affect emissions of N compounds from soil (Canfield et al. 2010, Su et al. 2011). At the SMEAR II stand, N2O fluxes from the forest floor were overall lower than the VOC fluxes (< 0.5 μg N2O-N m-2 h-
1) and other seasons, except autumn, showed no linkage with VOC emissions. In autumn, however, litterfall induced similar peaks in N2O and VOC emissions (Pihlatie et al. 2007). The fluxes of nitrogen oxides (NOx) (measured as nitric oxide (NO) + nitrogen dioxide (NO2)), reactive N species, showed flux levels similar to those of N2O that also slightly increased towards autumn. As with VOCs, chemical reactions complicate the measurements of NOx fluxes. Negative fluxes (i.e. deposition) are observed frequently with both of these compound groups (VOC + NOx); however, with NOx the downward fluxes were observed during day (Korhonen et al. 2012). Benefits and drawbacks of chamber and snow gradient techniques in determining VOC fluxes from forest floor Since the aim of this study was to quantify the forest floor VOC exchange and to determine the processes affecting these gas flows, chamber and snow gradient methods were chosen, instead of methods with larger footprints, such as EC. Chamber and small-scale gradient methods represent local conditions well, whereas VOC footprints on scales from hundreds of metres to kilometres in EC measurements are notably too much for process-based studies. However, the large heterogeneity in soil ecosystems again makes up-scaling of chamber results problematic. For adequate spatial representativeness, a dense network of measurements is needed. Chamber techniques have already proven their applicability to VOC measurements (e.g. Pape et al. 2009, Kolari et al. 2012), since they are quite easy to handle and also enable monitoring of other gas fluxes in parallel. With automated chambers, the temporal development of fluxes is easy to follow. Of course, chambers also have drawbacks, such as increased temperature and humidity inside the chamber headspace,

33 surface reactions on the chamber walls and pressure changes inside the soil. By choosing an adequate chamber method, chamber size and analytical method, these problems are manageable and high spatial and temporal representativeness can be achieved. For VOC measurements above the snowpack, the steady-state chamber method proved impractical, due to the high porosity of snow. Thus, VOC fluxes were measured by the snow gradient method with gas-collecting profiles inside the snowpack. This method is also applicable belowground and enables the monitoring of production and consumption processes of VOCs at different depths/heights. Since the flux values in the snow gradient method are calculated from the gas concentrations in the profiles, this technique needs some additional information on the diffusion and environmental variables. The diffusion coefficients are very poorly available for VOCs, which makes this otherwise sensitive and low-disturbance measurement technique slightly unsuitable for VOC flux measurements. Since determination of diffusion coefficients would require a calibration setup for determining diffusion rates through the specific media, the coefficients can be also theoretically estimated based on the properties of the compounds and the media (Fuller et al. 1969, Poling et al. 2000). However, it is difficult to evaluate the validity of those estimated diffusion coefficients.
Even though it is theoretically possible to individually screen the active soil components (roots, bacteria, fungi, soil animals etc.) and different types of litter at varying stages of decomposition in the laboratory to determine whether they are emitting VOCs and if so, which type, it is only part of the overall answer. The interactions of these possible sources in natural environments under changing environmental conditions may result in emissions that are not even close to the sum of the emissions of the separate components. The high terpenoid concentrations and fluxes measured from the snowpack after the second winter with substantial forest damages offer a good example. The 10- to 100-fold increase in terpenoid concentrations resulting from forest damages caused by heavy snowfall were measurable only with ecosystem-scale techniques (flux gradient method, chambers, EC) and would have been very difficult to predict without intensive measurements. In addition to changes in VOC sources, the multiple chemical reactions these compounds generate in soil environments are the other reason why separate measurements under laboratory conditions are not representative of total forest floor VOC emissions. Taking the field measurements in this context, regardless of the limitations and problems of these techniques, they are the only way to measure the effective forest floor VOC fluxes including soil functioning, ground vegetation, physical environmental conditions and below-canopy air chemistry. CONCLUSIONS Forest floor VOC exchange accounts for less than 1% of boreal forest floor C exchange. This means that the importance in studying forest floor VOCs lies elsewhere. Signalling within and between plants, between plants and insects, pathogens and soil animals, and the effects on air chemistry constitute the importance of VOCs. For the VOC fluxes of boreal forest ecosystems, the forest floor accounts for a few to tens of percent, depending on the season. Since the area of the Boreal Zone is about 13.7 million km2 (FAO 2001), total forest floor VOC emissions are significant.

34
Boreal forest floors emit VOCs, occasionally even in high amounts. The forest floor VOC emissions were highest 2–3 months following the snowmelt. Another important season was in autumn, more specifically late autumn after the fall of pine needles. During midsummer and winter, the forest floor remained as a source of VOCs, but then the flux was low. In addition to the seasonal variation, continuous measurements showed evident diurnal variation in fluxes. The daytime VOC flux during the snow-free season was clearly upward, the night-time flux being more or less zero.
The forest floor VOC fluxes consisted of tens of compounds, terpenoids being the most prevalent group, which also included the most emitted single compounds. The subgroup of terpenoids, monoterpenes, included the compounds most emitted, followed by several oxygenated compounds and sesquiterpenes. Examples of the most emitted compounds include monoterpenes α- and β-pinene, Δ3-carene and camphene, oxygenated VOCs methanol, acetaldehyde and acetone, and sesquiterpene longifolene. The field measurements indicated that terpenoids showed the highest emissions throughout the year, while laboratory experiments with fungal cultures instead showed high emissions of oxygenated compounds.
Two things make it difficult to give any precise estimate on the emissions: 1) VOC emissions consist of a blend of large numbers of compounds and 2) these emissions originate from yet unknown sources in very heterogeneous forest floors. All the biological components – plant shoots, roots, microbes – apparently play a role in forest floor VOC fluxes. Based on the measurements conducted in this study, the forest floor VOC flux in boreal pine forests varies from a few to several tens of micrograms per square metre per hour most of the time. The proportion of the forest floor is roughly 10% of forest ecosystem-scale VOC fluxes. However, during some time periods, such as in autumn or winter, the forest floor may even play the major role in boreal forest VOC fluxes.
Since the sources of forest floor fluxes have been poorly known, their modelling is also very difficult. Plant VOC emissions have been modelled with reasonable success, based only on light and temperature conditions (Guenther et al. 1995, 2006), but for describing soil emissions these two parameters are not enough. VOC measurements in the field show that emission levels are dependent on physical environmental variables, but the biological environment (e.g. litterfall, active elongation season of plants, microbes) also clearly plays a role. The repeated changes in the environment maintain diurnal and seasonal variation in VOC emissions. In the case of soil emissions, irradiation seems insignificant for diurnal variations, which are more temperature-driven. Temperature affects directly by increasing volatility and indirectly by accelerating other biological processes. Seasonal variation instead is a sum of several physical and biological changes in the environment. In addition to these predictable diurnal or seasonal changes in the environment, occasional disturbances/stresses also play a role in VOC emissions. Droughts, abnormal temperatures and storms all significantly affect forest floor/soil VOC emissions, as do also forest damages caused by high snow loads or forest management practices.
Determination of the major belowground VOC sources is the most important future task. Soil processes are challenging to study without disturbing the entire system too much. Even more difficult is to separate the roles of different processes in VOC formation. Thus, both comprehensive field and laboratory studies are needed. Information about the terpenoid contents of plants, litter and soils is scarce and need to be improved. However, current knowledge dictates that the main focus should be placed on studying the role of soil microbes in VOC fluxes, their own metabolism and the processes these microbes maintain (e.g. decomposition). Extreme weather events and disturbances may also make it possible

35 to determine the effects of exceptional environmental conditions in the field. These exceptional environmental conditions may help to identify the roles of separate processes, as well as their optimal conditions. As climate change proceeds, extreme weather events are assumed to occur more often, which may alter the biogenic VOC emissions significantly at the same time as also offering conditions for determining VOC processes in the field.

36
REFERENCES Ariya, P.A., Domine, F., Kos, G., Amyot, M., Côté, V., Vali, H., Lauzier, T., Kuhs, W.F.,
Techmer, K., Heinrichs, T. & Mortazavi, R. 2011. Snow – a photobiochemical exchange platform for volatile and semi-volatile organic compounds with the atmosphere. Environmental Chemistry 8: 62–73.
Asensio, D., Peñuelas, J., Filella, I. & Llusià, J. 2007a. Online screening of soil VOCs exchange responses to moisture, temperature and root presence. Plant and Soil 291: 249–261.
– , Peñuelas, J., Llusià, J., Ogaya, R. & Filella, I. 2007b. Interannual and interseasonal soil CO2 efflux and VOC exchange rates in a Mediterranean holm oak forest in response to experimental drought. Soil Biology and Biochemistry 39: 2471–2484.
– , Owen, S.M., Llusià, J. & Peñuelas, J. 2008a. The distribution of volatile isoprenoids in the soil horizons around Pinus halepensis trees. Soil Biology and Biochemistry 40: 2937–2947.
– , Peñuelas, J., Prieto, P., Estiarte, M., Filella, I. & Llusià, J. 2008b. Interannual and seasonal changes in the soil exchange rates of monoterpenes and other VOCs in a Mediterranean shrubland. European Journal of Soil Science 59: 878–891.
Bala, G., Caldeira, K., Wickett, M., Phillips, T.J., Lobell, D.B., Delire, C. & Mirin, A. 2007. Combined climate and carbon-cycle effects of large-scale deforestation. Proceedings of the National Academy of Sciences of the United States of America 104: 6550–6555.
Betts, R.A. 2000. Offset of the potential carbon sink from boreal forestation by decreases in surface albedo. Nature 408: 187–190.
Bonan, G.B. 2008. Forests and climate change: forcings, feedbacks, and the climate benefits of forests. Science 320: 1444–1449.
Bunge, M., Araghipour, N., Mikoviny, T., Dunkl, J., Schnitzhofer, R., Hansel, A., Schinner, F., Wisthaler, A., Margesin, R. & Märk, T.D. 2008. On-line monitoring of microbial volatile metabolites by proton transfer reaction-mass spectrometry. Applied and Environmental Microbiology 74: 2179–2186.
Canfield, D.E., Glazer, A.N. & Falkowski, P.G. 2010. The evolution and future of Earth’s nitrogen cycle. Science 330: 192–196.
Chameides, W.L., Fehsenfeld, F., Rodgers, M.O., Cardelino, C., Matinez, J., Parrish, D., Lonnemans, W., Lawson, D.R., Rasmussen, R.A., Zimmerman, P., Greenberg, J., Middleton, P. & Wang, T. 1992. Ozone precursor relationships in the ambient atmosphere. Journal of Geophysical Research 97: 6037–6055.
Claeson, A.-S., Levin, J.-O., Blomquist, G. & Sunesson, A.-L. 2002. Volatile metabolites from microorganisms grown on humid building materials and synthetic media. Journal of Environmental Monitoring 4: 667–672.
Dal Maso, M., Kulmala, M., Riipinen, I., Wagner, R., Hussein, T., Aalto, P.P. & Lehtinen, K.E.J. 2005. Formation and growth of fresh atmospheric aerosols: eight years of aerosol size distribution data from SMEAR II, Hyytiälä, Finland. Boreal Environment Research 10: 323–336.
Dudareva, N., Pichersky, E. & Gershenzon, J. 2004. Biochemistry of plant volatiles. Plant Physiology 135: 1893–1902.
Eisenreich, W., Schwarz, M., Cartayrade, A., Arigoni, D., Zenk, M.H. & Bacher, A. 1998. The deoxyxylulose phosphate pathway of terpenoid biosynthesis in plants and microorganisms. Chemistry & Biology 5: R221–R233.

37 Ewen, R.J., Jones, P.R.H., Ratcliffe, N.M. & Spencer-Phillips, P.T.N. 2004. Identification
by gas chromatography-mass spectrometry of the volatile organic compounds emitted from the wood-rotting fungi Serpula lacrymans and Coniophora puteana, and from Pinus sylvestris timber. Mycological Research 108: 806–814.
FAO 2001. Global forest resources assessment 2000: main report. FAO Forestry Papers 140.
Fehsenfeld, F., Calvert, J., Goldan, P., Guenther, A.B., Hewitt, C.N., Lamb, B., Shaw, L., Trainer, M. & Zimmerman, P. 1992. Emissions of volatile organic compounds from vegetation and the implications for atmospheric chemistry. Global Biogeochemical Cycles 6: 389–430.
Fischer, G., Schwalbe, R., Möller, M., Ostrowski, R. & Dott, W. 1999. Species-specific production of microbial volatile organic compounds (MVOC) by airborne fungi from a compost facility. Chemosphere 39: 795–810.
Fuller, E.N., Ensley, K. & Giddings, J.C. 1969. Diffusion of halogenated hydrocarbons in helium. The effect of structure on collision cross sections. The Journal of Physical Chemistry 73: 3679–3685.
Gray, C.M., Monson, R.K. & Fierer, N. 2010. Emissions of volatile organic compounds during the decomposition of plant litter. Journal of Geophysical Research 115: G03015, doi:10.1029/2010JG001291.
Greenberg, J.P., Asensio, D., Turnipseed, A., Guenther, A.B., Karl, T. & Gochis, D. 2012. Contribution of leaf and needle litter to whole ecosystem BVOC fluxes. Atmospheric Environment 59: 302–311.
Guenther, A., Hewitt, C.N., Erickson, D., Fall, R., Geron, C., Graedel, T., Harley, P., Klinger, L., Lerdau, M., McKay, W.A., Pierce, T., Scholes, B., Steinbrecher, R., Tallamraju, R., Taylor, J. & Zimmerman, P. 1995. A global model of natural volatile organic compound emissions. Journal of Geophysical Research 100: 8873–8892.
– , Karl, T., Harley, P., Wiedinmyer, C., Palmer, P.I. & Geron, C. 2006. Estimates of global terrestrial isoprene emissions using MEGAN (Model of Emissions of Gases and Aerosols from Nature). Atmospheric Chemistry and Physics 6: 3181–3210.
Haapanala, S., Hakola, H., Hellén, H., Vestenius, M., Levula, J. & Rinne, J. 2012. Is forest management a significant source of monoterpenes into the boreal atmosphere? Biogeosciences 9: 1291–1300.
Hakola, H., Tarvainen, V., Laurila, T., Hiltunen, V., Hellén, H. & Keronen, P. 2003. Seasonal variation of VOC concentrations above a boreal coniferous forest. Atmospheric Environment 37: 1623–1634.
– , Tarvainen, V., Bäck, J., Ranta, H., Bonn, B., Rinne, J. & Kulmala, M. 2006. Seasonal variation of mono- and sesquiterpene emission rates of Scots pine. Biogeosciences 3: 93–101.
– , Hellén, H., Tarvainen, V., Bäck, J., Patokoski, J. & Rinne, J. 2009: Annual variations of atmospheric VOC concentrations in a boreal forest. Boreal Environment Research 14: 722–730.
Hanson, D.T., Swanson, S., Graham, L.E. & Sharkey, T.D. 1999. Evolutionary significance of isoprene emission from mosses. American Journal of Botany 86: 634–639.
Hari, P., Keronen, P., Bäck, J., Altimir, N., Linkosalo, T., Pohja, T., Kulmala, M. & Vesala, T. 1999. An improvement of the method for calibrating measurements of photosynthetic CO2 flux. Plant, Cell and Environment 22: 1297–1301.
– & Kulmala, M. 2005. Station for Measuring Ecosystem-Atmosphere relations (SMEAR II). Boreal Environment Research 10: 315–322.

38
Hatfield, M.L. & Huff Hartz, K.E. 2011. Secondary organic aerosol from biogenic volatile organic compound mixtures. Atmospheric Environment 45: 2211–2219.
Hayward, S., Muncey, R.J., James, A.E., Halsall, C.J. & Hewitt, C.N. 2001. Monoterpene emissions from soil in a Sitka spruce forest. Atmospheric Environment 35: 4081–4087.
Heinonsalo, J., Koskiahde, I. & Sen, R. 2007. Scots pine bait seedling performance and root colonizing ectomycorrhizal fungal community dynamics before and during the 4 years after forest clear-cut logging. Canadian Journal of Forest Research 37: 415–429.
Hellén, H., Hakola, H., Pystynen, K.-H., Rinne, J. & Haapanala, S. 2006. C2-C10 hydrocarbon emissions from a boreal wetland and forest floor. Biogeosciences 3: 167–174.
Helmig, D., Apel, E., Blake, D., Ganzeveld, L., Lefer, B.L., Meinardi, S. & Swanson, A.L. 2009. Release and uptake of volatile inorganic and organic gases through the snowpack at Niwot Ridge, Colorado. Biogeochemistry 95: 167–183.
Högberg, P., Högberg, M.N., Göttlicher, S.G., Betson, N.R., Keel, S.G., Metcalfe, D.B., Campbell, C., Schindlbacher, A., Hurry, V., Lundmark, T., Linder, S. & Näsholm, T. 2008. High temporal resolution tracing of photosynthate carbon from the tree canopy to forest soil microorganisms. New Phytologist 177: 220–228.
Holzinger, R., Lee, A., Paw U, K.T. & Goldstein, A.H. 2010. Observations of oxidation products above a forest imply biogenic emissions of very reactive compounds. Atmospheric Chemistry and Physics 5: 67–75.
Hutchinson, G.L. & Livingston, G.P. 2002. Soil-atmosphere gas exchange. In: Dane, J.H. & Topp, G.C. (eds.). Methods of Soil Analysis, Part 4 - Physical Methods. Soil Science Society of America, Madison, Wisconsin. p. 1159–1180.
Ilvesniemi, H., Levula, J., Ojansuu, R., Kolari, P., Kulmala, L., Pumpanen, J., Launiainen, S., Vesala, T. & Nikinmaa, E. 2009. Long-term measurements of the carbon balance of a boreal Scots pine dominated forest ecosystem. Boreal Environment Research 14: 731–753.
– , Pumpanen, J., Duursma, R., Hari, P., Keronen, P., Kolari, P., Kulmala, M., Mammarella, I., Nikinmaa, E., Rannik, Ü., Pohja, T., Siivola, E. & Vesala, T. 2010. Water balance of a boreal Scots pine forest. Boreal Environment Research 15: 375–396.
Insam, H. & Seewald, M.S.A. 2010. Volatile organic compounds (VOCs) in soils. Biology and Fertility of Soils 46: 199–213.
Isidorov, V. & Jdanova, M. 2002. Volatile organic compounds from leaves litter. Chemosphere 48: 975–979.
– , Vinogorova, V.T. & Rafałowski, K. 2003. HS-SPME analysis of volatile organic compounds of coniferous needle litter. Atmospheric Environment 37: 4645–4650.
IPCC 2007. Climate Change 2007: Synthesis report. Contribution of working groups I, II and III to the fourth assessment report of the Intergovernmental Panel on Climate Change. Pachauri, R.K. & Reisinger, A. (eds.). IPCC, Geneva, Switzerland, 104 pp.
Janson, R.W. 1993. Monoterpene emissions from Scots pine and Norwegian spruce. Journal of Geophysical Research 98: 2839–2850.
– , De Serves, C. & Romero, R. 1999. Emission of isoprene and carbonyl compounds from a boreal forest and wetland in Sweden. Agricultural and Forest Meteorology 98–99: 671–681.
Johnson, D. & Marston, G. 2007. The gas-phase ozonolysis of unsaturated volatile organic compounds in the troposphere. Chemical Society Reviews 37: 699–716.
Joó, É., Dewulf, J., Amelynck, C., Schoon, N., Pokorska, O., Šimpraga, M., Steppe, K., Aubinet, M. & Van Langenhove, H. 2011. Constitutive versus heat and biotic stress

39
induced BVOC emissions in Pseudotsuga menziesii. Atmospheric Environment 45: 3655–3662.
Kähkönen, M.A., Wittmann, C., Kurola, J., Ilvesniemi, H. & Salkinoja-Salonen, M.S. 2001. Microbial activity of boreal forest soil in a cold climate. Boreal Environment Research 6: 19–28.
Kainulainen, P. & Holopainen, J.K. 2002. Concentrations of secondary compounds in Scots pine needles at different stages of decomposition. Soil Biology and Biochemistry 34: 37–42.
Kanerva, S., Kitunen, V., Loponen, J. & Smolander, A. 2008. Phenolic compounds and terpenes in soil organic horizon layers under silver birch, Norway spruce and Scots pine. Biology and Fertility of Soils 44: 547–556.
Karl, M., Guenther, A., Köble, R., Leip, A. & Seufert, G. 2009. A new European plant-specific emission inventory of biogenic volatile organic compounds for use in atmospheric transport models. Biogeosciences 6: 1059-1087.
Kesselmeier, J. & Staudt, M. 1999. Biogenic Volatile organic compounds (VOC): An overview on emission, physiology and ecology. Journal of Atmospheric Chemistry 33: 23–88.
Kim, S., Karl, T., Helmig, D., Daly, R., Rasmussen, R. & Guenther, A. 2009. Measurement of atmospheric sesquiterpenes by proton transfer reaction-mass spectrometry (PTR-MS). Atmospheric Measurement Techniques 2: 99–112.
Kolari, P., Pumpanen, J., Kulmala, L., Ilvesniemi, H., Nikinmaa, E., Grönholm, T. & Hari, P. 2006. Forest floor vegetation plays an important role in photosynthetic production of boreal forests. Forest Ecology and Management 221: 241–248.
Kolari, P., Bäck, J., Taipale, R., Ruuskanen, T.M., Kajos, M.K., Rinne, J., Kulmala, M. & Hari, P. 2012. Evaluation of accuracy in measurements of VOC emissions with dynamic chamber system. Atmospheric Environment, in press.
Korhonen, J.F.J., Pihlatie, M., Pumpanen, J., Aaltonen, H., Hari, P., Levula, J., Kieloaho, A.-J., Nikinmaa, E., Vesala, T. & Ilvesniemi, H. 2012. Nitrogen balance of a boreal Scots pine forest. Biogeosciences Discussions 9: 11201–11237.
Korpi, A., Pasanen, A.-L. & Pasanen, P. 1998. Volatile compounds originating from mixed microbial cultures on building materials under various humidity conditions. Applied and Environmental Microbiology 64: 2914–2919.
Kos, G. & Ariya, P.A. 2006. Determination of a wide range of volatile and semivolatile organic compounds in snow by use of solid-phase micro-extraction (SPME). Analytical and Bioanalytical Chemistry 385: 57–66.
– & Ariya, P.A. 2010. Volatile organic compounds in snow in the Quebec-Windsor Corridor. Journal of Geophysical Research 115: D01302, doi:10.1029/2009JD012391.
Kulmala, L., Launiainen, S., Pumpanen, J., Lankreijer, H., Lindroth, A., Hari, P. & Vesala, T. 2008. H2O and CO2 fluxes at the floor of a boreal pine forest. Tellus 60B: 167–178.
Kulmala, M., Toivonen, A., Mäkelä, J.M. & Laaksonen, A. 1998. Analysis of the growth of nucleation mode particles observed in Boreal forest. Tellus 50B: 449–462.
– , Dal Maso, M., Mäkelä, J.M., Pirjola, L., Väkevä, M., Aalto, P., Miikkulainen, P., Hämeri, K. & O’Dowd, C.D. 2001. On the formation, growth and composition of nucleation mode particles. Tellus 53B: 479–490.
– , Suni, T., Lehtinen, K.E.J., Dal Maso, M., Boy, M., Reissell, A., Rannik, Ü., Aalto, P., Keronen, P., Hakola, H., Bäck, J., Hoffmann, T., Vesala, T. & Hari, P. 2004. A new feedback mechanism linking forests, aerosols, and climate. Atmospheric Chemistry and Physics 4: 557–562.
40
Lappalainen, H.K., Sevanto, S., Bäck, J., Ruuskanen, T.M., Kolari, P., Taipale, R., Rinne, J., Kulmala, M. & Hari, P. 2009. Day-time concentrations of biogenic volatile organic compounds in a boreal forest canopy and their relation to environmental and biological factors. Atmospheric Chemistry and Physics 9: 5447–5459.
Leff, J.W. & Fierer, N. 2008. Volatile organic compound (VOC) emissions from soil and litter samples. Soil Biology and Biochemistry 40: 1629–1636.
Lin, C., Owen, S.M. & Peñuelas, J. 2007. Volatile organic compounds in the roots and rhizosphere of Pinus spp. Soil Biology and Biochemistry 39: 951–960.
Lindinger, W., Hansel, A. & Jordan, A. 1998. On-line monitoring of volatile organic compounds by means of Proton-Transfer-Reaction Mass Spectrometry (PTRMS) Medical applications, food control and environmental research. International Journal of Mass Spectrometry and Ion Processes 173: 191–241.
Lucas-Barbosa, D., van Loon, J.J.A. & Dicke, M. 2011. The effects of herbivore-induced plant volatiles on interactions between plants and flower-visiting insects. Phytochemistry 72: 1647–1654.
McNeal, K.S. & Herbert, B.E. 2009. Volatile organic metabolites as indicators of soil microbial activity and community composition shifts. Soil Science Society of America Journal 73: 579–588.
Noe, S.M., Hüve, K., Niinemets, Ü. & Copolovici, L. 2012. Seasonal variation in vertical volatile compounds air concentrations within a remote hemiboreal mixed forest. Atmospheric Chemistry and Physics 12: 3909–3926.
Owen, S.M., Clark, S., Pompe, M. & Semple, K.T. 2007. Biogenic volatile organic compounds as potential carbon sources for microbial communities in soil from the rhizosphere of Populus tremula. FEMS Microbiology Letters 268: 34–39.
Paavolainen, L., Kitunen, V. & Smolander, A. 1998. Inhibition of nitrification in forest soil by monoterpenes. Plant and Soil 205: 147–154.
Pape, L., Ammann, C., Nyfeler-Brunner, A., Spirig, C., Hens, K. & Meixner, F.X. 2009. An automated dynamic chamber system for surface exchange measurement of non-reactive and reactive trace gases of grassland ecosystems. Biogeosciences 6: 405–429.
Piao, S., Ciais, P., Friedlingstein, P., Peylin, P., Reichstein, M., Luyssaert, S., Margolis, H., Fang, J., Barr, A., Chen, A., Grelle, A., Hollinger, D.Y., Laurila, T., Lindroth, A., Richardson, A.D. & Vesala, T. 2008. Net carbon dioxide losses of northern ecosystems in response to autumn warming. Nature 451: 49–53.
Pihlatie, M., Pumpanen, J., Rinne, J., Ilvesniemi, H., Simojoki, A., Hari, P. & Vesala, T. 2007. Gas concentration driven fluxes of nitrous oxide and carbon dioxide in boreal forest soil. Tellus 59B: 458–469.
Poling, B.E., Prausnitz, J.M. & O’Connell, J.P. 2000. The Properties of Gases and Liquids. 5th ed. McGraw-Hill, New York, USA. 768 p.
Pumpanen, J., Ilvesniemi, H., Perämäki, M. & Hari, P. 2003. Seasonal patterns of soil CO2 efflux and soil air CO2 concentration in a Scots pine forest: comparison of two chamber techniques. Global Change Biology 9: 371–382.
– , Kolari, P., Ilvesniemi, H., Minkkinen, K., Vesala, T., Niinistö, S., Lohila, A., Larmola, T., Morero, M., Pihlatie, M., Janssens, I., Curiel Yuste, J., Grünzweig, J.M., Reth, S., Subke, J.-A., Savage, K., Kutsch, W., Østreng, G., Ziegler, W., Anthoni, P., Lindroth, A. & Hari, P. 2004. Comparison of different chamber techniques for measuring soil CO2 efflux. Agricultural and Forest Meteorology 123: 159–176.
– , Ilvesniemi, H., Kulmala, L., Siivola, E., Laakso, H., Kolari, P., Helenelund, C., Laakso, M., Uusimaa, M. & Hari, P. 2008. Respiration in boreal forest soil as determined from

41
carbon dioxide concentration profile. Soil Science Society of America Journal 72: 1187–1196.
– , Longdoz, B. & Kutsch, W.L. 2009. Field measurements of soil respiration: principles and constraints, potentials and limitations of different methods. In: Kutsch, W.L., Bahn, M. & Heinemeyer, A. (eds.). Soil carbon dynamics; an integrated methodology. Cambridge University Press, Cambridge, UK. p. 27–44.
Rinne, J., Taipale, R., Markkanen, T., Ruuskanen, T.M., Hellén, H., Kajos, M.K., Vesala, T. & Kulmala, M. 2007. Hydrocarbon fluxes above a Scots pine forest canopy: measurements and modeling. Atmospheric Chemistry and Physics 7: 3361–3372.
– , Bäck, J. & Hakola, H. 2009. Biogenic volatile organic compound emissions from the Eurasian taiga: current knowledge and future directions. Boreal Environment Research 14: 807–826.
Ruuskanen, T.M., Kolari, P., Bäck, J., Kulmala, M., Rinne, J., Hakola, H., Taipale, R., Raivonen, M., Altimir, N. & Hari, P. 2005. On-line field measurements of monoterpene emissions from Scots pine by proton-transfer-reaction mass spectrometry. Boreal Environment Research 10: 553–567.
Schausberger, P., Peneder, S., Jürschik S. & Hoffmann, D. 2012. Mycorrhiza changes plant volatiles to attract spider mite enemies. Functional Ecology 26: 441–449.
Schnitzler, J.-P., Bauknecht, N., Brüggemann, N., Einig, W., Forkel, R., Hampp, R., Heiden, A.C., Heizmann, U., Hoffmann, T., Holzke, C., Jaeger, L., Klauer, M., Komenda, M., Koppmann, R., Kreuzwieser, J., Mayer, H., Rennenberg, H., Smiatek, G., Steinbrecher, R., Wildt, J. & Zimmer, W. 2002. Emission of biogenic volatile organic compounds: an overview of field, laboratory and modeling studies performed during the ‘Tropospheric research program’ (TFS) 1997–2000. Journal of Atmospheric Chemistry 42: 159–177.
Seok, B., Helmig, D., Williams, M.W., Liptzin, D., Chowanski, K. & Hueber, J. 2009. An automated system for continuous measurements of trace gas fluxes through snow: an evaluation of the gas diffusion method at a subalpine forest site, Niwot Ridge, Colorado. Biogeochemistry 95: 95–113.
Smolander, A., Ketola, R.A., Kotiaho, T., Kanerva, S., Suominen, K. & Kitunen, V. 2006. Volatile monoterpenes in soil atmosphere under birch and conifers: Effects on soil N transformations. Soil Biology & Biochemistry 38: 3436–3442.
– , Kanerva, S., Adamczyk, B. & Kitunen, V. 2012. Nitrogen transformations in boreal forest soils—does composition of plant secondary compounds give any explanations? Plant and Soil 350: 1–26.
Staudt, M., Bertin, N., Hansen, U., Seufert, G., Ciccioli, P., Foster, P., Frenzel, B. & Fugit, J.-L. 1997. Seasonal and diurnal patterns of monoterpene emissions from Pinus pinea (L.) under field conditions. Atmospheric Environment 31: 145–156.
Stotzky, G., Schenck, S. & Papavizas, G.C. 1976. Volatile organic compounds and microorganisms. CRC Critical Reviews in Microbiology 4: 333–382.
Strömvall, A.-M. & Petersson, G. 1991. Conifer monoterpenes emitted to air by logging operations. Scandinavian Journal of Forest Research 6: 253–258.
Su, H., Cheng, Y., Oswald, R., Behrendt, T., Trebs, I., Meixner, F.X., Andreae, M.O., Cheng, P., Zhang, Y. & Pöschl, U. 2011. Soil nitrite as a source of atmospheric HONO and OH radicals. Science 333: 1616–1618.
Sunesson, A.-L., Vaes, W.H.J., Nilsson, C.-A., Blomquist, G., Andersson, B. & Carlson, R. 1995. Identification of volatile metabolites from five fungal species cultivated on two media. Applied and Environmental Microbiology 61: 2911–2918.
42
Swanson, R.V. & Flanagan, L.B. 2001. Environmental regulation of carbon dioxide exchange at the forest floor in a boreal black spruce ecosystem. Agricultural and Forest Meteorology 108: 165–181.
Taipale, R., Ruuskanen, T.M., Rinne, J., Kajos, M.K., Hakola, H., Pohja, T. & Kulmala, M. 2008. Technical note: Quantitative long-term measurements of VOC concentrations by PTR-MS - measurement, calibration, and volume mixing ratio calculation methods. Atmospheric Chemistry and Physics 8: 6681–6698.
Tarvainen, V., Hakola, H., Hellén, H., Bäck, J., Hari, P. & Kulmala, M. 2005. Temperature and light dependence of the VOC emissions of Scots pine. Atmospheric Chemistry and Physics 5: 989–998.
– , Hakola, H., Rinne, J., Hellén, H. & Haapanala, S. 2007. Towards a comprehensive emission inventory of terpenoids from boreal ecosystems. Tellus 59B: 526–534.
Vesala, T., Haataja, J., Aalto, P.P., Altimir, N., Buzorius, G., Hämeri, K., Ilvesniemi, H., Jokinen, V., Keronen, P., Lahti, T., Markkanen, T., Mäkelä, J.M., Nikinmaa, E., Palmroth, S., Pohja, T., Pumpanen, J., Rannik, Ü., Siivola, E., Ylitalo, H., Hari, P. & Kulmala, M. 1998. Long-term field measurements of atmosphere-surface interactions in boreal forest combining forest ecology, micrometeorology, aerosol physics and atmospheric chemistry. Trends in Heat, Mass and Momentum Transfer 4: 17–35.
Warneke, C., Karl, T., Judmaier, H., Hansel, A., Jordan, A., Lindinger, W. & Crutzen, P.J. 1999. Acetone, methanol, and other partially oxidized volatile organic emissions from dead plant matter by abiological processes: Significance for atmospheric HOx chemistry. Global Biogeochemical Cycles 13: 9–17.
White, C.S. 1994. Monoterpenes: their effects on ecosystem nutrient cycling. Journal of Chemical Ecology 20: 1381–1406.