Embed Size (px)
Citation preview
HAL Id: halshs-00593674https://halshs.archives-ouvertes.fr/halshs-00593674v3
Submitted on 23 May 2011
HAL is a multi-disciplinary open accessarchive for the deposit and dissemination of sci-entific research documents, whether they are pub-lished or not. The documents may come fromteaching and research institutions in France orabroad, or from public or private research centers.
L’archive ouverte pluridisciplinaire HAL, estdestinée au dépôt et à la diffusion de documentsscientifiques de niveau recherche, publiés ou non,émanant des établissements d’enseignement et derecherche français ou étrangers, des laboratoirespublics ou privés.
Exchange Rate Dynamics and Fundamental EquilibriumExchange Rates
Jamel Saadaoui
To cite this version:Jamel Saadaoui. Exchange Rate Dynamics and Fundamental Equilibrium Exchange Rates. EconomicsBulletin, Economics Bulletin, 2011, 31 (3), pp.1993-2005. �halshs-00593674v3�
Exchange Rate Dynamics and Fundamental
Equilibrium Exchange Rates
Jamel Saadaoui1
Abstract. The paper investigates if the most popular alternative to the purchasing parity
power approach (PPP) to estimate equilibrium exchange rates, the fundamental equilibrium
exchange rate (FEER) influences exchange rate dynamics in the long run. For a large panel of
industrialized and emerging countries and on the period 1982-2007, we detect the presence of
unit roots in the series of real effective exchange rates and in the series of FEERs. We find
and estimate a cointegration relationship between real effective exchange rates and FEERs.
The results show that the FEER has a positive and significant influence on exchange rate
dynamics in the long run.
JEL Classification: F00; F31; F32; C23
Key Words: Fundamental equilibrium exchange rates; Panel unit root tests; Global
imbalances; Fully modified ordinary least square; Dynamic ordinary least square; Pooled
Mean Group
1 University of Paris North, CEPN-CNRS, [email protected]. The author is grateful to Jacques
Mazier for its helpful comments and suggestions on earlier versions of the paper.
N°2011-06
1
1. Introduction
The evolution of current account balances, which have considerably increased since the last
fifteen years, has raised many questions. Among them, many observers (see e.g. Cline and
Williamson, 2010) think that some countries (mainly South East Asian countries) have
pursued aggressive exchange rate policy to maintain their currency at artificially low level in
order to preserve their competitiveness on foreign markets. These politics of exchange rate
undervaluation have allowed these countries to accumulate huge current account surplus.
However as the misalignments (deviation from equilibrium exchange rate) offset each other at
the world scale, if some countries are undervalued and run large current account surplus then
some other countries are overvalued and run large current account deficits.
The paper investigates if the most popular alternative to the PPP approach to estimate
equilibrium exchange rates, the FEER (Williamson, 1983, 1994) influences exchange rate
dynamics in the long run. If the FEER affects the long run exchange rate dynamics, it can be
considered as the „true equilibrium exchange rate‟ and policy makers should pursue this rate
to ensure global macroeconomic stability in a context of large imbalances.
As pointed out by Clark and MacDonald (1998), the notion of equilibrium in the FEER,
which is a method of calculation of the equilibrium exchange rate consistent with external
equilibrium (sustainable capital flows) and internal equilibrium (full utilization of productive
potential), can be questioned if we consider that some variables which influence directly
exchange rate behavior are often omitted in the calculations.
Zhou (1993) tests if the FEER affects exchange dynamics thanks to unit root tests and
bivariate cointegration tests. She found empirical evidence that real effective exchange rates
(REERs) and FEERs are unit roots process however she does not found that REERs and
FEERs are cointegrated and, then, she concluded that exchange rate dynamics is not affected
by the FEER.
These results can be misleading because they concerned only two countries (Japan and
Germany) and a relatively short span of time (1974-1988) whereas the FEER approach is
essentially a multilateral approach in which the global consistency, mentioned above, is
crucial.
Barisone et alii (2006) study this question by using data for the G7 countries on the period
1973-1997. They implemented unit root tests, panel unit root tests and panel cointegration
tests (Pedroni, 1999). They found empirical evidence that REERs and FEERs are unit roots
process and, contrary to Zhou (1993), they found that REERs and FEERs are cointegrated.
For a large panel of industrialized and emerging countries and on the period 1982-2007, we
detect the presence of unit roots in the series of REERs and in the series of FEERs. We find
and estimate a cointegration relationship between REERs and FEERs. The results show that the FEER has a positive and significant influence on exchange rate dynamics in the long run.
The paper is organized as follow. Section 2 presents panel unit root tests. Section 3 tests a
long run relationship between REERs and FEERs by using Pedroni‟s panel cointegration tests
(1999). Section 4 estimates the long run relationship between REERs and FEERs by using the
fully modified ordinary least square estimator (FMOLS) and the dynamic ordinary least
square estimator (DOLS) introduced by Pedroni (2001). We also use a Pooled Mean Group
(PMG) estimator introduced by Pesaran et alii (1999). Section 5 concludes.
2
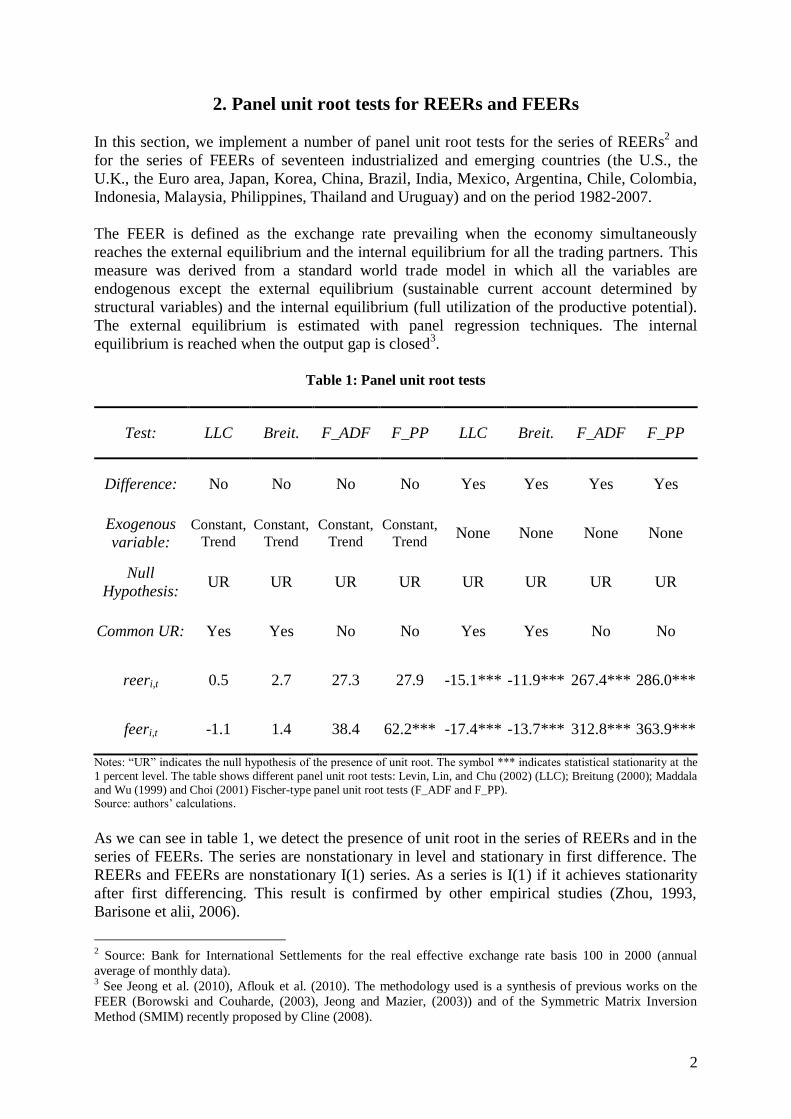
2. Panel unit root tests for REERs and FEERs
In this section, we implement a number of panel unit root tests for the series of REERs2 and
for the series of FEERs of seventeen industrialized and emerging countries (the U.S., the
U.K., the Euro area, Japan, Korea, China, Brazil, India, Mexico, Argentina, Chile, Colombia,
Indonesia, Malaysia, Philippines, Thailand and Uruguay) and on the period 1982-2007.
The FEER is defined as the exchange rate prevailing when the economy simultaneously
reaches the external equilibrium and the internal equilibrium for all the trading partners. This
measure was derived from a standard world trade model in which all the variables are
endogenous except the external equilibrium (sustainable current account determined by
structural variables) and the internal equilibrium (full utilization of the productive potential).
The external equilibrium is estimated with panel regression techniques. The internal
equilibrium is reached when the output gap is closed3.
Table 1: Panel unit root tests
Test: LLC Breit. F_ADF F_PP LLC Breit. F_ADF F_PP
Difference: No No No No Yes Yes Yes Yes
Exogenous
variable: Constant,
Trend
Constant,
Trend
Constant,
Trend
Constant,
Trend None None None None
Null
Hypothesis: UR UR UR UR UR UR UR UR
Common UR: Yes Yes No No Yes Yes No No
reeri,t 0.5 2.7 27.3 27.9 -15.1*** -11.9*** 267.4*** 286.0***
feeri,t -1.1 1.4 38.4 62.2*** -17.4*** -13.7*** 312.8*** 363.9***
Notes: “UR” indicates the null hypothesis of the presence of unit root. The symbol *** indicates statistical stationarity at the
1 percent level. The table shows different panel unit root tests: Levin, Lin, and Chu (2002) (LLC); Breitung (2000); Maddala
and Wu (1999) and Choi (2001) Fischer-type panel unit root tests (F_ADF and F_PP). Source: authors‟ calculations.
As we can see in table 1, we detect the presence of unit root in the series of REERs and in the
series of FEERs. The series are nonstationary in level and stationary in first difference. The
REERs and FEERs are nonstationary I(1) series. As a series is I(1) if it achieves stationarity
after first differencing. This result is confirmed by other empirical studies (Zhou, 1993,
Barisone et alii, 2006).
2 Source: Bank for International Settlements for the real effective exchange rate basis 100 in 2000 (annual
average of monthly data). 3 See Jeong et al. (2010), Aflouk et al. (2010). The methodology used is a synthesis of previous works on the
FEER (Borowski and Couharde, (2003), Jeong and Mazier, (2003)) and of the Symmetric Matrix Inversion
Method (SMIM) recently proposed by Cline (2008).
3
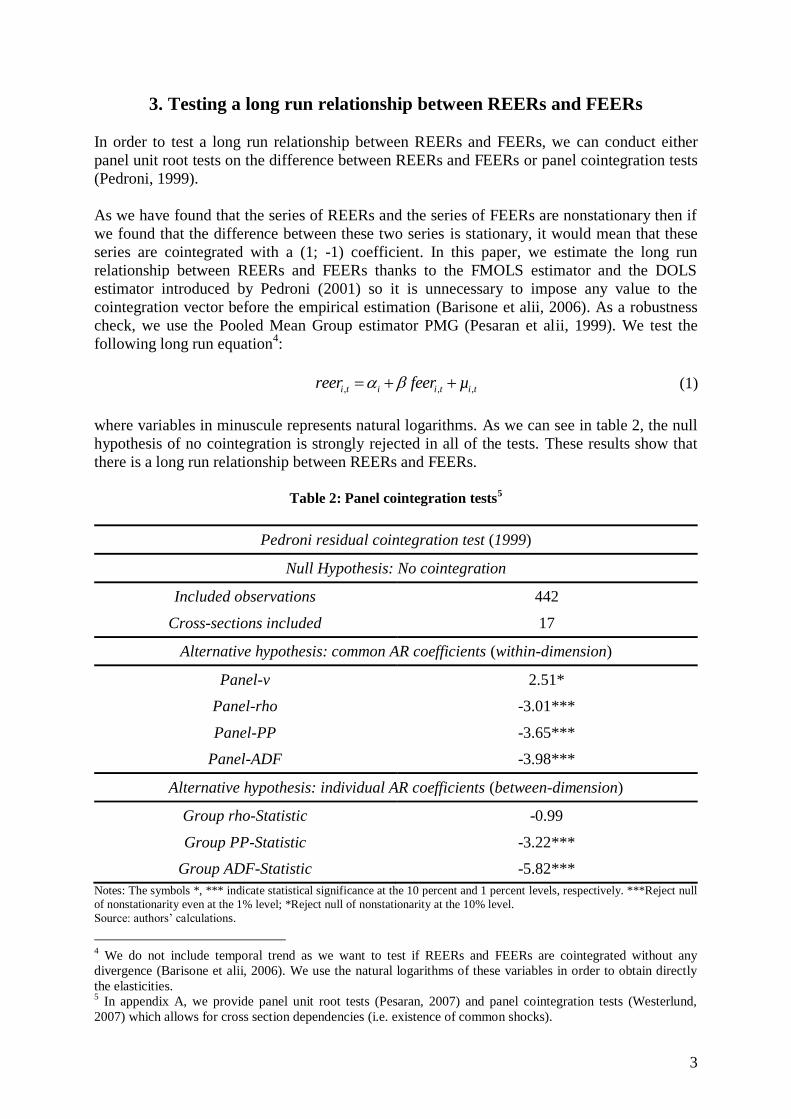
3. Testing a long run relationship between REERs and FEERs
In order to test a long run relationship between REERs and FEERs, we can conduct either
panel unit root tests on the difference between REERs and FEERs or panel cointegration tests
(Pedroni, 1999).
As we have found that the series of REERs and the series of FEERs are nonstationary then if
we found that the difference between these two series is stationary, it would mean that these
series are cointegrated with a (1; -1) coefficient. In this paper, we estimate the long run
relationship between REERs and FEERs thanks to the FMOLS estimator and the DOLS
estimator introduced by Pedroni (2001) so it is unnecessary to impose any value to the
cointegration vector before the empirical estimation (Barisone et alii, 2006). As a robustness
check, we use the Pooled Mean Group estimator PMG (Pesaran et alii, 1999). We test the
following long run equation4:
, , ,i t i i t i treer feer µ (1)
where variables in minuscule represents natural logarithms. As we can see in table 2, the null
hypothesis of no cointegration is strongly rejected in all of the tests. These results show that
there is a long run relationship between REERs and FEERs.
Table 2: Panel cointegration tests
5
Pedroni residual cointegration test (1999)
Null Hypothesis: No cointegration
Included observations 442
Cross-sections included 17
Alternative hypothesis: common AR coefficients (within-dimension)
Panel-v 2.51*
Panel-rho -3.01***
Panel-PP -3.65***
Panel-ADF -3.98***
Alternative hypothesis: individual AR coefficients (between-dimension)
Group rho-Statistic -0.99
Group PP-Statistic -3.22***
Group ADF-Statistic -5.82***
Notes: The symbols *, *** indicate statistical significance at the 10 percent and 1 percent levels, respectively. ***Reject null
of nonstationarity even at the 1% level; *Reject null of nonstationarity at the 10% level.
Source: authors‟ calculations.
4 We do not include temporal trend as we want to test if REERs and FEERs are cointegrated without any
divergence (Barisone et alii, 2006). We use the natural logarithms of these variables in order to obtain directly
the elasticities. 5 In appendix A, we provide panel unit root tests (Pesaran, 2007) and panel cointegration tests (Westerlund,
2007) which allows for cross section dependencies (i.e. existence of common shocks).
4
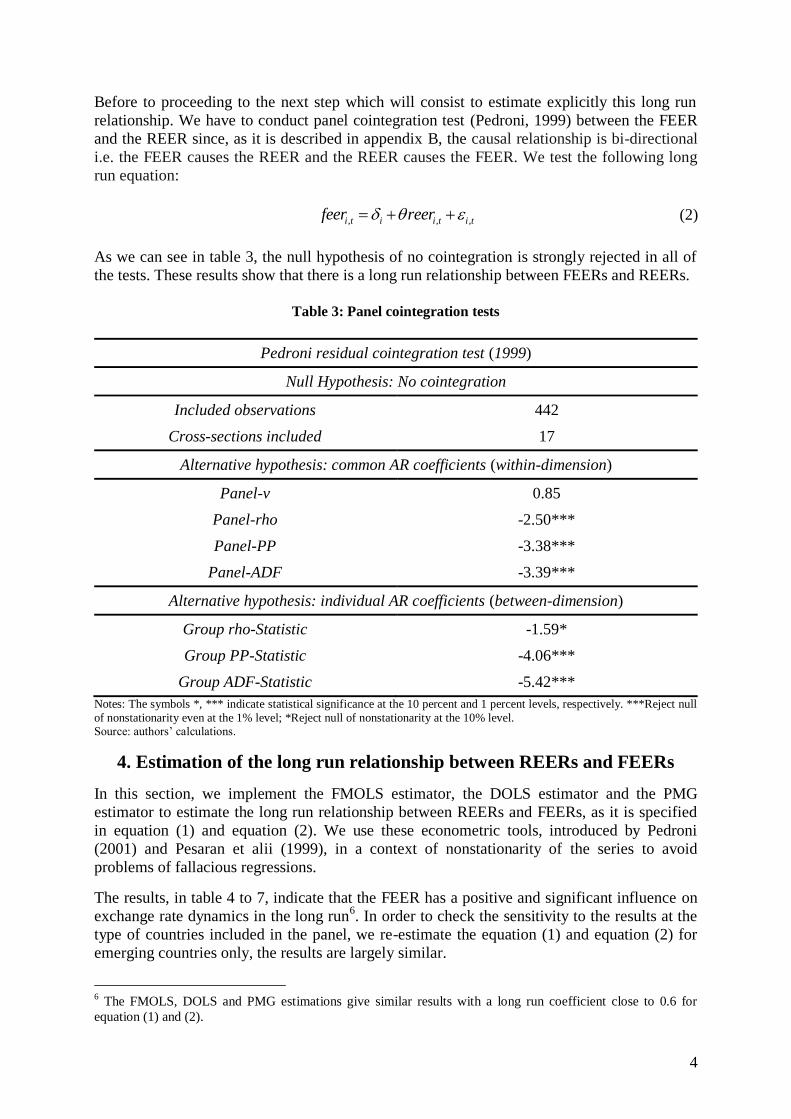
Before to proceeding to the next step which will consist to estimate explicitly this long run
relationship. We have to conduct panel cointegration test (Pedroni, 1999) between the FEER
and the REER since, as it is described in appendix B, the causal relationship is bi-directional
i.e. the FEER causes the REER and the REER causes the FEER. We test the following long
run equation:
, , ,i t i i t i tfeer reer (2)
As we can see in table 3, the null hypothesis of no cointegration is strongly rejected in all of
the tests. These results show that there is a long run relationship between FEERs and REERs.
Table 3: Panel cointegration tests
Pedroni residual cointegration test (1999)
Null Hypothesis: No cointegration
Included observations 442
Cross-sections included 17
Alternative hypothesis: common AR coefficients (within-dimension)
Panel-v 0.85
Panel-rho -2.50***
Panel-PP -3.38***
Panel-ADF -3.39***
Alternative hypothesis: individual AR coefficients (between-dimension)
Group rho-Statistic -1.59*
Group PP-Statistic -4.06***
Group ADF-Statistic -5.42***
Notes: The symbols *, *** indicate statistical significance at the 10 percent and 1 percent levels, respectively. ***Reject null
of nonstationarity even at the 1% level; *Reject null of nonstationarity at the 10% level. Source: authors‟ calculations.
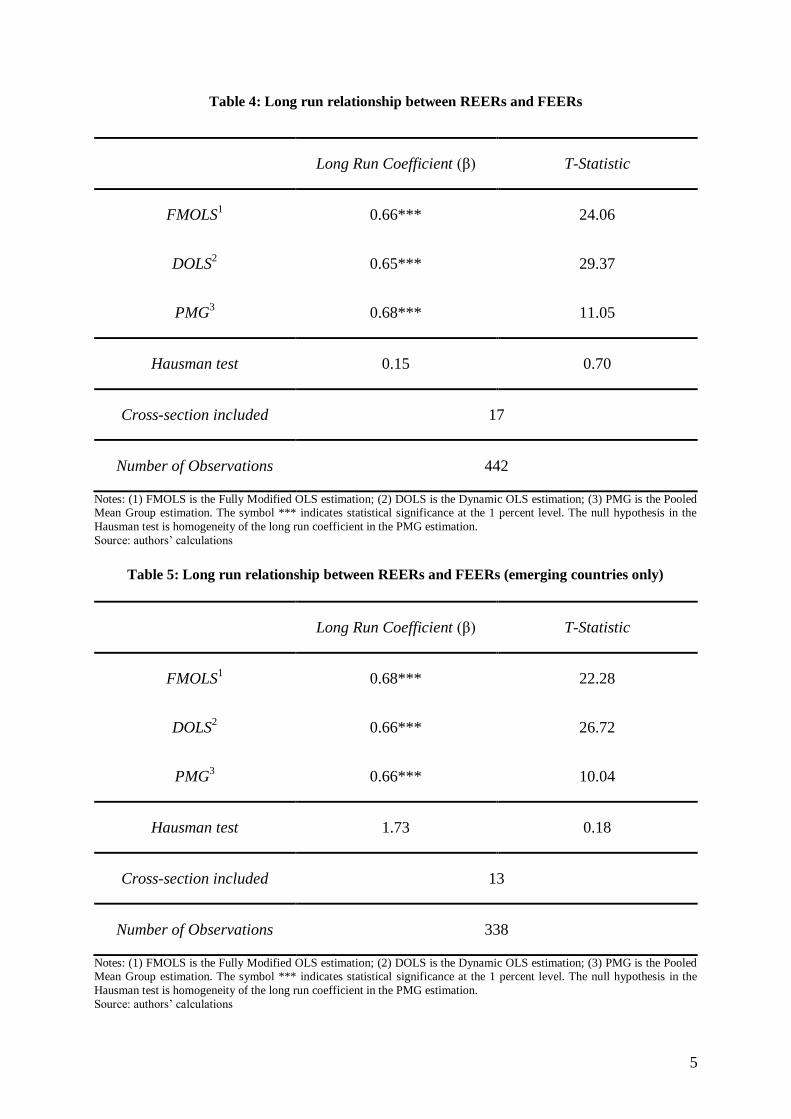
4. Estimation of the long run relationship between REERs and FEERs
In this section, we implement the FMOLS estimator, the DOLS estimator and the PMG
estimator to estimate the long run relationship between REERs and FEERs, as it is specified
in equation (1) and equation (2). We use these econometric tools, introduced by Pedroni
(2001) and Pesaran et alii (1999), in a context of nonstationarity of the series to avoid
problems of fallacious regressions.
The results, in table 4 to 7, indicate that the FEER has a positive and significant influence on
exchange rate dynamics in the long run6. In order to check the sensitivity to the results at the
type of countries included in the panel, we re-estimate the equation (1) and equation (2) for
emerging countries only, the results are largely similar.
6 The FMOLS, DOLS and PMG estimations give similar results with a long run coefficient close to 0.6 for
equation (1) and (2).
5
Table 4: Long run relationship between REERs and FEERs
Long Run Coefficient (β) T-Statistic
FMOLS1 0.66*** 24.06
DOLS2 0.65*** 29.37
PMG3 0.68*** 11.05
Hausman test 0.15 0.70
Cross-section included 17
Number of Observations 442
Notes: (1) FMOLS is the Fully Modified OLS estimation; (2) DOLS is the Dynamic OLS estimation; (3) PMG is the Pooled Mean Group estimation. The symbol *** indicates statistical significance at the 1 percent level. The null hypothesis in the
Hausman test is homogeneity of the long run coefficient in the PMG estimation.
Source: authors‟ calculations
Table 5: Long run relationship between REERs and FEERs (emerging countries only)
Long Run Coefficient (β) T-Statistic
FMOLS1 0.68*** 22.28
DOLS2 0.66*** 26.72
PMG3 0.66*** 10.04
Hausman test 1.73 0.18
Cross-section included 13
Number of Observations 338
Notes: (1) FMOLS is the Fully Modified OLS estimation; (2) DOLS is the Dynamic OLS estimation; (3) PMG is the Pooled
Mean Group estimation. The symbol *** indicates statistical significance at the 1 percent level. The null hypothesis in the
Hausman test is homogeneity of the long run coefficient in the PMG estimation.
Source: authors‟ calculations

6
Table 6: Long run relationship between FEERs and REERs
Long Run Coefficient (θ) T-Statistic
FMOLS1 0.62*** 23.26
DOLS2 0.62*** 27.64
PMG3 0.65*** 15.36
Hausman test 1.43 0.23
Cross-section included 17
Number of Observations 442
Notes: (1) FMOLS is the Fully Modified OLS estimation; (2) DOLS is the Dynamic OLS estimation; (3) PMG is the Pooled Mean Group estimation. The symbol *** indicates statistical significance at the 1 percent level. The null hypothesis in the
Hausman test is homogeneity of the long run coefficient in the PMG estimation.
Source: authors‟ calculations
Table 7: Long run relationship between FEERs and REERs (emerging countries only)
Long Run Coefficient (θ) T-Statistic
FMOLS1 0.66*** 22.09
DOLS2 0.66*** 25.69
PMG3 0.71*** 16.34
Hausman test 0.85 0.35
Cross-section included 13
Number of Observations 338
Notes: (1) FMOLS is the Fully Modified OLS estimation; (2) DOLS is the Dynamic OLS estimation; (3) PMG is the Pooled
Mean Group estimation. The symbol *** indicates statistical significance at the 1 percent level. The null hypothesis in the
Hausman test is homogeneity of the long run coefficient in the PMG estimation.
Source: authors‟ calculations
7
5. Conclusion
We provide empirical evidence that the most popular alternative to the purchasing parity
power approach (PPP) to estimate equilibrium exchange rates, the fundamental equilibrium
exchange rate (FEER) influences exchange rate dynamics in the long run. For a large panel of
industrialized and emerging countries and on the period 1982-2007, we detect the presence of
unit roots in the series of real effective exchange rates and in the series of FEERs. We find
and estimate a cointegration relationship between real effective exchange rates and FEERs.
The results show that the FEER has a positive and significant influence on exchange rate
dynamics in the long run. Therefore it can be considered as the „true equilibrium exchange
rate‟ and policy makers should pursue this rate to ensure global macroeconomic stability in a
context of large imbalances.
8
References
Aflouk, N., Jeong, S.-E., Mazier, J. and Saadaoui, J. (2010) „Exchange Rate Misalignments
and World Imbalances: A FEER Approach for Emerging Countries‟, CEPN Working
Paper No. 2010-12, Paris North University.
Breitung, J. (2000) „The local power of some unit root tests for panel data‟, In B.H. Baltagi
(Ed.) Advances in econometrics: Nonstationary panels, panel cointegration, and
dynamic panels 15, Amsterdam: JAI Press.
Borowski, D. and Couharde, C. (2003) „The Exchange Rate Macroeconomic Balance
Approach: New Methodology and Results for the Euro, the Dollar, the Yen and the
Pound Sterling‟, Open Economies Review 14 (2), 169-190.
Clark, P. B. and MacDonald, R. (1998) „Exchange Rates and Economics Fundamentals: A
Methodological Comparison of BEERs and FEERs‟, IMF Working Paper No. 98/67,
International Monetary Fund.
Choi, I. (2001) „Unit root tests for panel data‟, Journal of International Money and Finance
20, 249–272.
Cline, W. R. (2008) „Estimating Consistent Fundamental Equilibrium Exchange Rates‟,
Working Paper No. WP08-6, Peterson Institute for International Economics.
Cline, W. R. and Williamson, J. (2010) „Currency Wars?‟, Policy Brief No. 10-26, Peterson
Institute of International Economics.
Jeong, S.-E. and Mazier, J. (2003) „Exchange Rate Regimes and Equilibrium Exchange Rates
in East Asia‟, Revue économique 54 (5), 1161-1182.
Jeong, S.-E., Mazier, J. and Saadaoui, J. (2010) „Exchange Rate Misalignments at World and
European Level: A FEER approach‟, Économie Internationale / International
Economics 121, 25-58.
Levin, A., Lin, C. -F. and C. -S. J. Chu (2002) „Unit root tests in panel data: Asymptotic and
finite sample properties‟, Journal of Econometrics 108, 1–22.
Maddala, G. and S. Wu (1999) „A comparative study of unit root tests with panel data and a
simple new test‟, Oxford Bulletin of Economics and Statistics 61, 631–652.
Pedroni, P. (1999) „Critical Values for Cointegration Tests in Heterogeneous Panels with
Multiple Regressors‟, Oxford Bulletin of Economics and Statistics 61, 653-70.
Pedroni, P. (2001) „Purchasing Power Parity Tests in Cointegrated Panels‟, The Review of
Economics and Statistics 83 (4), 727-731.
Persyn, D., Westerlund, J. (2008) „Error correction based cointegration tests for panel data‟,
Stata Journal 8, 232-241.
Pesaran, M. H., Y. Shin, R. P. Smith (1999) „Pooled mean group estimation of dynamic
heterogeneous panels‟, Journal of the American Statistical Association 94, 621-634.
Pesaran, M. H. (2007) „A simple unit root test in the presence of cross section dependence‟,
Journal of Applied Econometrics 22, 265-312.
Westerlund, J. (2007) „Testing for error correction in panel data‟, Oxford Bulletin of
Economics and Statistics 69, 709–748.
Williamson, J. (1983) „The Exchange Rate System‟, Washington: Institute for International
Economics. Williamson, J. (1994) „Estimating Equilibrium Exchange Rates‟, Washington: Institute for
International Economics.
Zhou, S. (1993) „Fundamental Equilibrium Exchange Rates and Exchange Rate Dynamics‟,
Open Economies Review (4), 189-209.
9
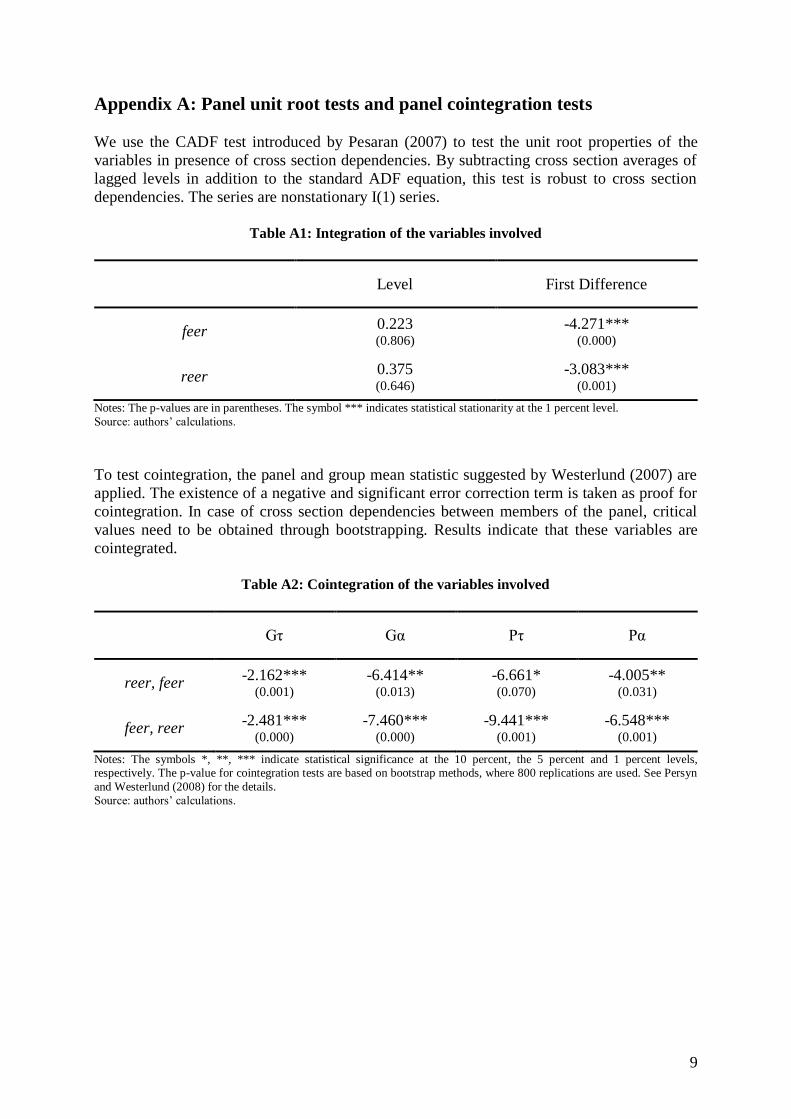
Appendix A: Panel unit root tests and panel cointegration tests
We use the CADF test introduced by Pesaran (2007) to test the unit root properties of the
variables in presence of cross section dependencies. By subtracting cross section averages of
lagged levels in addition to the standard ADF equation, this test is robust to cross section
dependencies. The series are nonstationary I(1) series.
Table A1: Integration of the variables involved
Level First Difference
feer 0.223 (0.806)
-4.271*** (0.000)
reer 0.375 (0.646)
-3.083*** (0.001)
Notes: The p-values are in parentheses. The symbol *** indicates statistical stationarity at the 1 percent level.
Source: authors‟ calculations.
To test cointegration, the panel and group mean statistic suggested by Westerlund (2007) are
applied. The existence of a negative and significant error correction term is taken as proof for
cointegration. In case of cross section dependencies between members of the panel, critical
values need to be obtained through bootstrapping. Results indicate that these variables are
cointegrated.
Table A2: Cointegration of the variables involved
Gτ Gα Pτ Pα
reer, feer -2.162***
(0.001)
-6.414** (0.013)
-6.661* (0.070)
-4.005** (0.031)
feer, reer -2.481***
(0.000)
-7.460*** (0.000)
-9.441*** (0.001)
-6.548*** (0.001)
Notes: The symbols *, **, *** indicate statistical significance at the 10 percent, the 5 percent and 1 percent levels, respectively. The p-value for cointegration tests are based on bootstrap methods, where 800 replications are used. See Persyn
and Westerlund (2008) for the details.
Source: authors‟ calculations.
10
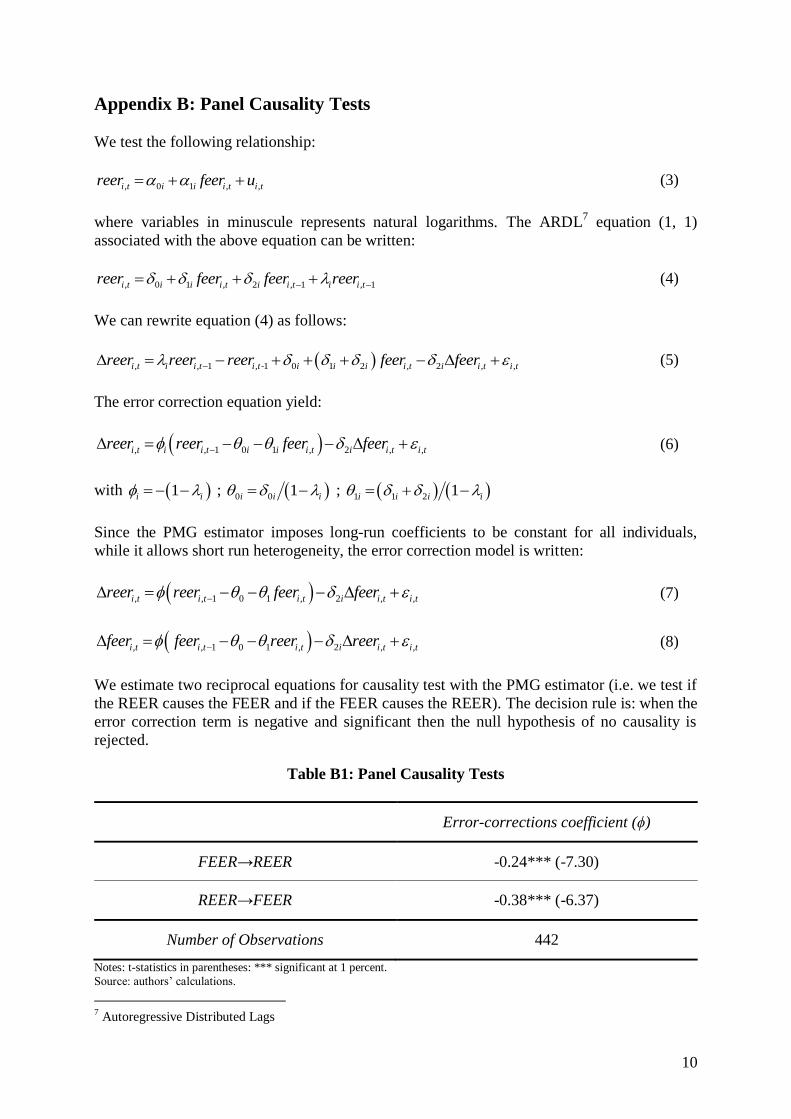
Appendix B: Panel Causality Tests
We test the following relationship:
, 0 1 , ,i t i i i t i treer feer u (3)
where variables in minuscule represents natural logarithms. The ARDL7 equation (1, 1)
associated with the above equation can be written:
, 0 1 , 2 , 1 , 1i t i i i t i i t i i treer feer feer reer (4)
We can rewrite equation (4) as follows:
, , 1 , 1 0 1 2 , 2 , ,-i t i i t i t i i i i t i i t i treer reer reer feer feer (5)
The error correction equation yield:
, , 1 0 1 , 2 , ,i t i i t i i i t i i t i treer reer feer feer (6)
with 1i i ; 0 0 1i i i ; 1 1 2 1i i i i
Since the PMG estimator imposes long-run coefficients to be constant for all individuals,
while it allows short run heterogeneity, the error correction model is written:
, , 1 0 1 , 2 , ,i t i t i t i i t i treer reer feer feer (7)
, , 1 0 1 , 2 , ,i t i t i t i i t i tfeer feer reer reer (8)
We estimate two reciprocal equations for causality test with the PMG estimator (i.e. we test if
the REER causes the FEER and if the FEER causes the REER). The decision rule is: when the
error correction term is negative and significant then the null hypothesis of no causality is
rejected.
Table B1: Panel Causality Tests
Error-corrections coefficient (ϕ)
FEER→REER -0.24*** (-7.30)
REER→FEER -0.38*** (-6.37)
Number of Observations 442
Notes: t-statistics in parentheses: *** significant at 1 percent.
Source: authors‟ calculations.
7 Autoregressive Distributed Lags
11
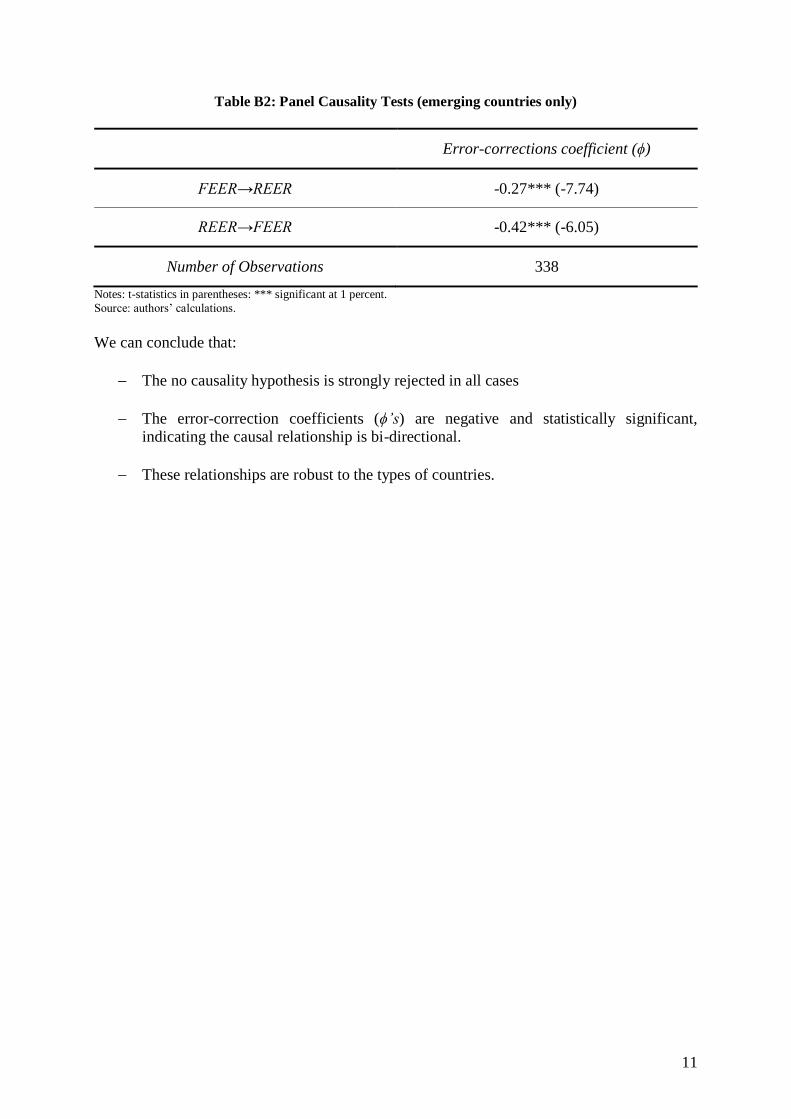
Table B2: Panel Causality Tests (emerging countries only)
Error-corrections coefficient (ϕ)
FEER→REER -0.27*** (-7.74)
REER→FEER -0.42*** (-6.05)
Number of Observations 338
Notes: t-statistics in parentheses: *** significant at 1 percent.
Source: authors‟ calculations.
We can conclude that:
The no causality hypothesis is strongly rejected in all cases
The error-correction coefficients (ϕ’s) are negative and statistically significant, indicating the causal relationship is bi-directional.
These relationships are robust to the types of countries.