Embed Size (px)
Citation preview

ISSN 1561081-0
9 7 7 1 5 6 1 0 8 1 0 0 5
WORKING PAPER SER IESNO 739 / MARCH 2007
EXCHANGE RATE PASS-THROUGH IN EMERGING MARKETS
by Michele Ca’ Zorzi, Elke Hahnand Marcelo Sánchez

In 2007 all ECB publications
feature a motif taken from the €20 banknote.
WORK ING PAPER SER IE SNO 739 / MARCH 2007
This paper can be downloaded without charge from http://www.ecb.int or from the Social Science Research Network
1 This paper has benefited from comments from participants at the BOFIT Workshop on Emerging Markets, which was held in Helsinki in December 2004. The views expressed in this paper are those of the authors and do not necessarily reflect those of
the European Central Bank. All errors are our responsibility.2 European Central Bank. Kaiserstrasse 29, 60311 Frankfurt am Main, Germany;
e-mail: [email protected], [email protected], [email protected]
EXCHANGE RATE PASS-THROUGH IN
EMERGING MARKETS 1
by Michele Ca’ Zorzi 2, Elke Hahn 2
and Marcelo Sánchez 2
electronic library at http://ssrn.com/abstract_id=970654.

© European Central Bank, 2007
AddressKaiserstrasse 2960311 Frankfurt am Main, Germany
Postal addressPostfach 16 03 1960066 Frankfurt am Main, Germany
Telephone +49 69 1344 0
Internethttp://www.ecb.int
Fax +49 69 1344 6000
Telex411 144 ecb d
All rights reserved.
Any reproduction, publication and reprint in the form of a different publication, whether printed or produced electronically, in whole or in part, is permitted only with the explicit written authorisation of the ECB or the author(s).
The views expressed in this paper do not necessarily reflect those of the European Central Bank.
The statement of purpose for the ECB Working Paper Series is available from the ECB website, http://www.ecb.int.
ISSN 1561-0810 (print)ISSN 1725-2806 (online)

3ECB
Working Paper Series No 739March 2007
CONTENTS
Abstract 4
Non-technical summary 5
1. Introduction 6
2. Methodology 9
3. Data description 10
4. Empirical results 12
5. Robustness 15
6. Final remarks 17
References 18
Appendix: data sources 20
Tables 22
European Central Bank Working Paper Series 30

Abstract
This paper examines the degree of Exchange Rate Pass-Through (ERPT) to prices in 12 emerging markets in Asia, Latin America, and Central and Eastern Europe. Our results, based on three alternative vector autoregressive models, partly overturn the conventional wisdom that ERPT into both import and consumer prices is always higher in “emerging” than in “developed” countries. For emerging markets with only one digit inflation (most notably the Asian countries), pass-through to import and consumer prices is found to be low and not very dissimilar from the levels of developed economies. The paper also finds robust evidence for a positive relationship between the degree of the ERPT and inflation, in line with Taylor’s hypothesis once two outlier countries (Argentina and Turkey) are excluded from the analysis. Finally, the presence of a positive link between import openness and ERPT, while plausible theoretically, finds only weak empirical support.
JEL Classification: C32, E31. Key Words: Exchange Rate Pass-Through, Emerging Markets.
4ECB Working Paper Series No 739 March 2007

Non-technical summary
Understanding the impact of exchange rate movements on prices is critical from a policy
perspective in order to gauge the appropriate monetary policy response to currency movements.
Empirical studies have shown that movements in the exchange rate and prices do not go one to
one in the short to medium run. An extensive theoretical literature, which has developed over the
past three decades, has identified various explanations why exchange-rate pass-through (ERPT)
to import and consumer prices is incomplete. Empirical analyses have also provided evidence of
considerable cross-country differences in the ERPT. A major argument in this respect was
suggested by Taylor (2000), who put forward the hypothesis that the responsiveness of prices to
exchange rate fluctuations depends positively on inflation.
This paper examines the degree of ERPT to prices in 12 emerging markets in Asia, Latin America, and Central and Eastern Europe. To achieve this, we employ a modelling strategy that was developed for advanced countries by McCarthy (2000) and applied by Hahn (2003) to the euro area. We estimate vector autoregressive models, which include in the baseline case as variables output, the exchange rate, import and consumer prices, a short-term interest rate, and oil prices. This vector autoregressive approach allows for the likely endogeneity between our variables of interest. Exchange rate shocks are identified by appropriately ordering the variable of interest and applying a recursive identification scheme. As the ordering of the variables may matter, we conduct a sensitivity analysis for different alternative orderings of the variables. For comparison purposes, we also estimate comparable models for a benchmark of developed economies, namely the euro area, the United States and Japan. Our results confirm that ERPT declines across the pricing chain, i.e. it is lower on consumer prices than on import prices. There is also evidence of low ERPT for developed economies, particularly in the case of the US and, for consumer prices, in Japan. In line with previous studies ERPT is found to be somewhat higher in the euro area than in the US, both for consumer and import prices. Our analysis also partly overturns the conventional wisdom that ERPT is always higher in “emerging” than in “developed” countries. For emerging economies with one-digit level of inflation (most notably the Asian countries in our sample), ERPT is low and not very dissimilar from the levels prevailing in developed economies. More generally, the paper finds broad confirmation for a positive relationship between the degree of the ERPT and inflation, in line with Taylor’s hypothesis. This result becomes apparent only after two outlier countries (Argentina and Turkey) are excluded, given the estimation difficulties associated with the severe macroeconomic instability experienced over the sample in these two countries. Finally, the presence of a positive link between import openness and ERPT, while plausible theoretically, finds only weak empirical support.
5ECB
Working Paper Series No 739March 2007

1. Introduction
Over the past two decades a large economic literature on exchange rate pass-through (ERPT) has
developed. Starting from different stand-points, the empirical literature examines the role played
by ERPT in small and large economies. Studies conducted for the case of developed countries
include Anderton (2003), Campa and Goldberg (2004), Campa et al. (2005), Gagnon and Ihrig
(2004), Hahn (2003), Ihrig et al. (2006) and McCarthy (2000). There is also a burgeoning
literature applied to emerging market economies, including cross-country comparisons as in
Choudhri and Hakura (2006), Frankel et al. (2005) and Mihaljek et al. (2000).
Economists have traditionally made the simplifying assumption that the prices of tradable goods
– once expressed in the same currency – are equalised across countries, i.e. that the purchasing-
power parity condition (PPP) holds. Empirically, however, this assumption has found in general
little support, at least in the case of small samples and in the short to medium run. In line with
this evidence, the theoretical literature developed over the past two decades has provided
different explanations why the ERPT is incomplete. In his seminal paper, Dornbusch (1987)
justifies incomplete pass-through as arising from firms that operate in a market characterised by
imperfect competition and adjust their mark-up (and not only prices) in response to an exchange
rate shock. Burstein et al. (2003) instead emphasise the role of (non-traded) domestic inputs in
the chain of distribution of tradable goods. Burstein et al. (2005) point to the measurement
problems in CPI, which ignores the quality adjustment of tradable goods large adjustment in the
exchange rate. Another line of reasoning stresses more the role that monetary and fiscal
authorities play, by partly offsetting the impact of changes in the exchange rate on prices
(Gagnon and Ihrig, 2004). Devereux and Engel (2001) and Bacchetta and van Wincoop (2003)
explore instead the role of local currency pricing in reducing the degree of ERPT.
Corroborating these various theoretical approaches, the empirical literature for both advanced
and emerging economies has found evidence of incomplete ERPT. These studies also find
evidence of considerable differences across countries, leading naturally to the question of what
are the underlying determinants of pass-through. Taylor (2000) in particular has put forward the
hypothesis that the responsiveness of prices to exchange rate fluctuations depends positively on
inflation. The rationale for this involves a positive correlation between the level and persistence
of inflation, coupled with a link between inflation persistence and pass-through. The latter link
can be expressed as follows: The more persistent inflation is, the less exchange rate movements
are perceived to be transitory and the more firms might respond via price-adjustments.
The evidence across different studies appears overall supportive of the Taylor hypothesis. The
positive relationship between the degree of pass-through and inflation appears to emerge more
6ECB Working Paper Series No 739 March 2007
strongly, however, when emerging markets are included in the sample period under review (see
in particular the panel data evidence in Choudhri and Hakura, 2006). This may be not surprising,
as the theoretical argumentation of Taylor becomes more meaningful for higher rates of
inflation.3
Another important determinant of ERPT, from a theoretical standpoint is the degree of trade
openness of a country. The most immediate connection between the two variables is positive: the
more a country is open, the more movements in exchange rates are transmitted via import prices
into CPI changes. However, the picture becomes more complex once we take into account that
inflation could be negatively correlated with openness, as empirically found by Romer (1993).4
This gives rise to an indirect channel, whereby openness is negatively correlated with inflation
and, taking into account Taylor’s hypothesis, the degree of pass-through. The direct and indirect
channels go in opposite directions and the overall sign of the correlation between pass-through
and openness can thus be either positive or negative.
The present paper reviews the results from the literature, exploring the magnitude of the ERPT
and the differences across countries by estimating vector autoregressive (VAR) models for
emerging market countries and for the main industrialised economies, i.e. the euro area, the
United States and Japan which are used as a control group. A simultaneous equation approach is
used in order to allow for potential and highly likely endogeneity between the variables of
interest. Simply ignoring such simultaneity, as is often done in single equation approaches, would
result in simultaneous equation bias. The chosen modelling framework is, moreover, appealing as
it allows one to trace out the dynamic responses of variables to exogenous shocks over time. The
literature so far has estimated either single equation models or systems of equations for one
specific country, or else set up single equation models for a larger set of countries (e.g. Choudhri
and Hakura, 2006, and Mihaljek et al., 2000). In this study instead, we apply our system
approach to a considerable number of countries in the world’s three main emerging market
regions, namely, Asia, Latin America, and Central and Eastern Europe. At the same time, we use
the same approach to the three major industrial economies, which ensures comparability across
the country results. By estimating each country model over the longest possible time horizon, we
moreover aim at the highest possible degree of precision of the pass-through estimates for each
country. In this respect, an important ingredient to the analysis has been the creation of a suitable
and comparable database for each country at the quarterly frequency, which represents a major
challenge given the data availability and quality for emerging market countries. This has also
3 It is worth noting that exchange rate pass-through may also be higher in emerging markets because the private sector
has fewer hedging instruments available. In a not fully competitive environment, this could imply that the exchange rate moves feed more into pricing behaviour.
4 The author provides a theoretical explanation for this result, relating to the difficulties in pursuing stabilisation policies in small open economies.
7ECB
Working Paper Series No 739March 2007

variables in order to allow for sufficiently rich dynamics and to avoid omitted variable bias.
We then use our country results to examine the conventional wisdom that ERPT is higher in
emerging markets than in industrialised economies and to investigate patterns of exchange-rate
pass-through across them in terms of correlations, along the lines of McCarthy (2000) and
Choudhri and Hakura (2006). Whether the ERPT is higher or not in emerging markets matters for
the determination of the trade balance and also for a country’s choice of an exchange rate regime.
A relatively high degree of pass-through for developing countries has also been cited as a
rationale for the developing countries’ well documented “fear of floating”. It also matters
because low pass-through in emerging markets might suggest that in these countries firm’s
market power is on the rise and not falling, as globalisation trends might suggest. Emerging
market countries, however, present important special features that make it difficult to obtain
reliable estimates of ERPT. Several Asian countries have frequently pursued active policies
aimed at controlling the exchange rate. Central and Eastern European countries underwent a
radical transformation of their economies in the 1990s. Finally, Turkey and several Latin
American countries experienced spells of strong macroeconomic instability characterised by very
high inflation rates and/or strong exchange and interest rate volatility.
Our results only partly support the prevailing view that the degree of ERPT is higher in emerging
markets than in developed countries (using as a benchmark the US, the euro area and Japan).
More specifically, we find that in low-inflation emerging economies (notably the Asian
economies) pass-through to consumer prices is rather small. In relation to this, the paper is
overall supportive of the hypothesis of Taylor, finding evidence of a positive correlation between
pass-through and inflation in emerging markets. This connection appears to be statistically
significant across all different identification schemes under consideration when two outlier
countries are excluded. As in the related literature, the role of openness is found to be, in general,
weak, even after controlling for the level of inflation rates.
The rest of the paper is structured as follows. Section 2 and 3 describe the methodology and the
data for the countries under consideration. Sections 4 and 5 present the empirical results for the
baseline and alternative specifications, respectively. Finally, Section 6 contains our main
conclusions.
8ECB Working Paper Series No 739 March 2007
helped us meeting the requirements of a system approach based on a relatively high number of

2. Methodology
The analysis is conducted by using a standard VAR model as in (1),
∑=
− +Φ+=p
ittit YcY
11 ε (1)
where tY represents the vector of endogenous variables, c is a vector of constants, iΦ denotes
the matrices of autoregressive coefficients and tε is a vector of white noise processes.
Identification of the structural shock is achieved by appropriately ordering the variables of
interest and applying a Cholesky decomposition to the variance covariance matrix of the reduced
form residuals tε .
As a starting point of the analysis, a six-variable VAR model similar to those by McCarthy, 2000
and Hahn, 2003, is developed. The baseline VAR model applied to the different countries
includes an oil price index, toil , an output variable ty , an exchange rate te , an import price index
tpimp , a consumer price index tcpi , and a short-term interest rate ti . The exchange rate and the
two price variables are the key variables in our analysis. The output variable and oil prices are
included to capture effects on the real side of the economy. The inclusion of the interest rate
allows the money market, including the impact of monetary policy, to influence the pass-through
relationship.
In the baseline model the variables are ordered as listed above. The use of a recursive
identification scheme implies that the identified shocks contemporaneously affect their
corresponding variables and those variables that are ordered at a later stage, but have no impact
on those that are ordered before. Hence, it is sensible to order the most exogenous variable, in our
case the oil price, first. Oil price shocks may thus affect all other variables in the system
contemporaneously but oil prices are not themselves affected contemporaneously by any of the
other shocks. The next variables in the system are output and the exchange rate. With this
ordering we implicitly assume a contemporaneous impact of the demand shocks on the exchange
rate while also imposing a certain time lag on the impact of exchange rate shocks on output. The
price variables are ordered next and are thus contemporaneously affected by all of the above
mentioned shocks. Following the pricing chain, import prices precede consumer prices allowing
for a contemporaneous impact of import price shocks on consumer prices but not vice versa. The
interest rate is ordered last, allowing for the money market, and in particular monetary policy, to
react contemporaneously to all variables in the model. The baseline specification represents just
one of several plausible alternatives in terms of identification and variables included. Hence, we
later carry out a sensitivity analysis using two other plausible model formulations.
9ECB
Working Paper Series No 739March 2007

3. Data description
In this study we focus our analysis on countries from three broad world regions, Asia (China,
South Korea, Singapore, Taiwan, and Hong Kong), Central and Eastern Europe (Czech Republic,
Hungary, Poland) plus Turkey, and Latin America (Argentina, Chile and Mexico). This selected
set of countries is composed of major emerging market countries in these regions.5 For each
country a set of quarterly data was collected, going as far as back in time as possible. The oil
price is represented by a crude oil price index denominated in US dollars. The preferred output
variable is GDP, although in a few cases we have used industrial production in order to get a
longer sample period. For all countries for the exchange rate we employed a nominal effective
series. Furthermore, local currency import and consumer prices are included, except for China
where we restricted the analysis to consumer prices as an import price series was not available.
Finally, the monetary policy instrument is represented by a short term interest rate. As the sample
period was determined by data availability,6 it varies across countries (see the Appendix for a
detailed description of the data sources, and the first rows in Tables 1 and 2 for the sample
periods employed).
A summary of the average macroeconomic conditions in emerging markets over the sample
period for which data is available is given in Table 1. Average inflation was relatively low in the
Asian countries, particularly in the cases of Taiwan and Singapore. The latter two countries
managed to combine strong real GDP growth, low inflation and a stable nominal effective
exchange rate, both in value and volatility terms. Central and Eastern European countries have
combined output growth of around 2 and 3% with relatively high but falling rates of inflation.
More specifically, disinflation was achieved earlier in the Czech Republic, although in the
context of the recessionary forces which persisted for a number of years after the 1997 banking
crisis. Over the period under review, which coincides with the return to market economy systems,
the Czech Republic, Hungary and Poland have all been subject to a rather sizeable process of real
appreciation, partly related to the Balassa-Samuelson effect, but also to the unwinding of the
large undervaluation of the early phases of restructuring.
A number of countries experienced instead strong inflationary pressures over the sample period
under consideration. Two countries stand out in particular. Uncertain financial macroeconomic
conditions weighed on Argentina, which experienced at various points in time in its history
prolonged spells of major financial turbulence leading also to hyperinflationary episodes. Strong
5 The country of relatively large size that has been excluded from the analysis is Brazil, because of the implausible
results obtained, extreme high levels of volatility in the data and annualised inflation well above 1000% throughout the period between 1992Q1 and 1994Q4.
6 We have followed a cascade order, choosing when possible only one institutional source (IMF’s International Financial Statistics, OECDs’ Main Economic Indicators, and BIS, in that order) followed by domestic sources (as available frequently via private providers of international data). Particular attention was given to the need of having a consistent dataset and avoiding data discontinuities caused by data compilation errors.
10ECB Working Paper Series No 739 March 2007

inflationary pressures and high exchange rate volatility prevailed also in Turkey with severe
financial difficulties erupting on more than one occasion. Mexico also experienced spells of
significant, although comparatively more contained, market turbulence as shown by the high
nominal effective exchange rate volatility. Chile managed instead to keep a lower average
inflation of about 13% as recorded since 1980. Finally, many emerging market countries in our
sample can be described as rather open economies with regard to their trading structure. Taking
as a benchmark imports as a percentage of GDP, we find that the most open economies in our
sample are, in diminishing order, Hong Kong, Singapore followed by the Czech Republic and
Hungary. The larger economies, China and Argentina are found to be relatively closed compared
to the other emerging markets in this study.
Table 2 summarises the average macroeconomic conditions in three advanced economies
constituting our benchmark of comparison, namely, the US, the euro area and Japan. These
economies exhibit low average inflation as well as more stable macroeconomic conditions than
emerging markets. On the basis of the inflationary record, among the emerging markets one
would probably expect to find the lowest coefficients of pass-through in Asia and the highest in
Latin America, with the exception of Chile. The degree of openness, however, might contribute
to play a counterbalancing role by dampening the impact on CPI pass-through in relatively closed
Latin American economies, while bringing about a positive impact especially in the cases of
Hong Kong and Singapore – the countries most open to trade in our sample.
The degree of ERPT in each country is computed by estimating a specification of model (1) for
the selected vector of endogenous variables, which takes account of the time series properties of
the data. Unit root tests indicated that most variables in the considered countries are non-
stationary (only the interest rate was found to be stationary in some cases), while Johansen
cointegration tests overall provided only weak evidence of possible long-run equilibrium
relationships among the variables in some countries. Given these data properties, a VAR in the
first differences of the non-stationary variables represents an appropriate specification of the
models. Favouring a VAR in first differences, as opposed to a Vector Error Correction model
(VECM), may lead to misspecification, if cointegration would be present. However, our choice
also considers that the analysis: (i) focuses on the short-term dynamics as opposed to long-term
equilibrium relationships between variables; and (ii) is constrained by the short-sample periods
available for some of the emerging market economies. An alternative viable choice would have
been a VAR model in the levels of the variables. It is, however, worth saying that also neither the
estimation in levels nor the VECM specifications are exempt from problems (see, e.g., Favero,
2001). In the presence of cointegration, the former method would suffer from
11ECB
Working Paper Series No 739March 2007
wrong cointegrating vector is imposed on the model.7
More specifically, our VAR model in the first differences of the non-stationary variables includes
as variables toil∆ , ty∆ , te∆ , tpimp∆ , tcpi∆ and finally, depending on the outcome of unit root
tests, either ti or ti∆ . All models are estimated with a constant and seasonal dummies. The lag
length of the VAR for each country is determined by looking at various information criteria as
well as a number of specification tests. Information criteria are used to help identify optimal lag
lengths, but the final decision is based on specification tests applied to the alternative candidate
models.8
In the next two sections we first discuss the results for the ERPT to domestic prices in the
emerging market economies and compare them to those derived for our control group of
advanced economies. We subsequently attempt to establish a link between the size of the ERPT
across countries and some possible determinants by calculating correlations coefficients. Finally
we investigate how robust these results are by applying two alternative identification schemes.
4. Empirical results
The estimates of the ERPT on import and consumer prices for all emerging market countries in
our sample are summarised in Tables 3 and 4 for two time horizons, namely after 4 and 8
quarters. For most countries our results appear generally plausible both in terms of CPI and
import prices. ERPT is found to decline along the pricing chain, i.e. it is higher for import prices
than for consumer prices. In particular, one-year after the shock pass-through to import prices is
found to be high and statistically not different from 1 in the cases of Argentina, Chile, Hungary,
most other Asian countries.9 ERPT to CPI is found to be the highest in Hungary and Mexico. In
Asia, pass-through to CPI is found instead to be low both after four and eight quarters. As regards
Singapore, while the point estimates of the coefficients are found to be slightly negative, they are
not significantly different from zero.
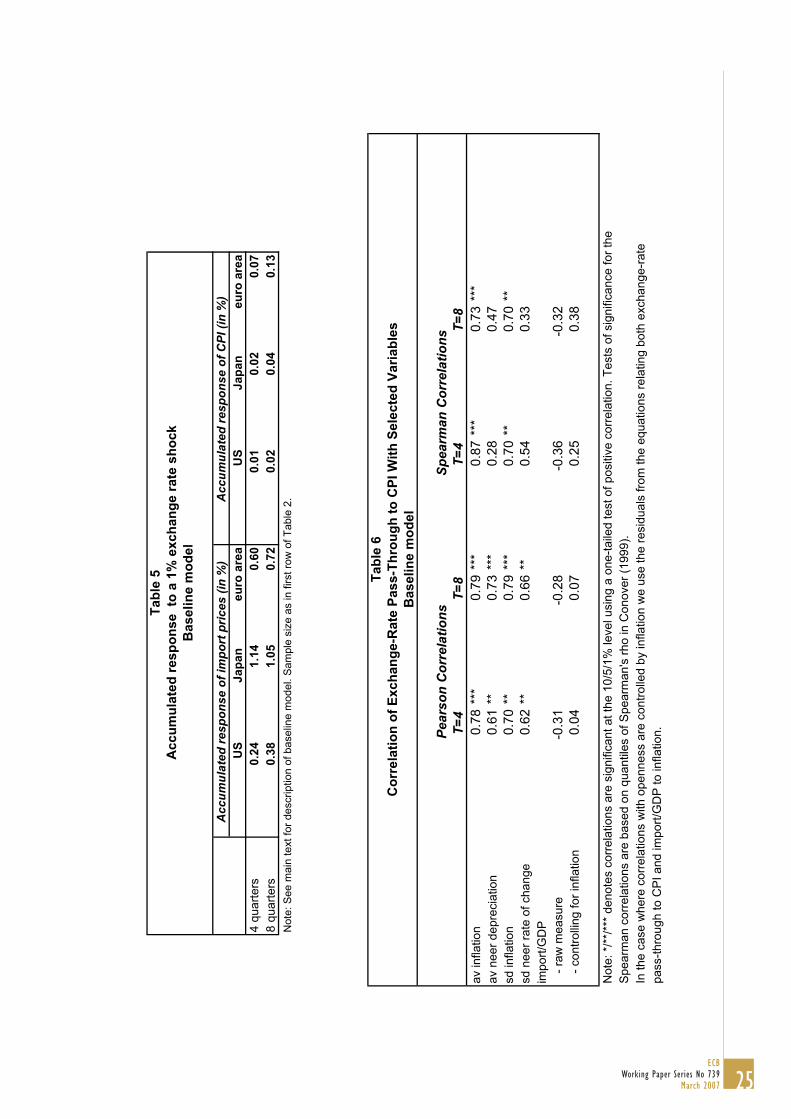
We then apply the same methodology to the euro area, the US and Japan in order to assess
whether the degree of pass-through is higher in emerging markets. Table 5 shows that the
7 Moreover, Marcet (2005) argues that in several cases cointegration techniques and VARs in levels may not be
superior to differencing. 8 The lag length selected for the emerging market economies is generally four lags, except for Taiwan, the Czech
Republic and Hungary (three lags) and Chile (two). On the basis of unit root tests, nominal interest rates are included in differences for Hungary and Korea, and in levels for all other emerging countries. As regards the developed countries, three lags are used for the US model and two for the VAR models for the euro area and Japan, respectively, Interest rates are included as first differences for all three developed economies.
9 Two years after the shock the estimates are higher, but given the large uncertainty surrounding the estimates in these countries still not statistically different from one.
12ECB Working Paper Series No 739 March 2007
overparameterisation and an efficiency loss. The VECM would yield inconsistent estimates if the
Mexico, Poland and Turkey, somewhat lower in the Czech Republic and Korea, and rather low in

similar (see Hahn, 2003)10 or alternative methodologies (see e.g. Anderton, 2003, and Campa et
al., 2005, for import prices). The estimates found for the US are in line with the overall consensus
that exchange rate pass-through is very low in the United States, both in terms of import and
consumer prices (see Gagnon and Ihrig, 2004, for consumer prices). In Japan, exchange rate pass-
through to CPI is found to be very small both after four and eight quarters. In terms of import
prices, the estimate for Japan is higher than in the euro area and the US, and statistically
consistent with full pass-through after one year. Comparing the pass-through estimates of
advanced and emerging economies, our results partially overturn the conventional wisdom that
the degree of ERPT is always higher in emerging markets than in developed countries. More
specifically, we find that in low inflation emerging economies (notably the Asian economies)
pass-through to consumer prices is rather low as well.
The next step in our analysis is to obtain some insights on the macroeconomic determinants of
ERPT. We begin by exploring whether in line with Taylor’s hypothesis there is evidence of a
positive correlation between pass-through and inflation. For illustrative purposes we start our
analysis by visually inspecting the relationship between the degree of ERPT after one year and
inflation for the emerging markets in our sample (see Figure 1).11
Figure 1: Consumer Price Pass-Through versus Average Inflation in Emerging Markets
(y-axis: accumulated response of consumer prices to a 1% exchange rate shock after one year;
x-axis: average inflation over the estimation period)
-0.2
0.0
0.2
0.4
0.6
0.8
1.0
0 10 20 30 40 50 60 70
AGTW
TKHK CN
KR
CLPL
HN
CZMX
SG
Note: The model employed is the baseline model (see main text for details). The countries plotted in the chart are: Argentina (AG), Turkey (TK), Mexico (MX), Czech Republic (CZ), Hungary (HN), Poland (PL), Chile (CL), South Korea (KR), China (CN), , Hong Kong (HK), Taiwan (TW), Singapore (SG).
10 Different to our analysis Hahn (2003) uses non-oil import prices. As the ERPT to commodities such as oil is known
to be particularly high, the finding of a somewhat higher pass-through on total import prices than on non-oil import prices seems consistent.
11 Similar charts are also available on request from the authors for the 8 quarter horizon under the baseline model as well as for the two alternative scenarios considered in section 4 both at the 4 and 8 quarter horizons.
13ECB
Working Paper Series No 739March 2007
evidence for the euro area is very much in line with the estimates found by other studies using

As shown in Figure 1, two broad sets of countries can be identified. The first set of countries, in
which annual inflation was on average less than 10% over the sample, experienced low levels of
ERPT (generally less than 10%). A second set of countries, in which average inflation was clearly
higher – i.e. between 10 and 20%, was subject to a considerably higher degree of ERPT to
consumer prices (about 40%). These sets of countries seem to provide at least broad support of
Taylor’s hypothesis. Two other countries in our sample, Argentina and Turkey, appear to be clear
outliers, since they combine extremely high average inflation rates (of over 60%) and low
consumer prices pass-through. Simple visual inspection of the above chart indicates that if these
two countries are included in the analysis, Taylor’s hypothesis would break down. The VAR
methodology is, however, probably inadequate for countries that experienced significant
macroeconomic instability as reflected in hyperinflation or very-high inflation rates. Taking the
example of Argentina, extending the sample too much signifies including in the analysis large
jumps in the financial variables (followed by different speeds of adjustment to more “normal”
levels). By restricting the sample period to exclude the high inflation episodes, instead, not only
does the data length become very short but also the sample becomes a partial, possibly
misleading, snapshot of the high inflation episode. For example one may end up including a
period of high inflation, during which the macroeconomic stabilisation is still ongoing, and
matching it with a strongly appreciating currency (rebounding from the strong undervaluation
typically associated to hyperinflationary episodes). Under these circumstances it becomes
therefore very difficult to recover the underlying relationship between exchange rate movements
and prices given the unusual dynamic patterns that are expected to arise under such an unstable
economic environment. The VAR methodology and more generally all econometric estimations
are unlikely to be able to capture any meaningful measures of pass-through if prices, exchange
rates and interest rates are excessively volatile. By contrast the economic insight suggested by
Taylor appears to find support if we exclude from the sample Turkey and Argentina.
The visual impression of a positive correlation between pass-through and inflation is confirmed
by two standard measures of correlation - the Pearson product-moment and Spearman rank
correlation coefficients - between the coefficient of pass-through and a number of plausible
determinants. The results appear in Table 6. These measures confirm that there is a positive
correlation between pass-through and inflation at both four- and eight-quarter time horizons. The
correlation coefficient is significant both in the case of the Pearson and Spearman correlation
coefficients at both the 4-quarter and 8-quarter horizons at the 1% significance level. Other
measures of macroeconomic instability are also positively correlated with ERPT, although the
level of significance is generally somewhat smaller. Similarly to Choudhri and Hakura (2006) and
McCarthy (2000), we find little evidence of a positive relationship between ERPT to consumer
prices and openness. This finding could be seen as surprising in light of the expected positive
direct link between these variables, as resulting from the transmission channel from imports to
14ECB Working Paper Series No 739 March 2007

consumer prices. One way of rationalising the previous puzzling result is to take into account the
negative correlation between inflation and openness as reported by Romer (1993). After
controlling for inflation, the correlation coefficient between pass-through and openness turns
positive, although not statistically significant.
5. Robustness
In this section we assess to what extent our baseline results are sensitive to the choice of the
identification scheme and some changes in the variables. We re-estimate the model with two
alternative identification schemes, based on two alternative orderings of the variables in the
Cholesky decomposition. In the first place, we adopt the following alternative ordering scheme
(Alternative 1 model), toil , ti , ty , te , tpimp , tcpi , where in particular the interest rate is
moved before the exchange rate, as proposed for example by Choudhri et al. (2002). This
ordering allows for a contemporaneous response of the exchange rate to changes in the monetary
policy instrument. This could be explained on the basis of standard carry-trade considerations,
whereby higher interest rates make – other things equal - currencies more attractive by exploiting
in particular the failures of the arbitrage equation. Estimates of pass-through under this alternative
identification scheme are generally very similar to those discussed in the previous section (see
Tables 7 and 8). An exception to this is Hungary where estimates of ERPT to both import prices
and CPI drop considerably. In terms of import prices, as before one year after the shock the
coefficient of pass-through is found to be high and not significantly different from 1 in Argentina,
Mexico and Poland. In the case of Chile, the coefficient of import price pass-through is now
found to be somewhat lower and closer to the levels of the Czech Republic and Korea one year
after the shock (in the region between 0.7 and 0.8). One year after the shock, the degree of import
price pass-through remains very low in the cases of Singapore and Taiwan, although in the former
case it rises considerably two years after the shock.
In terms of CPI prices, the coefficient of pass-through remains as before almost always smaller
than the import price equivalent. The coefficient is now found to be the highest one year after the
shock in the Czech Republic, Mexico and Poland. In Asia, ERPT to consumer prices is one more
time found to be on the low side. Again, in the case of Singapore, although the point estimates of
the coefficients are found to be negative, they are not significantly different from zero. The
overall result that all countries characterised by average inflation less than 10% are generally
characterised by moderate levels of estimated ERPT still holds. As before Argentina and Turkey
stand out for very low pass-through on consumer prices. Excluding these two countries, the
positive correlation between pass-through and inflation still is found to be positive after both four
and eight quarters, albeit the degree of significance is lower than in the first scenario that we had
considered (see Table 9). Other measures of macroeconomic instability are also positively
correlated with the degree of ERPT at various different levels of significance at both the first and
15ECB
Working Paper Series No 739March 2007

second year horizons. Finally, we once more find no evidence of a statistically significant positive
relationship between ERPT and openness, even after controlling for inflation.
The second considered alternative model (Alternative 2 model) to our baseline case includes both
modifications to the included variables and a further alternative ordering of the variables in the
Cholesky decomposition. In the previous models we had included an oil price variable which
could be interpreted as capturing supply side effects but also foreign costs and, hence, should
have helped to more properly disentangle exogenous exchange rate effects from those of foreign
costs. A similar argumentation applies to domestic price developments though. We therefore
replace in this alternative model the oil price by domestic producer prices tppi , which also takes
account of the necessity of a parsimonious model. An alternative variable to use for this purpose
might have been wages. This variable, however, is not available for a sufficiently large number of
the considered countries. As regards changes to the ordering of the variables, in the Alternative 2
model we take a rather strong theoretical stand-point by assuming that the exchange rate is not
contemporaneously affected by the shocks hitting any of the other variables in the system, i.e. it is
placed first leading to the following ordering of the variables: te , tpimp , ty , tppi , tcpi ti . There
is a large literature that discusses ERPT on the basis of various structural models, coming to
different theoretical conclusions concerning the determination of the exchange rate depending on
the underlying assumptions of the model (see for example Marston, 1990, and Devereux et al.,
2006). In these models, a particularly crucial role is assumed by whether firms set prices in the
local currency where they sell the product or in the currency of where production takes place.
While these models provide coherent insights on the concepts of ERPT depending on the various
underlying assumptions of the model, they implicitly tend to come to strong conclusions
regarding a contemporaneous connection between exchange rates and a subset of plausible
fundamentals. All these papers are potentially subject to the critique that macroeconomic
variables have little explanatory power for exchange rates in the short to medium run. In
particular, it has been difficult to detect mean reversion in real exchange rates – the latter’s
volatility seeming to be driven by nominal exchange rate developments that are not easy to
reconcile with fundamental explanations.12 In connection with this, the Alternative 2 model
allows the exchange rate to be influenced by the shocks to other variables but only with a lag,
implicitly assuming that contemporaneously at least other factors (such as ‘noise trading’ or
imperfect information considerations – both of great importance in an emerging market context)
tend to dominate.
12 On the little explanatory power of macro variables for exchange rate determination, see the vast literature stemming
from Meese and Rogoff (1983). For an attempt to reconcile a simple structural fundamentalist view and high
16ECB Working Paper Series No 739 March 2007
exchange rate volatility, see for example Devereux and Engel (2001).

to those discussed in the previous section (Tables 10 and 11). Pass-through to import prices is
found to be close to 1, both after one and two year horizons, in Argentina, Chile, Hungary,
Poland, Mexico and Turkey, while is estimated to be much lower in the Asian countries and in
the Czech Republic. Consumer prices pass-through is generally found to be lower than import
pass-through for all countries and in the case of several Asian countries is close to zero after both
one and two year horizon. Repeating the correlation analysis we consistently find evidence of a
significantly positive relationship between CPI pass-through and inflation (at the 1% level), after
excluding Argentina and Turkey from the sample (see Table 12). The correlation coefficient
between CPI-pass-through and the remaining measures of macroeconomic instability is also
positive and almost always statistically significant for all time horizons considered. The
association between CPI-pass-through and openness is again positive, after controlling for
inflation, but not statistically significant.
6. Final remarks
This paper provides empirical evidence on world patterns of ERPT on domestic prices based on
vector autoregressive models for a considerable number of countries, including a large number of
emerging market countries from three major emerging world regions and a control group of
industrialised countries. Across all countries the results point to a decline in the ERPT along the
pricing chain. The analysis partly overturns the conventional wisdom that ERPT is always
considerably higher in “emerging” than in “developed” economies. For emerging markets with
only one-digit annual inflation rates (most notably the Asian countries) ERPT is low and not very
dissimilar from the levels of the ERPT in developed economies. Taking a more general
perspective, we find that the connection between pass-through and inflation is statistically
significant when two outlier countries (Argentina and Turkey), for which the results appear to be
unreliable, are excluded. In addition, the evidence of a positive correlation between pass-through
and openness appears to be weaker than that between pass-through and inflation, even after
controlling for the level of inflation.
17ECB
Working Paper Series No 739March 2007
Notwithstanding this relatively different model, the results that we obtain are noteworthy similar

References
Anderton, R. (2003), Extra-Euro Area Manufacturing Import Prices and Exchange Rate Pass-
Through, ECB Working Paper No. 219.
Bacchetta, P. and van Wincoop, E. (2003), Why do Consumer Prices React Less than Import
Prices to Exchange Rates?, Journal of European Economic Association, 1, 662-670.
Burstein, A., Eichenbaum, M. and Rebelo, S. (2005), Large Devaluations and the Real Exchange
Rate, Journal of Political Economy, 113, 742-784.
Burstein, A., Neves, J. and Rebelo, S. (2003), Distribution Costs and Real Exchange Rate
Dynamics During Exchange-Rate-Based-Stabilizations, Journal of Monetary Economics, 50,
1189-1214.
Campa, J. and Goldberg, L. (2004), Exchange Rate Pass-Through into Import Prices, CEPR
Discussion Paper No. 4391.
Campa, J., Goldberg, L. and González-Mínguez, J. (2005), Exchange Rate Pass-Through to
Import Prices in the Euro Area, Federal Reserve Bank of New York Staff Paper No. 219.
Choudhri, E. and Hakura, D. (2006), Exchange Rate Pass-Through to Domestic Prices: Does the
Inflationary Environment Matter?, Journal of International Money and Finance, 25, 614-639.
Choudhri, E., Faruqee, H. and Hakura, D. (2002), Exchange Rate Pass-Through in Different
Prices, IMF Working Paper, No. 02/224.
Conover, W. (1999), Practical Nonparametric Statistics, New York: John Wiley and Sons.
Devereux, M, and Engel, C. (2001), “Endogenous Currency of Price Setting in a Dynamic Open
Economy Model”, NBER Working Paper No. 8559.
Devereux, M., Lane, P. and Xu, J. (2006), Exchange Rates and Monetary Policy in Emerging
Market Economies, Economic Journal, 116, 478-506.
Dornbusch, R. (1987), Exchange Rates and Prices, American Economic Review, 77, 93-106.
Fagan, G., Henry, J. and Mestre, R. (2005), An Area-Wide Model (AWM) for the Euro Area,
Economic Modelling, 22, 39-59.
Favero, C. (2001), Applied Macroeconomics, Oxford: Oxford University Press.
Frankel, J., Parsley, D. and Wei, S. (2005), Slow Pass-Through Around the World: A New
Import for Developing Countries, NBER Working Paper No. 11199.
Gagnon, J. and Ihrig, J. (2004), Monetary Policy and Exchange Rate Pass-Through, International
Journal of Finance and Economics, 9, 315-338.
Hahn, E. (2003), Pass-Through of External Shocks to Euro Area Inflation, European Central
Bank Working Paper No. 243.
18ECB Working Paper Series No 739 March 2007

Ihrig, J., Marazzi, M. and Rothenberg, A. (2006), Exchange Rate Pass-Through in the G-7
countries, International Finance Discussion Paper No. 851, Federal Reserve Board of Governors.
McCarthy, J. (2000), Pass-Through of Exchange Rates and Import Prices to Domestic Inflation in
Some Industrialised Economies, Federal Reserve Bank of New York Staff Report No. 111.
Marcet, A. (2005), Overdifferencing VAR's is OK, mimeo, Universitat Pompeu Fabra.
Marston, R. (1990), Pricing to Market in Japanese Manufacturing, Journal of International
Economics, 29, 217-36.
Meese, R. and Rogoff, K. (1983), Empirical Exchange Rate Models of the Seventies: Do they Fit
Out of Sample?, Journal of International Economics, 14, 345-73.
Mihaljek, D. and Klau, M. (2000), A Note on the Pass-Through from Exchange Rate and Foreign
Price Changes to Inflation in Selected Emerging Market Economies, BIS Papers, 8, 69-81.
Romer, D. (1993), Openness and Inflation: Theory and Evidence, Quarterly Journal of
Economics, 4, 869-903.
Taylor, J. (2000), Low Inflation, Pass-Through and the Pricing Power of Firms, European
Economic Review, 44, 1389-1408.
19ECB
Working Paper Series No 739March 2007

Appendix: Data sources
The emerging markets data used in this paper covers a maximum sample period between
1975:1 to 2004:1 (see first row of Table 1). For the euro area, US and Japan, the sample period
starts in 1983:1. The exact sample for each emerging country, depending on data availability, is
described in the first row of Table 1. The corresponding sources are as follows:
Nominal Oil Price: IMF's International Financial Statistics - henceforth IFS -, UK Brent price
in US dollars (line 11276).
Output: We use Gross Domestic Product for Hong Kong, South Korea, Singapore, Hungary,
Turkey, Chile (from IFS, line 99bvp), Japan and Mexico (OECD), euro area (from ECB's Area
Wide Model - henceforth AWM; see Fagan et al., 2005), Taiwan and Argentina (national
sources), and the US (from IFS, line 99bvr). Due to lack of data availability, we opt for industrial
production data in the cases of China (national source), Czech Republic (OECD) and Poland (IFS
line 66).
Nominal Effective Exchange Rate: We use nominal effective rates from IFS (line nec) for all
emerging market countries but Hong Kong, South Korea, Singapore and Taiwan (BIS), Turkey
Mexico (OECD) and Argentina (JP Morgan). For the US and Japan, we use IFS (line neu) data,
and for the euro area AWM data.
Import Price Index: We use data on import prices (of goods only) from IFS (line 76) for US,
Japan, South Korea, Singapore, Hungary and Poland, and from alternative sources in the
following cases: euro area (ECB data), Taiwan, Argentina, and Mexico (national sources). In the
case of Chile, we combine import prices data from IFS line 76 until 1995:4, and thereafter Banco
de Chile import deflator data. Owing to lack of data availability, we use import deflator data for
the Czech Republic (OECD OEO), and IFS import unit values (line 75) for Hong Kong and
Turkey. We have no access to import prices-related data for the full sample in the case of China.
Consumer Price Index: We use CPI data from IFS (line 64) for all countries but euro area
(HICP data from AWM), Hong Kong (BIS), China and Taiwan (national sources).
Producer Price Index: We use PPI data from IFS (line 62) for all countries but Hong Kong,
Taiwan, Argentina and China (national sources).
Short-term Interest Rate: We use money market rates for the US, Japan, South Korea,
Singapore, Poland, Turkey, Argentina, (from IFS, line 60b), euro area (AWM), Hong Kong (from
BIS), and Taiwan (from Central Bank of China). We use Treasury bill rates for Hungary and
Mexico (from IFS, line 60c), and bank deposit rates for China, the Czech Republic and Chile
(from IFS, line 60l).
20ECB Working Paper Series No 739 March 2007

with the exception of China where they include only goods) and GDP. We use nominal import
data from IFS (line 99b) for all countries except the euro area (ECB), China, Singapore, and
Taiwan (national sources). We use nominal GDP data from IFS (line 98c) for all countries except
for the euro area (Eurostat), China, Singapore, and Taiwan (national sources).
21ECB
Working Paper Series No 739March 2007
Imports/GDP: To compute this ratio we use nominal series for imports (of goods and services,

Chi
naH
ong
Kon
gK
orea
Sing
apor
eTa
iwan
Cze
ch R
ep.
Hun
gary
Pola
ndTu
rkey
Arg
entin
aC
hile
Mex
ico
sam
ple
perio
d91
Q1
04Q
186
Q1
04Q
176
Q4
04Q
175
Q1
04Q
180
Q2
04Q
193
Q1
04Q
188
Q4
03Q
391
Q1
03Q
489
Q1
03Q
489
Q1
04Q
180
Q1
03Q
480
Q1
03Q
4av
infla
tion
5.7
4.5
7.0
2.1
2.5
5.8
17.4
17.4
65.1
66.4
13.2
34.0
av n
eer d
epre
ciat
ion
2.9
1.3
4.6
-0.4
0.3
-1.8
7.9
9.5
53.9
8.6
-0.6
27.3
av in
t. ra
te (%
per
ann
um)
6.0
6.2
12.3
4.8
6.3
5.3
19.9
21.5
68.8
7267
42.7
20.9
35.3
sd in
flatio
n11
.65.
98.
13.
65.
55.
615
.116
.640
.925
922.
912
.146
.2sd
nee
r rat
e of
cha
nge
13.5
10.8
34.6
8.1
11.1
9.7
15.0
16.8
162.
611
35.8
29.9
252.
6sd
int.
rate
(% p
er a
nnum
)3.
63.
15.
22.
74.
62.
48.
77.
433
.450
4504
8.5
13.5
26.7
aver
age
outp
ut g
row
th14
.14.
85.
57.
16.
42.
22.
93.
25.
41.
94.
42.
6im
ports
/GD
P (%
)19
.113
2.2
34.0
64.7
44.3
62.9
50.9
28.5
25.4
10.2
27.9
21.1
Not
es: F
or C
hina
, Hun
gary
and
Pol
and
indu
stria
l pro
duct
ion
is u
sed
inst
ead
of re
al G
DP
.A
pos
itive
/neg
ativ
e si
gn fo
r exc
hang
e ra
te c
hang
es m
eans
dep
reci
atio
n/ap
prec
iatio
n.
Asi
aC
EE
Cs
and
Turk
eyLa
tin A
mer
ica
Tabl
e 1
Sele
cted
sum
mar
y in
dica
tors
for e
mer
ging
mar
kets
ove
r the
est
imat
ed s
ampl
e pe
riod
(in a
nnua
lised
ave
rage
per
cent
age
rate
s - u
nles
s ot
herw
ise
note
d)
22ECB Working Paper Series No 739 March 2007

US Japan euro areasample period 83Q1 04Q1 83Q1 04Q1 83Q1 03Q4av inflation 3.1 0.9 3.0av neer depreciation 1.6 -3.2 -0.1sd inflation 1.6 2.6 1.8sd neer rate of change 14.0 18.2 10.1average output growth 3.4 2.5 2.2sd output growth 2.4 3.6 2.1imports/GDP (%) 9.0 11.8 11.7Notes: A positive/negative sign for exchange rate changes means depreciation/appreciation. Imports/GDP in the euro area refers to extraregional-trade.
Table 2. Imports/GDP
Summary indicators for US, Japan, euro area(in annualised percentage rates - unless otherwise noted)
23ECB
Working Paper Series No 739March 2007

Chi
naH
ong
Kon
gK
orea
Sing
apor
eTa
iwan
Cze
ch R
ep.
Hun
gary
Pola
ndTu
rkey
Arg
entin
aC
hile
Mex
ico
4 qu
arte
rs--
0.43
0.78
0.13
0.12
0.72
1.26
0.86
0.91
0.87
1.00
1.54
8 qu
arte
rs--
0.93
0.57
0.76
-0.1
20.
481.
771.
301.
761.
230.
821.
99N
ote:
See
mai
n te
xt fo
r des
crip
tion
of b
asel
ine
mod
el. S
ampl
e si
ze a
s in
firs
t row
of T
able
1.
Chi
naH
ong
Kon
gK
orea
Sing
apor
eTa
iwan
Cze
ch R
ep.
Hun
gary
Pola
ndTu
rkey
Arg
entin
aC
hile
Mex
ico
4 qu
arte
rs0.
080.
070.
19-0
.15
0.01
0.61
0.48
0.31
0.09
0.02
0.35
0.76
8 qu
arte
rs0.
770.
370.
13-0
.06
0.01
0.77
0.91
0.56
0.12
0.04
0.35
1.39
Not
e: S
ee m
ain
text
for d
escr
iptio
n of
bas
elin
e m
odel
. Sam
ple
size
as
in fi
rst r
ow o
f Tab
le 1
.
Tabl
e 4
Acc
umul
ated
resp
onse
to a
1%
exc
hang
e ra
te s
hock
Bas
elin
e m
odel
Acc
umul
ated
resp
onse
of c
onsu
mer
pric
es (i
n %
)
Tabl
e 3
Acc
umul
ated
resp
onse
to a
1%
exc
hang
e ra
te s
hock
Bas
elin
e m
odel
Acc
umul
ated
resp
onse
of i
mpo
rt p
rices
(in
%)
24ECB Working Paper Series No 739 March 2007
US
Japa
n eu
ro a
rea
US
Japa
n eu
ro a
rea
4 qu
arte
rs0.
241.
140.
600.
010.
020.
078
quar
ters
0.
381.
050.
720.
020.
040.
13N
ote:
See
mai
n te
xt fo
r des
crip
tion
of b
asel
ine
mod
el. S
ampl
e si
ze a
s in
firs
t row
of T
able
2.
Tabl
e 5
Acc
umul
ated
resp
onse
to
a 1%
exc
hang
e ra
te s
hock
Bas
elin
e m
odel
Acc
umul
ated
resp
onse
of i
mpo
rt p
rices
(in
%)
Acc
umul
ated
resp
onse
of C
PI (i
n %
)
T=4
T=8
T=4
T=8
av in
flatio
n0.
78**
*0.
79**
*0.
87**
*0.
73**
*av
nee
r dep
reci
atio
n0.
61**
0.73
***
0.28
0.47
sd in
flatio
n0.
70**
0.79
***
0.70
**0.
70**
sd n
eer r
ate
of c
hang
e0.
62**
0.66
**0.
540.
33im
port/
GD
P
- raw
mea
sure
-0.3
1-0
.28
-0.3
6-0
.32
- c
ontro
lling
for i
nfla
tion
0.04
0.07
0.25
0.38
Not
e: *
/**/
***
deno
tes
corr
elat
ions
are
sig
nific
ant a
t the
10/
5/1%
leve
l usi
ng a
one
-taile
d te
st o
f pos
itive
cor
rela
tion.
Tes
ts o
f sig
nific
ance
for t
heS
pear
man
cor
rela
tions
are
bas
ed o
n qu
antil
es o
f Spe
arm
an's
rho
in C
onov
er (1
999)
. In
the
case
whe
re c
orre
latio
ns w
ith o
penn
ess
are
cont
rolle
d by
infla
tion
we
use
the
resi
dual
s fro
m th
e eq
uatio
ns re
latin
g bo
th e
xcha
nge-
rate
pa
ss-th
roug
h to
CP
I and
impo
rt/G
DP
to in
flatio
n.
Tabl
e 6
Cor
rela
tion
of E
xcha
nge-
Rat
e Pa
ss-T
hrou
gh to
CPI
With
Sel
ecte
d Va
riabl
esB
asel
ine
mod
el
Pea
rson
Cor
rela
tions
Spe
arm
an C
orre
latio
ns
25ECB
Working Paper Series No 739March 2007

Chi
naH
ong
Kon
gK
orea
Sing
apor
eTa
iwan
Cze
ch R
ep.
Hun
gary
Pola
ndTu
rkey
Arg
entin
aC
hile
Mex
ico
4 qu
arte
rs--
0.53
0.75
0.10
0.19
0.73
0.75
0.91
0.36
0.86
0.77
1.44
8 qu
arte
rs--
1.05
0.51
0.70
-0.1
10.
590.
741.
210.
851.
300.
391.
81N
ote:
See
mai
n te
xt fo
r des
crip
tion
of a
ltern
ativ
e 1
mod
el. S
ampl
e si
ze a
s in
firs
t row
of T
able
1.
Chi
naH
ong
Kon
gK
orea
Sing
apor
eTa
iwan
Cze
ch R
ep.
Hun
gary
Pola
ndTu
rkey
Arg
entin
aC
hile
Mex
ico
4 qu
arte
rs0.
070.
150.
12-0
.17
0.03
0.55
0.07
0.30
0.08
0.02
0.11
0.60
8 qu
arte
rs0.
760.
410.
01-0
.09
0.02
0.72
0.06
0.53
0.10
0.39
-0.0
51.
11N
ote:
See
mai
n te
xt fo
r des
crip
tion
of a
ltern
ativ
e 1m
odel
. Sam
ple
size
as
in fi
rst r
ow o
f Tab
le 1
.
Tabl
e 8
Acc
umul
ated
resp
onse
to a
n ex
chan
ge ra
te s
hock
Alte
rnat
ive
1 m
odel
Acc
umul
ated
resp
onse
of c
onsu
mer
pric
es (
in %
)
Tabl
e 7
Acc
umul
ated
resp
onse
to a
1%
exc
hang
e ra
te s
hock
Alte
rnat
ive
1 m
odel
Acc
umul
ated
resp
onse
of i
mpo
rt p
rices
(in
%)
26ECB Working Paper Series No 739 March 2007

T=4
T=8
T=4
T=8
av in
flatio
n0.
62**
0.52
*0.
56**
0.41
av n
eer d
epre
ciat
ion
0.56
**0.
60**
0.27
0.44
*sd
infla
tion
0.62
**0.
64**
0.48
*0.
49*
sd n
eer r
ate
of c
hang
e0.
61**
0.60
**0.
390.
19im
port/
GD
P
- raw
mea
sure
-0.1
5-0
.15
-0.1
8-0
.39
- c
ontro
lling
for i
nfla
tion
0.13
0.08
0.18
0.12
Not
e: *
/**/
***
deno
tes
corr
elat
ions
are
sig
nific
ant a
t the
10/
5/1%
leve
l usi
ng a
one
-taile
d te
st o
f pos
itive
cor
rela
tion.
Tes
ts o
f sig
nific
ance
for t
heS
pear
man
cor
rela
tions
are
bas
ed o
n qu
antil
es o
f Spe
arm
an's
rho
in C
onov
er (1
999)
. In
the
case
whe
re c
orre
latio
ns w
ith o
penn
ess
are
cont
rolle
d by
infla
tion
we
use
the
resi
dual
s fro
m th
e eq
uatio
ns re
latin
g bo
th e
xcha
nge-
rate
pa
ss-th
roug
h to
CP
I and
impo
rt/G
DP
to in
flatio
n.
Tabl
e 9
Cor
rela
tion
of E
xcha
nge-
Rat
e Pa
ss-T
hrou
gh to
CPI
With
Sel
ecte
d Va
riabl
esA
ltern
ativ
e 1
mod
el
Pea
rson
Cor
rela
tions
Spe
arm
an C
orre
latio
ns
27ECB
Working Paper Series No 739March 2007

Chi
naH
ong
Kon
gK
orea
Sing
apor
eTa
iwan
Cze
ch R
ep.
Hun
gary
Pola
ndTu
rkey
Arg
entin
aC
hile
Mex
ico
4 qu
arte
rs--
0.54
0.70
-0.3
00.
250.
581.
500.
800.
971.
120.
931.
488
quar
ters
--1.
050.
460.
280.
090.
232.
200.
991.
700.
650.
671.
94N
ote:
See
mai
n te
xt fo
r des
crip
tion
of a
ltern
ativ
e 2
mod
el. S
ampl
e si
ze a
s in
firs
t row
of T
able
1.
Chi
naH
ong
Kon
gK
orea
Sing
apor
eTa
iwan
Cze
ch R
ep.
Hun
gary
Pola
ndTu
rkey
Arg
entin
aC
hile
Mex
ico
4 qu
arte
rs-0
.05
0.15
0.18
-0.2
5-0
.03
0.56
0.61
0.25
0.05
0.07
0.31
0.72
8 qu
arte
rs0.
070.
410.
12-0
.24
-0.0
40.
501.
200.
490.
100.
250.
251.
32N
ote:
See
mai
n te
xt fo
r des
crip
tion
of a
ltern
ativ
e 2
mod
el. S
ampl
e si
ze a
s in
firs
t row
of T
able
1.
Tabl
e 11
Acc
umul
ated
resp
onse
of c
onsu
mer
pric
es to
a 1
% e
xcha
nge
rate
sho
ckA
ltern
ativ
e 2
mod
el
Acc
umul
ated
resp
onse
of c
onsu
mer
pric
es (i
n %
)
Tabl
e 10
Acc
umul
ated
resp
onse
to a
1%
exc
hang
e ra
te s
hock
Alte
rnat
ive
2 m
odel
Acc
umul
ated
resp
onse
of i
mpo
rt p
rices
(in
%)
28ECB Working Paper Series No 739 March 2007

T=4
T=8
T=4
T=8
av in
flatio
n0.
75**
*0.
85**
*0.
88**
*0.
83**
*av
nee
r dep
reci
atio
n0.
58*
0.75
***
0.33
0.45
sd in
flatio
n0.
63**
0.76
***
0.68
**0.
71**
sd n
eer r
ate
of c
hang
e0.
55**
0.63
**0.
55**
0.42
impo
rt/G
DP
- r
aw m
easu
re-0
.15
-0.0
9-0
.20
-0.1
0
- con
trolli
ng fo
r inf
latio
n0.
200.
310.
410.
58**
Not
e: *
/**/
***
deno
tes
corr
elat
ions
are
sig
nific
ant a
t the
10/
5/1%
leve
l usi
ng a
one
-taile
d te
st o
f pos
itive
cor
rela
tion.
Tes
ts o
f sig
nific
ance
for t
heS
pear
man
cor
rela
tions
are
bas
ed o
n qu
antil
es o
f Spe
arm
an's
rho
in C
onov
er (1
999)
. In
the
case
whe
re c
orre
latio
ns w
ith o
penn
ess
are
cont
rolle
d by
infla
tion
we
use
the
resi
dual
s fro
m th
e eq
uatio
ns re
latin
g bo
th e
xcha
nge-
rate
pa
ss-th
roug
h to
CP
I and
impo
rt/G
DP
to in
flatio
n.
Tabl
e 12
Cor
rela
tion
of E
xcha
nge-
Rat
e Pa
ss-T
hrou
gh to
CPI
With
Sel
ecte
d Va
riabl
esA
ltern
ativ
e 2
mod
el
Pea
rson
Cor
rela
tions
Spe
arm
an C
orre
latio
ns
29ECB
Working Paper Series No 739March 2007

30ECB Working Paper Series No 739 March 2007
European Central Bank Working Paper Series
For a complete list of Working Papers published by the ECB, please visit the ECB’s website(http://www.ecb.int)
699 “The behaviour of producer prices: some evidence from the French PPI micro data” by E. Gautier, December 2006.
700 “Forecasting using a large number of predictors: is Bayesian regression a valid alternative toprincipal components?” by C. De Mol, D. Giannone and L. Reichlin, December 2006.
701 “Is there a single frontier in a single European banking market?” by J. W. B. Bos and H. Schmiedel, December 2006.
702 “Comparing financial systems: a structural analysis” by S. Champonnois, December 2006.
703 “Comovements in volatility in the euro money market” by N. Cassola and C. Morana, December 2006.
704 “Are money and consumption additively separable in the euro area? A non-parametric approach” by B. E. Jones and L. Stracca, December 2006.
705 “What does a technology shock do? A VAR analysis with model-based sign restrictions” by L. Dedola and S. Neri, December 2006.
706 “What drives investors’ behaviour in different FX market segments? A VAR-based returndecomposition analysis” by O. Castrén, C. Osbat and M. Sydow, December 2006.
707 “Ramsey monetary policy with labour market frictions” by E. Faia, January 2007.
708 “Regional housing market spillovers in the US: lessons from regional divergences in a common monetary policy setting” by I. Vansteenkiste, January 2007.
709 “Quantifying and sustaining welfare gains from monetary commitment” by P. Levine, P. McAdam and J. Pearlman, January 2007.
710 “Pricing of settlement link services and mergers of central securities depositories” by J. Tapking, January 2007.
711 “What “hides” behind sovereign debt ratings?” by A. Afonso, P. Gomes and P. Rother, January 2007.
712 “Opening the black box: structural factor models with large cross-sections” by M. Forni, D. Giannone, M. Lippi and L. Reichlin, January 2007.
713 “Balance of payment crises in emerging markets: how early were the “early” warning signals?” by M. Bussière, January 2007.
714 “The dynamics of bank spreads and financial structure” by R. Gropp, C. Kok Sørensen and J.-D. Lichtenberger, January 2007.
715 “Emerging Asia’s growth and integration: how autonomous are business cycles?” by R. Rüffer, M. Sánchez and J.-G. Shen, January 2007.
716 “Adjusting to the euro” by G. Fagan and V. Gaspar, January 2007.
717 “Discretion rather than rules? When is discretionary policy-making better than the timeless perspective?” by S. Sauer, January 2007.

31ECB
Working Paper Series No 739March 2007
718 “Drift and breaks in labor productivity” by L. Benati, January 2007.
719 “US imbalances: the role of technology and policy” by R. Bems, L. Dedola and F. Smets, January 2007.
720 “Real price wage rigidities in a model with matching frictions” by K. Kuester, February 2007.
721 “Are survey-based inflation expectations in the euro area informative?” by R. Mestre, February 2007.
722 “Shocks and frictions in US business cycles: a Bayesian DSGE approach” by F. Smets and R. Wouters, February 2007.
723 “Asset allocation by penalized least squares” by S. Manganelli, February 2007.
724 “The transmission of emerging market shocks to global equity markets” by L. Cuadro Sáez, M. Fratzscher and C. Thimann, February 2007.
725 ”Inflation forecasts, monetary policy and unemployment dynamics: evidence from the US and the euro area”by C. Altavilla and M. Ciccarelli, February 2007.
726 “Using intraday data to gauge financial market responses to Fed and ECB monetary policy decisions” by M. Andersson, February 2007.
727 “Price setting in the euro area: some stylised facts from individual producer price data” by P. Vermeulen, D. Dias, M. Dossche, E. Gautier, I. Hernando, R. Sabbatini and H. Stahl, February 2007.
729 “Fast micro and slow macro: can aggregation explain the persistence of inflation? ”by F. Altissimo, B. Mojon and P. Zaffaroni, February 2007.
730 “What drives business cycles and international trade in emerging market economies?”
731 “International trade, technological shocks and spillovers in the labour market: a GVAR analysis of the US manufacturing sector” by P. Hiebert and I. Vansteenkiste, February 2007.
February 2007.
735 “Market based compensation, price informativeness and short-term trading” by R. Calcagno and F. Heider, February 2007.
by M. Cipriani and A. Guarino, February 2007.
737 “Structural balances and revenue windfalls: the role of asset prices revisited” by R. Morris and L. Schuknecht, March 2007.
738 “Commodity prices, money and inflation” by F. Browne and D. Cronin, March 2007.
739 “Exchange rate pass-through in emerging markets” by M. Ca’ Zorzi, E. Hahn and M. Sánchez, March 2007.
728 “Price changes in Finland: some evidence from micro CPI data” by S. Kurri, February 2007.
by M. Sánchez, February 2007.
732 “Liquidity shocks and asset price boom/bust cycles” by R. Adalid and C. Detken, February 2007.
733 “Mortgage interest rate dispersion in the euro area” by C. Kok Sørensen and J.-D. Lichtenberger,
736 “Transaction costs and informational cascades in financial markets: theory and experimental evidence”
734 “Inflation risk premia in the term structure of interest rates” by P. Hördahl and O. Tristani, February 2007.

ISSN 1561081-0
9 7 7 1 5 6 1 0 8 1 0 0 5