Embed Size (px)
Citation preview
Executive compensation and deployment of corporate resources: Evidence
from working capital
Nihat Aktasa,*
, Ettore Crocib, Oguzhan Ozbas
c, and Dimitris Petmezas
d
a WHU Otto Beisheim School of Management, Germany
b Universita' Cattolica del Sacro Cuore, Italy
c University of Southern California, Marshall School of Business, USA
d Surrey Business School, University of Surrey, UK
This draft: January 5, 2016
ABSTRACT
Firms provide compensation incentives to executives, primarily in the form of bonus payments, to
alleviate slack in the deployment of corporate resources to working capital. Financially
constrained firms are heavy users of working capital incentives. So are firms that are less exposed
to external takeover threats. Among the different components of working capital, inventories and
payables are the main drivers of executive bonuses. Overall, our evidence supports the optimal
contracting view of bonus payments in executive compensation.
Keywords: Working capital; Compensation incentives; Bonus payments; Executive
compensation.
JEL Classification: G30; G31; G34.
* Corresponding author. Tel.: +49 261 6509 224.
E-mail addresses: [email protected] (Aktas), [email protected] (Croci), [email protected]
(Ozbas), [email protected] (Petmezas).
Acknowledgement
We are grateful to Stefano Bonini, Elif Sisli Ciamarra, Dudley Evan, Mara Faccio, Andrey
Golubov, Alexander Kempf, Peter Limbach, Christodoulos Louca, Garen Markarian, Nickolaos
Travlos, Ioannis Tsalavoutas, and seminar and conference participants at Bilkent University,
University of Cologne, University of Glasgow, Karlsruhe Institute of Technology, MFS
Symposium 2015 in Larnaca, Paris December 2015 Finance Meeting and FMA Annual Meeting
2015 in Orlando for helpful comments and suggestions. All remaining errors are our own.
1
“If I then look at an update on working capital, many of you know I'm a really big fan of cash. I like cash a lot.
We put a lot of focus on that this year -- in 2012 I should say. And approximately 25% of the bonus, the
financial component of the bonus was tied to working capital improvement last year. This year, we're actually
going to increase that. It's going to be about a third this year. So we're going to have equal between driving top-
line operating profit and cash. So we made some improvements here, 12 days working capital overall. The key
is to make sure we make it sustainable.” Kimberly Ross, Executive Vice President & Chief Financial Officer,
Avon Products Inc.1
“The last two years the focus has been on selective reinvestment in the business. The working capital initiative
has delivered over $100 million of cash flow to pay down that debt, to bring us down at the end of last year to
$550 million.” Cheryl Beebe, Vice President & Chief Financial Officer, Corn Products International. “The
balance sheet changed and became stronger through our working capital program that we've shared with all of
you. We tied bonuses directly to it, and it's amazing what dollars do when they come to us, if, in fact, they're
going to be things that we are focusing on. And it made a major change. […] for the last two years, for anyone
that is bonus eligible, 20% of their bonus is tied to working capital target that we have set” Sam Scott,
Chairman, President and CEO, Corn Products International.2
1. Introduction
Working capital is not only a critical factor of production but also a substantial resource
commitment for firms. In the aggregate, net working capital commitments constitute 22% of
aggregate net assets held by S&P 1500 firms as of 2012, and have averaged 28% over the period
1992-2012. Despite its importance, surprisingly little systemic evidence exists on how firms
induce disciplined deployment of resources to working capital.3 This paper fills that gap.
A long tradition in finance and economics recognizes managerial compensation as an
important internal governance tool to alleviate managerial slack (Jensen and Meckling, 1976).
Unless managers receive proper incentives that align their interests with those of shareholders,
managerial preferences for the “quiet life” may lead to avoidance of personally difficult decisions
and effort in managing resources (Hicks, 1935; Bertrand and Mullainathan, 2003). By most
practitioner accounts, disciplined working capital management is difficult (Ek and Guerin, 2011).
Eliminating excess inventory, improving collections from customers, and negotiating favorable
payment terms with suppliers require serious effort and coordination among different functional
1 Fair Disclosure Wire transcript from Consumer Analyst Group of New York Conference on February 21, 2013.
2 Fair Disclosure Wire transcript from Corn Products International Analyst Meeting on May 12, 2004.
3 One practitioner study points to $1.3 trillion worth of managerial slack in working capital management for top
2,000 companies in the U.S. and Europe (Ernst & Young, 2014 Working Capital Management Report).

2
groups in large organizations. In addition, success or failure in this context is an unlikely source
of reputational motivation for managers (Holmstrom, 1999). Markets are typically focused on
earnings rather than cash flow (Sloan, 1996), and disciplined working capital management rarely
attracts personally valuable media attention for managers (Malmendier and Tate, 2009).
Using a large sample of firms in the Standard & Poor’s (S&P) ExecuComp database with
more than 160,000 executive-year observations and linked firm-year financial data in the
Compustat database, we estimate the extent to which executive compensation exhibits sensitivity
to working capital performance. Properly adjusting for scale, we define positive working capital
performance as either a reduction in working capital from one year to the next or a low level of
working capital relative to industry peers in a given year.
Our empirical strategy follows the extant literature on executive compensation in that we
estimate sensitivity of realized compensation to realized working capital performance. Most of
our specifications are panel regressions with firm and year fixed effects. In some specifications,
we replace firm and year fixed effects with industry-year fixed effects to examine the relation
between compensation and working capital performance relative to industry peers. All of our
specifications include firm-specific control variables that are standard in the literature (see Jensen
and Murphy, 1990; Core and Guay, 1999; Bertrand and Mullainathan, 2001; and Coles, Daniel,
and Naveen, 2006, among others).
Our estimates show that firms recognize the potential for managerial slack in working
capital management, and reward top managers with bonus payments for overseeing reductions in
working capital and for operating with a low level of working capital relative to industry peers.
The associated economic effect is quite substantial. Our estimates imply that top executives
receive roughly 10 percent additional bonus pay for one standard deviation reduction in working
capital. Other components of executive pay, namely salary and equity-based pay in the form of
3
stock and options, do not exhibit economically and statistically significant sensitivity to working
capital performance. Working capital incentives appear stronger for chief executive officers
(CEOs) and chief financial officers (CFOs) than they are for other top executives, but the
estimates are not precise enough to distinguish them statistically.
Economic value added (EVA) models and cash-flow based performance measures have
become increasingly common in executive bonus plans in recent years (Murphy, 2001; Perry and
Zenner, 2001; De Angelis and Grinstein, 2015).4 The anecdotal quotes from Avon Products Inc.
and Corn Products International at the beginning suggest that some companies tie executive
bonuses to working capital performance in direct ways. Alternatively, the link can be indirect. For
instance, PepsiCo describes the use of return on invested capital (ROIC) as a performance metric
as follows: “[…] it aligns with our commitment to shareholders to improve both capital spending
and working capital management, ensuring that we continue to improve the efficiency of our
asset base” (DEF14A Proxy Statement dated March 21, 2014, p. 35).5 Our empirical approach
has the benefit of producing comprehensive estimates on the magnitude of combined direct and
indirect working capital incentives. Another benefit is that we are able to offer large sample
evidence.6
After estimating baseline regressions, we turn our attention to firm circumstances that can
influence how intensely a firm uses working capital incentives. We first analyze the relation
4 Everything else equal, working capital reductions from one period to the next are associated with increasing cash
flows, EVA, and return on invested capital (ROIC). 5 The use of working capital incentives in executive compensation is also common internationally. Safran, a leading
French multinational firm in the aerospace industry, used the following weights in its 2014 compensation plan for
determining bonus payments to its top four executives: 60% of the bonus depends on EBIT target; 10% on working
capital, and 30% on free cash flow. In a survey of Canadian CFOs in 2013, half of the respondents emphasized that
their companies focus on working capital to meet internal free cash flow targets and one third have working capital
targets in executive compensation contracts (Ernst & Young, 2013 Working Capital Optimization Report). 6 To compare our sample with previous anecdotal evidence, we read the 2012 season DEF14A proxy statements of a
random sample of 100 ExecuComp firms for qualitative evidence on working capital incentives. Both direct and
indirect types of incentives for working capital performance are fairly common. About 24% of the firms mention
working capital targets, and 49% use EVA, cash flow or return on invested capital. The proportion of firms that
mention either a direct or an indirect type of working capital incentive is 57%.
4
between firm financial constraints and use of working capital incentives. Because management
attention is a limited resource (Simon, 1955), it is natural that firms set priorities, and financially
constrained firms prioritize tasks related to financial management. While disciplined working
capital management represents an internal opportunity to reduce the need for costly external
finance for all firms, the opportunity is more valuable for financially constrained firms because
external finance is more costly for them. Consistent with this view, we find that financially
constrained firms provide their executives with stronger working capital incentives than
unconstrained firms do.
Another possible influence on the use of working capital incentives is the set of external
market forces that discipline managers. In his seminal article, Manne (1965) emphasizes the
disciplining role of the takeover market. Internal and external governance can be substitutes.
Consistent with the idea that incentive contracts are more important when managers face less
external pressure, we find that managers receive stronger working capital incentives when their
firms are less exposed to takeover threats. That is, firms rely more on internal incentive contracts
to provide discipline when external pressures from the takeover market that reduce managerial
slack are weaker.
In a final analysis, we estimate the sensitivity of executive bonuses to separate
components of working capital, namely payables, receivables, and inventories. We find that
inventories drive the bonus-performance relation. While coefficient estimates on payables and
receivables have the expected signs, they are not significant at conventional levels in panel
specifications with firm and year fixed effects. In specifications with industry-year fixed effects,
which focus on working capital performance relative to industry peers, we find that both payables
and inventories are important drivers of bonus pay.

5
Our work contributes to several strands of literature in corporate finance. First, we
contribute to the literature on bonus pay in executive compensation. The literature predominantly
studies equity-based pay at the cost of ignoring bonuses that are often linked tightly to decisions
made by managers. Changes in managerial wealth due to changes in bonus compensation may
well pale in comparison to changes in managerial wealth due to changes in the value of stock and
options holdings. But a central problem is that stock prices are affected by a host of factors other
than managerial decisions. Bonuses can efficiently guide managerial behavior if they can be tied
to accounting performance metrics such as working capital ratios, which managers know with
high precision how their actions will affect (Murphy and Jensen, 2011).
Second, our work is related to studies on financial constraints (Fazzari, Hubbard, and
Petersen, 1988) that build on the idea of costly external finance (Stiglitz and Weiss, 1981; Myers
and Majluf, 1984). Working capital has long been recognized as both an important and a liquid
stock of internal capital (Smith, 1776; Dewing, 1941), which in principle firms can tap to avoid
external frictions. Indeed, financially constrained firms have been shown to reverse working
capital to smooth investment in physical capital (Fazzari and Petersen, 1993) and to build up cash
holdings in a precautionary manner (Almeida, Campello, and Weisbach, 2004). We deepen this
literature with our focus on incentives. Our results highlight how managerial incentives likely are
set differently depending on firm financial constraints with impact on both real and financial
outcomes. Financially constrained firms rely more on managerial incentives in order to keep their
working capital at a low level relative to industry peers, consistent with those firms having more
to gain from generating internal funds to avoid costly external finance.
Third, our work is related to the literature on working capital and inventory management.
Several studies report a substantial decrease in working capital through time (Bates, Kahle, and
6
Stulz, 2009; Aktas, Croci, and Petmezas, 2015).7 While all components of working capital have
decreased substantially, inventory is the component that has decreased the most, in particular
following the systematic adoption of Just-in-Time processes by firms (Chen, Frank, and Wu,
2005; Dasgupta, Li, and Yan, 2014). The evidence in our paper adds to this literature by
emphasizing the role of managerial compensation as a tool used by firms to control
overinvestment in working capital generally and inventories specifically.
Finally, our work contributes to the important debate on whether executive compensation
plans are designed to mitigate the agency problem associated with the separation of ownership
and control at large corporations or they are shaped to a large extent by managerial power, a form
of the agency problem itself (Bebchuk and Fried, 2003). Our evidence, particularly on financial
constraints and external takeover pressures, uniformly supports the optimal contracting view.
With respect to bonus pay, our paper provides a contrast to Grinstein and Hribar (2004) who
show that bonuses fail to induce good M&A decisions and that those payments rather reflect
managerial power and rent-seeking.
The rest of the paper proceeds as follows. Section 2 describes our sample, data sources
and empirical strategy. Section 3 presents our main results. We first provide evidence on the use
of working capital incentives. We then investigate the influence of firm financial constraints and
external takeover pressures. Finally, we consider different components of working capital as
separate drivers of executive bonuses. Section 4 provides additional robustness checks. Section 5
concludes.
7 According to Bates, Kahle, and Stulz (2009), disinvestment in working capital through time is an important driver
of the increase in cash holdings of U.S. firms over the last three decades. See also Gao (2014) for a similar finding on
inventories.
7
2. Data and empirical strategy
2.1. Sample and data sources
Our sample consists of firms in the Standard & Poor’s (S&P) ExecuComp database from
1992 to 2012. ExecuComp provides annual executive compensation data from DEF14A proxy
statements for firms in the S&P 1500. Following previous research, we exclude regulated utilities
and financial firms. We obtain stock price and return data from the Center for Research in
Security Prices (CRSP) and financial statement data from S&P Compustat.
We consider all executives in ExecuComp, but some of our analyses focus on subsamples
of CEOs, CFOs, and other executives. To identify the executive type, we use identification flags
and the annual title field in ExecuComp. For CEOs, a CEO flag is available for the entire period.
However, there are some cases for which the CEO flag is missing, in particular at the beginning
of the sample period. For cases with a missing CEO flag (about 10% of firm-year observations),
we assign the role of CEO to the executive with the highest total compensation, as it is common
in the literature.
For CFOs, the CFO flag is populated after 2006. Before 2006, we conduct a text search
for “CFO,” “finance,” and “financial” in the annual title string to identify CFOs. Following
Chava and Purnanandam (2010), we also include in the CFO sample executives with “controller”
and “treasurer” in the title string. In case an executive is identified as both CFO and CEO of a
firm in a given year, we place that executive in the CEO sample to avoid overlap between the
CEO and CFO samples.8 In case our procedure identifies more than one CFO for a firm in a given
year, we retain only the CFO with the highest total pay in the CFO sample. Our final sample
includes 2,533 unique firms and 31,539 unique executives. The number of unique CEOs and
CFOs are 5,671 and 5,199, respectively.
8 In total, there are 54 cases in which an executive is identified as both CFO and CEO.
8
2.2. Empirical strategy
Our empirical strategy relies on ex-post observed levels of compensation and working
capital performance. Specifically, we estimate the sensitivity of different components of realized
compensation to realized working capital performance. Importantly, we do not build our
empirical strategy on information provided in annual proxy statements about ex-ante incentive
plans because such information is provided ex post in practice and firms have discretion in
labeling some compensation as performance-based even if it is awarded regardless of
performance (see Grinstein and Hribar, 2004, for a similar point regarding M&A bonuses).
Our specifications are designed to provide estimates of compensation incentives for
improving working capital performance as well as for maintaining working capital performance
that is already good relative to industry peers. For the incentive to improve performance, we
estimate specifications of the form:
𝑌𝑖𝑗𝑡 = 𝛼𝑗 + 𝛼𝑡 + 𝛽 × 𝑁𝑊𝐶𝑗𝑡 + γ × 𝑋𝑗𝑡 + 𝜀𝑖𝑗𝑡 (1)
where the dependent variable is compensation that executive 𝑖 receives from firm 𝑗 for year 𝑡. 𝛼𝑗
and 𝛼𝑡 are firm and year fixed effects, respectively. Year fixed effects absorb aggregate trends in
compensation. Firm fixed effects help isolate changes and allow us to estimate the sensitivity of
compensation to changes in working capital. Firm fixed effects also mitigate concerns about
omitted variable biases due to time-invariant firm-level unobservable factors. 𝑁𝑊𝐶𝑗𝑡 is net
working capital of firm 𝑗 in year 𝑡. We use net working capital (inventories plus receivables
minus payables) because shareholders care about net resource commitments to working capital.
We scale net working capital by sales as it is standard, and further adjust for the median net
working capital ratio in the industry (following 49 Fama-French industry definitions) to allow for
time-varying industry effects in the setting of working capital targets for managers. The
9
regression coefficient 𝛽 measures the strength of compensation incentives for improving working
capital performance. A negative 𝛽 coefficient indicates that firms reward managers for working
capital reductions.9
We control for time-varying firm characteristics and various other
performance measures 𝑋𝑗𝑡 described below. 𝜀𝑖𝑗𝑡 is an error term. We report robust standard errors
that are heteroskedasticity-consistent and clustered at the firm level.
For the incentive to maintain good performance, we replace firm and year fixed effects
with industry-year fixed effects. Specifically, we estimate regressions of the form:
𝑌𝑖𝑗𝑡 = 𝛼𝑘𝑡 + 𝛽 × 𝑁𝑊𝐶𝑗𝑡 + γ × 𝑋𝑗𝑡 + 𝜀𝑖𝑗𝑡 (2)
where 𝛼𝑘𝑡 are industry-year fixed effects. A negative 𝛽 coefficient in this specification indicates
that firms reward managers for operating with a lower level of working capital than industry
peers facing similar market conditions.
Following the extant literature on executive compensation (see Jensen and Murphy, 1990;
Core and Guay, 1999; Bertrand and Mullainathan, 2001; and Coles, Daniel, and Naveen, 2006,
among others), we employ a large set of firm characteristics and performance measures as control
variables: Firm size, the book value of total assets in natural logarithm form; Sales growth, the
growth rate of firm sales from previous year; ROA, operating income before depreciation, divided
by total assets; ROA growth, the growth rate in ROA from previous year; Stock return, annual
stock return; Margin, operating income before depreciation, divided by sales; and Margin growth,
the growth rate in margin from previous year; Institutional ownership, percentage of shares
owned by institutions; Book leverage, total debt divided by total assets; Firm risk, standard
deviation of daily stock returns; Loss, indicator variable for negative earnings; Acquisition,
9 The test is necessarily a joint test of (i) the existence of compensation incentives for working capital performance,
and (ii) the ability of executives to perform to a certain level to receive incentive pay. Therefore, an insignificant 𝛽
estimate does not necessarily imply that firms do not provide compensation incentives for working capital
performance. Another possibility is that firms offer such compensation incentives, but executives are unable to
perform well enough to receive them.
10
indicator variable for a significant acquisition. As the dependent variable, we consider different
components of compensation, namely salary, cash bonus,10
and equity-based pay in the form of
stock and options. We use the natural logarithm transform to estimate the performance elasticity
of compensation.11
Detailed variable definitions are in Appendix.
2.3. Summary statistics
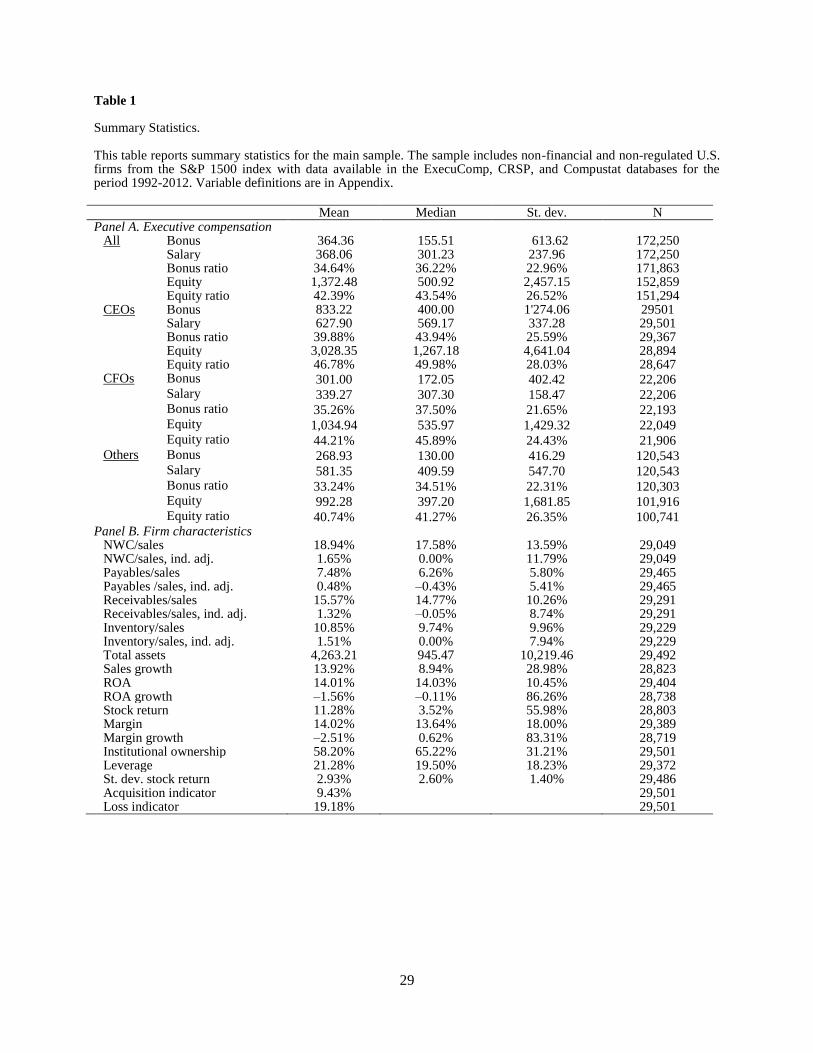
Table 1 reports summary statistics on executive compensation in Panel A. The average
bonus is about $364,360 in our sample of 172,250 executive-year observations. For a given year,
the bonus represents on average 34.64% of an executive’s total cash compensation (bonus plus
salary). Equity-based pay (sum of restricted stock and option grants) is the largest component of
executive compensation with an average value of about $1,372,480 and an average share of
42.39% in total compensation. The average CEO bonus is roughly triple the average CFO bonus.
However, the fraction of bonus in total cash compensation is comparable between CEOs and
CFOs. For all executive types, the median bonus is substantially lower than the average,
indicating a positively skewed distribution.
10 The reporting of annual cash bonuses in Annual Proxy statements changed in 2006. Amendments to the required
disclosure of executive compensation added a new category, non-equity incentive plan compensation, to the
Summary Compensation Table of the Annual Proxy statements for fiscal years ending after December 15, 2006. This
new category (NONEQ_INCENT) includes both short-term (annual) and multiyear incentive plans awarded in cash
tied to specific pre-established accounting performance. Cash incentives that are not specifically linked to specific
pre-established performance-based incentives, continue to be reported in the annual bonus category (BONUS). For
fiscal years ending before December 15, 2006, the item BONUS in ExecuComp is the payout from annual cash
incentive plans. For the pre-2006 period, another relevant item is long-term incentive plans (LTIP), which is the
payout from multi-year incentive plans. These plans did not include restricted stock or stock options, but they did
include payouts from “performance share” plans. So, our measure of cash bonus is the sum of the following three
ExecuComp items: BONUS, NONEQ_INCENT, and LTIP. Fernandes, Ferreira, Matos, and Murphy (2013) also
include all non-equity incentives in the bonus definition. We also re-run the analysis performed in the empirical
sections using Execucomp’s BONUS and BONUS plus NONEQ_INCENT. Results are remarkably similar to those
presented in the paper. They are available upon request from the authors. 11
We measure equity-based pay as total compensation minus salary and bonus. Total compensation includes salary,
bonus, value of stock option grants, value of restricted stock grants, long-term incentive payouts, and other annual
compensation. We obtain similar results with a more direct measure of equity-based pay defined as grant-date value
of stock and options awards, but the sample size is considerably smaller due to missing data.
11
Summary statistics on firm-level variables are reported in Panel B. On average, the ratio
of net working capital to sales is 18.94%. Adjusting for industry peers, the average net working
capital ratio is 1.65%. Among the three net working capital components, receivables are the most
important component with an average value of 15.57% relative to sales, followed by inventories
and payables, with an average value of 10.85% and 7.48% relative to sales, respectively. Firms in
our sample are profitable with an average and median ROA of 14.01% and 14.03%, respectively,
though the percentage of firm-year observations with negative earnings at 19.18% is not
negligible. Institutions are significant owners at 58.20%. On average, 9.43% of sample firms
undertake at least one significant M&A deal in a given year.
2.4. Financial constraints and external takeover pressures
To shed light on whether working capital incentives are used more or less intensely as
predicted by the optimal contracting view, we condition the sensitivity of executive compensation
to working capital performance on firm financial constraints and external takeover pressures that
managers face.
The literature offers many different measures of firm financial constraints. We use three
measures: the Whited-Wu (WW) index (Whited and Wu, 2006), the size-age (SA) index
(Hadlock and Pierce, 2010), and the absence of credit ratings (Faulkender and Petersen (2006)).
To test whether the sensitivity of compensation to working capital performance depends on firm
financial constraints, we interact the NWC variable in Equations (1)-(2) with the financial
constraints variables. For the continuous index variables, we also use an indicator variable
version that equals one if the corresponding index value is above the sample median in that year
and zero otherwise. With credit ratings, a firm is considered to be financially constrained in a
given year if the firm has debt outstanding and no credit rating information in Compustat for that
12
year. Firms with a D or SD rating (i.e., default) are removed from the sample, while unrated firms
with no debt outstanding are considered to be unconstrained (see, e.g., Denis and Sibilkov (2010)
for a similar definition).
To assess whether the sensitivity of compensation to working capital performance
depends on external takeover pressures, we use the takeover susceptibility index developed by
Cain, McKeon, and Solomon (2015). To construct the index, the authors start by modeling the
likelihood of being the target of a hostile takeover. They then use the estimated model to
construct a firm-level takeover threat index. For a firm in a given year, the index measures the
likelihood that the firm will be targeted through hostile means. We use both the continuous index
and an indicator variable version that equals one if the index value is above the sample median in
that year and zero otherwise.
3. Sensitivity of executive compensation to working capital performance
3.1. Baseline estimates
We begin our analysis by estimating working capital incentives for the whole sample. We
consider all three components of executive compensation, namely bonus, salary and equity-based
pay in the form of stock and options, to provide a comprehensive array of estimates.
As described in Section 2.2, the model coefficient 𝛽 in Equations (1)-(2) provides an
estimate of working capital incentives while controlling for a large set of time-varying firm
characteristics and performance measures. Recall that with firm and year fixed effects in
Equation (1), a negative 𝛽 coefficient indicates that firms reward managers for working capital
reductions whereas with industry-year fixed effects in Equation (2), a negative 𝛽 coefficient
indicates that firms reward managers for operating with a lower level of working capital than
industry peers facing similar market conditions.

13
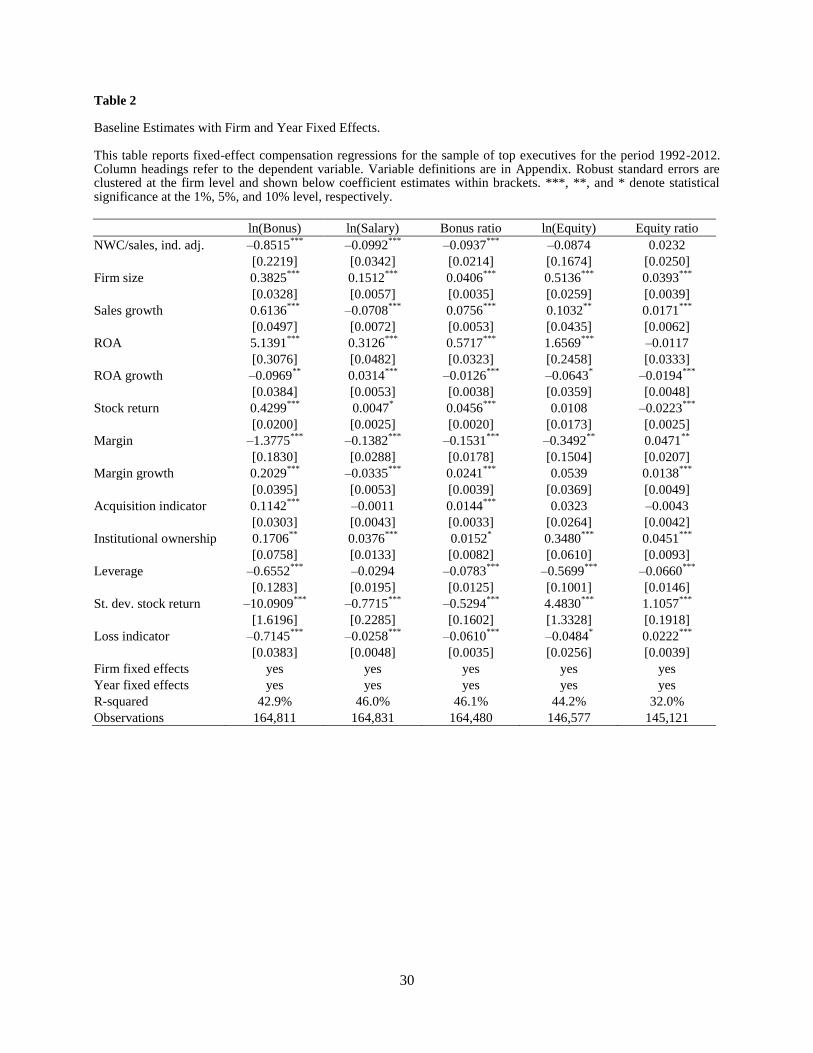
Table 2 reports estimates for Equation (1). In column 1, bonus pay in natural logarithm
form is the dependent compensation variable.12
The coefficient estimate on industry-adjusted net
working capital to sales ratio is negative (–0.8515) and statistically significant at the 1% level.
The estimate implies that executives receive about 10 percent greater bonus pay for a one
standard deviation reduction in industry-adjusted net working capital to sales ratio. By
comparison, executives receive about 34 percent greater bonus pay for a one standard deviation
increase in ROA.
Next, we consider salary and equity-based pay in natural logarithm form in columns 2 and
4, respectively. Contrary to our finding for bonus pay, we find little sensitivity of salary pay to
changes in working capital – the coefficient estimate (–0.0992) is statistically significant at the
1% level, but the absolute magnitude is small relative to that for bonus pay. Interestingly, we find
no statistically reliable sensitivity of equity-based pay to changes in working capital.
For robustness, we also consider the fraction of bonus pay in total cash compensation
(bonus and salary) and the fraction of equity-based pay in total compensation (bonus, salary, and
stock and options) in columns 3 and 5, respectively. The results again show that firms provide
working capital incentives primarily in the form of short-term bonus payments, and not in salary
and equity-based pay.
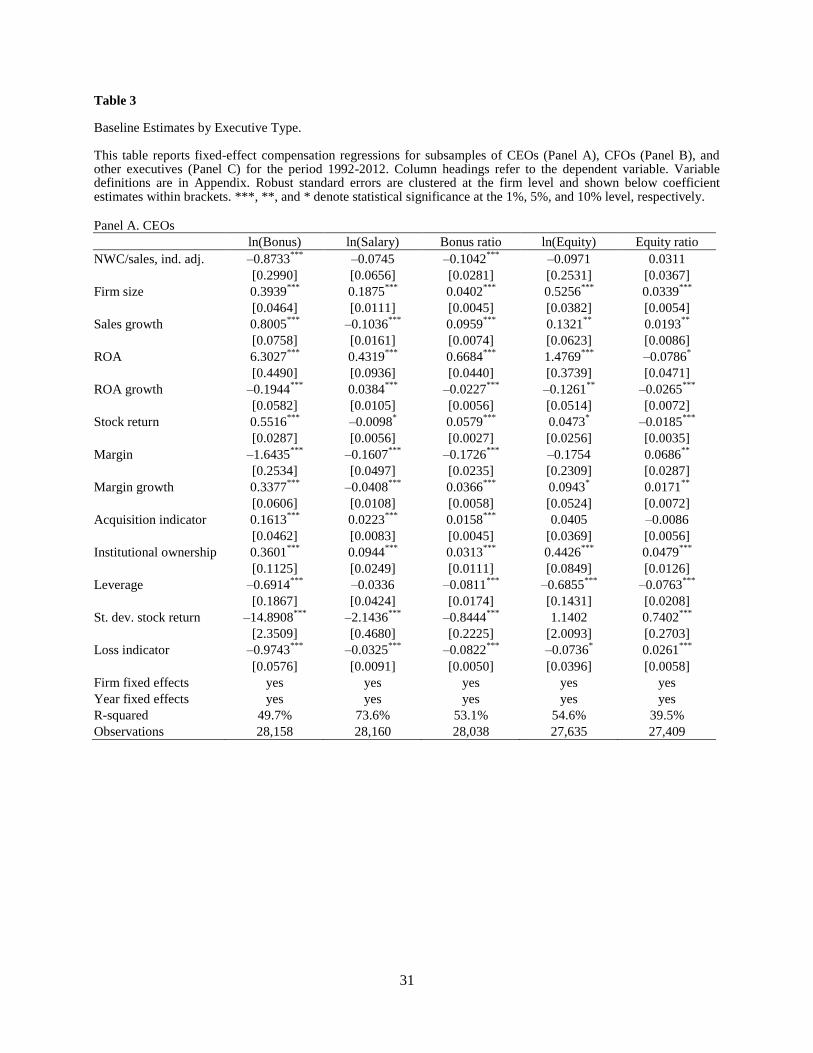
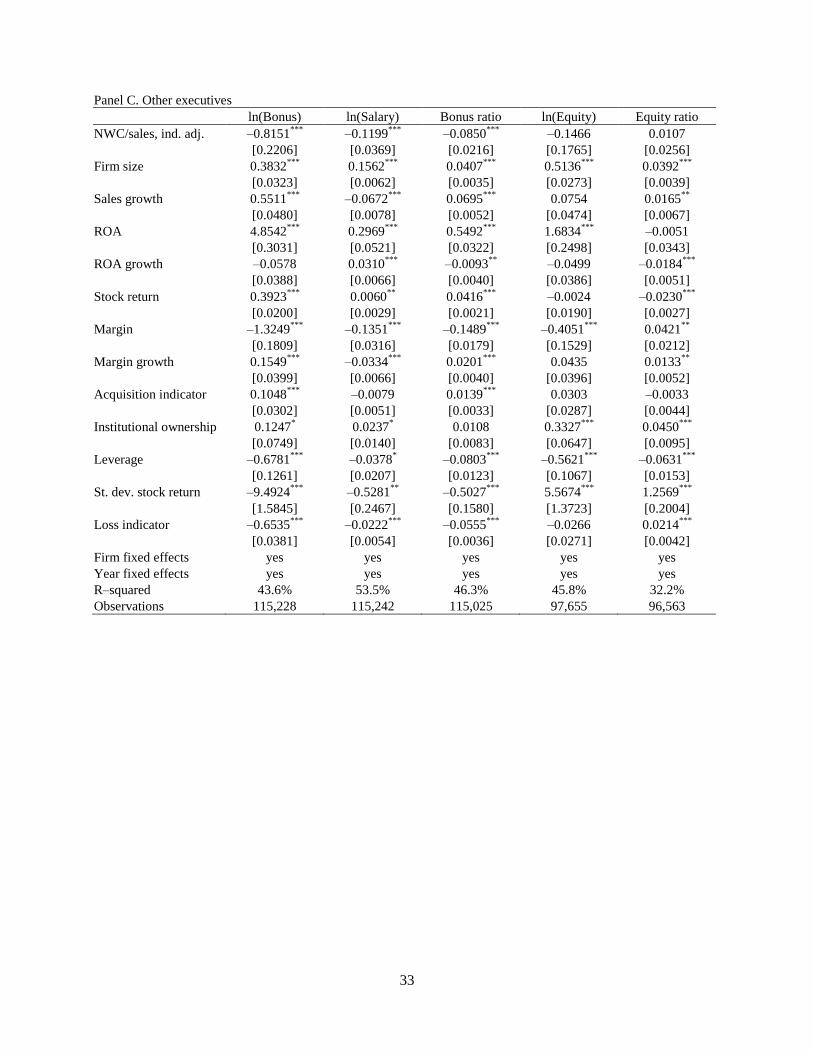
Because many practitioner accounts portray management responsibility for strategic and
financial performance of working capital as resting with CEOs and CFOs, respectively, we split
the sample by executive type in Table 3. Panel A presents regression estimates for CEOs, Panel B
for CFOs, and Panel C for other executives. In all three panels for bonus pay, coefficient
estimates on industry-adjusted net working capital to sales ratio are negative and statistically
12
Because there are cases in which bonus is zero, we add one unit of compensation, i.e. $1,000, before computing the
natural logarithm as it is commonly done in the literature. We treat salary and equity-based pay similarly. We obtain
qualitatively similar results without the log transformation.
14
significant at the 1% level. Working capital incentives for CFOs (–0.9432) appear slightly
stronger than those for CEOs (–0.8733) and other executives (–0.8151), but the estimates are not
precise enough to be statistically distinguished from each other. For CEOs and CFOs, only the
bonus component of compensation exhibits pay for working capital performance. The small
sensitivity of salary pay to working capital reductions (column 2 in Table 2) appears confined to
executives other than CEOs and CFOs.
For the most part, the literature studies CEO compensation. Our coefficient estimates for
control variables in Panel A of Table 3 for CEOs are largely consistent with previously reported
estimates (see, e.g., Jensen and Murphy, 1990; Core and Guay, 1999; Bertrand and Mullainathan,
2001; and Coles, Daniel, and Naveen, 2006). We find that firm size, sales growth, ROA, stock
return, acquisition activity (Grinstein and Hribar, 2004) and institutional ownership (Hartzell and
Starks, 2003) are positively associated with CEO compensation. We also find that book leverage
is negatively associated with both short-term (bonus) and long-term (equity) compensation. An
interesting result in Table 3 is that executive bonuses for completing M&A transactions are larger
for CEOs than they are for CFOs and other executives.13
CEOs receive about 16 percent greater
bonus pay after significant M&A transactions – compared to 10 percent for CFOs and other
executives – consistent with the importance of CEO incentives in large M&A transactions
compared to lower ranked executives. However, the estimates cannot be statistically
distinguished from each other at conventional levels.
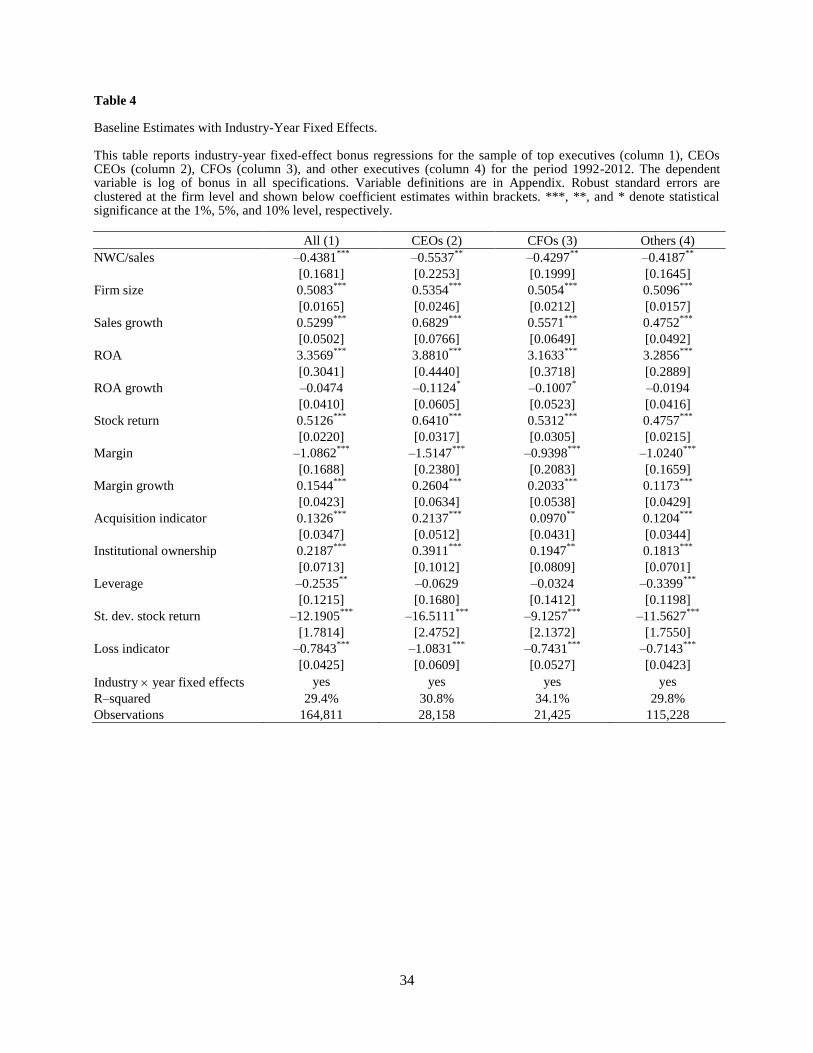
In addition to compensation incentives for working capital reductions, firms can also
reward managers for operating with lower working capital than industry peers as modeled in
Equation (2). Table 4 reports those estimates. Column 1 reports results for all executives, column
2 for CEOs, column 3 for CFOs, and column 4 for the remaining top executives. We report
13
Our results are unaffected if we increase the threshold in deal size from $100 million to $1 billion used by
Grinstein and Hribar (2004).

15
results for bonus pay only because other components of executive compensation show little
sensitivity to working capital performance in Equation (2).
In column 1, the coefficient estimate on the net working capital to sales ratio for all
executives is negative (–0.4381) and statistically significant at the 1 percent level. The estimate
implies that executives receive about 6 percent greater bonus pay for operating with a one
standard deviation lower level of working capital than industry peers facing similar market
conditions. The estimates in columns 2, 3, and 4 by executive type are economically similar and
statistically significant at conventional levels.
3.2. Financial constraints and external takeover pressures
Our results thus far show that firms recognize the potential for managerial slack in
working capital management, and provide compensation incentives in the form of short-term
bonus payments to address the potential problem. We now turn our attention to firm
circumstances that can determine the intensity with which firms use working capital incentives.
For brevity, we report results for the sample of all executives and for bonus pay only.
3.2.1. Financial constraints
Working capital is an important internal source of funds for financially constrained firms
facing high costs of external finance. Fazzari and Petersen (1993) show that financially
constrained firms reverse working capital to smooth fixed investment. Almeida, Campello, and
Weisbach (2004) show that financially constrained firms have a tendency to add to precautionary
cash holdings from working capital.
Disciplined working capital management to make such benefits possible is hard, however;
not least because firms have priorities other than financial matters vying for limited management
attention (Simon, 1955). Relatively speaking then, financially constrained firms would be

16
expected to give more priority to financial management and put more emphasis on working
capital management because they face higher costs of external finance. As a result, the use of
working capital incentives would be related to the degree of firm financial constraints.
We test this idea in Table 5. We report results using three different proxies for firm
financial constraints: the WW index in columns 1 and 2, the SA index in columns 3 and 4, and
the absence of a credit rating in column 5. For the two indices, columns 1 and 3 use the raw
index, while in columns 2 and 4 we use an indicator variable version that equals one if the
corresponding index value is above the sample median in that year and zero otherwise. In column
5, the financial constraints indicator variable equals one if a firm with debt outstanding does not
have a credit rating in that year, and zero otherwise. Panel A reports regressions with firm and
year fixed effects, and Panel B reports regressions with industry-year fixed effects. All
specifications include the same set of control variables as in Table 2, but they are not reported for
brevity. The main coefficient estimate of interest is the interaction term between the net working
capital to sales ratio and the financial constraints variable. Given the baseline negative coefficient
estimate on the net working capital to sales ratio, a negative interaction term would indicate a
greater use of working capital incentives by more financially constrained firms.
In Panel A, coefficient estimates for the interaction term have the expected negative sign
in columns 1 through 5, indicating a greater use of working capital incentives by more financially
constrained firms. Due to relatively large standard errors, however, none of the interaction terms
are statistically significant at conventional levels.
In Panel B, the interaction term is negative and statistically significant at conventional
levels in all columns. The economic magnitude is also significant. Executives at financially
constrained firms receive about 9 percent to 12 percent greater bonus pay for operating with a one
standard deviation lower level of working capital than industry peers facing similar market
17
conditions – roughly double the magnitude of working capital incentives for the whole sample of
firms reported in Table 4.
3.2.2. External takeover pressures
Managerial behavior is shaped and disciplined by governance forces, both internal and
external to the firm. The external takeover market has long been recognized as an important
source of discipline over managers (Manne, 1965). Faced with a strong enough takeover threat,
an executive may not need significant compensation incentives to manage corporate resources
prudently on behalf of shareholders.
We build on this notion of substitution between internal and external governance, and
examine whether firms use sharper internal incentives when managers face less external pressure
and enjoy greater slack. In our setting of working capital management, we test whether firms rely
more on internal incentive contracts to provide discipline when external pressures that limit
managerial slack through the takeover market are weaker.
Cain, McKeon, and Solomon (2015) examine the determinants of hostile takeover activity
and develop a takeover susceptibility index. We use their measure to examine the effect of
takeover threats on the sensitivity of executive bonus pay to working capital performance.
Table 6 reports the results in a way similar to Table 5. Panel A reports regressions with
firm and year fixed effects, and Panel B reports regressions with industry-year fixed effects.
While all specifications include the same set of control variables as in Table 2, we do not report
them for brevity. The main coefficient estimate of interest is the interaction term between the net
working capital to sales ratio and the takeover susceptibility index. Given the baseline negative
coefficient on the net working capital to sales, a positive interaction term would indicate
substitution between internal compensation incentives and external takeover threats. Column 1
18
reports on the continuous takeover susceptibility index, while in column 2 we use an indicator
variable that equals one if the index value is above the sample median in that year and zero
otherwise.
In Panel A with firm and year fixed effects, the interaction term is positive in both
columns 1 and 2, which is consistent with substitution between internal compensation incentives
and external takeover threats. But the coefficient estimate is not statistically significant at
conventional levels in both columns.
In Panel B with industry-year fixed effects, the interaction term is positive and statistically
significant in both columns. Managers receive less compensation incentives for operating with a
lower level of working capital than industry peers when they face more external takeover
pressures, consistent with substitution between internal compensation incentives and external
takeover threats.
3.3. Working capital components and industry effects
Firms in our sample provide significant compensation incentives to their executives in the
form of bonus pay for working capital performance. We now examine the sensitivity of executive
bonuses to separate components of working capital, namely payables, receivables, and
inventories. In practice, managers can improve working capital performance by eliminating
excess inventories, improving collections from customers, and/or negotiating favorable payment
terms with suppliers. While it appears that for top executives, compensation incentives are set
generally at the aggregate level of working capital and not at the level of individual components,
19
managers might prefer or be forced to achieve their working capital targets through
improvements in only a subset of the components.14
To assess the relative importance of different working capital components, we repeat our
baseline analysis by breaking down net working capital into components and present the results
in Table 7. Panel A reports regressions with firm and year fixed effects, and Panel B reports
regressions with industry-year fixed effects. All specifications include the same set of control
variables as in Table 2, but they are not reported for brevity. The variables of interest are
industry-adjusted payables, receivables, and inventories scaled by sales.
In column 1 of Panel A, the coefficient estimates for all three components of working
capital have the expected sign; positive for payables, and negative for receivables and inventories.
However, only the coefficient estimate for inventories is statistically significant. In terms of
economic magnitudes, our main finding of working capital incentives appears to be driven
entirely by inventories. The significant role played by inventories is also consistent with the
literature – among the different components of net working capital, inventories have decreased
the most through time (Chen, Frank, and Wu, 2005; Aktas, Croci, and Petmezas, 2015).
For the average firm, without any particular market power over customers and suppliers,
improvements in payables and/or receivables may be difficult to implement without negatively
affecting firm performance (Hill, Kelly, and Highfield, 2010). For example, customers who are
unhappy with aggressive collection policies may switch to alternative suppliers. In contrast,
inventory management is an area that executives can work on to improve the efficiency of the
14
Our analysis of a random sample of 100 ExecuComp firms for year 2012 indicate that 24% of the firms use direct
incentives for working capital improvement, while 7% of the firms mention the use of inventory performance metrics
(only 2% use both working capital and inventory targets).
20
firm’s internal operations (Chen, Frank, and Wu, 2005).15
We therefore repeat the analysis in
column 2 by further decomposing inventories into raw-materials, work-in-process and finished-
goods inventories. The effect is strong for all the three components of inventories.
In Panel B of Table 7, we replace firm and year fixed effects with industry-year fixed
effects. The results in column 1 indicate that among the three components of working capital,
payables and inventories are the most important drivers of executive bonuses. Firms with high
levels of payables and low levels of inventories pay greater bonuses than industry peers facing
similar market conditions. In column 2, we further decompose inventories into its components.
We find that raw materials and finished good inventories are in particular the main driver of
executive bonuses.
We also examine differences in working capital incentives across industries by interacting
industry-adjusted net working capital to sales ratio with industry indicator variables in a bonus
regression including firm and year fixed effects. We present the results in Table 8. Out of the 44
industries, 27 industries display a negative sensitivity of bonus to changes in working capital, and
for 13 industries the coefficient estimate is statistically significant at conventional levels.
In addition, we estimate a bonus regression with the three working capital components
interacted with industry indicator variables in Table 9. For brevity, the table reports only those
industry coefficient estimates with an absolute t-statistic greater than 1.20. Bonus is significantly
and negatively related to receivables in six industries whereas it is significantly and positively
related to payables in five industries. For inventories, 17 industries have a significantly negative
coefficient estimate, the largest number among the three components of working capital.
Interestingly, some of those industries are known as heavy adopters of Just-in-Time (JIT)
15
The two other components of inventories are raw-materials and finished-goods inventories. In comparison to work-
in-process, raw-materials and finished-goods require more interactions with other firms, and therefore depending on
the context and industry structure, executives might have less flexibility to reduce them through time.
21
inventory systems (Gao, 2014).16
Although it is difficult to establish clear causality, our findings
suggest an important role for compensation incentives in driving JIT adoption.
4. Additional results and robustness checks
This section presents additional tests to assess the robustness of our findings. Table 10
reports the results. Each panel in Table 10 corresponds to a specific alteration made to our
baseline specification in column 1 of Tables 2 and 3. For brevity, we do not report coefficient
estimates of the control variables from the baseline model.
Companies provide both direct and indirect working capital incentives to their executives.
An example of an indirect working capital incentive would be a link between bonus pay and
return on assets (ROA). Improvements in ROA from one year to the next may come from
improvements in earnings as well as increased efficiency in asset use. Everything else equal,
reductions in net working capital would increase ROA. However, our baseline model includes
ROA as a control variable. To restrict changes in ROA to non-working capital sources, we use
total assets minus net working capital instead of total assets as the scaling variable to compute
ROA, ROA growth, and leverage. Panel A reports the result. With the scaling variable redefined,
estimated working capital incentives are stronger than those in column 1 of Tables 2 and 3,
suggesting that our estimates are generally conservative.
In estimating the sensitivity of bonus pay to working capital performance in our main
analysis, we scale net working capital by sales. However, sales can be another performance
measure for executives. To control for sales as a separate performance measure, we add the ratio
1/sales to the specification. Panel B reports the results. The impact on our main coefficient
estimate of interest for the net working capital to sales ratio is minimal.
16
According to Gao (2014), 70% of JIT adopters are from four industries: industrial equipment (SIC code 35),
electronic equipment (SIC code 36), motor vehicle (SIC code 37), and instrumentation (SIC code 38).
22
Our baseline models control for time-invariant firm characteristics. We repeat our main
analysis with executive fixed effects (there are over 30,000 executives in our sample) instead of
firm fixed effects. Panel C reports the results. The results are qualitatively the same as in our
baseline specifications, indicating that omitted executive time-invariant characteristics do not
affect our main results.
As a final robustness check, we estimate an augmented regression model with additional
control variables known to be correlated with net working capital. Their omission from our
baseline specifications could raise concerns about missing factors correlated with the main
independent variable. Following Hill, Kelly, and Highfield (2010), we use as additional control
variables sales volatility and an indicator variable for financial distress. Damodaran (2012) argues
that mature firms require less working capital per unit of sales, so we also add firm age as an
additional control variable. In a recent paper, Cheng, Harford, Hutton, and Shipe (2014) show
that managers receive greater bonuses for higher cash reserves, so we also include cash reserves
as an additional control variable in our specifications. Panel D reports the results. Our results are
robust to the inclusion of these additional control variables.
5. Conclusion
Firms commit substantial resources to net working capital, on average amounting to 28%
of aggregate net assets held by S&P 1500 firms over the period 1992-2012. In this paper, we
study whether and to what extent firms provide compensation incentives to alleviate managerial
slack in the deployment of such significant corporate resources to working capital.
Using data from ExecuComp, we estimate the sensitivity of different components of
executive pay to working capital performance. We find that short-term bonus payments exhibit
significant sensitivity whereas salary and equity-based pay show little or no sensitivity to
23
working capital performance. Among the components of working capital, inventories and
payables are the ones that contribute the most to executive bonuses.
We then study conditions under which firms may adjust working capital incentives.
Financially constrained firms provide strong incentives to their executives to keep working
capital at a low level relative to industry peers, a result which is consistent with large benefits
from disciplined working capital management for such firms. Also consistent with the optimal
contracting view, firms that are less exposed to external takeover threats provide their executives
with stronger working capital incentives.
Our results establish an important role for short-term bonus payments in executive
compensation. Rewards based on performance metrics such as net working capital, which
managers know with high precision how their actions will affect, may guide managerial behavior
more efficiently than rewards based solely on stock prices.
References
Aktas, N., Croci, E., Petmezas, D., 2015. Is working capital management value-enhancing?
Evidence from firm performance and investments. Journal of Corporate Finance 30, 98-113.
Almeida, H., Campello, M., Weisbach, M. S., 2004. The cash flow sensitivity of cash. Journal of
Finance 59, 1777-1804.
Bates, T. W., Kahle, K. M., Stulz, R. M., 2009. Why do U.S. firms hold so much more cash than
they used to? Journal of Finance 64, 1985-2022.
Bebchuk, L., Fried, J. M., 2003. Executive compensation as an agency problem. Journal of
Economic Perspectives 17, 71-92.
Bertrand, M., Mullainathan, S., 2001. Are CEOs rewarded for luck? The ones without principals
are. Quarterly Journal of Economics 116, 901-932.
Bertrand, M., Mullainathan, S., 2003. Enjoying the quiet life? Corporate governance and
managerial preferences. Journal of Political Economy 111, 1043-1075.
24
Cain, M. D., McKeon, S. B., Solomon, S. D., 2015. Do takeover laws matter? Evidence from five
decades of hostile takeovers. Unpublished working paper, University of Oregon.
Chava, S., Purnanandam, A., 2010. CEOs versus CFOs: Incentives and corporate policies.
Journal of Financial Economics 97, 263-278.
Chen, H., Frank, M. Z., Wu, O. Q., 2005. What actually happened to the inventories of American
companies between 1981-2000? Management Science 51, 1015-1031.
Cheng, Y., Harford, J., Hutton, I., Shipe, S., 2014. The compensation benefits of corporate cash
holdings. Unpublished working paper, University of Washington.
Coles, J. L., Daniel, N. D., Naveen, L., 2006. Managerial incentives and risk-taking. Journal of
Financial Economics 79, 431-468.
Core, J., Guay, W., 1999. The use of equity grants to manage optimal equity incentive levels.
Journal of Accounting and Economics 28, 151-184.
Damodaran, A., 2012. Investment Valuation: Tools and Techniques for Determining the Value of
any Asset. Wiley Finance, 3rd Edition.
Dasgupta, S., Li, E. X. N., Yan, D., 2014. Inventory behavior and financial constraints: Theory
and evidence. Unpublished working paper, Hong Kong University of Science and Technology.
De Angelis, D., Grinstein, Y., 2015. Performance terms in CEO compensation contracts. Review
of Finance 19, 619-651.
Denis, D.J., Sibilkov, V., 2010. Financial constraints, investment, and the value of cash holdings.
Review of Financial Studies 23, 247–269.
Dewing, A. S., 1941. The financial policy of corporations. The Ronald Press Company.
Ek, R., Guerin, S., 2011. Is there a right level of working capital? Journal of Corporate Treasury
Management 4, 137-149.
Faulkender, M., Petersen, M. A., 2006. Does the source of capital affect capital structure? Review
of Financial Studies 19, 45-79.
Fazzari, S. M., Hubbard, R. G., Petersen, B. C., 1988. Financing Constraints and Corporate
Investment. Brookings Papers on Economic Activity 1, 141-195.
Fazzari, S. M., Petersen, B. C., 1993. Working capital and fixed investment: New evidence on
financing constraints. RAND Journal of Economics 24, 328-342.
Fernandes, N., Ferreira, M. A., Matos, P. P., Murphy, K. J., 2013. Are US CEOs paid more? New
international evidence. Review of Financial Studies 26, 323-367.
25
Gao, X., 2014. Corporate cash hoarding: The role of just-in-time adoption. Unpublished working
paper, NUS (National University of Singapore) Business School.
Grinstein, Y., Hribar, P., 2004. CEO compensation and incentives: Evidence from M&A bonuses.
Journal of Financial Economics 73, 119-143.
Hadlock, C. J., Pierce, J. R., 2010. New evidence on measuring financial constraints: Moving
beyond the KZ index. Review of Financial Studies 23, 1909-1940.
Hartzell, J. C., Starks, L. T., 2003. Institutional investors and executive compensation. Journal of
Finance 58, 2351-2374.
Hicks, J. R., 1935. Annual survey of economic theory: the theory of monopoly. Econometrica 3,
1-20.
Hill, M. D., Kelly, G. W., Highfield, M. J., 2010. Net operating working capital behavior: A first
look. Financial Management 39, 783-805.
Holmstrom, B., 1999. Managerial incentive problems: A dynamic perspective. Review of
Economic Studies 66, 169-182.
Jensen, M. C., Meckling, W. H., 1976. Theory of the firm: Managerial behavior, agency costs and
ownership structure. Journal of Financial Economics 3, 305-360.
Jensen, M. C., Murphy, K. J., 1990. Performance pay and top-management incentives. Journal of
Political Economy 98, 225-264.
Malmendier, U., Tate, G., 2009. Superstar CEOs. Quarterly Journal of Economics 124, 1593-
1638.
Manne, H. G., 1965. Mergers and the market for corporate control. Journal of Political Economy
73, 110-120.
Murphy, K. J., 2001. Performance standards in incentive contracts. Journal of Accounting and
Economics 30, 245-278.
Murphy, K. J., Jensen, M. C., 2011. CEO bonus plans: And how to fix them. Unpublished
working paper, University of Southern California.
Myers, S. C., Majluf, N. S., 1984. Corporate financing and investment decisions when firms have
information that investors do not have. Journal of Financial Economics 13, 187-221.
Perry, T., Zenner, M., 2001. Pay for performance? Government regulation and the structure of
compensation contracts. Journal of Financial Economics 62, 453-488.
26
Simon, H. A., 1955. A behavioral model of rational choice. Quarterly Journal of Economics 69,
99-118.
Sloan, R. G., 1996. Do stock prices fully reflect information in accruals and cash flows about
future earnings? Accounting Review 71, 289-315.
Smith, A., 1776. An inquiry into the nature and causes of the wealth of nations. University of
Chicago Press.
Stiglitz, J. E., Weiss, A., 1981. Credit rationing in markets with imperfect information. American
Economic Review 71, 393-410.
Whited, T., Wu, G., 2006. Financial constraints risk. Review of Financial Studies 19, 531-559.
27
Appendix. Variable definitions
All names in capital letters refer to either Compustat or ExecuComp item names.
A.1. Compensation variables
Bonus: Cash bonus compensation earned by the executive during the fiscal year in thousands of
dollars. It is the sum of the following three ExecuComp items: BONUS,
NONEQ_INCENT, and LTIP. For fiscal years ending before December 15, 2006,
BONUS is the payout from annual cash incentive plans and LTIP is the payout from
multi-year incentive plans. For fiscal years ending after December 15, 2006, BONUS is
the discretionary cash bonus and NONEQ_INCENT includes both short-term (annual)
and multiyear incentive plans tied to accounting performance. As a dependent variable, a
unit of compensation, i.e. $1,000, is added before computing the natural logarithm.
Salary: Cash salary (SALARY) compensation earned by the executive during the fiscal year in
thousands of dollars. As a dependent variable, a unit of compensation, i.e. $1,000, is
added before computing the natural logarithm.
Bonus ratio: Ratio of Bonus to sum of Salary and Bonus.
Equity: Total compensation (TDC1) minus Salary and Bonus. As a dependent variable, a unit of
compensation, i.e. $1,000, is added before computing the natural logarithm.
Equity ratio: Ratio of Equity to total compensation (TDC1), which includes salary, bonus, value
of stock option grants, value of restricted stock grants, long-term incentive payouts, and
other annual compensation.
A.2. Firm characteristics
NWC: Net working capital, computed as inventories (INVT) plus receivables (RECT) minus
accounts payable (AP).
NWC/sales: NWC divided by sales (SALE).
NWC/sales, ind. adj.: NWC/sales minus the median NWC/sales in the industry. Industry
definitions follow the Fama-French 49-industry classification.
Firm size: Total assets (AT). Regressions use the natural logarithm of the variable.
Sales growth: Annual growth rate in sales (SALE).
ROA: Operating income before depreciation (OIBDP) divided by total assets (AT).
ROA growth: Annual growth rate in ROA.
Stock return: Annual stock return from CRSP.
Margin: Operating income before depreciation (OIBDP) divided by sales (SALE).
Margin growth: Annual growth rate in Margin.
Acquisition: Indicator variable equal to one if the firm has completed at least one significant
acquisition, defined as deal size over US$ 100 million and relative deal size over 1%,
during the year and zero otherwise. The sample of acquisitions is restricted to control
transactions in which the acquirer’s ownership in the target firm before the deal is below
50% and over 90% after the deal. There are no restrictions on the nationality of the target
or its public/private status. The sample is from Thomson Reuters SDC database.
Institutional ownership: Fraction of firm’s equity owned by institutional investors based on
Thomson Reuters Institutional Holdings database.

28
Leverage: Total long-term debt (DLTT) and debt in current liabilities (DLC) divided by total
assets (AT).
St. dev. stock returns: Standard deviation of daily stock returns.
Loss: Indicator variable equal one if net income (NI) is negative and zero otherwise.
Sales volatility: Following Hill, Kelly, and Highfield (2010), sales volatility for a firm in a given
year is the standard deviation of the firm’s annual sales over the previous five years. To
produce an estimate, it is sufficient that the firm has at least three observations during the
previous five-year period.
Age: Number of years since first trading date on CRSP. The regression uses the log transform.
Financial distress: Indicator variable following Hill, Kelly, and Highfield (2010). A firm is in
financial distress if two criteria are met: (1) the firm faces difficulty to cover its interest
expenses and (2) it is overleveraged. The firm faces difficulty to cover its interest
expenses if its interest coverage ratio (operating income before depreciation divided by
interest expense) is below one for two consecutive years or less than 0.80 in any given
year. The firm is considered overleveraged in a given year if it is in the top two deciles of
industry leverage in that year.
Cash reserves: Cash and cash equivalent (CHE), scaled by total assets.
A.3. Financial constraints measures
WW index
The Whited-Wu financial constraints index, following Equation (13) in Whited and Wu (2006):
–0.091 CF – 0.062 DIVPOS + 0.021 TLTD – 0.044 LNTA + 0.102 ISG – 0.035 SG,
where CF is the ratio of cash flow to total assets; DIVPOS is an indicator variable for dividend
paying status; TLTD is the ratio of the long-term debt to total assets; LNTA is the natural log of
total assets; ISG is the firm’s three-digit industry sales growth; and SG is firm sales growth. In
our specifications, we use either the continuous index or an indicator variable version that equals
one if the WW index value is above the sample median in that year and zero otherwise.
SA index
The size-age index of Hadlock and Pierce (2010):
–0.737 Size + 0.043 Size2 – 0.040 Age,
where Size is the log of inflation adjusted (to 2004) book assets, and Age is the number of years
the firm has been on Compustat with a non-missing stock price. Size is replaced with log ($4.5
billion) and Age with 37 years if the actual values exceed these thresholds. In our specifications,
we use either the continuous index or an indicator variable version that equals one if the SA index
value is above the sample median in that year and zero otherwise.
Credit rating
With credit ratings, a firm is considered to be financially constrained in a given year if the firm
has debt outstanding and no credit rating information in Compustat for that year. The rating
information which is available in Compustat is the S&P long-term senior debt rating. Unrated
firms with no debt outstanding are considered to be unconstrained.
29
Table 1 Summary Statistics. This table reports summary statistics for the main sample. The sample includes non-financial and non-regulated U.S. firms from the S&P 1500 index with data available in the ExecuComp, CRSP, and Compustat databases for the period 1992-2012. Variable definitions are in Appendix. Mean Median St. dev. N Panel A. Executive compensation
All Bonus 364.36 155.51 613.62 172,250 Salary 368.06 301.23 237.96 172,250 Bonus ratio 34.64% 36.22% 22.96% 171,863 Equity 1,372.48 500.92 2,457.15 152,859 Equity ratio 42.39% 43.54% 26.52% 151,294
CEOs Bonus 833.22 400.00 1'274.06 29501 Salary 627.90 569.17 337.28 29,501 Bonus ratio 39.88% 43.94% 25.59% 29,367 Equity 3,028.35 1,267.18 4,641.04 28,894 Equity ratio 46.78% 49.98% 28.03% 28,647 CFOs Bonus 301.00 172.05 402.42 22,206 Salary 339.27 307.30 158.47 22,206 Bonus ratio 35.26% 37.50% 21.65% 22,193 Equity 1,034.94 535.97 1,429.32 22,049 Equity ratio 44.21% 45.89% 24.43% 21,906 Others Bonus 268.93 130.00 416.29 120,543
Salary 581.35 409.59 547.70 120,543 Bonus ratio 33.24% 34.51% 22.31% 120,303 Equity 992.28 397.20 1,681.85 101,916 Equity ratio 40.74% 41.27% 26.35% 100,741 Panel B. Firm characteristics
NWC/sales 18.94% 17.58% 13.59% 29,049 NWC/sales, ind. adj. 1.65% 0.00% 11.79% 29,049 Payables/sales 7.48% 6.26% 5.80% 29,465 Payables /sales, ind. adj. 0.48% –0.43% 5.41% 29,465 Receivables/sales 15.57% 14.77% 10.26% 29,291 Receivables/sales, ind. adj. 1.32% –0.05% 8.74% 29,291 Inventory/sales 10.85% 9.74% 9.96% 29,229 Inventory/sales, ind. adj. 1.51% 0.00% 7.94% 29,229 Total assets 4,263.21 945.47 10,219.46 29,492 Sales growth 13.92% 8.94% 28.98% 28,823 ROA 14.01% 14.03% 10.45% 29,404 ROA growth –1.56% –0.11% 86.26% 28,738 Stock return 11.28% 3.52% 55.98% 28,803 Margin 14.02% 13.64% 18.00% 29,389 Margin growth –2.51% 0.62% 83.31% 28,719 Institutional ownership 58.20% 65.22% 31.21% 29,501 Leverage 21.28% 19.50% 18.23% 29,372 St. dev. stock return 2.93% 2.60% 1.40% 29,486 Acquisition indicator 9.43% 29,501 Loss indicator 19.18% 29,501
30
Table 2 Baseline Estimates with Firm and Year Fixed Effects. This table reports fixed-effect compensation regressions for the sample of top executives for the period 1992-2012. Column headings refer to the dependent variable. Variable definitions are in Appendix. Robust standard errors are clustered at the firm level and shown below coefficient estimates within brackets. ***, **, and * denote statistical significance at the 1%, 5%, and 10% level, respectively.
ln(Bonus) ln(Salary) Bonus ratio ln(Equity) Equity ratio
NWC/sales, ind. adj. –0.8515***
–0.0992***
–0.0937***
–0.0874 0.0232
[0.2219] [0.0342] [0.0214] [0.1674] [0.0250]
Firm size 0.3825***
0.1512***
0.0406***
0.5136***
0.0393***
[0.0328] [0.0057] [0.0035] [0.0259] [0.0039]
Sales growth 0.6136***
–0.0708***
0.0756***
0.1032**
0.0171***
[0.0497] [0.0072] [0.0053] [0.0435] [0.0062]
ROA 5.1391***
0.3126***
0.5717***
1.6569***
–0.0117
[0.3076] [0.0482] [0.0323] [0.2458] [0.0333]
ROA growth –0.0969**
0.0314***
–0.0126***
–0.0643* –0.0194
***
[0.0384] [0.0053] [0.0038] [0.0359] [0.0048]
Stock return 0.4299***
0.0047* 0.0456
*** 0.0108 –0.0223
***
[0.0200] [0.0025] [0.0020] [0.0173] [0.0025]
Margin –1.3775***
–0.1382***
–0.1531***
–0.3492**
0.0471**
[0.1830] [0.0288] [0.0178] [0.1504] [0.0207]
Margin growth 0.2029***
–0.0335***
0.0241***
0.0539 0.0138***
[0.0395] [0.0053] [0.0039] [0.0369] [0.0049]
Acquisition indicator 0.1142***
–0.0011 0.0144***
0.0323 –0.0043
[0.0303] [0.0043] [0.0033] [0.0264] [0.0042]
Institutional ownership 0.1706**
0.0376***
0.0152* 0.3480
*** 0.0451
***
[0.0758] [0.0133] [0.0082] [0.0610] [0.0093]
Leverage –0.6552***
–0.0294 –0.0783***
–0.5699***
–0.0660***
[0.1283] [0.0195] [0.0125] [0.1001] [0.0146]
St. dev. stock return –10.0909***
–0.7715***
–0.5294***
4.4830***
1.1057***
[1.6196] [0.2285] [0.1602] [1.3328] [0.1918]
Loss indicator –0.7145***
–0.0258***
–0.0610***
–0.0484* 0.0222
***
[0.0383] [0.0048] [0.0035] [0.0256] [0.0039]
Firm fixed effects yes yes yes yes yes
Year fixed effects yes yes yes yes yes
R-squared 42.9% 46.0% 46.1% 44.2% 32.0%
Observations 164,811 164,831 164,480 146,577 145,121
31
Table 3 Baseline Estimates by Executive Type. This table reports fixed-effect compensation regressions for subsamples of CEOs (Panel A), CFOs (Panel B), and other executives (Panel C) for the period 1992-2012. Column headings refer to the dependent variable. Variable definitions are in Appendix. Robust standard errors are clustered at the firm level and shown below coefficient estimates within brackets. ***, **, and * denote statistical significance at the 1%, 5%, and 10% level, respectively. Panel A. CEOs
ln(Bonus) ln(Salary) Bonus ratio ln(Equity) Equity ratio
NWC/sales, ind. adj. –0.8733***
–0.0745 –0.1042***
–0.0971 0.0311
[0.2990] [0.0656] [0.0281] [0.2531] [0.0367]
Firm size 0.3939***
0.1875***
0.0402***
0.5256***
0.0339***
[0.0464] [0.0111] [0.0045] [0.0382] [0.0054]
Sales growth 0.8005***
–0.1036***
0.0959***
0.1321**
0.0193**
[0.0758] [0.0161] [0.0074] [0.0623] [0.0086]
ROA 6.3027***
0.4319***
0.6684***
1.4769***
–0.0786*
[0.4490] [0.0936] [0.0440] [0.3739] [0.0471]
ROA growth –0.1944***
0.0384***
–0.0227***
–0.1261**
–0.0265***
[0.0582] [0.0105] [0.0056] [0.0514] [0.0072]
Stock return 0.5516***
–0.0098* 0.0579
*** 0.0473
* –0.0185
***
[0.0287] [0.0056] [0.0027] [0.0256] [0.0035]
Margin –1.6435***
–0.1607***
–0.1726***
–0.1754 0.0686**
[0.2534] [0.0497] [0.0235] [0.2309] [0.0287]
Margin growth 0.3377***
–0.0408***
0.0366***
0.0943* 0.0171
**
[0.0606] [0.0108] [0.0058] [0.0524] [0.0072]
Acquisition indicator 0.1613***
0.0223***
0.0158***
0.0405 –0.0086
[0.0462] [0.0083] [0.0045] [0.0369] [0.0056]
Institutional ownership 0.3601***
0.0944***
0.0313***
0.4426***
0.0479***
[0.1125] [0.0249] [0.0111] [0.0849] [0.0126]
Leverage –0.6914***
–0.0336 –0.0811***
–0.6855***
–0.0763***
[0.1867] [0.0424] [0.0174] [0.1431] [0.0208]
St. dev. stock return –14.8908***
–2.1436***
–0.8444***
1.1402 0.7402***
[2.3509] [0.4680] [0.2225] [2.0093] [0.2703]
Loss indicator –0.9743***
–0.0325***
–0.0822***
–0.0736* 0.0261
***
[0.0576] [0.0091] [0.0050] [0.0396] [0.0058]
Firm fixed effects yes yes yes yes yes
Year fixed effects yes yes yes yes yes
R-squared 49.7% 73.6% 53.1% 54.6% 39.5%
Observations 28,158 28,160 28,038 27,635 27,409

32
Panel B. CFOs
ln(Bonus) ln(Salary) Bonus ratio ln(Equity) Equity ratio
NWC/sales, ind. adj. –0.9432***
–0.0282 –0.1243***
0.2401 0.0749**
[0.3262] [0.0415] [0.0305] [0.2181] [0.0363]
Firm size 0.4109***
0.1429***
0.0448***
0.5269***
0.0474***
[0.0454] [0.0072] [0.0048] [0.0340] [0.0054]
Sales growth 0.6707***
–0.0785***
0.0790***
0.1549***
0.0153*
[0.0709] [0.0092] [0.0074] [0.0580] [0.0087]
ROA 5.2361***
0.2477***
0.5745***
1.7577***
0.0365
[0.4236] [0.0574] [0.0427] [0.3429] [0.0475]
ROA growth –0.1567***
0.0258***
–0.0145***
–0.0434 –0.0145**
[0.0548] [0.0072] [0.0051] [0.0480] [0.0071]
Stock return 0.4556***
–0.0028 0.0500***
0.0116 –0.0246***
[0.0280] [0.0034] [0.0028] [0.0244] [0.0037]
Margin –1.3411***
–0.1428***
–0.1540***
–0.3841 0.0396
[0.2797] [0.0349] [0.0257] [0.2476] [0.0338]
Margin growth 0.2665***
–0.0259***
0.0269***
0.0418 0.0116
[0.0557] [0.0073] [0.0052] [0.0488] [0.0072]
Acquisition indicator 0.1039**
–0.0005 0.0151***
0.0292 –0.0045
[0.0406] [0.0061] [0.0043] [0.0334] [0.0055]
Institutional ownership 0.1613 0.0167 0.0187* 0.2607
*** 0.0346
***
[0.0984] [0.0175] [0.0107] [0.0795] [0.0131]
Leverage –0.4802***
0.0108 –0.0664***
–0.4414***
–0.0671***
[0.1745] [0.0255] [0.0172] [0.1310] [0.0195]
St. dev. stock return –7.2925***
–0.2048 –0.331 3.9320**
0.8725***
[2.1168] [0.3042] [0.2014] [1.6486] [0.2541]
Loss indicator –0.6685***
–0.0038 –0.0588***
–0.056 0.0255***
[0.0516] [0.0066] [0.0047] [0.0366] [0.0059]
Firm fixed effects yes yes yes yes yes
Year fixed effects yes yes yes yes yes
R-squared 51.1% 79.4% 54.8% 55.3% 41.4%
Observations 21,425 21,429 21,417 21,287 21,149
33
Panel C. Other executives
ln(Bonus) ln(Salary) Bonus ratio ln(Equity) Equity ratio
NWC/sales, ind. adj. –0.8151***
–0.1199***
–0.0850***
–0.1466 0.0107
[0.2206] [0.0369] [0.0216] [0.1765] [0.0256]
Firm size 0.3832***
0.1562***
0.0407***
0.5136***
0.0392***
[0.0323] [0.0062] [0.0035] [0.0273] [0.0039]
Sales growth 0.5511***
–0.0672***
0.0695***
0.0754 0.0165**
[0.0480] [0.0078] [0.0052] [0.0474] [0.0067]
ROA 4.8542***
0.2969***
0.5492***
1.6834***
–0.0051
[0.3031] [0.0521] [0.0322] [0.2498] [0.0343]
ROA growth –0.0578 0.0310***
–0.0093**
–0.0499 –0.0184***
[0.0388] [0.0066] [0.0040] [0.0386] [0.0051]
Stock return 0.3923***
0.0060**
0.0416***
–0.0024 –0.0230***
[0.0200] [0.0029] [0.0021] [0.0190] [0.0027]
Margin –1.3249***
–0.1351***
–0.1489***
–0.4051***
0.0421**
[0.1809] [0.0316] [0.0179] [0.1529] [0.0212]
Margin growth 0.1549***
–0.0334***
0.0201***
0.0435 0.0133**
[0.0399] [0.0066] [0.0040] [0.0396] [0.0052]
Acquisition indicator 0.1048***
–0.0079 0.0139***
0.0303 –0.0033
[0.0302] [0.0051] [0.0033] [0.0287] [0.0044]
Institutional ownership 0.1247* 0.0237
* 0.0108 0.3327
*** 0.0450
***
[0.0749] [0.0140] [0.0083] [0.0647] [0.0095]
Leverage –0.6781***
–0.0378* –0.0803
*** –0.5621
*** –0.0631
***
[0.1261] [0.0207] [0.0123] [0.1067] [0.0153]
St. dev. stock return –9.4924***
–0.5281**
–0.5027***
5.5674***
1.2569***
[1.5845] [0.2467] [0.1580] [1.3723] [0.2004]
Loss indicator –0.6535***
–0.0222***
–0.0555***
–0.0266 0.0214***
[0.0381] [0.0054] [0.0036] [0.0271] [0.0042]
Firm fixed effects yes yes yes yes yes
Year fixed effects yes yes yes yes yes
R–squared 43.6% 53.5% 46.3% 45.8% 32.2%
Observations 115,228 115,242 115,025 97,655 96,563
34
Table 4 Baseline Estimates with Industry-Year Fixed Effects. This table reports industry-year fixed-effect bonus regressions for the sample of top executives (column 1), CEOs CEOs (column 2), CFOs (column 3), and other executives (column 4) for the period 1992-2012. The dependent variable is log of bonus in all specifications. Variable definitions are in Appendix. Robust standard errors are clustered at the firm level and shown below coefficient estimates within brackets. ***, **, and * denote statistical significance at the 1%, 5%, and 10% level, respectively.
All (1) CEOs (2) CFOs (3) Others (4)
NWC/sales –0.4381***
–0.5537**
–0.4297**
–0.4187**
[0.1681] [0.2253] [0.1999] [0.1645]
Firm size 0.5083***
0.5354***
0.5054***
0.5096***
[0.0165] [0.0246] [0.0212] [0.0157]
Sales growth 0.5299***
0.6829***
0.5571***
0.4752***
[0.0502] [0.0766] [0.0649] [0.0492]
ROA 3.3569***
3.8810***
3.1633***
3.2856***
[0.3041] [0.4440] [0.3718] [0.2889]
ROA growth –0.0474 –0.1124* –0.1007
* –0.0194
[0.0410] [0.0605] [0.0523] [0.0416]
Stock return 0.5126***
0.6410***
0.5312***
0.4757***
[0.0220] [0.0317] [0.0305] [0.0215]
Margin –1.0862***
–1.5147***
–0.9398***
–1.0240***
[0.1688] [0.2380] [0.2083] [0.1659]
Margin growth 0.1544***
0.2604***
0.2033***
0.1173***
[0.0423] [0.0634] [0.0538] [0.0429]
Acquisition indicator 0.1326***
0.2137***
0.0970**
0.1204***
[0.0347] [0.0512] [0.0431] [0.0344]
Institutional ownership 0.2187***
0.3911***
0.1947**
0.1813***
[0.0713] [0.1012] [0.0809] [0.0701]
Leverage –0.2535**
–0.0629 –0.0324 –0.3399***
[0.1215] [0.1680] [0.1412] [0.1198]
St. dev. stock return –12.1905***
–16.5111***
–9.1257***
–11.5627***
[1.7814] [2.4752] [2.1372] [1.7550]
Loss indicator –0.7843***
–1.0831***
–0.7431***
–0.7143***
[0.0425] [0.0609] [0.0527] [0.0423]
Industry year fixed effects yes yes yes yes
R–squared 29.4% 30.8% 34.1% 29.8%
Observations 164,811 28,158 21,425 115,228
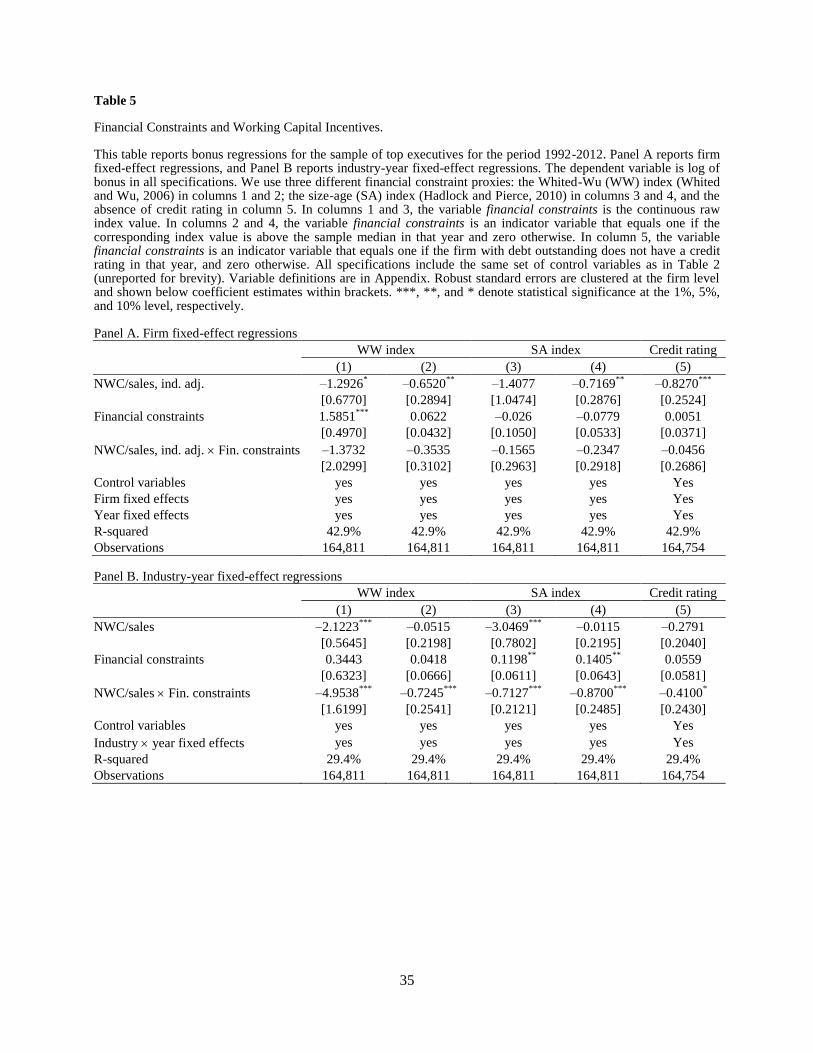
35
Table 5
Financial Constraints and Working Capital Incentives.
This table reports bonus regressions for the sample of top executives for the period 1992-2012. Panel A reports firm fixed-effect regressions, and Panel B reports industry-year fixed-effect regressions. The dependent variable is log of bonus in all specifications. We use three different financial constraint proxies: the Whited-Wu (WW) index (Whited and Wu, 2006) in columns 1 and 2; the size-age (SA) index (Hadlock and Pierce, 2010) in columns 3 and 4, and the absence of credit rating in column 5. In columns 1 and 3, the variable financial constraints is the continuous raw index value. In columns 2 and 4, the variable financial constraints is an indicator variable that equals one if the corresponding index value is above the sample median in that year and zero otherwise. In column 5, the variable financial constraints is an indicator variable that equals one if the firm with debt outstanding does not have a credit rating in that year, and zero otherwise. All specifications include the same set of control variables as in Table 2 (unreported for brevity). Variable definitions are in Appendix. Robust standard errors are clustered at the firm level and shown below coefficient estimates within brackets. ***, **, and * denote statistical significance at the 1%, 5%, and 10% level, respectively. Panel A. Firm fixed-effect regressions
WW index SA index Credit rating
(1) (2) (3) (4) (5)
NWC/sales, ind. adj. –1.2926* –0.6520
** –1.4077 –0.7169
** –0.8270
***
[0.6770] [0.2894] [1.0474] [0.2876] [0.2524]
Financial constraints 1.5851***
0.0622 –0.026 –0.0779 0.0051
[0.4970] [0.0432] [0.1050] [0.0533] [0.0371]
NWC/sales, ind. adj. Fin. constraints –1.3732 –0.3535 –0.1565 –0.2347 –0.0456
[2.0299] [0.3102] [0.2963] [0.2918] [0.2686]
Control variables yes yes yes yes Yes
Firm fixed effects yes yes yes yes Yes
Year fixed effects yes yes yes yes Yes
R-squared 42.9% 42.9% 42.9% 42.9% 42.9%
Observations 164,811 164,811 164,811 164,811 164,754 Panel B. Industry-year fixed-effect regressions
WW index SA index Credit rating
(1) (2) (3) (4) (5)
NWC/sales –2.1223***
–0.0515 –3.0469***
–0.0115 –0.2791
[0.5645] [0.2198] [0.7802] [0.2195] [0.2040]
Financial constraints 0.3443 0.0418 0.1198**
0.1405**
0.0559
[0.6323] [0.0666] [0.0611] [0.0643] [0.0581]
NWC/sales Fin. constraints –4.9538***
–0.7245***
–0.7127***
–0.8700***
–0.4100*
[1.6199] [0.2541] [0.2121] [0.2485] [0.2430]
Control variables yes yes yes yes Yes
Industry year fixed effects yes yes yes yes Yes
R-squared 29.4% 29.4% 29.4% 29.4% 29.4%
Observations 164,811 164,811 164,811 164,811 164,754
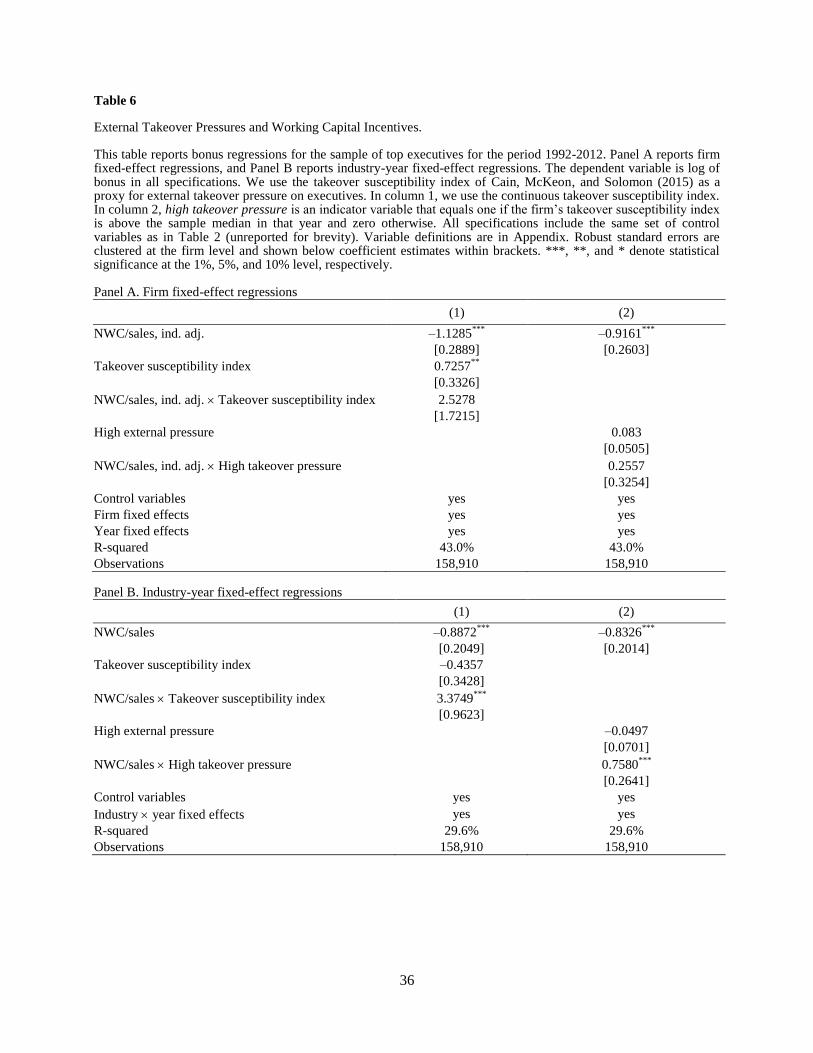
36
Table 6
External Takeover Pressures and Working Capital Incentives.
This table reports bonus regressions for the sample of top executives for the period 1992-2012. Panel A reports firm fixed-effect regressions, and Panel B reports industry-year fixed-effect regressions. The dependent variable is log of bonus in all specifications. We use the takeover susceptibility index of Cain, McKeon, and Solomon (2015) as a proxy for external takeover pressure on executives. In column 1, we use the continuous takeover susceptibility index. In column 2, high takeover pressure is an indicator variable that equals one if the firm’s takeover susceptibility index is above the sample median in that year and zero otherwise. All specifications include the same set of control variables as in Table 2 (unreported for brevity). Variable definitions are in Appendix. Robust standard errors are clustered at the firm level and shown below coefficient estimates within brackets. ***, **, and * denote statistical significance at the 1%, 5%, and 10% level, respectively. Panel A. Firm fixed-effect regressions
(1) (2)
NWC/sales, ind. adj. –1.1285***
–0.9161***
[0.2889] [0.2603]
Takeover susceptibility index 0.7257**
[0.3326]
NWC/sales, ind. adj. Takeover susceptibility index 2.5278
[1.7215]
High external pressure 0.083
[0.0505]
NWC/sales, ind. adj. High takeover pressure 0.2557
[0.3254]
Control variables yes yes
Firm fixed effects yes yes
Year fixed effects yes yes
R-squared 43.0% 43.0%
Observations 158,910 158,910 Panel B. Industry-year fixed-effect regressions
(1) (2)
NWC/sales –0.8872***
–0.8326***
[0.2049] [0.2014]
Takeover susceptibility index –0.4357
[0.3428]
NWC/sales Takeover susceptibility index 3.3749***
[0.9623]
High external pressure –0.0497
[0.0701]
NWC/sales High takeover pressure 0.7580***
[0.2641]
Control variables yes yes
Industry year fixed effects yes yes
R-squared 29.6% 29.6%
Observations 158,910 158,910
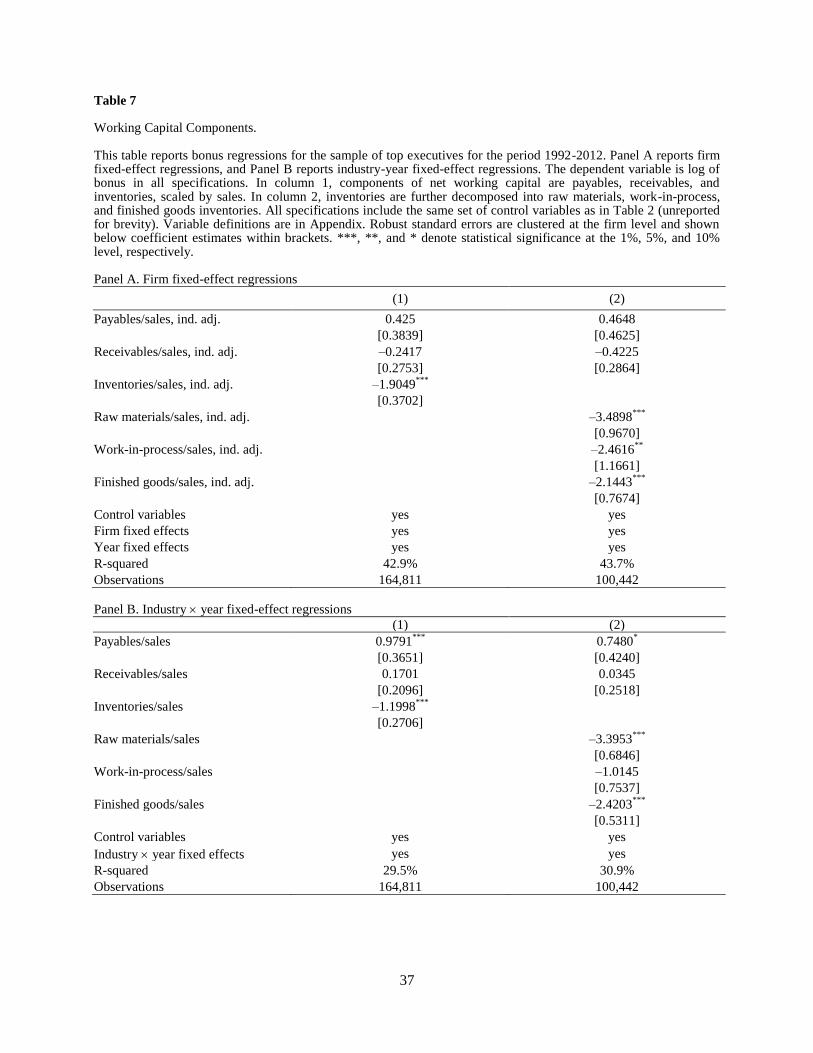
37
Table 7 Working Capital Components. This table reports bonus regressions for the sample of top executives for the period 1992-2012. Panel A reports firm fixed-effect regressions, and Panel B reports industry-year fixed-effect regressions. The dependent variable is log of bonus in all specifications. In column 1, components of net working capital are payables, receivables, and inventories, scaled by sales. In column 2, inventories are further decomposed into raw materials, work-in-process, and finished goods inventories. All specifications include the same set of control variables as in Table 2 (unreported for brevity). Variable definitions are in Appendix. Robust standard errors are clustered at the firm level and shown below coefficient estimates within brackets. ***, **, and * denote statistical significance at the 1%, 5%, and 10% level, respectively. Panel A. Firm fixed-effect regressions
(1) (2)
Payables/sales, ind. adj. 0.425 0.4648
[0.3839] [0.4625]
Receivables/sales, ind. adj. –0.2417 –0.4225
[0.2753] [0.2864]
Inventories/sales, ind. adj. –1.9049***
[0.3702]
Raw materials/sales, ind. adj. –3.4898***
[0.9670]
Work-in-process/sales, ind. adj. –2.4616**
[1.1661]
Finished goods/sales, ind. adj. –2.1443***
[0.7674]
Control variables yes yes
Firm fixed effects yes yes
Year fixed effects yes yes
R-squared 42.9% 43.7%
Observations 164,811 100,442 Panel B. Industry year fixed-effect regressions
(1) (2)
Payables/sales 0.9791***
0.7480*
[0.3651] [0.4240]
Receivables/sales 0.1701 0.0345
[0.2096] [0.2518]
Inventories/sales –1.1998***
[0.2706]
Raw materials/sales –3.3953***
[0.6846]
Work-in-process/sales –1.0145
[0.7537]
Finished goods/sales –2.4203***
[0.5311]
Control variables yes yes
Industry year fixed effects yes yes
R-squared 29.5% 30.9%
Observations 164,811 100,442
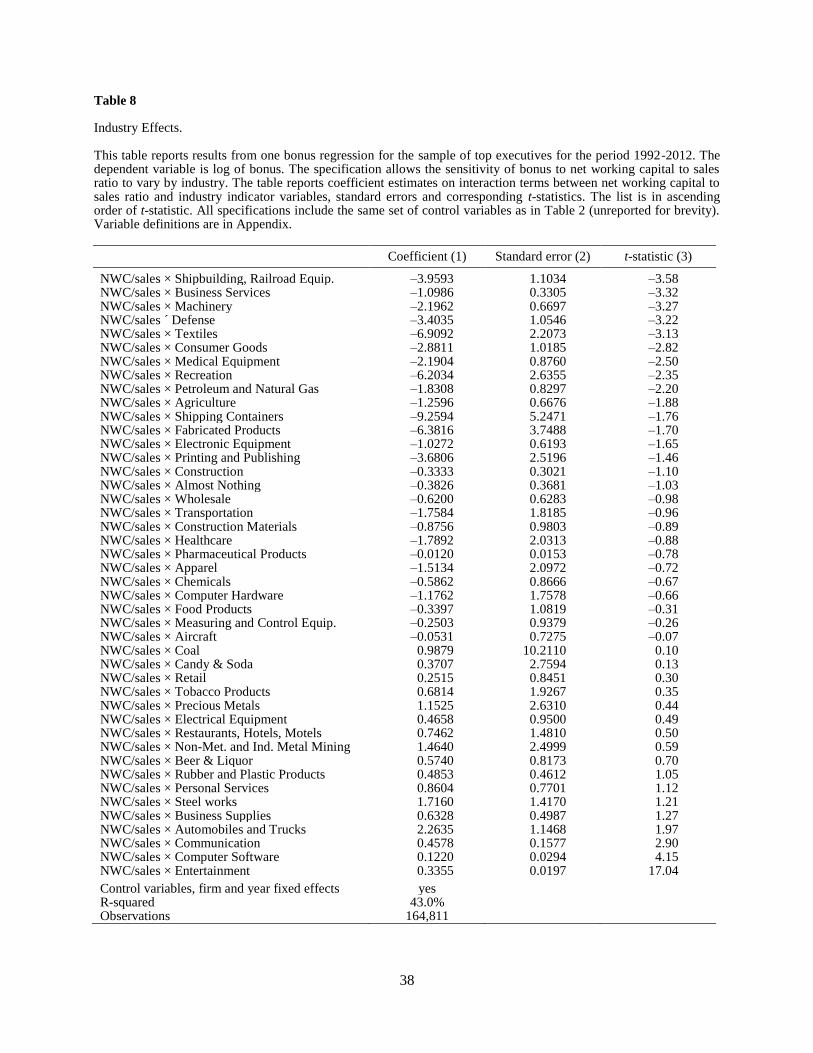
38
Table 8 Industry Effects. This table reports results from one bonus regression for the sample of top executives for the period 1992-2012. The dependent variable is log of bonus. The specification allows the sensitivity of bonus to net working capital to sales ratio to vary by industry. The table reports coefficient estimates on interaction terms between net working capital to sales ratio and industry indicator variables, standard errors and corresponding t-statistics. The list is in ascending order of t-statistic. All specifications include the same set of control variables as in Table 2 (unreported for brevity). Variable definitions are in Appendix.
Coefficient (1) Standard error (2) t-statistic (3)
NWC/sales × Shipbuilding, Railroad Equip. –3.9593 1.1034 –3.58 NWC/sales × Business Services –1.0986 0.3305 –3.32 NWC/sales × Machinery –2.1962 0.6697 –3.27 NWC/sales ´ Defense –3.4035 1.0546 –3.22 NWC/sales × Textiles –6.9092 2.2073 –3.13 NWC/sales × Consumer Goods –2.8811 1.0185 –2.82 NWC/sales × Medical Equipment –2.1904 0.8760 –2.50 NWC/sales × Recreation –6.2034 2.6355 –2.35 NWC/sales × Petroleum and Natural Gas –1.8308 0.8297 –2.20 NWC/sales × Agriculture –1.2596 0.6676 –1.88 NWC/sales × Shipping Containers –9.2594 5.2471 –1.76 NWC/sales × Fabricated Products –6.3816 3.7488 –1.70 NWC/sales × Electronic Equipment –1.0272 0.6193 –1.65 NWC/sales × Printing and Publishing –3.6806 2.5196 –1.46 NWC/sales × Construction –0.3333 0.3021 –1.10 NWC/sales × Almost Nothing –0.3826 0.3681 –1.03 NWC/sales × Wholesale –0.6200 0.6283 –0.98 NWC/sales × Transportation –1.7584 1.8185 –0.96 NWC/sales × Construction Materials –0.8756 0.9803 –0.89 NWC/sales × Healthcare –1.7892 2.0313 –0.88 NWC/sales × Pharmaceutical Products –0.0120 0.0153 –0.78 NWC/sales × Apparel –1.5134 2.0972 –0.72 NWC/sales × Chemicals –0.5862 0.8666 –0.67 NWC/sales × Computer Hardware –1.1762 1.7578 –0.66 NWC/sales × Food Products –0.3397 1.0819 –0.31 NWC/sales × Measuring and Control Equip. –0.2503 0.9379 –0.26 NWC/sales × Aircraft –0.0531 0.7275 –0.07 NWC/sales × Coal 0.9879 10.2110 0.10 NWC/sales × Candy & Soda 0.3707 2.7594 0.13 NWC/sales × Retail 0.2515 0.8451 0.30 NWC/sales × Tobacco Products 0.6814 1.9267 0.35 NWC/sales × Precious Metals 1.1525 2.6310 0.44 NWC/sales × Electrical Equipment 0.4658 0.9500 0.49 NWC/sales × Restaurants, Hotels, Motels 0.7462 1.4810 0.50 NWC/sales × Non-Met. and Ind. Metal Mining 1.4640 2.4999 0.59 NWC/sales × Beer & Liquor 0.5740 0.8173 0.70 NWC/sales × Rubber and Plastic Products 0.4853 0.4612 1.05 NWC/sales × Personal Services 0.8604 0.7701 1.12 NWC/sales × Steel works 1.7160 1.4170 1.21 NWC/sales × Business Supplies 0.6328 0.4987 1.27 NWC/sales × Automobiles and Trucks 2.2635 1.1468 1.97 NWC/sales × Communication 0.4578 0.1577 2.90 NWC/sales × Computer Software 0.1220 0.0294 4.15 NWC/sales × Entertainment 0.3355 0.0197 17.04
Control variables, firm and year fixed effects yes R-squared 43.0% Observations 164,811
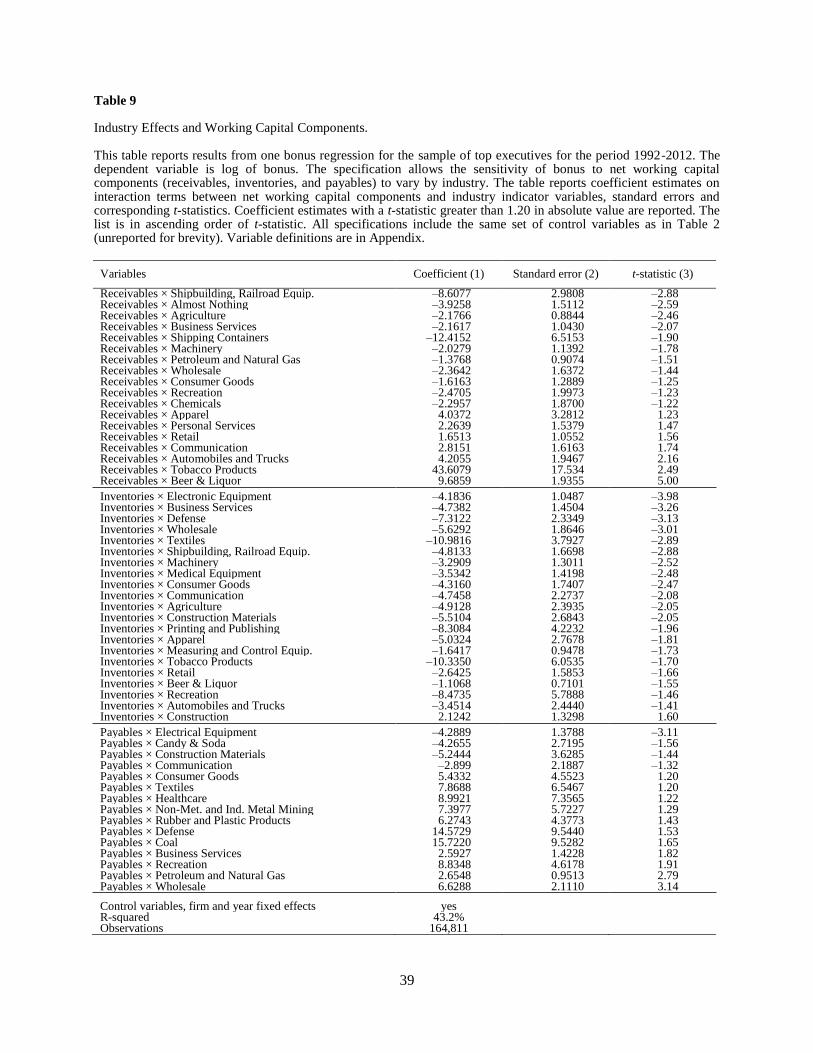
39
Table 9 Industry Effects and Working Capital Components. This table reports results from one bonus regression for the sample of top executives for the period 1992-2012. The dependent variable is log of bonus. The specification allows the sensitivity of bonus to net working capital components (receivables, inventories, and payables) to vary by industry. The table reports coefficient estimates on interaction terms between net working capital components and industry indicator variables, standard errors and corresponding t-statistics. Coefficient estimates with a t-statistic greater than 1.20 in absolute value are reported. The list is in ascending order of t-statistic. All specifications include the same set of control variables as in Table 2 (unreported for brevity). Variable definitions are in Appendix.
Variables Coefficient (1) Standard error (2) t-statistic (3)
Receivables × Shipbuilding, Railroad Equip. –8.6077 2.9808 –2.88 Receivables × Almost Nothing –3.9258 1.5112 –2.59 Receivables × Agriculture –2.1766 0.8844 –2.46 Receivables × Business Services –2.1617 1.0430 –2.07 Receivables × Shipping Containers –12.4152 6.5153 –1.90 Receivables × Machinery –2.0279 1.1392 –1.78 Receivables × Petroleum and Natural Gas –1.3768 0.9074 –1.51 Receivables × Wholesale –2.3642 1.6372 –1.44 Receivables × Consumer Goods –1.6163 1.2889 –1.25 Receivables × Recreation –2.4705 1.9973 –1.23 Receivables × Chemicals –2.2957 1.8700 –1.22 Receivables × Apparel 4.0372 3.2812 1.23 Receivables × Personal Services 2.2639 1.5379 1.47 Receivables × Retail 1.6513 1.0552 1.56 Receivables × Communication 2.8151 1.6163 1.74 Receivables × Automobiles and Trucks 4.2055 1.9467 2.16 Receivables × Tobacco Products 43.6079 17.534 2.49 Receivables × Beer & Liquor 9.6859 1.9355 5.00
Inventories × Electronic Equipment –4.1836 1.0487 –3.98 Inventories × Business Services –4.7382 1.4504 –3.26 Inventories × Defense –7.3122 2.3349 –3.13 Inventories × Wholesale –5.6292 1.8646 –3.01 Inventories × Textiles –10.9816 3.7927 –2.89 Inventories × Shipbuilding, Railroad Equip. –4.8133 1.6698 –2.88 Inventories × Machinery –3.2909 1.3011 –2.52 Inventories × Medical Equipment –3.5342 1.4198 –2.48 Inventories × Consumer Goods –4.3160 1.7407 –2.47 Inventories × Communication –4.7458 2.2737 –2.08 Inventories × Agriculture –4.9128 2.3935 –2.05 Inventories × Construction Materials –5.5104 2.6843 –2.05 Inventories × Printing and Publishing –8.3084 4.2232 –1.96 Inventories × Apparel –5.0324 2.7678 –1.81 Inventories × Measuring and Control Equip. –1.6417 0.9478 –1.73 Inventories × Tobacco Products –10.3350 6.0535 –1.70 Inventories × Retail –2.6425 1.5853 –1.66 Inventories × Beer & Liquor –1.1068 0.7101 –1.55 Inventories × Recreation –8.4735 5.7888 –1.46 Inventories × Automobiles and Trucks –3.4514 2.4440 –1.41 Inventories × Construction 2.1242 1.3298 1.60
Payables × Electrical Equipment –4.2889 1.3788 –3.11 Payables × Candy & Soda –4.2655 2.7195 –1.56 Payables × Construction Materials –5.2444 3.6285 –1.44 Payables × Communication –2.899 2.1887 –1.32 Payables × Consumer Goods 5.4332 4.5523 1.20 Payables × Textiles 7.8688 6.5467 1.20 Payables × Healthcare 8.9921 7.3565 1.22 Payables × Non-Met. and Ind. Metal Mining 7.3977 5.7227 1.29 Payables × Rubber and Plastic Products 6.2743 4.3773 1.43 Payables × Defense 14.5729 9.5440 1.53 Payables × Coal 15.7220 9.5282 1.65 Payables × Business Services 2.5927 1.4228 1.82 Payables × Recreation 8.8348 4.6178 1.91 Payables × Petroleum and Natural Gas 2.6548 0.9513 2.79 Payables × Wholesale 6.6288 2.1110 3.14
Control variables, firm and year fixed effects yes R-squared 43.2% Observations 164,811
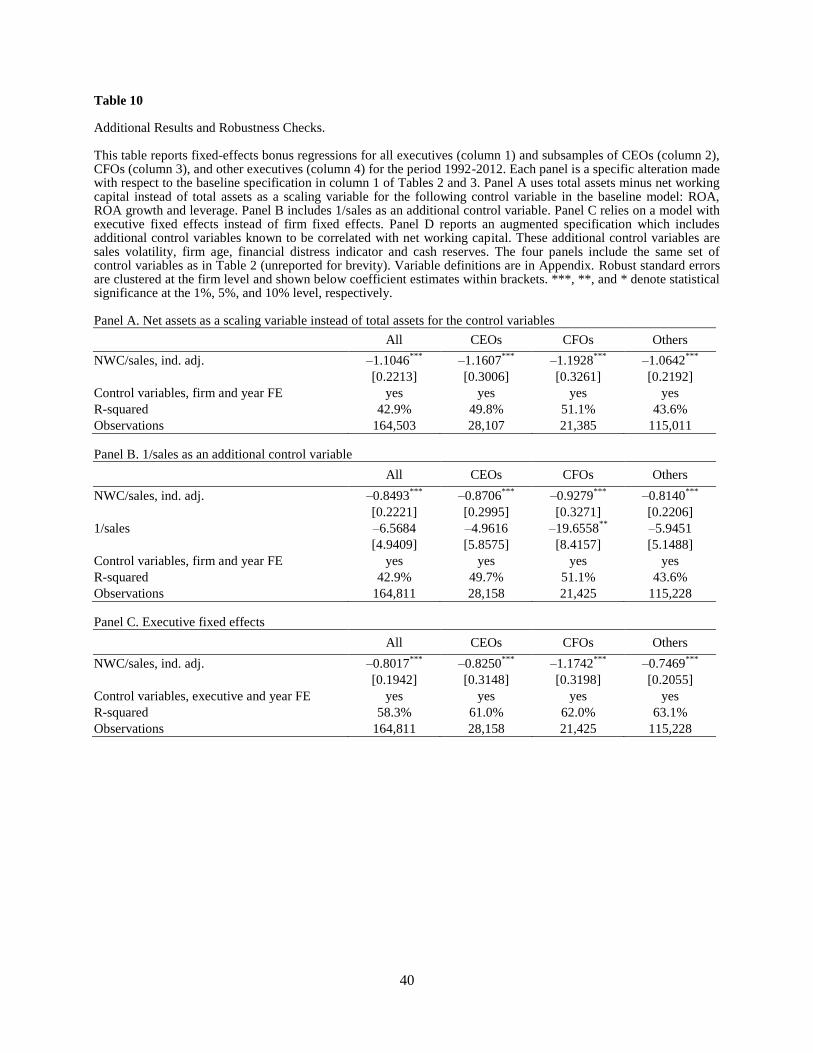
40
Table 10 Additional Results and Robustness Checks. This table reports fixed-effects bonus regressions for all executives (column 1) and subsamples of CEOs (column 2), CFOs (column 3), and other executives (column 4) for the period 1992-2012. Each panel is a specific alteration made with respect to the baseline specification in column 1 of Tables 2 and 3. Panel A uses total assets minus net working capital instead of total assets as a scaling variable for the following control variable in the baseline model: ROA, ROA growth and leverage. Panel B includes 1/sales as an additional control variable. Panel C relies on a model with executive fixed effects instead of firm fixed effects. Panel D reports an augmented specification which includes additional control variables known to be correlated with net working capital. These additional control variables are sales volatility, firm age, financial distress indicator and cash reserves. The four panels include the same set of control variables as in Table 2 (unreported for brevity). Variable definitions are in Appendix. Robust standard errors are clustered at the firm level and shown below coefficient estimates within brackets. ***, **, and * denote statistical significance at the 1%, 5%, and 10% level, respectively. Panel A. Net assets as a scaling variable instead of total assets for the control variables
All CEOs CFOs Others
NWC/sales, ind. adj. –1.1046***
–1.1607***
–1.1928***
–1.0642***
[0.2213] [0.3006] [0.3261] [0.2192]
Control variables, firm and year FE yes yes yes yes
R-squared 42.9% 49.8% 51.1% 43.6%
Observations 164,503 28,107 21,385 115,011 Panel B. 1/sales as an additional control variable
All CEOs CFOs Others
NWC/sales, ind. adj. –0.8493***
–0.8706***
–0.9279***
–0.8140***
[0.2221] [0.2995] [0.3271] [0.2206]
1/sales –6.5684 –4.9616 –19.6558**
–5.9451
[4.9409] [5.8575] [8.4157] [5.1488]
Control variables, firm and year FE yes yes yes yes
R-squared 42.9% 49.7% 51.1% 43.6%
Observations 164,811 28,158 21,425 115,228 Panel C. Executive fixed effects
All CEOs CFOs Others
NWC/sales, ind. adj. –0.8017***
–0.8250***
–1.1742***
–0.7469***
[0.1942] [0.3148] [0.3198] [0.2055]
Control variables, executive and year FE yes yes yes yes
R-squared 58.3% 61.0% 62.0% 63.1%
Observations 164,811 28,158 21,425 115,228
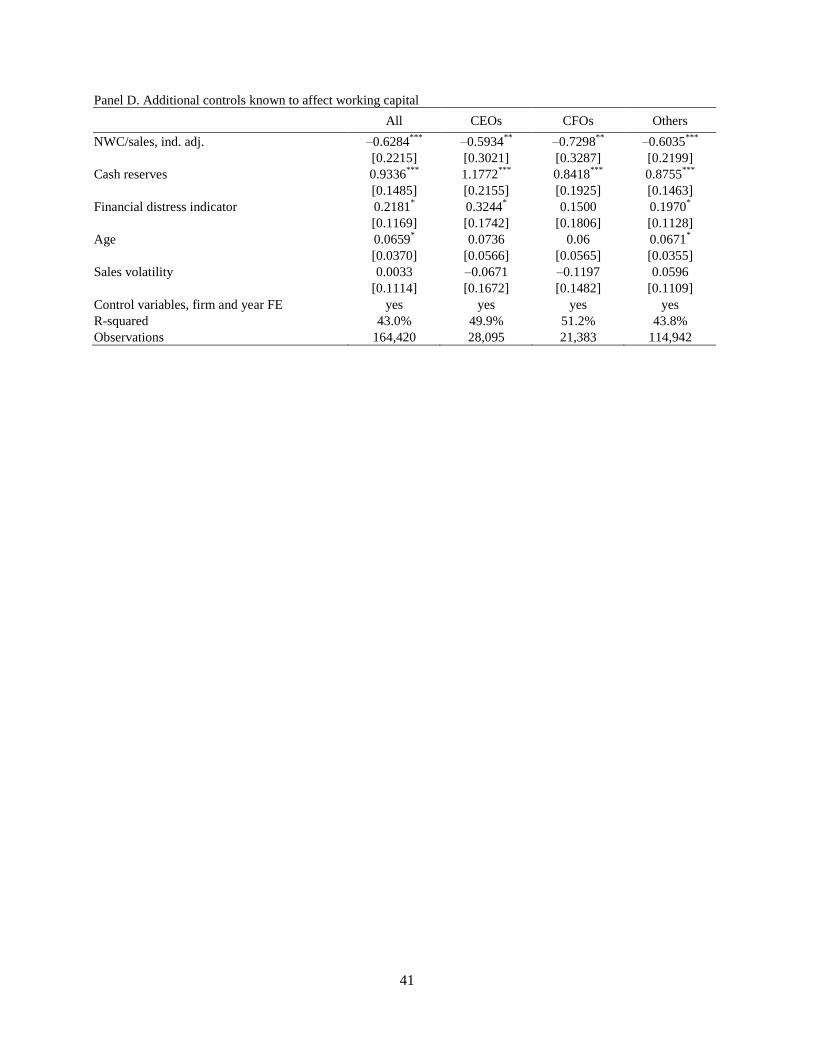
41
Panel D. Additional controls known to affect working capital
All CEOs CFOs Others
NWC/sales, ind. adj. –0.6284***
–0.5934**
–0.7298**
–0.6035***
[0.2215] [0.3021] [0.3287] [0.2199]
Cash reserves 0.9336***
1.1772***
0.8418***
0.8755***
[0.1485] [0.2155] [0.1925] [0.1463]
Financial distress indicator 0.2181* 0.3244
* 0.1500 0.1970
*
[0.1169] [0.1742] [0.1806] [0.1128]
Age 0.0659* 0.0736 0.06 0.0671
*
[0.0370] [0.0566] [0.0565] [0.0355]
Sales volatility 0.0033 –0.0671 –0.1197 0.0596
[0.1114] [0.1672] [0.1482] [0.1109]
Control variables, firm and year FE yes yes yes yes
R-squared 43.0% 49.9% 51.2% 43.8%
Observations 164,420 28,095 21,383 114,942