Embed Size (px)
Citation preview
This presentation, including any supporting materials, is owned by Gartner, Inc. and/or its affiliates and is for the sole use of the intended Gartner audience or other authorized recipients. This presentation may contain information that is confidential, proprietary or otherwise legally protected, and it may not be further copied, distributed or publicly displayed without the express written permission of Gartner, Inc. or its affiliates. © 2012 Gartner, Inc. and/or its affiliates. All rights reserved.
Company XYZ
2012
Executive Programs & IT Key Metrics Data Executive Assessment
© 2012 Gartner, Inc. All Rights Reserved.
Source: Gartner Benchmark Analytics - IT Key Metrics Data
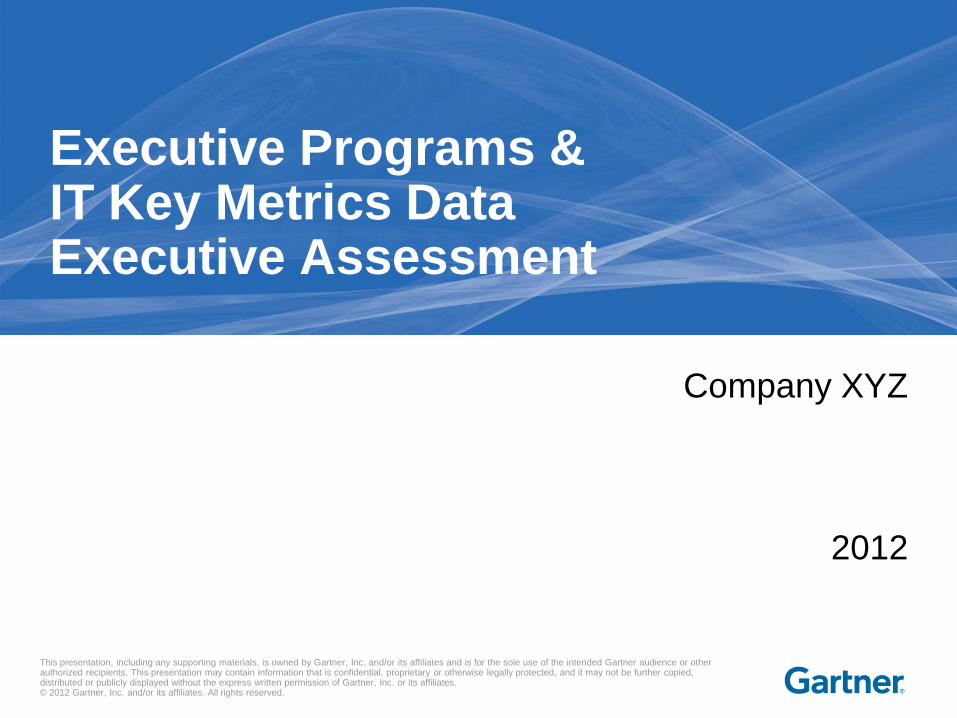
Content
• Assessment Overview & Description of Comparison Groups
• Key Data Input
• IT Spending as a % of Total Revenues
• IT Spending as a % of Operating Expenses
• IT Spending per Company Employee
• IT Employees as a % of Company Employees
• In House vs. Contract IT Employees
• Capital vs. Operational IT Spending
• IT Spend Distribution (HW, SW, Personnel, Outsourcing, Other)
• IT Spend Distribution (Run, Grow, Transform)
• Spending & Staffing
• IT Security Metrics Comparison
• IT Outsourcing Metrics Comparison
• Applications Metrics Comparison
1
© 2012 Gartner, Inc. All Rights Reserved.
Source: Gartner Benchmark Analytics - IT Key Metrics Data
2
Assessment Overview
The purpose of this executive assessment is to provide a high level overview of investment and staffing levels and distribution against industry averages as well as insight into technology-specific cost, staffing and performance levels.
The metrics contained in this report are based on averages sourced from the Gartner IT Key Metrics Data 2012 publication series, and provide you with a vehicle to easily compare your organization’s key IT metrics against the Gartner averages in a structured environment.
Published content represents a mix of organizations of different sizes and vertical industry segmentations.
As with any data, many potential interpretations and analyses exist, so these measures should be considered in the context of your organization’s future state objectives and your niche competitive landscape.
Your organization should assess its own situation carefully, and should not, arbitrarily, change to conform to published data (which do not necessarily represent best practices).
© 2012 Gartner, Inc. All Rights Reserved.
Source: Gartner Benchmark Analytics - IT Key Metrics Data
3
Description of Comparison Groups
Industry analysis: For measures by industry this analysis explores an organization’s total capital and operational (excluding depreciation and amortization) budget and staffing levels. Your organization has been compared to organizations within the XXX industry.
Non-industry analysis: For the Security Metrics Comparison, Outsourcing Metrics Comparison and Applications Metrics Comparison sections your organization has been compared to the full database for each of the technology domains analyzed.
Industry Comparison Analysis
4
© 2012 Gartner, Inc. All Rights Reserved.
Source: Gartner Benchmark Analytics - IT Key Metrics Data
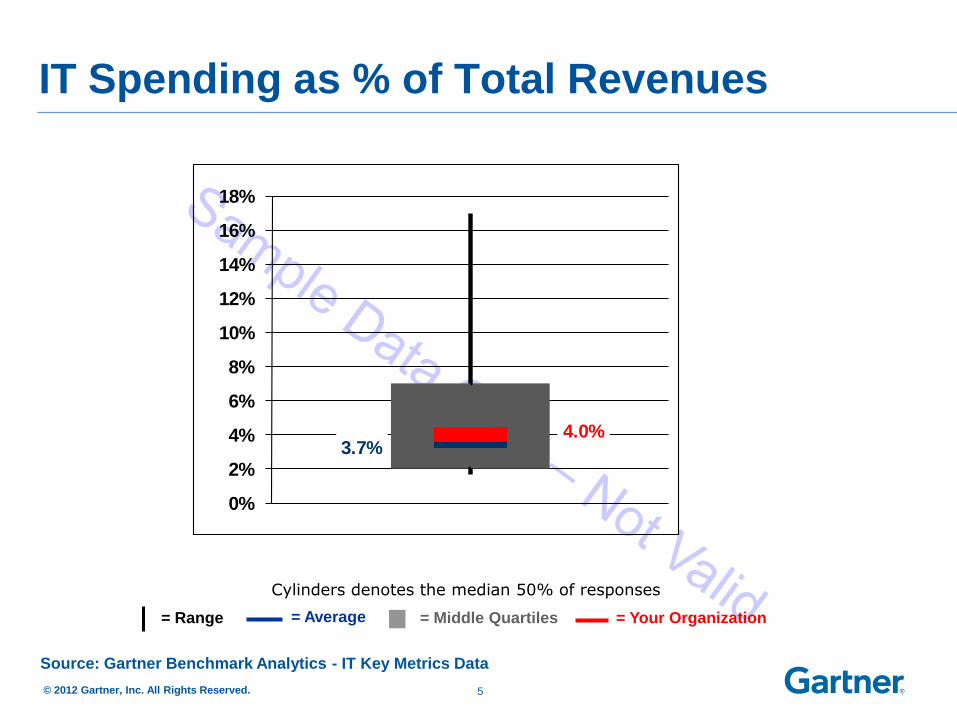
3.7%4.0%
0%
2%
4%
6%
8%
10%
12%
14%
16%
18%
5
IT Spending as % of Total Revenues
Source: Worldwide IT Benchmark Service
Cylinders denotes the median 50% of responses
= Range = Average = Middle Quartiles = Your Organization
© 2012 Gartner, Inc. All Rights Reserved.
Source: Gartner Benchmark Analytics - IT Key Metrics Data
6
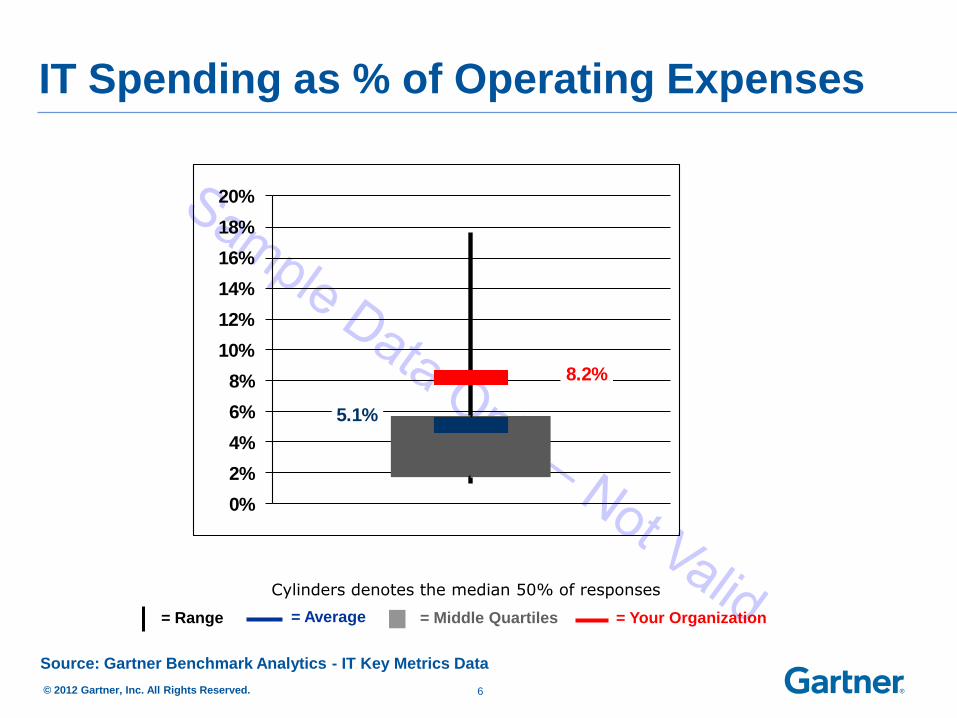
IT Spending as % of Operating Expenses
5.1%
8.2%
0%
2%
4%
6%
8%
10%
12%
14%
16%
18%
20%
Source: Worldwide IT Benchmark Service
Cylinders denotes the median 50% of responses
= Range = Average = Middle Quartiles = Your Organization
© 2012 Gartner, Inc. All Rights Reserved.
Source: Gartner Benchmark Analytics - IT Key Metrics Data
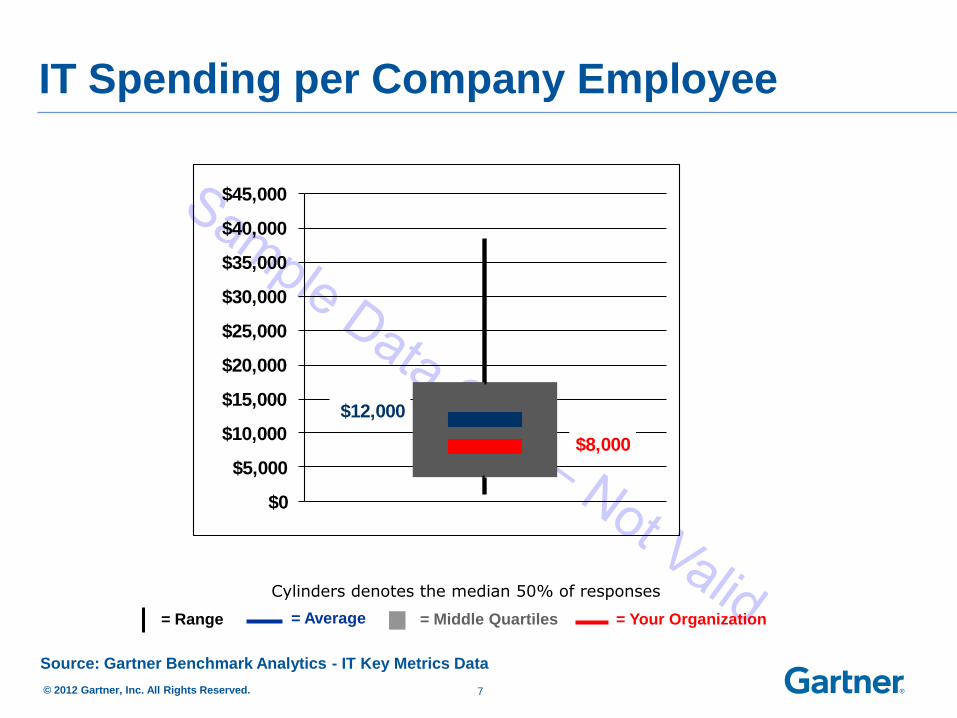
$12,000
$8,000
$0
$5,000
$10,000
$15,000
$20,000
$25,000
$30,000
$35,000
$40,000
$45,000
7
IT Spending per Company Employee
Source: Worldwide IT Benchmark Service
Cylinders denotes the median 50% of responses
= Range = Average = Middle Quartiles = Your Organization
© 2012 Gartner, Inc. All Rights Reserved.
Source: Gartner Benchmark Analytics - IT Key Metrics Data
8
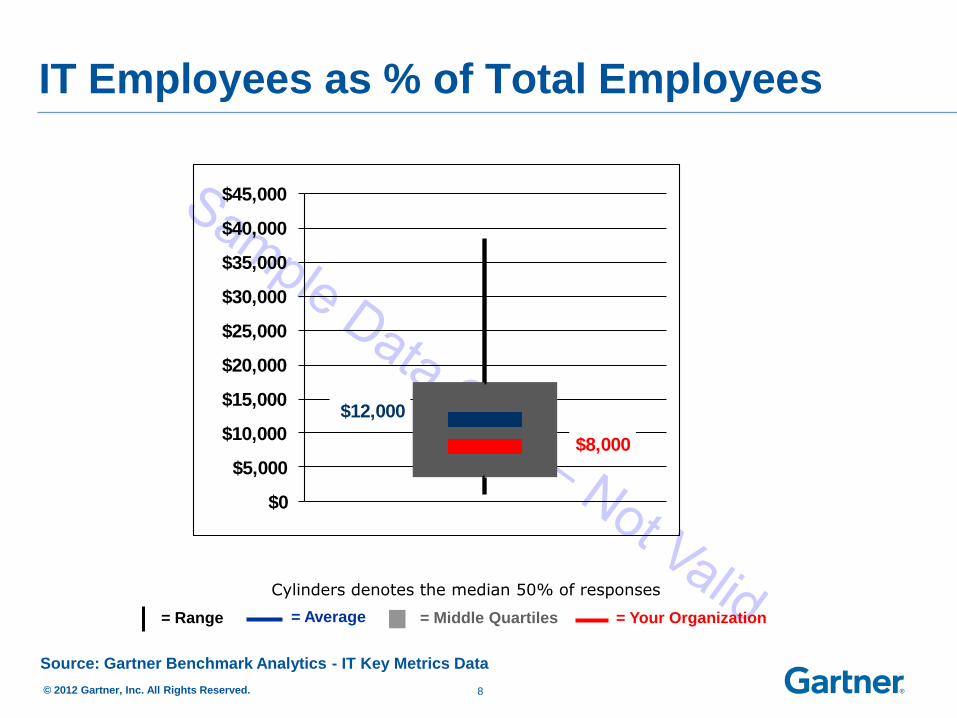
IT Employees as % of Total Employees
$12,000
$8,000
$0
$5,000
$10,000
$15,000
$20,000
$25,000
$30,000
$35,000
$40,000
$45,000
Source: Worldwide IT Benchmark Service
Cylinders denotes the median 50% of responses
= Range = Average = Middle Quartiles = Your Organization
© 2012 Gartner, Inc. All Rights Reserved.
Source: Gartner Benchmark Analytics - IT Key Metrics Data
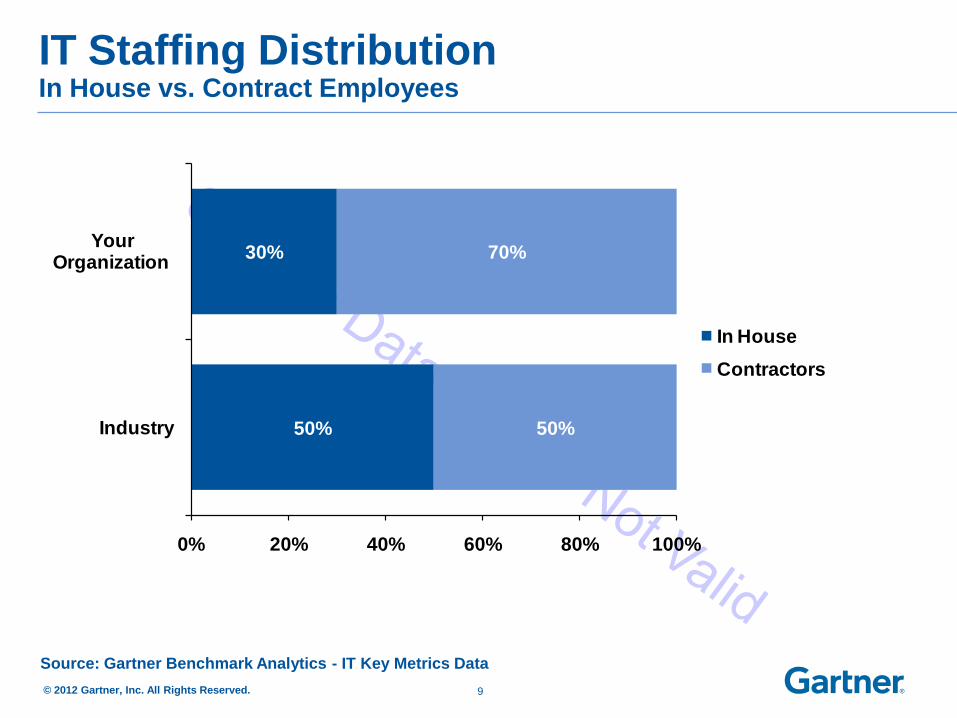
IT Staffing Distribution In House vs. Contract Employees
9
50%
30%
50%
70%
0% 20% 40% 60% 80% 100%
Industry
Your Organization
In House
Contractors
© 2012 Gartner, Inc. All Rights Reserved.
Source: Gartner Benchmark Analytics - IT Key Metrics Data
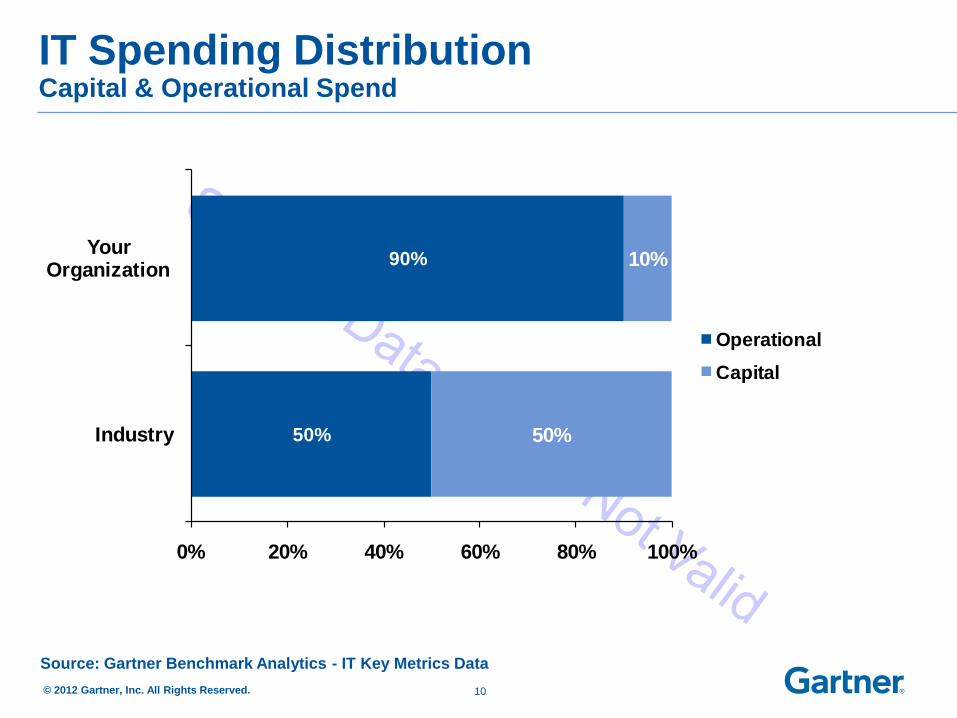
IT Spending Distribution Capital & Operational Spend
10
50%
90%
50%
10%
0% 20% 40% 60% 80% 100%
Industry
Your Organization
Operational
Capital
11
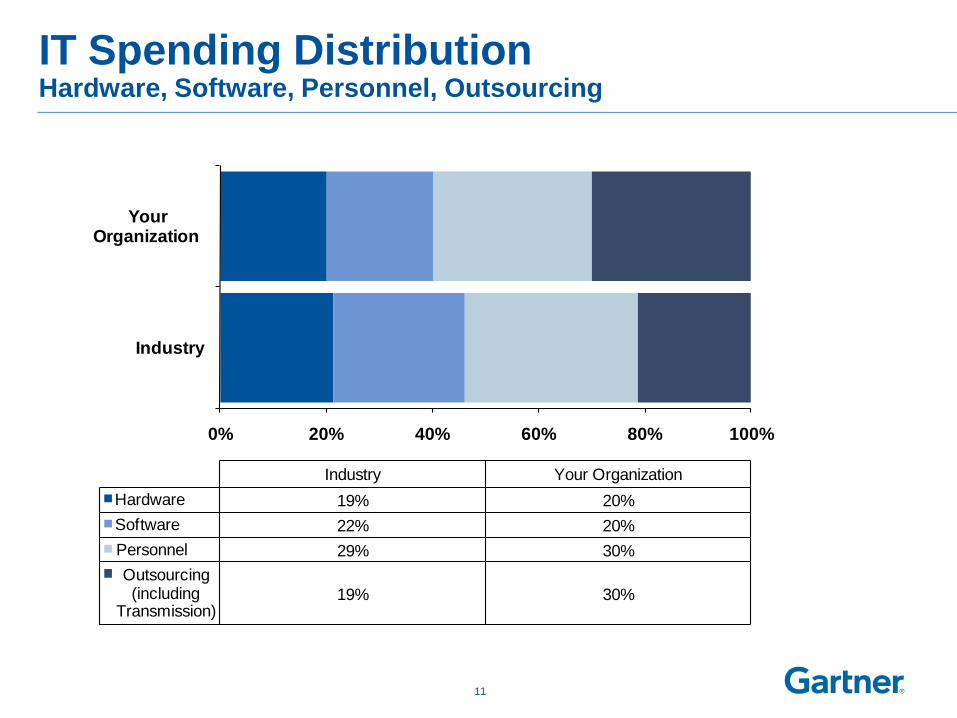
IT Spending Distribution Hardware, Software, Personnel, Outsourcing
0% 20% 40% 60% 80% 100%
Industry
Your Organization
Industry Your Organization
Hardware 19% 20%
Software 22% 20%
Personnel 29% 30%
Outsourcing (including
Transmission)19% 30%
© 2012 Gartner, Inc. All Rights Reserved.
Source: Gartner Benchmark Analytics - IT Key Metrics Data
12
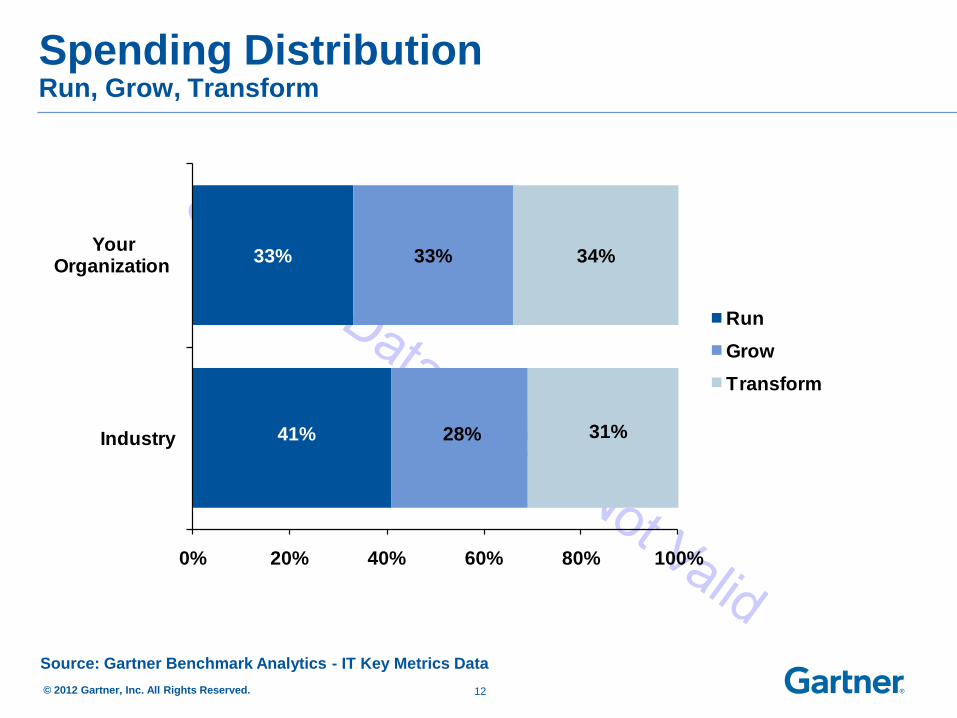
Spending Distribution Run, Grow, Transform
41%
33%
28%
33%
31%
34%
0% 20% 40% 60% 80% 100%
Industry
Your Organization
Run
Grow
Transform
© 2012 Gartner, Inc. All Rights Reserved.
Source: Gartner Benchmark Analytics - IT Key Metrics Data
13
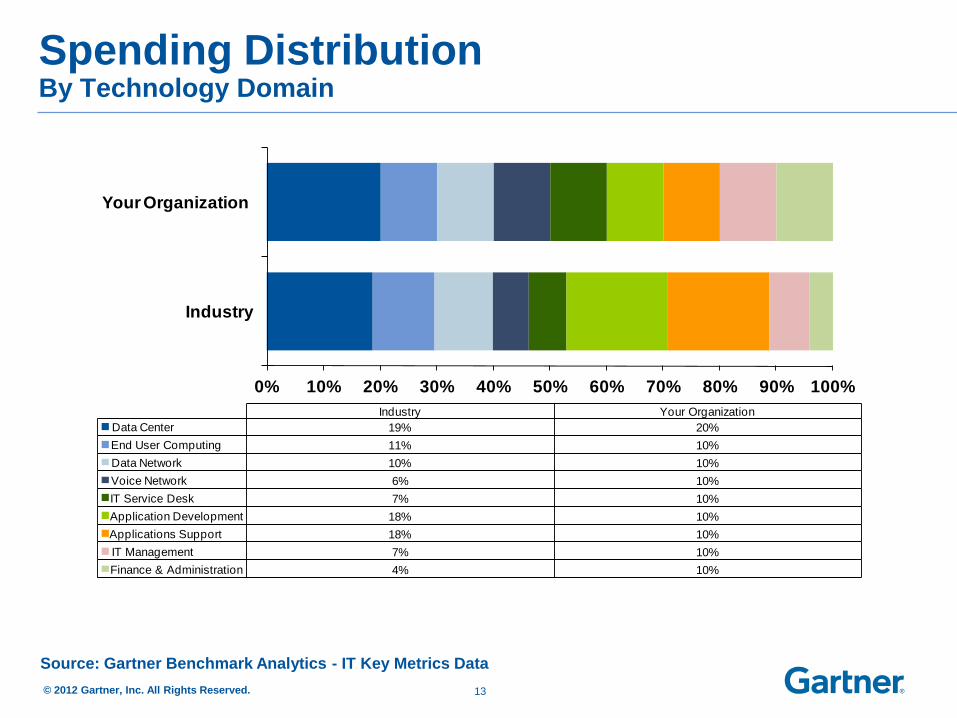
Spending Distribution By Technology Domain
0% 10% 20% 30% 40% 50% 60% 70% 80% 90% 100%
Industry
Your Organization
Industry Your Organization
Data Center 19% 20%
End User Computing 11% 10%
Data Network 10% 10%
Voice Network 6% 10%
IT Service Desk 7% 10%
Application Development 18% 10%
Applications Support 18% 10%
IT Management 7% 10%
Finance & Administration 4% 10%
© 2012 Gartner, Inc. All Rights Reserved.
Source: Gartner Benchmark Analytics - IT Key Metrics Data
14
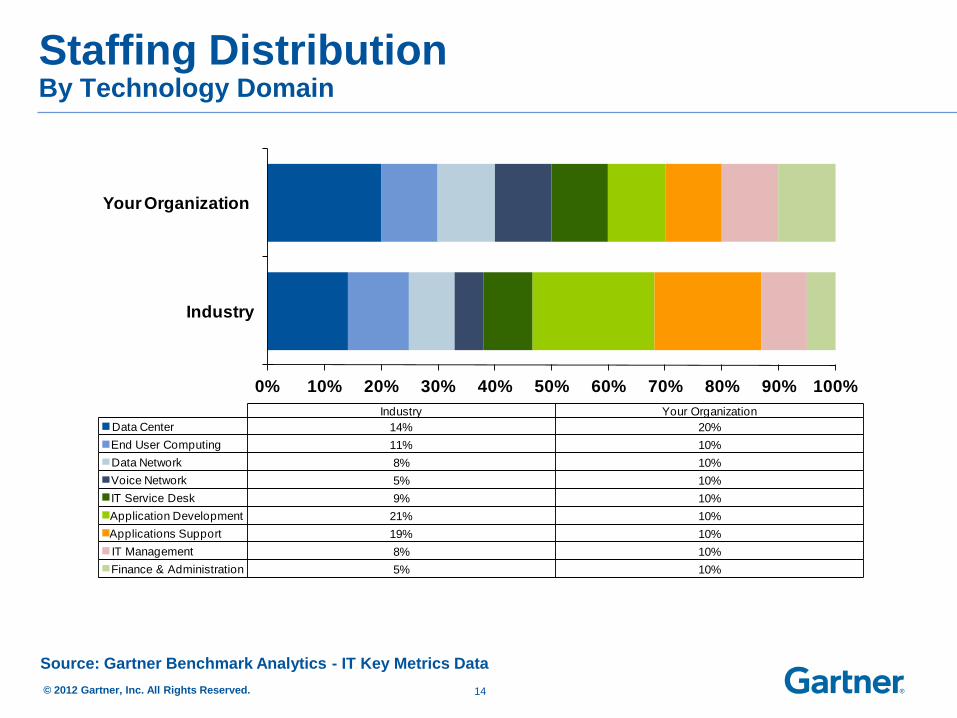
Staffing Distribution By Technology Domain
0% 10% 20% 30% 40% 50% 60% 70% 80% 90% 100%
Industry
Your Organization
Industry Your Organization
Data Center 14% 20%
End User Computing 11% 10%
Data Network 8% 10%
Voice Network 5% 10%
IT Service Desk 9% 10%
Application Development 21% 10%
Applications Support 19% 10%
IT Management 8% 10%
Finance & Administration 5% 10%
Comparison group based on full security database
(across all industries)
IT Security Comparison Analysis
15
© 2012 Gartner, Inc. All Rights Reserved.
Source: Gartner Benchmark Analytics - IT Key Metrics Data
16
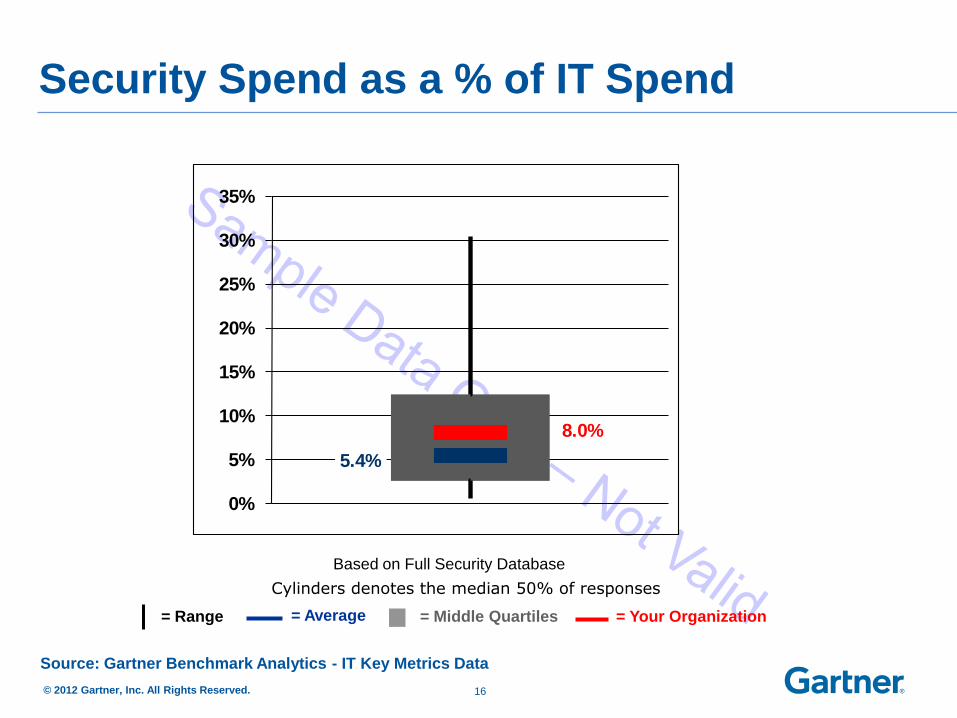
Source: Worldwide IT Benchmark Service
Cylinders denotes the median 50% of responses
Security Spend as a % of IT Spend
= Range = Average = Middle Quartiles = Your Organization
Based on Full Security Database
5.4%
8.0%
0%
5%
10%
15%
20%
25%
30%
35%
© 2012 Gartner, Inc. All Rights Reserved.
Source: Gartner Benchmark Analytics - IT Key Metrics Data
17
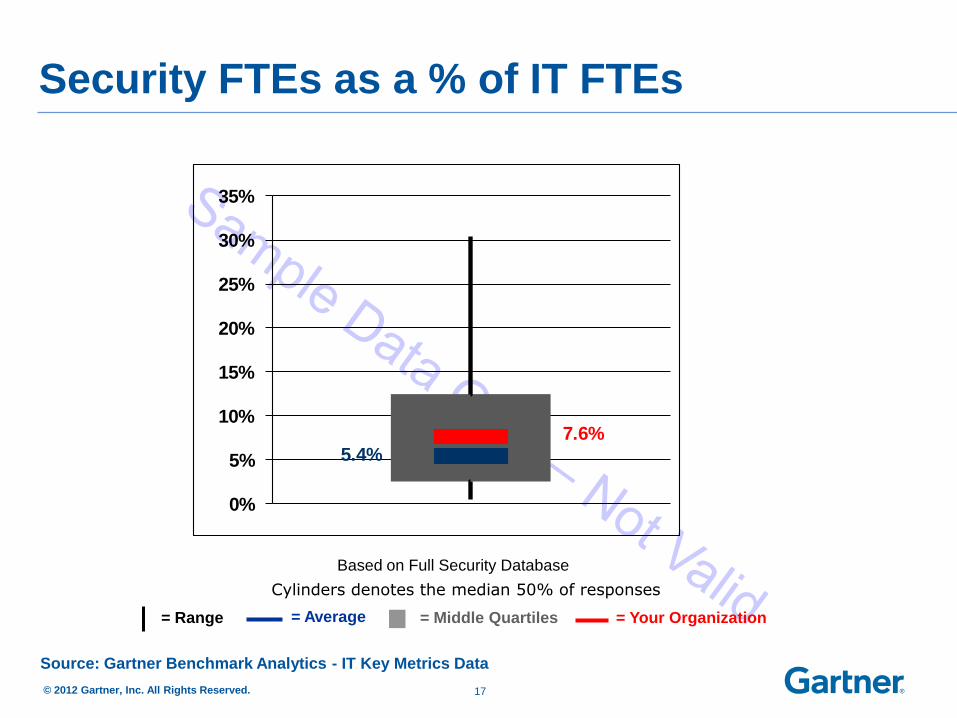
Source: Worldwide IT Benchmark Service
Cylinders denotes the median 50% of responses
Security FTEs as a % of IT FTEs
= Range = Average = Middle Quartiles = Your Organization
Based on Full Security Database
5.4%7.6%
0%
5%
10%
15%
20%
25%
30%
35%
Comparison group based on full outsourcing database
(across all industries)
IT Outsourcing Comparison
Analysis
18
© 2012 Gartner, Inc. All Rights Reserved.
Source: Gartner Benchmark Analytics - IT Key Metrics Data
19
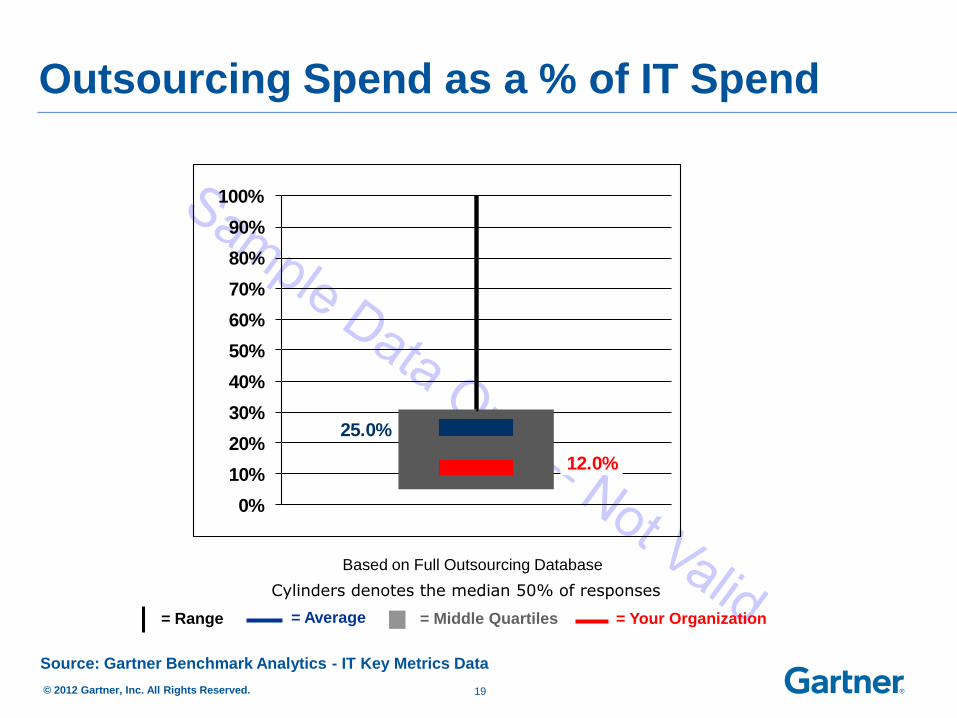
Cylinders denotes the median 50% of responses
Outsourcing Spend as a % of IT Spend
Based on Full Outsourcing Database
= Range = Average = Middle Quartiles = Your Organization
25.0%
12.0%
0%
10%
20%
30%
40%
50%
60%
70%
80%
90%
100%
© 2012 Gartner, Inc. All Rights Reserved.
Source: Gartner Benchmark Analytics - IT Key Metrics Data
20
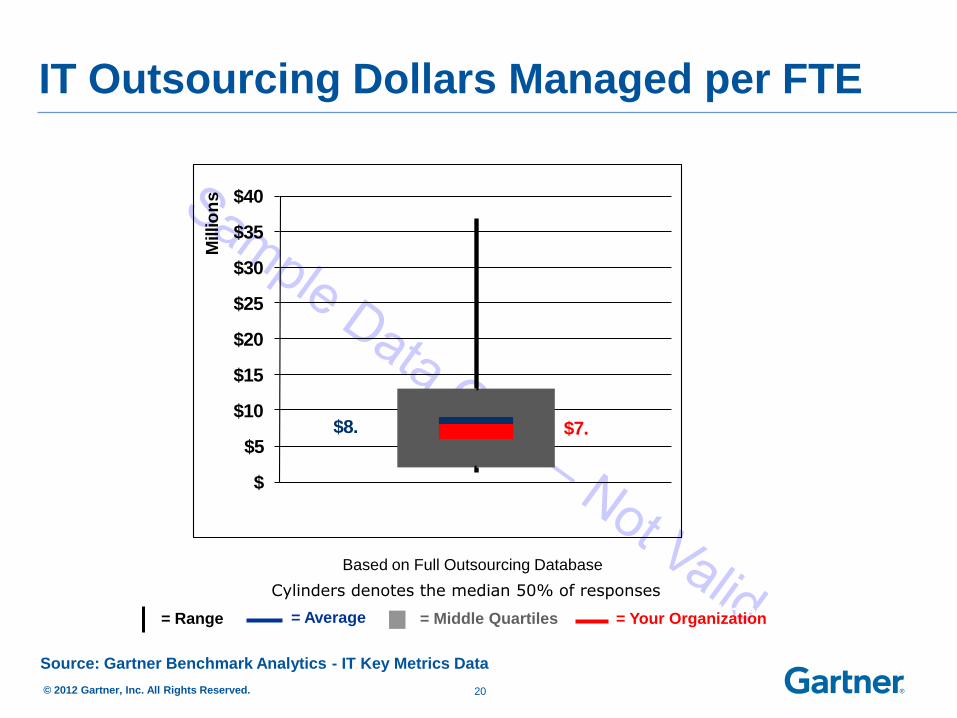
Source: Worldwide IT Benchmark Service
Cylinders denotes the median 50% of responses
IT Outsourcing Dollars Managed per FTE
Based on Full Outsourcing Database
= Range = Average = Middle Quartiles = Your Organization
$8. $7.
$
$5
$10
$15
$20
$25
$30
$35
$40M
illio
ns
Comparison group based on full applications database
(across all industries)
Applications Comparison
Analysis
21
© 2012 Gartner, Inc. All Rights Reserved.
Source: Gartner Benchmark Analytics - IT Key Metrics Data
22
Source: Worldwide IT Benchmark Service
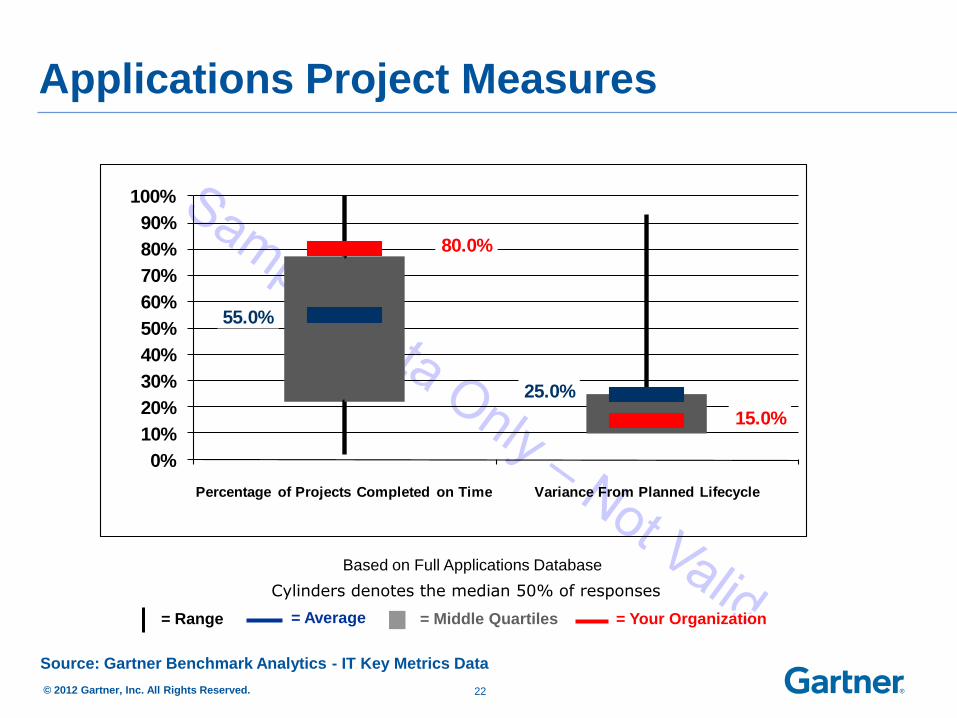
Cylinders denotes the median 50% of responses
Applications Project Measures
Based on Full Applications Database
= Range = Average = Middle Quartiles = Your Organization
55.0%
25.0%
80.0%
15.0%
0%
10%
20%
30%
40%
50%
60%
70%
80%
90%
100%
Percentage of Projects Completed on Time Variance From Planned Lifecycle
© 2012 Gartner, Inc. All Rights Reserved.
Source: Gartner Benchmark Analytics - IT Key Metrics Data
23
Source: Worldwide IT Benchmark Service
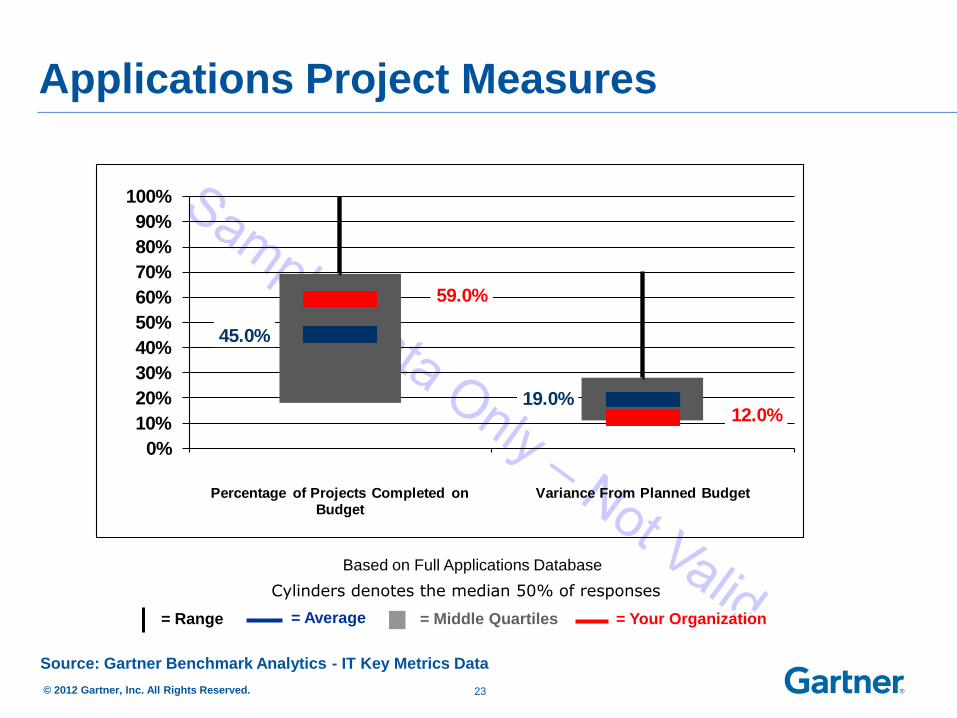
Cylinders denotes the median 50% of responses
Applications Project Measures
Based on Full Applications Database
= Range = Average = Middle Quartiles = Your Organization
45.0%
19.0%
59.0%
12.0%
0%
10%
20%
30%
40%
50%
60%
70%
80%
90%
100%
Percentage of Projects Completed on Budget
Variance From Planned Budget
© 2012 Gartner, Inc. All Rights Reserved.
Source: Gartner Benchmark Analytics - IT Key Metrics Data
24
Source: Worldwide IT Benchmark Service
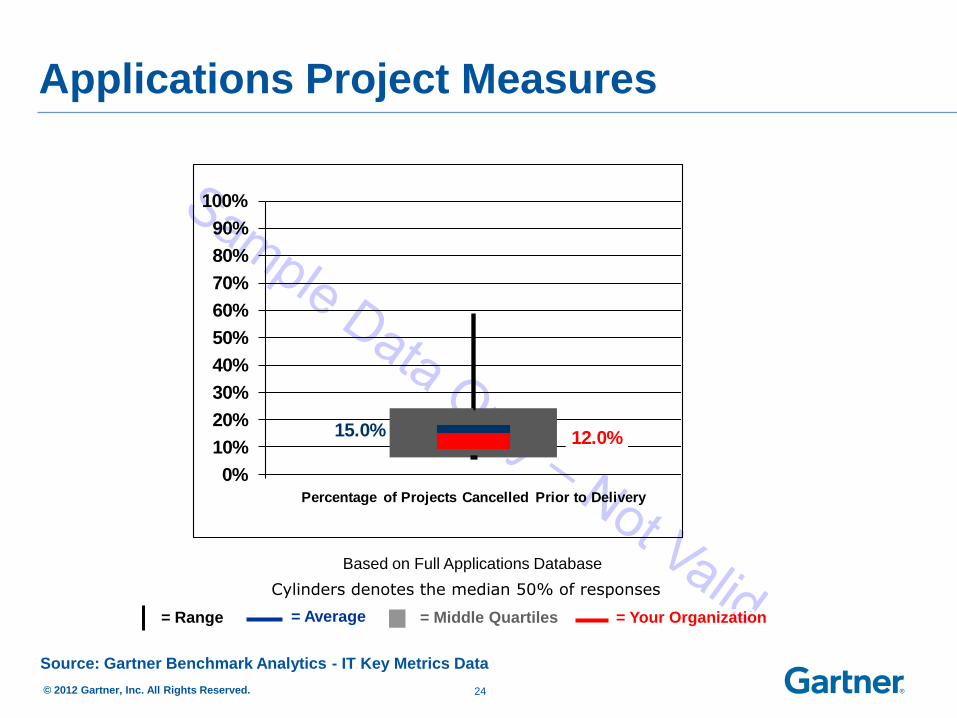
Cylinders denotes the median 50% of responses
Applications Project Measures
Based on Full Applications Database
= Range = Average = Middle Quartiles = Your Organization
15.0% 12.0%
0%
10%
20%
30%
40%
50%
60%
70%
80%
90%
100%
Percentage of Projects Cancelled Prior to Delivery
If you have any questions regarding this report, please contact us at:
To learn more about Gartner Consulting’s Benchmark Analytics solutions, go to:
gartner.com/technology/consulting/benchmarking/benchmarking-case-studies.jsp
or contact us at: [email protected]
To learn more about IT Key Metrics Data please visit our website at
gartner.com/itkmd
Information Provided by
Gartner Benchmark Analytics
25
Gartner delivers the technology-related
insight necessary for our clients to make
the right decisions, every day.
26