Embed Size (px)
Citation preview

Empirical Data Analysis 2016 - 2018, governance, insights and vision
Executive Remuneration in the Netherlands 2019
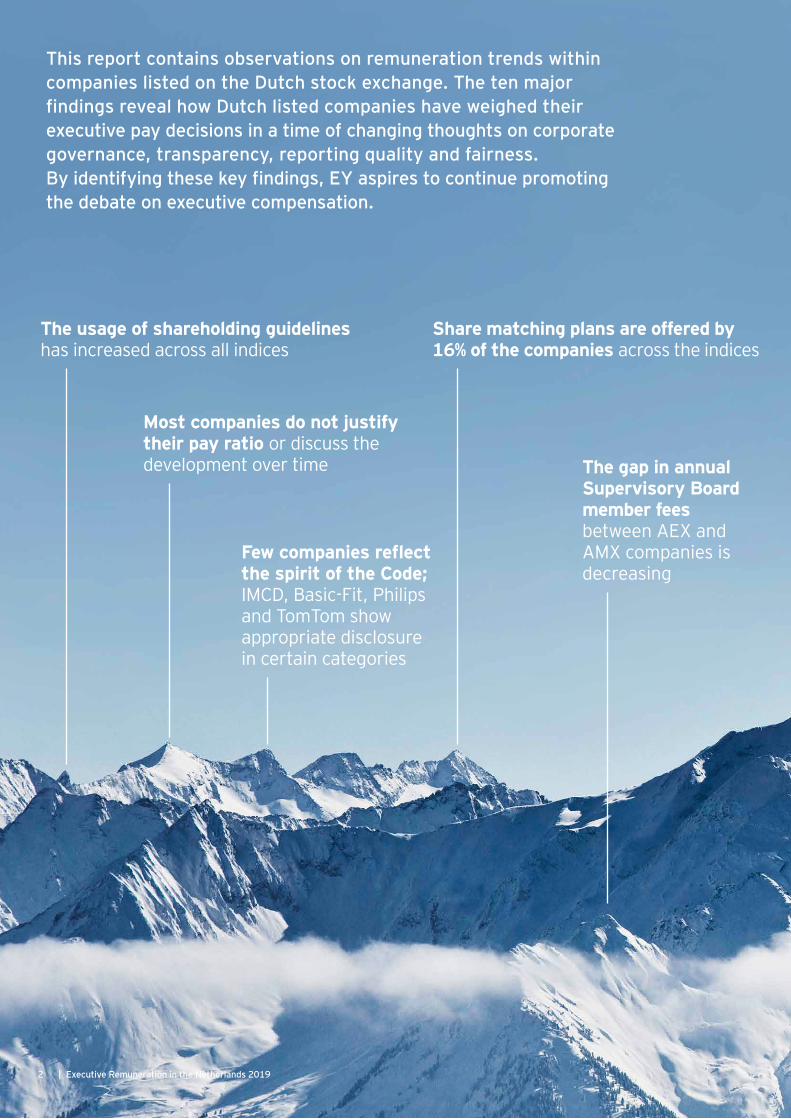
The usage of shareholding guidelines has increased across all indices
Most companies do not justify their pay ratio or discuss the development over time
Few companies reflect the spirit of the Code; IMCD, Basic-Fit, Philips and TomTom show appropriate disclosure in certain categories
The gap in annual Supervisory Board member fees between AEX and AMX companies is decreasing
This report contains observations on remuneration trends within companies listed on the Dutch stock exchange. The ten major findings reveal how Dutch listed companies have weighed their executive pay decisions in a time of changing thoughts on corporate governance, transparency, reporting quality and fairness. By identifying these key findings, EY aspires to continue promoting the debate on executive compensation.
Share matching plans are offered by 16% of the companies across the indices
2 | Executive Remuneration in the Netherlands 2019
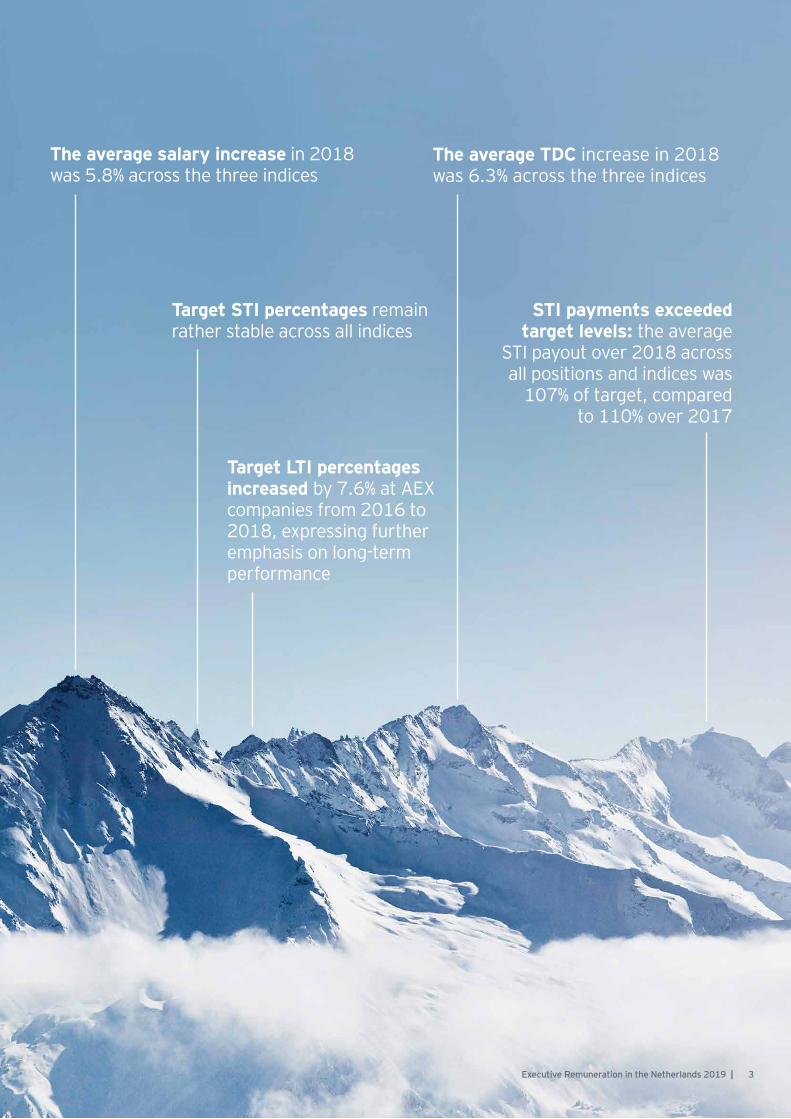
The average salary increase in 2018 was 5.8% across the three indices
Target STI percentages remain rather stable across all indices
Target LTI percentages increased by 7.6% at AEX companies from 2016 to 2018, expressing further emphasis on long-term performance
The average TDC increase in 2018 was 6.3% across the three indices
STI payments exceeded target levels: the average
STI payout over 2018 across all positions and indices was
107% of target, compared to 110% over 2017
3Executive Remuneration in the Netherlands 2019 |

4 | Executive Remuneration in the Netherlands 2019
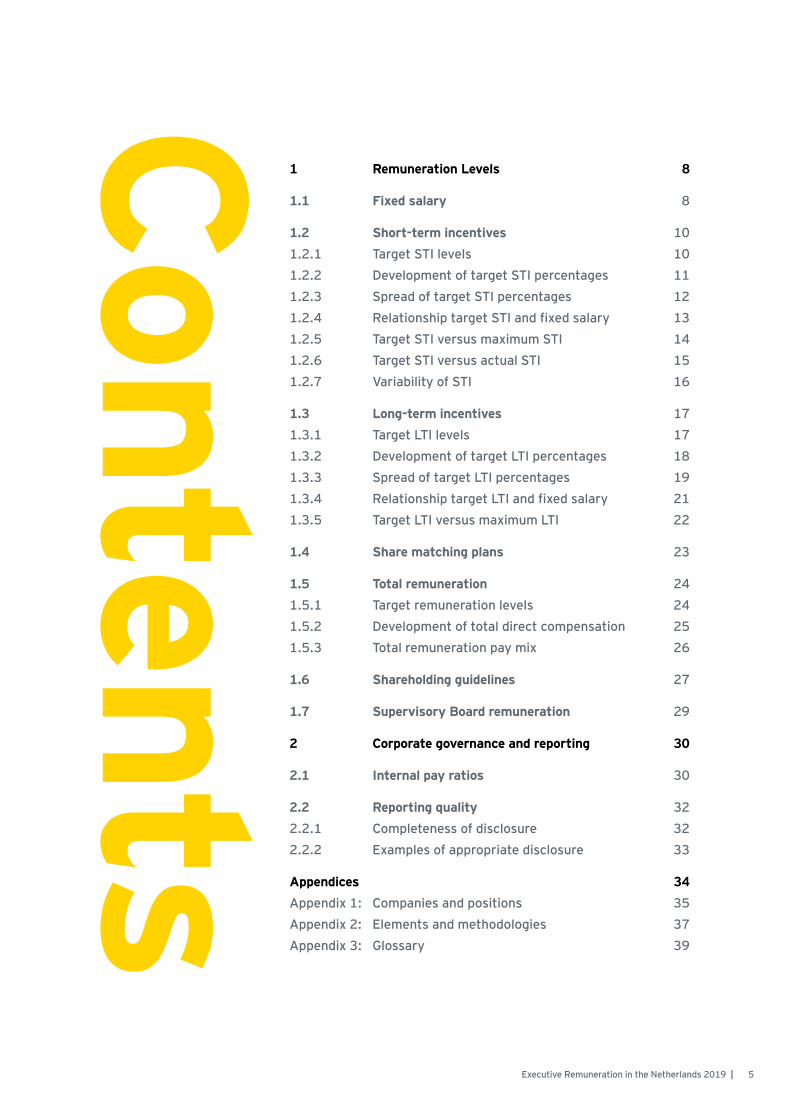
Contents
1 Remuneration Levels 8
1.1 Fixed salary 8
1.2 Short-term incentives 10 1.2.1 Target STI levels 101.2.2 Development of target STI percentages 11 1.2.3 Spread of target STI percentages 121.2.4 Relationship target STI and fixed salary 13 1.2.5 Target STI versus maximum STI 141.2.6 Target STI versus actual STI 151.2.7 Variability of STI 16
1.3 Long-term incentives 171.3.1 Target LTI levels 171.3.2 Development of target LTI percentages 18 1.3.3 Spread of target LTI percentages 191.3.4 Relationship target LTI and fixed salary 211.3.5 Target LTI versus maximum LTI 22
1.4 Share matching plans 23
1.5 Total remuneration 241.5.1 Target remuneration levels 241.5.2 Development of total direct compensation 25 1.5.3 Total remuneration pay mix 26
1.6 Shareholding guidelines 27
1.7 Supervisory Board remuneration 29
2 Corporate governance and reporting 30
2.1 Internal pay ratios 30
2.2 Reporting quality 322.2.1 Completeness of disclosure 322.2.2 Examples of appropriate disclosure 33
Appendices 34 Appendix 1: Companies and positions 35Appendix 2: Elements and methodologies 37Appendix 3: Glossary 39
5Executive Remuneration in the Netherlands 2019 |
About this report
EY’s 2019 Executive Remuneration Report provides insights into trends in executive remuneration levels and practices over the last three years. Furthermore, the report offers interesting views and perspectives on reporting quality.
Compared to last year, we extended the report with an analysis of share matching plans. We decided not to report on pension schemes or key performance indicators due to the relatively minor changes observed from year-to-year. A detailed analysis of these elements will be presented in next year’s report.
The application of the revised Dutch Corporate Governance Code on remuneration reports remains a challenge. The introduction of the revised European Share-holder’s rights directive will even enlarge this challenge. To share insights into better practices, we identify several examples of appropriate disclosure on different elements.
The data and analyses contained in this report are based on information from the annual reports of 2016, 2017 and 2018 of companies listed in the Dutch AEX, AMX or AScX. A list of the companies included in the analysis as well as information on numbers of incumbents and companies per reported position are provided in Appendix 1. A glossary of terms is provided in Appendix 3.
This report is intended to provide insight into trends in executive remuneration levels and practices of companies listed on the Amsterdam Stock Exchange. It is not intended to be used as a benchmarking tool. A tailored analysis of the data presented in this report is available by request.
EY is happy to share these results with clients, business relations and others who have an interest in the Dutch world of executive remuneration. EY’s Executive Remuneration Team is available for further information.
Jan van DurenAssociate Partner, People Advisory Services
6 | Executive Remuneration in the Netherlands 2019

EY’s Executive Remuneration Team
About EY’s Executive Remuneration TeamOver the past fifteen years, EY’s Dutch and Global Reward practice has become an important player on the remuneration market. Executive remuneration is a truly international discipline at EY, and this has enabled us to grow substantially and achieve market leadership in some of the largest economies in the world.
Our experience in advising and working with the Netherlands’ largest companies gives us the knowledge to help you build, implement and maintain best-fit reward programs aligned with your corporate strategy. Our clients benefit from fully integrated advice.
Jan van Duren Associate Partner Reward Services
Lennart Cox Consultant Reward Services
Stephan van de Groep Senior Manager Reward Services
Melina Vinberg Hjalmarsson Consultant Reward Services
Hilleke Booij Manager Reward Services
7Executive Remuneration in the Netherlands 2019 |
Contact us via [email protected] or by phone at +316 5544 2484
1. Remuneration Levels
1.1 Fixed salary
In analyzing fixed salary levels from 2016 to 2018, we have chosen to use all data points rather than focusing on a same-sample analysis. Therefore, the reported salary levels (see table below) include the effect of salary increases for existing executives, the effect of changing salary levels due to replacements, and the effect of different salary levels due to company changes within the index.
When a position is replaced, we see that the newly appointed executive does not always receive the same salary as their predecessor. Both slightly lower salaries and significantly higher salary levels can be observed among new executives.
This section provides insight into the remuneration levels for CEOs, CFOs and other board members (OMs) at AEX, AMX and AScX companies over the period from 2016 until 2018. Because a relatively small number of the companies in our sample reported on the remuneration of OMs on the board, the data presented for OMs in this report is less robust than the data presented for CEO and CFO positions. For this reason, we have excluded the OM position in some of our analyses, similar to our earlier reports. We have additionally excluded financial sector companies in some of our analyses, because these firms are legally required to maximize the variable pay opportunity for executives at 20% of fixed salary.
8 | Executive Remuneration in the Netherlands 2019
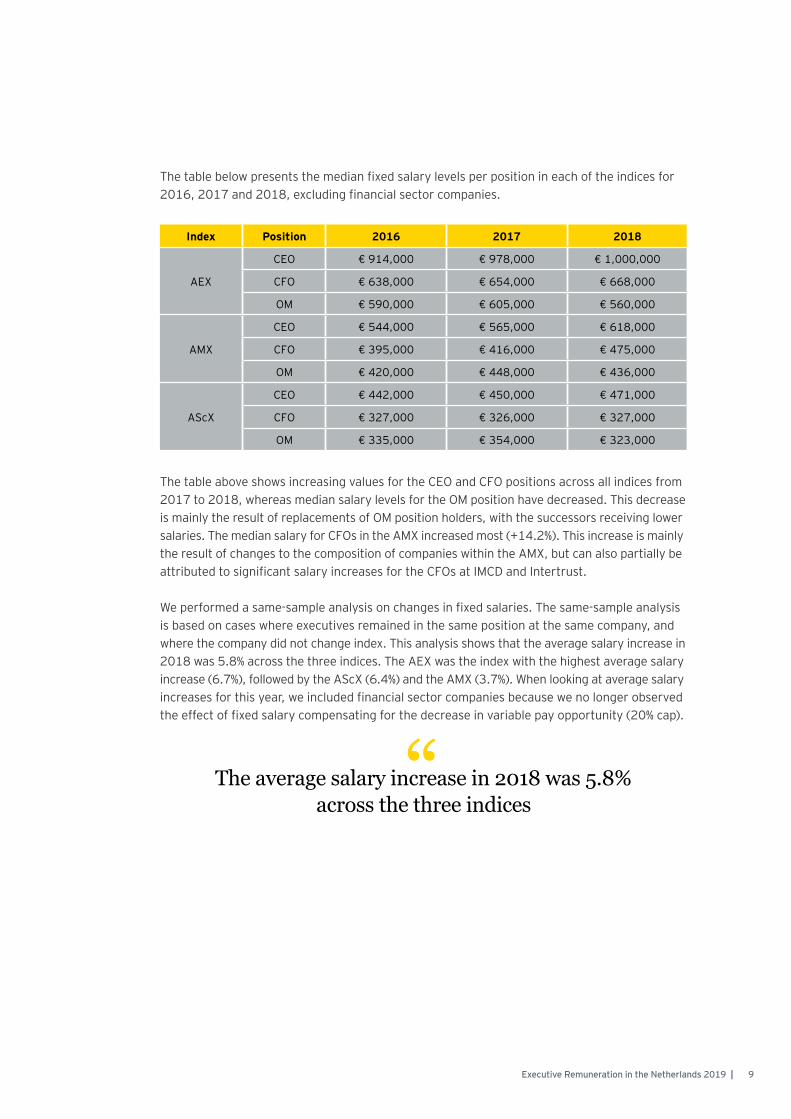
The table below presents the median fixed salary levels per position in each of the indices for 2016, 2017 and 2018, excluding financial sector companies.
The table above shows increasing values for the CEO and CFO positions across all indices from 2017 to 2018, whereas median salary levels for the OM position have decreased. This decrease is mainly the result of replacements of OM position holders, with the successors receiving lower salaries. The median salary for CFOs in the AMX increased most (+14.2%). This increase is mainly the result of changes to the composition of companies within the AMX, but can also partially be attributed to significant salary increases for the CFOs at IMCD and Intertrust.
We performed a same-sample analysis on changes in fixed salaries. The same-sample analysis is based on cases where executives remained in the same position at the same company, and where the company did not change index. This analysis shows that the average salary increase in 2018 was 5.8% across the three indices. The AEX was the index with the highest average salary increase (6.7%), followed by the AScX (6.4%) and the AMX (3.7%). When looking at average salary increases for this year, we included financial sector companies because we no longer observed the effect of fixed salary compensating for the decrease in variable pay opportunity (20% cap).
Index Position 2016 2017 2018
AEX
CEO € 914,000 € 978,000 € 1,000,000
CFO € 638,000 € 654,000 € 668,000
OM € 590,000 € 605,000 € 560,000
AMX
CEO € 544,000 € 565,000 € 618,000
CFO € 395,000 € 416,000 € 475,000
OM € 420,000 € 448,000 € 436,000
AScX
CEO € 442,000 € 450,000 € 471,000
CFO € 327,000 € 326,000 € 327,000
OM € 335,000 € 354,000 € 323,000
“The average salary increase in 2018 was 5.8% across the three indices
9Executive Remuneration in the Netherlands 2019 |
1.2 Short-term incentives
Short-term incentive levels as reported in each year relate to performance over that one-year period. In this section, we focus on the target STI levels (as a percentage of base salary) and compare these to the maximum and actual STI values (as a percentage of base salary).
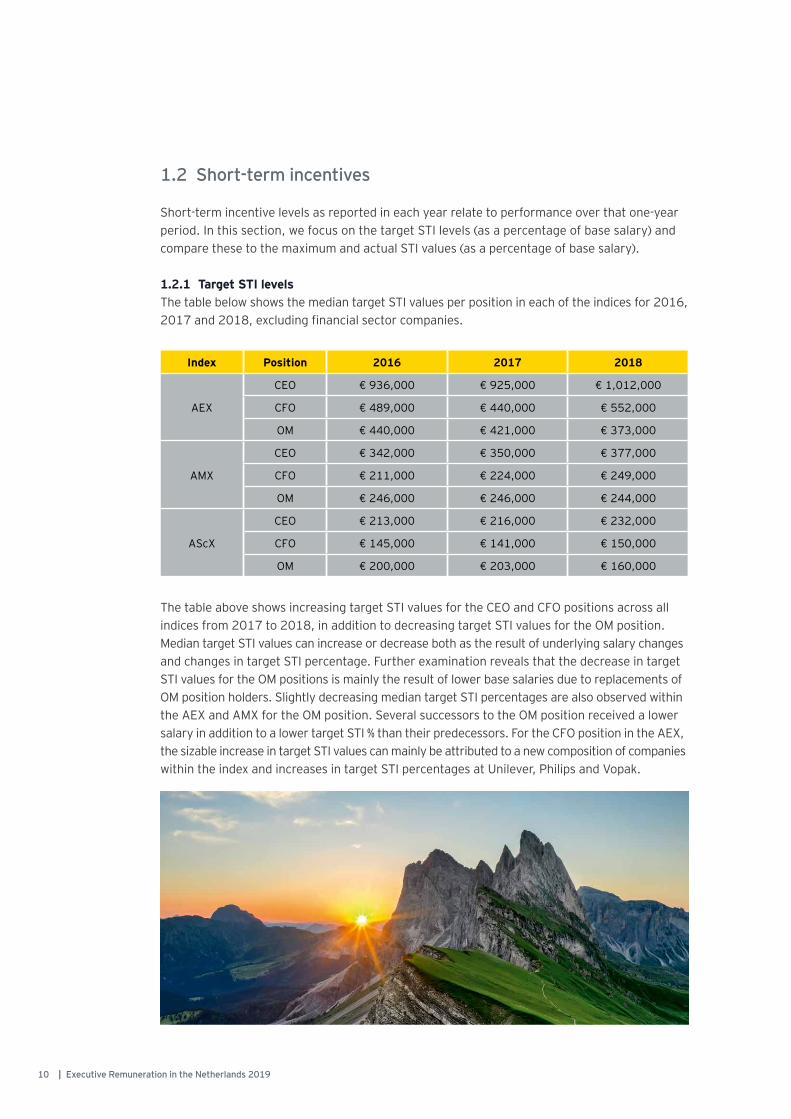
1.2.1 Target STI levelsThe table below shows the median target STI values per position in each of the indices for 2016, 2017 and 2018, excluding financial sector companies.
The table above shows increasing target STI values for the CEO and CFO positions across all indices from 2017 to 2018, in addition to decreasing target STI values for the OM position. Median target STI values can increase or decrease both as the result of underlying salary changes and changes in target STI percentage. Further examination reveals that the decrease in target STI values for the OM positions is mainly the result of lower base salaries due to replacements of OM position holders. Slightly decreasing median target STI percentages are also observed within the AEX and AMX for the OM position. Several successors to the OM position received a lower salary in addition to a lower target STI % than their predecessors. For the CFO position in the AEX, the sizable increase in target STI values can mainly be attributed to a new composition of companies within the index and increases in target STI percentages at Unilever, Philips and Vopak.
Index Position 2016 2017 2018
AEX
CEO € 936,000 € 925,000 € 1,012,000
CFO € 489,000 € 440,000 € 552,000
OM € 440,000 € 421,000 € 373,000
AMX
CEO € 342,000 € 350,000 € 377,000
CFO € 211,000 € 224,000 € 249,000
OM € 246,000 € 246,000 € 244,000
AScX
CEO € 213,000 € 216,000 € 232,000
CFO € 145,000 € 141,000 € 150,000
OM € 200,000 € 203,000 € 160,000
10 | Executive Remuneration in the Netherlands 2019
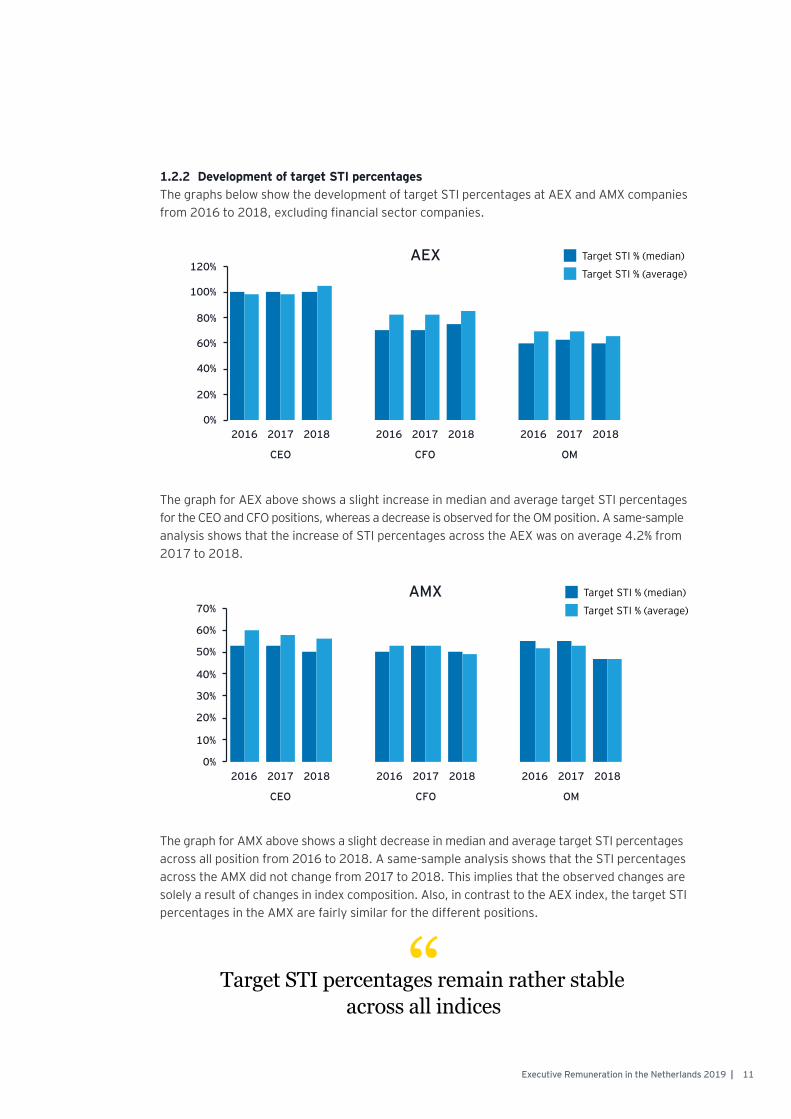
1.2.2 Development of target STI percentagesThe graphs below show the development of target STI percentages at AEX and AMX companies from 2016 to 2018, excluding financial sector companies.
The graph for AEX above shows a slight increase in median and average target STI percentages for the CEO and CFO positions, whereas a decrease is observed for the OM position. A same-sample analysis shows that the increase of STI percentages across the AEX was on average 4.2% from 2017 to 2018.
The graph for AMX above shows a slight decrease in median and average target STI percentages across all position from 2016 to 2018. A same-sample analysis shows that the STI percentages across the AMX did not change from 2017 to 2018. This implies that the observed changes are solely a result of changes in index composition. Also, in contrast to the AEX index, the target STI percentages in the AMX are fairly similar for the different positions.
AEX
AMX
“Target STI percentages remain rather stable across all indices
Target STI % (median)
Target STI % (average)
Target STI % (median)
Target STI % (average)
11Executive Remuneration in the Netherlands 2019 |
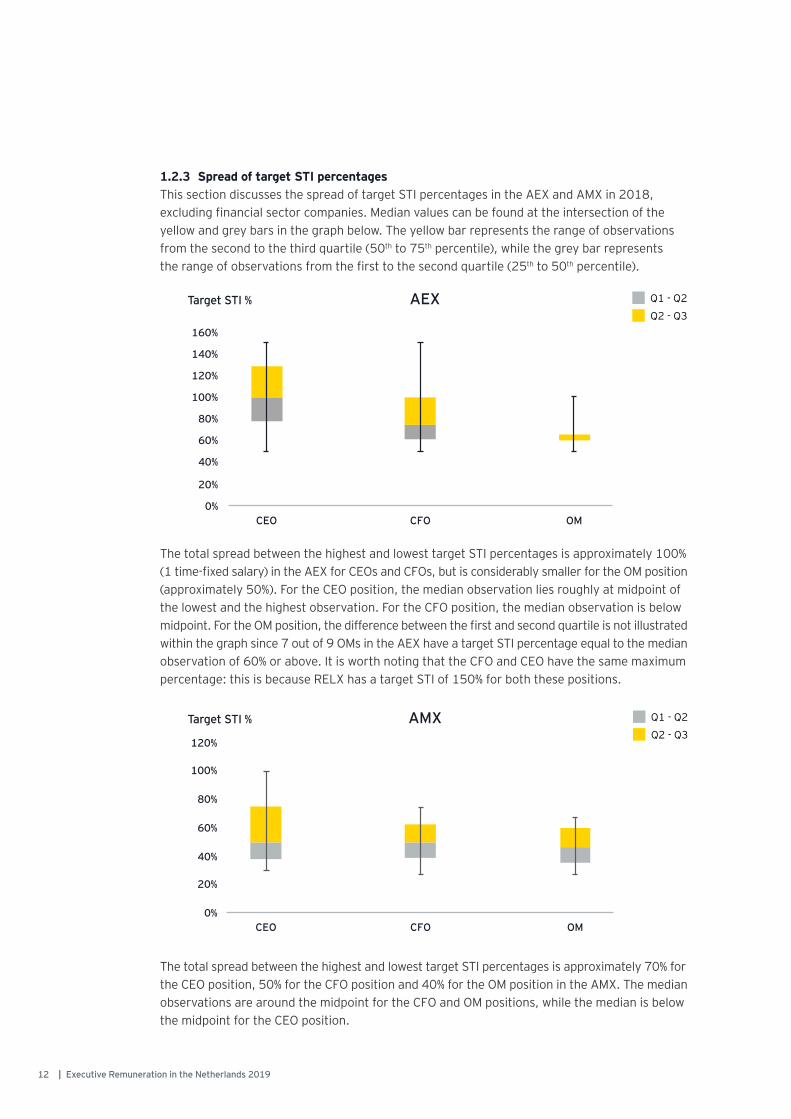
1.2.3 Spread of target STI percentagesThis section discusses the spread of target STI percentages in the AEX and AMX in 2018, excluding financial sector companies. Median values can be found at the intersection of the yellow and grey bars in the graph below. The yellow bar represents the range of observations from the second to the third quartile (50th to 75th percentile), while the grey bar represents the range of observations from the first to the second quartile (25th to 50th percentile).
The total spread between the highest and lowest target STI percentages is approximately 100% (1 time-fixed salary) in the AEX for CEOs and CFOs, but is considerably smaller for the OM position (approximately 50%). For the CEO position, the median observation lies roughly at midpoint of the lowest and the highest observation. For the CFO position, the median observation is below midpoint. For the OM position, the difference between the first and second quartile is not illustrated within the graph since 7 out of 9 OMs in the AEX have a target STI percentage equal to the median observation of 60% or above. It is worth noting that the CFO and CEO have the same maximum percentage: this is because RELX has a target STI of 150% for both these positions.
The total spread between the highest and lowest target STI percentages is approximately 70% for the CEO position, 50% for the CFO position and 40% for the OM position in the AMX. The median observations are around the midpoint for the CFO and OM positions, while the median is below the midpoint for the CEO position.
Target STI %
Target STI %
Q2 - Q3
Q1 - Q2
Q2 - Q3
Q1 - Q2AMX
AEX
12 | Executive Remuneration in the Netherlands 2019
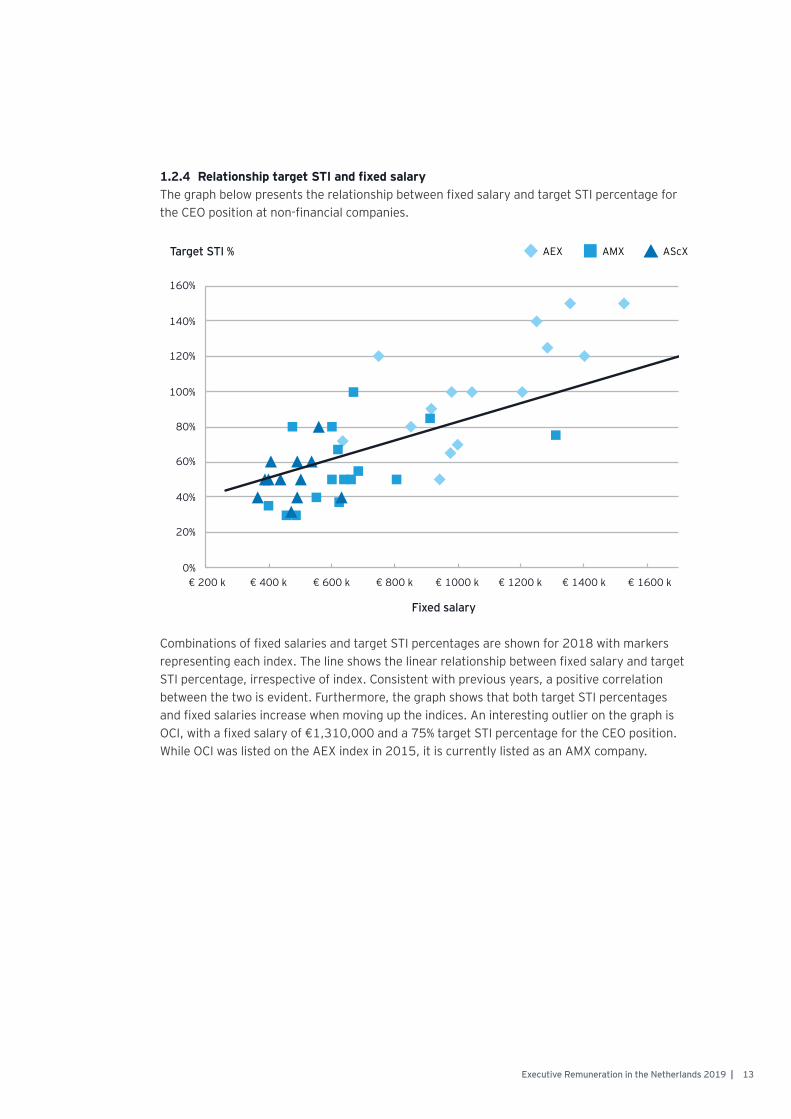
1.2.4 Relationship target STI and fixed salaryThe graph below presents the relationship between fixed salary and target STI percentage for the CEO position at non-financial companies.
Combinations of fixed salaries and target STI percentages are shown for 2018 with markers representing each index. The line shows the linear relationship between fixed salary and target STI percentage, irrespective of index. Consistent with previous years, a positive correlation between the two is evident. Furthermore, the graph shows that both target STI percentages and fixed salaries increase when moving up the indices. An interesting outlier on the graph is OCI, with a fixed salary of €1,310,000 and a 75% target STI percentage for the CEO position. While OCI was listed on the AEX index in 2015, it is currently listed as an AMX company.
AEX AScXTarget STI %
Fixed salary
AMX
13Executive Remuneration in the Netherlands 2019 |
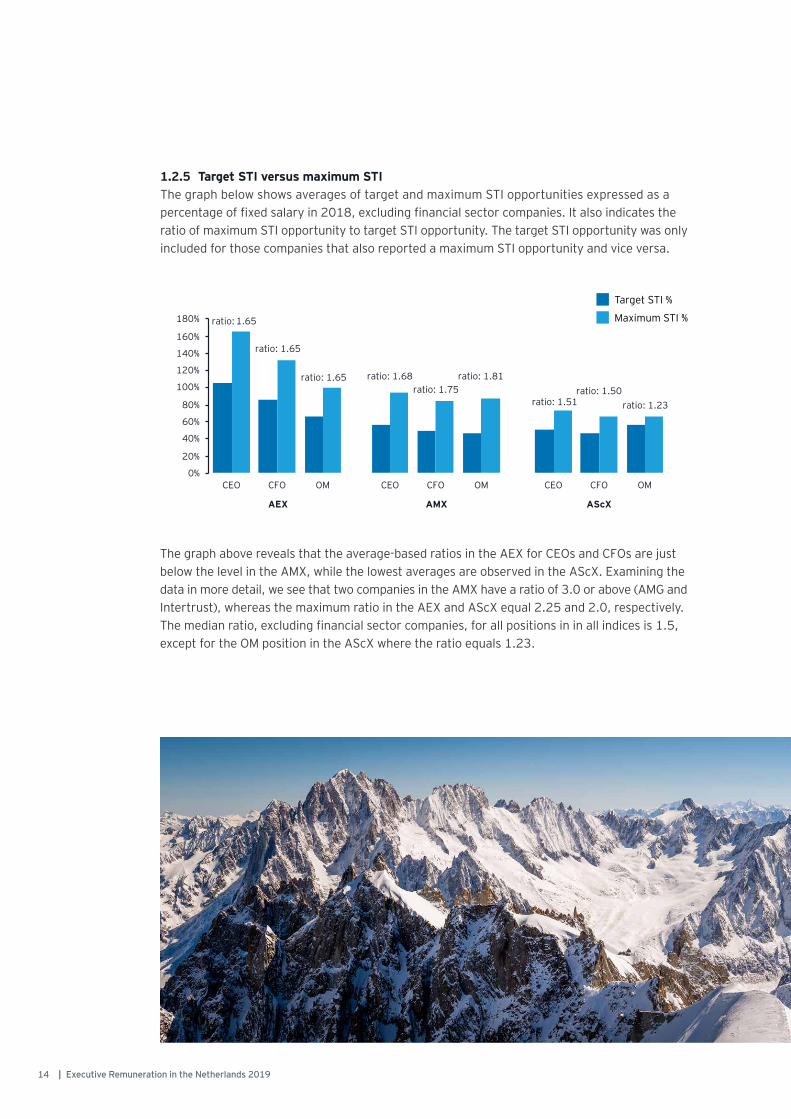
1.2.5 Target STI versus maximum STIThe graph below shows averages of target and maximum STI opportunities expressed as a percentage of fixed salary in 2018, excluding financial sector companies. It also indicates the ratio of maximum STI opportunity to target STI opportunity. The target STI opportunity was only included for those companies that also reported a maximum STI opportunity and vice versa.
The graph above reveals that the average-based ratios in the AEX for CEOs and CFOs are just below the level in the AMX, while the lowest averages are observed in the AScX. Examining the data in more detail, we see that two companies in the AMX have a ratio of 3.0 or above (AMG and Intertrust), whereas the maximum ratio in the AEX and AScX equal 2.25 and 2.0, respectively. The median ratio, excluding financial sector companies, for all positions in in all indices is 1.5, except for the OM position in the AScX where the ratio equals 1.23.
Target STI %
Maximum STI %
14 | Executive Remuneration in the Netherlands 2019
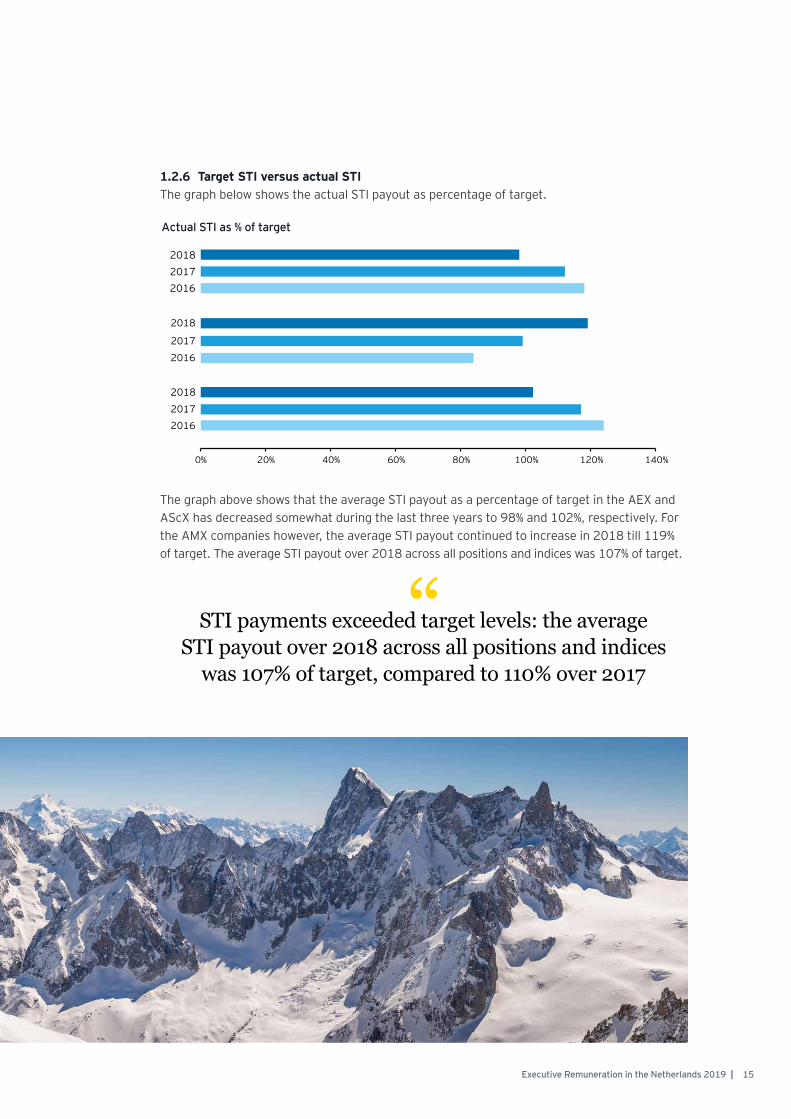
1.2.6 Target STI versus actual STI The graph below shows the actual STI payout as percentage of target.
The graph above shows that the average STI payout as a percentage of target in the AEX and AScX has decreased somewhat during the last three years to 98% and 102%, respectively. For the AMX companies however, the average STI payout continued to increase in 2018 till 119% of target. The average STI payout over 2018 across all positions and indices was 107% of target.
“STI payments exceeded target levels: the average STI payout over 2018 across all positions and indices
was 107% of target, compared to 110% over 2017
Actual STI as % of target
15Executive Remuneration in the Netherlands 2019 |
1.2.7 Variability of STI This section discusses the spread in actual STI payout as a percentage of target (Actual/Target STI ratio) in 2018. The table below shows the percentage of incumbents who received at least the specified percentage of their target STI opportunity.
Index PositionActual/Target STI ratio spread 2018
0% < 50% < 100 % < 150% < 200% Average
AEX
CEO 5% 5% 32% 89% 100% 101%
CFO 6% 12% 41% 88% 100% 98%
OM 11% 11% 44% 89% 100% 93%
AMX
CEO 0% 18% 41% 76% 88% 124%
CFO 0% 20% 47% 73% 87% 118%
OM 0% 18% 64% 73% 82% 115%
AScX
CEO 0% 0% 46% 92% 100% 105%
CFO 0% 8% 54% 92% 100% 101%
OM 0% 0% 75% 100% 100% 96%
For illustration purposes, 27% (32% minus 5%) of CEOs in the AEX received an STI payout between 50% and 100% of target, while 57% (89% minus 32%) of CEOs in the AEX received an STI payout between 100% and 150% of target. The table above shows that 12% of CEOs in the AMX received an STI amount of at least 200% of target, which were the CEOs of AMG and Intertrust.
16 | Executive Remuneration in the Netherlands 2019
1.3 Long-term incentives
Long-term incentives are offered to executives to increase focus on the longer term and thereby align the interests of executives with those of companies’ (long-term) shareholders. It is common practice for long-term incentives to be granted conditionally and become unconditional after 3 years based on the executive’s performance over these 3 years. Long-term incentives are often granted in shares but may also be granted in cash. When granted in shares an additional lock-up or holding period of 2 years usually applies before executives can actually sell or cash in on their LTI rights. This means that the most common cycle for LTI plans from grant to cash is 5 years. This is in accordance with the Dutch Corporate Governance Code.
It is important to note that the reported LTI data for AScX companies is less robust than the reported data on base salary and STI. This is due to the fact that a minority of AScX companies reported a fixed target or maximum LTI as a percentage of base salary.
The median target LTI values have decreased within the AEX index from 2017 to 2018, which is also the case for the OM position in the AMX and AScX. The decreasing amounts in the AEX are the result of a new composition of companies in the index, but can also be attributed to Unilever discontinuing its LTI scheme while increasing the value of their share matching plan. Share matching plans are not considered part of the reported STI or LTI values. For the OM position, the reported changes are the result of changes in board composition or a new composition of the indices. The increasing target LTI values for the CEO (14.9%) and CFO position (11.7%) within the AMX index are mainly a result of a new composition of companies in the index, in addition to an increase in base salaries and target LTI percentages at IMCD.
Index Position 2016 2017 2018
AEX
CEO € 1,292,000 € 1,249,000 € 1,235,000
CFO € 668,000 € 804,000 € 749,000
OM € 582,000 € 634,000 € 619,000
AMX
CEO € 520,000 € 522,000 € 600,000
CFO € 321,000 € 291,000 € 325,000
OM € 288,000 € 326,000 € 287,000
AScX
CEO € 226,000 € 231,000 € 241,000
CFO € 164,000 € 147,000 € 150,000
OM € 183,000 € 183,000 € 156,000
1.3.1 Target LTI levelsThe table below shows the median target LTI values per position in each of the indices for 2016, 2017 and 2018, excluding financial sector companies.
17Executive Remuneration in the Netherlands 2019 |
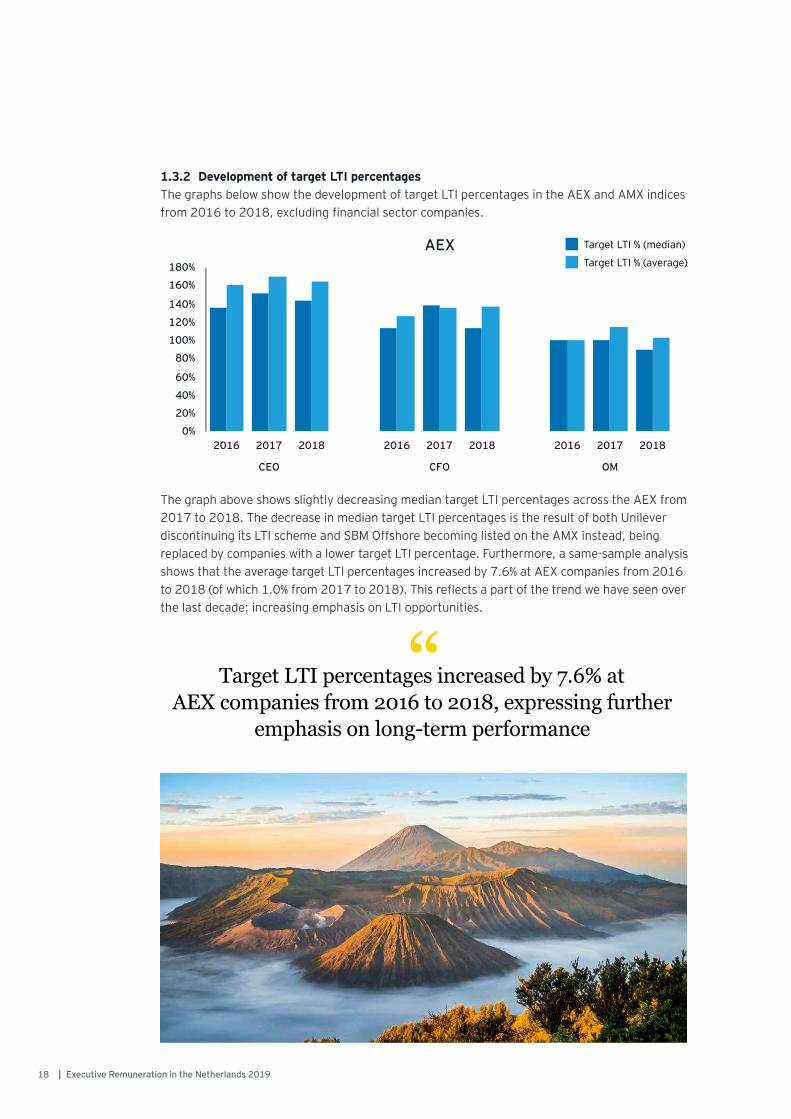
1.3.2 Development of target LTI percentagesThe graphs below show the development of target LTI percentages in the AEX and AMX indices from 2016 to 2018, excluding financial sector companies.
The graph above shows slightly decreasing median target LTI percentages across the AEX from 2017 to 2018. The decrease in median target LTI percentages is the result of both Unilever discontinuing its LTI scheme and SBM Offshore becoming listed on the AMX instead, being replaced by companies with a lower target LTI percentage. Furthermore, a same-sample analysis shows that the average target LTI percentages increased by 7.6% at AEX companies from 2016 to 2018 (of which 1.0% from 2017 to 2018). This reflects a part of the trend we have seen over the last decade: increasing emphasis on LTI opportunities.
“Target LTI percentages increased by 7.6% at AEX companies from 2016 to 2018, expressing further
emphasis on long-term performance
Target LTI % (median)
Target LTI % (average)AEX
18 | Executive Remuneration in the Netherlands 2019
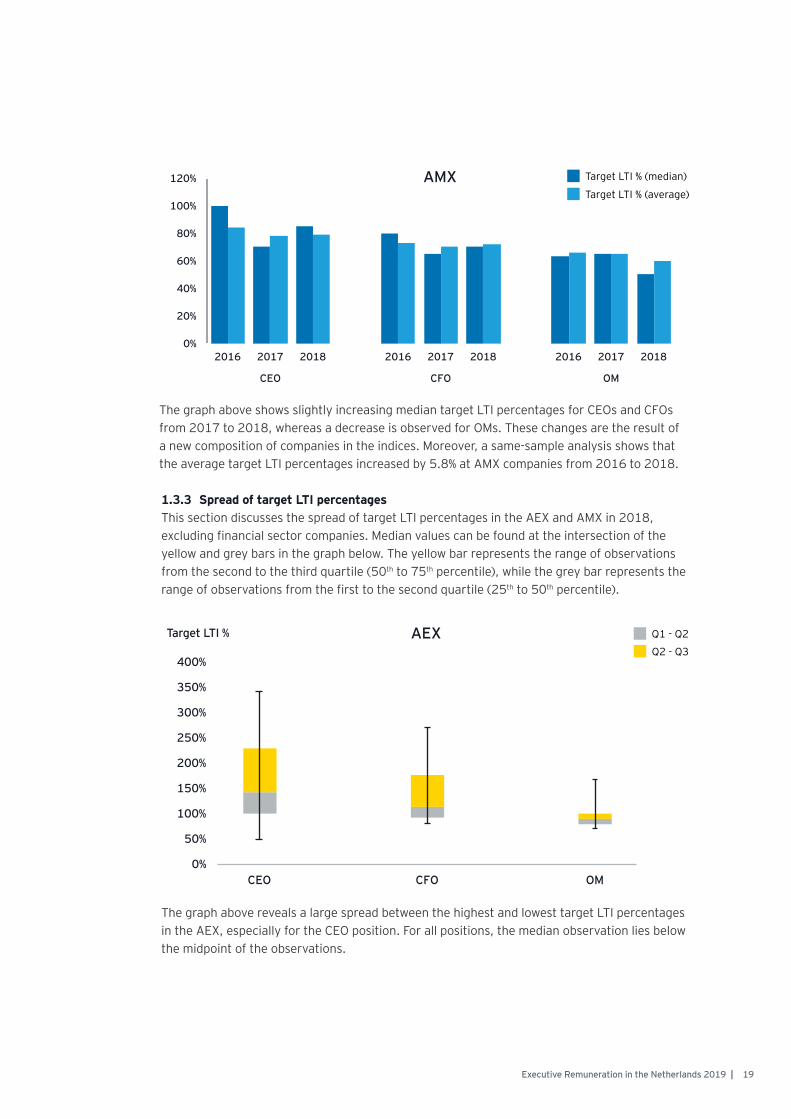
The graph above shows slightly increasing median target LTI percentages for CEOs and CFOs from 2017 to 2018, whereas a decrease is observed for OMs. These changes are the result of a new composition of companies in the indices. Moreover, a same-sample analysis shows that the average target LTI percentages increased by 5.8% at AMX companies from 2016 to 2018.
1.3.3 Spread of target LTI percentagesThis section discusses the spread of target LTI percentages in the AEX and AMX in 2018, excluding financial sector companies. Median values can be found at the intersection of the yellow and grey bars in the graph below. The yellow bar represents the range of observations from the second to the third quartile (50th to 75th percentile), while the grey bar represents the range of observations from the first to the second quartile (25th to 50th percentile).
The graph above reveals a large spread between the highest and lowest target LTI percentages in the AEX, especially for the CEO position. For all positions, the median observation lies below the midpoint of the observations.
Target LTI % (median)
Target LTI % (average)
Q2 - Q3
Target LTI % Q1 - Q2AEX
AMX
19Executive Remuneration in the Netherlands 2019 |
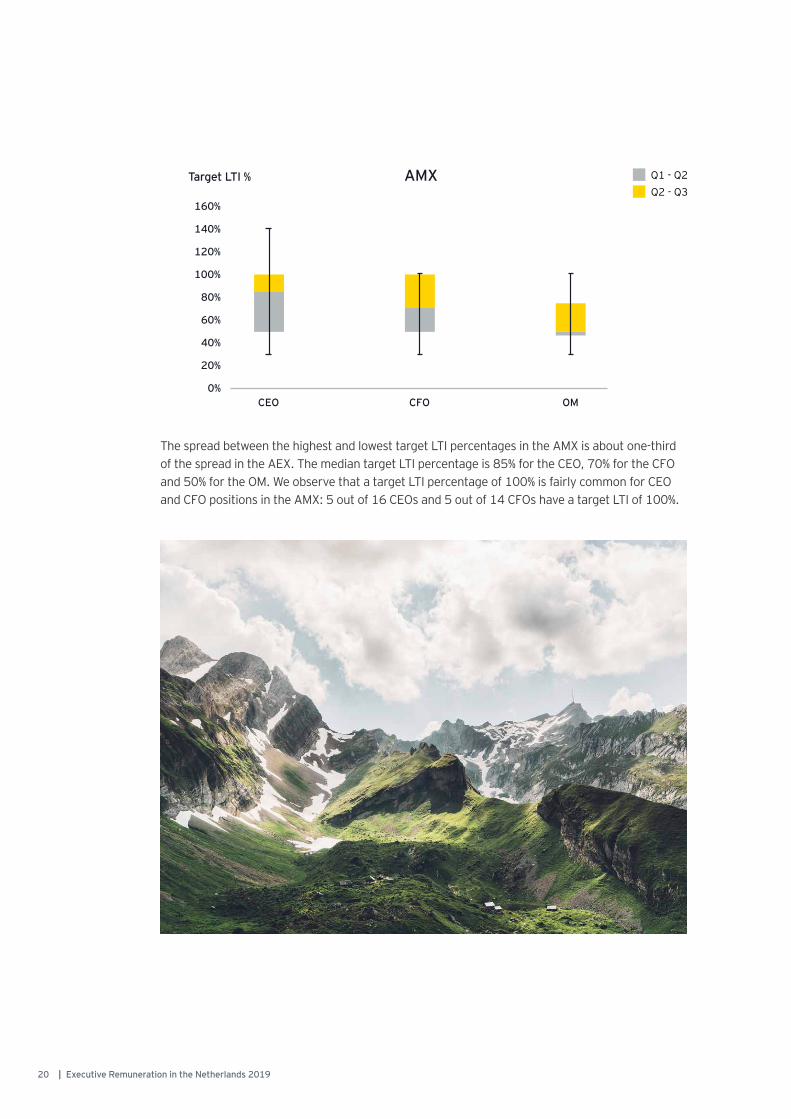
The spread between the highest and lowest target LTI percentages in the AMX is about one-third of the spread in the AEX. The median target LTI percentage is 85% for the CEO, 70% for the CFO and 50% for the OM. We observe that a target LTI percentage of 100% is fairly common for CEO and CFO positions in the AMX: 5 out of 16 CEOs and 5 out of 14 CFOs have a target LTI of 100%.
Target LTI %Q2 - Q3Q1 - Q2AMX
20 | Executive Remuneration in the Netherlands 2019
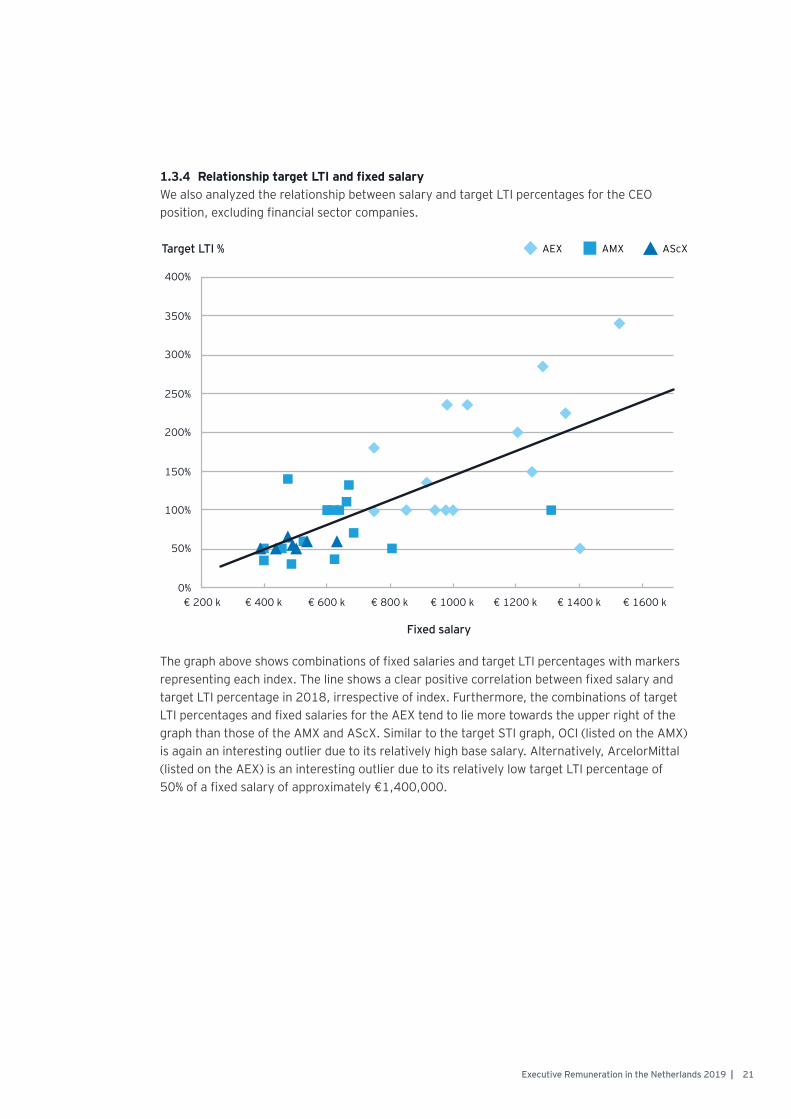
1.3.4 Relationship target LTI and fixed salaryWe also analyzed the relationship between salary and target LTI percentages for the CEO position, excluding financial sector companies.
The graph above shows combinations of fixed salaries and target LTI percentages with markers representing each index. The line shows a clear positive correlation between fixed salary and target LTI percentage in 2018, irrespective of index. Furthermore, the combinations of target LTI percentages and fixed salaries for the AEX tend to lie more towards the upper right of the graph than those of the AMX and AScX. Similar to the target STI graph, OCI (listed on the AMX) is again an interesting outlier due to its relatively high base salary. Alternatively, ArcelorMittal (listed on the AEX) is an interesting outlier due to its relatively low target LTI percentage of 50% of a fixed salary of approximately €1,400,000.
AEX AScXTarget LTI %
Fixed salary
AMX
21Executive Remuneration in the Netherlands 2019 |
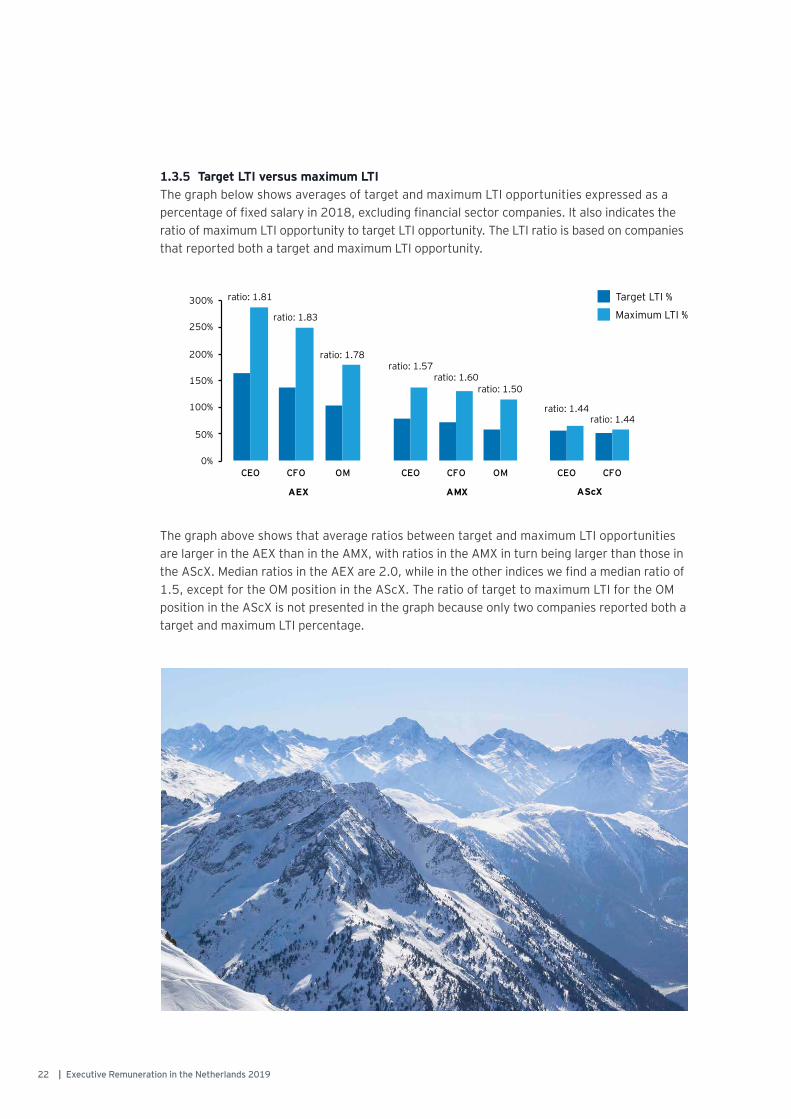
1.3.5 Target LTI versus maximum LTIThe graph below shows averages of target and maximum LTI opportunities expressed as a percentage of fixed salary in 2018, excluding financial sector companies. It also indicates the ratio of maximum LTI opportunity to target LTI opportunity. The LTI ratio is based on companies that reported both a target and maximum LTI opportunity.
The graph above shows that average ratios between target and maximum LTI opportunities are larger in the AEX than in the AMX, with ratios in the AMX in turn being larger than those in the AScX. Median ratios in the AEX are 2.0, while in the other indices we find a median ratio of 1.5, except for the OM position in the AScX. The ratio of target to maximum LTI for the OM position in the AScX is not presented in the graph because only two companies reported both a target and maximum LTI percentage.
Target LTI %
Maximum LTI %
22 | Executive Remuneration in the Netherlands 2019
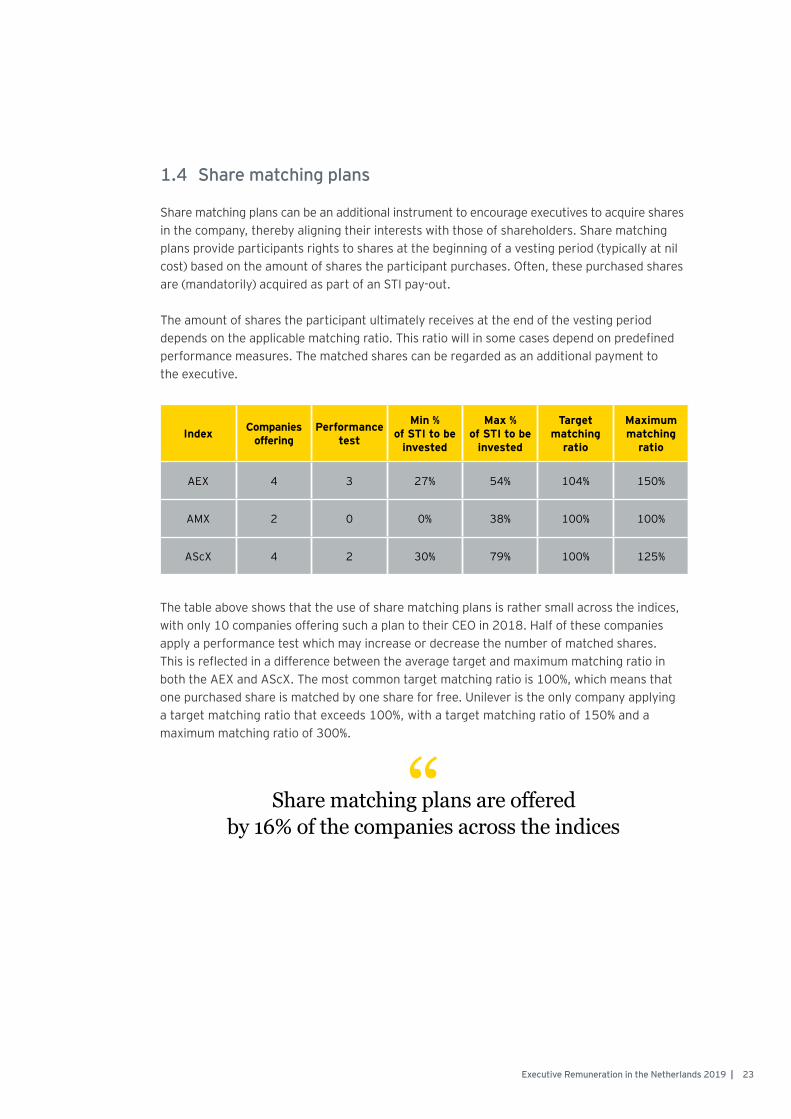
1.4 Share matching plans
Share matching plans can be an additional instrument to encourage executives to acquire shares in the company, thereby aligning their interests with those of shareholders. Share matching plans provide participants rights to shares at the beginning of a vesting period (typically at nil cost) based on the amount of shares the participant purchases. Often, these purchased shares are (mandatorily) acquired as part of an STI pay-out.
The amount of shares the participant ultimately receives at the end of the vesting period depends on the applicable matching ratio. This ratio will in some cases depend on predefined performance measures. The matched shares can be regarded as an additional payment to the executive.
The table above shows that the use of share matching plans is rather small across the indices, with only 10 companies offering such a plan to their CEO in 2018. Half of these companies apply a performance test which may increase or decrease the number of matched shares. This is reflected in a difference between the average target and maximum matching ratio in both the AEX and AScX. The most common target matching ratio is 100%, which means that one purchased share is matched by one share for free. Unilever is the only company applying a target matching ratio that exceeds 100%, with a target matching ratio of 150% and a maximum matching ratio of 300%.
Index Companies offering
Performance test
Min % of STI to be
invested
Max % of STI to be
invested
Target matching
ratio
Maximum matching
ratio
AEX 4 3 27% 54% 104% 150%
AMX 2 0 0% 38% 100% 100%
AScX 4 2 30% 79% 100% 125%
“Share matching plans are offered by 16% of the companies across the indices
23Executive Remuneration in the Netherlands 2019 |
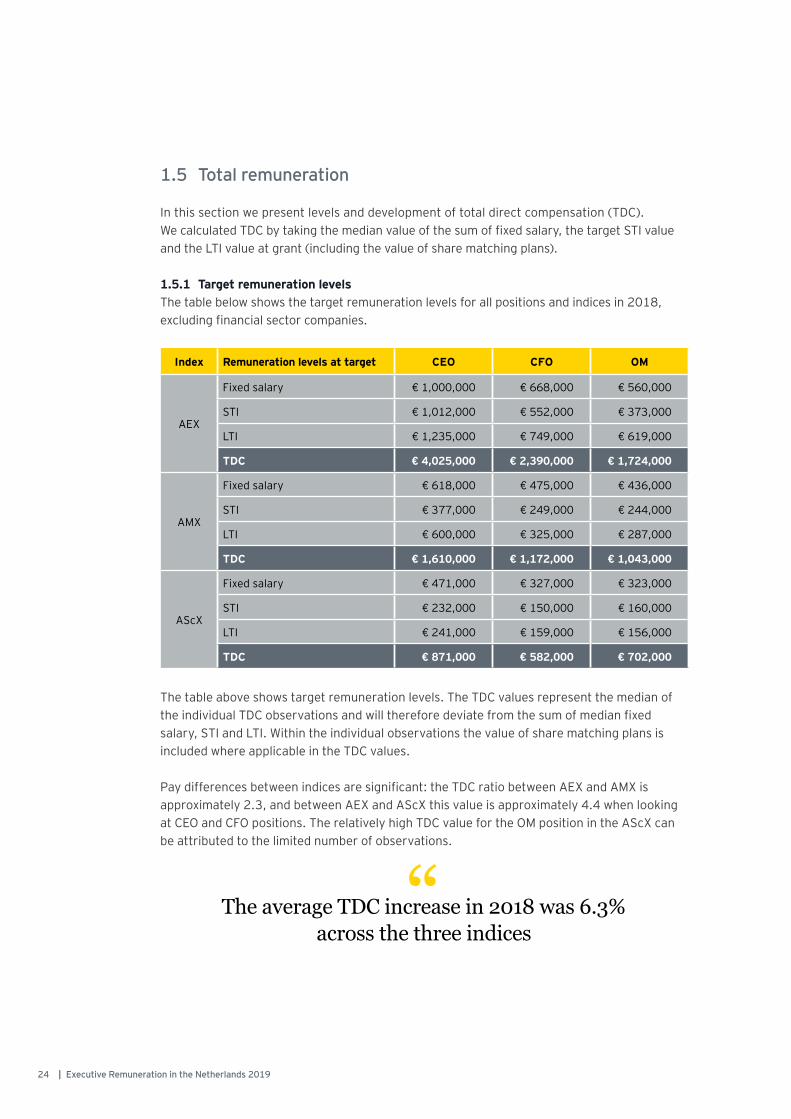
1.5 Total remuneration
In this section we present levels and development of total direct compensation (TDC). We calculated TDC by taking the median value of the sum of fixed salary, the target STI value and the LTI value at grant (including the value of share matching plans).
1.5.1 Target remuneration levelsThe table below shows the target remuneration levels for all positions and indices in 2018, excluding financial sector companies.
The table above shows target remuneration levels. The TDC values represent the median of the individual TDC observations and will therefore deviate from the sum of median fixed salary, STI and LTI. Within the individual observations the value of share matching plans is included where applicable in the TDC values.
Pay differences between indices are significant: the TDC ratio between AEX and AMX is approximately 2.3, and between AEX and AScX this value is approximately 4.4 when looking at CEO and CFO positions. The relatively high TDC value for the OM position in the AScX can be attributed to the limited number of observations.
Index Remuneration levels at target CEO CFO OM
AEX
Fixed salary € 1,000,000 € 668,000 € 560,000
STI € 1,012,000 € 552,000 € 373,000
LTI € 1,235,000 € 749,000 € 619,000
TDC € 4,025,000 € 2,390,000 € 1,724,000
AMX
Fixed salary € 618,000 € 475,000 € 436,000
STI € 377,000 € 249,000 € 244,000
LTI € 600,000 € 325,000 € 287,000
TDC € 1,610,000 € 1,172,000 € 1,043,000
AScX
Fixed salary € 471,000 € 327,000 € 323,000
STI € 232,000 € 150,000 € 160,000
LTI € 241,000 € 159,000 € 156,000
TDC € 871,000 € 582,000 € 702,000
“The average TDC increase in 2018 was 6.3% across the three indices
24 | Executive Remuneration in the Netherlands 2019
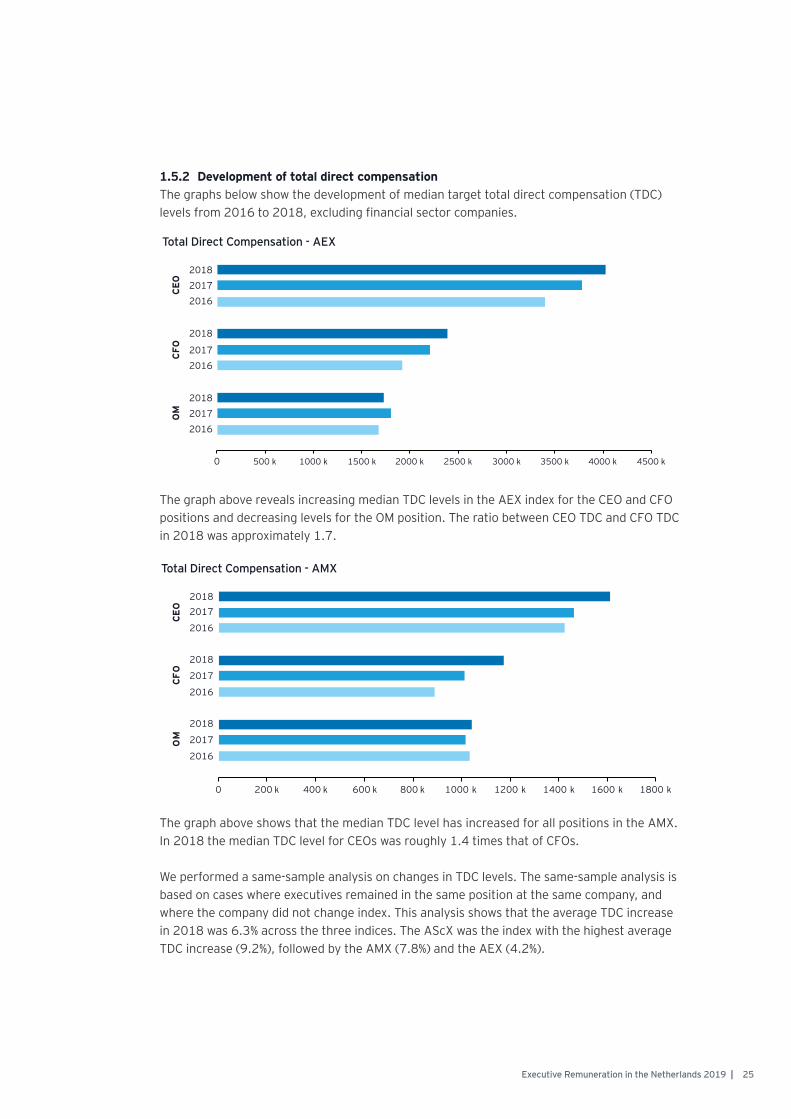
1.5.2 Development of total direct compensationThe graphs below show the development of median target total direct compensation (TDC) levels from 2016 to 2018, excluding financial sector companies.
The graph above reveals increasing median TDC levels in the AEX index for the CEO and CFO positions and decreasing levels for the OM position. The ratio between CEO TDC and CFO TDC in 2018 was approximately 1.7.
The graph above shows that the median TDC level has increased for all positions in the AMX. In 2018 the median TDC level for CEOs was roughly 1.4 times that of CFOs.
We performed a same-sample analysis on changes in TDC levels. The same-sample analysis is based on cases where executives remained in the same position at the same company, and where the company did not change index. This analysis shows that the average TDC increase in 2018 was 6.3% across the three indices. The AScX was the index with the highest average TDC increase (9.2%), followed by the AMX (7.8%) and the AEX (4.2%).
Total Direct Compensation - AEX
Total Direct Compensation - AMX
25Executive Remuneration in the Netherlands 2019 |
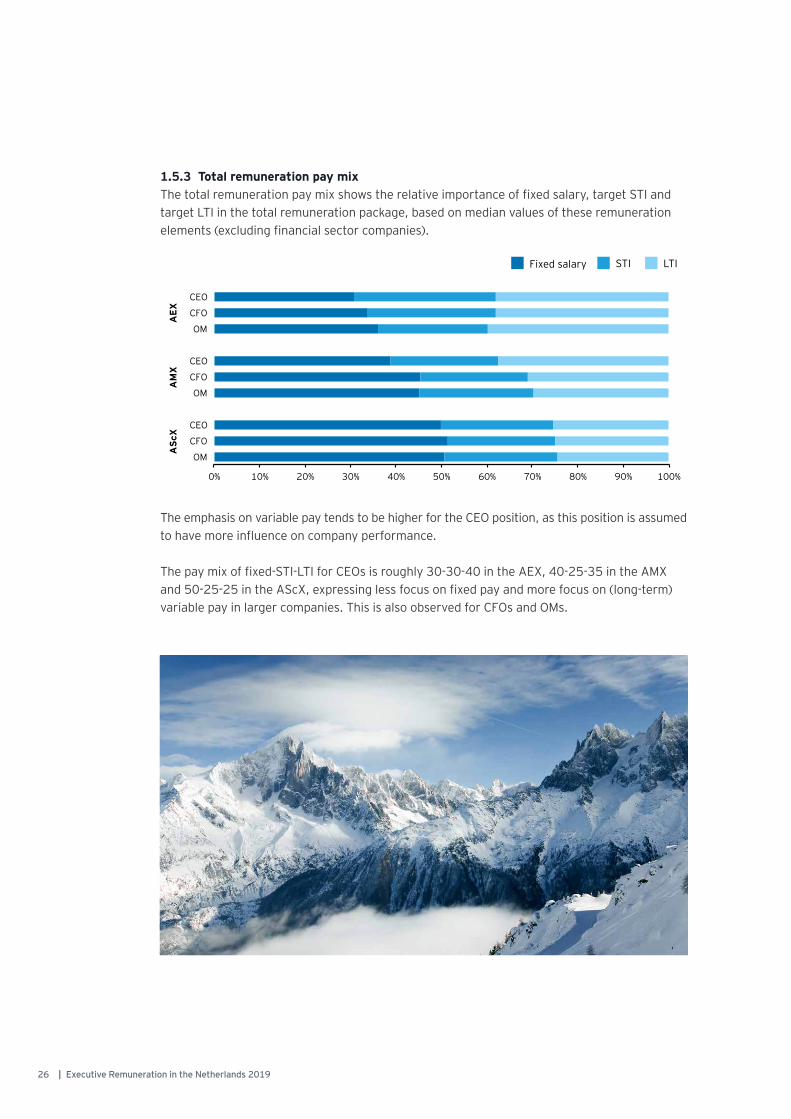
1.5.3 Total remuneration pay mix The total remuneration pay mix shows the relative importance of fixed salary, target STI and target LTI in the total remuneration package, based on median values of these remuneration elements (excluding financial sector companies).
The emphasis on variable pay tends to be higher for the CEO position, as this position is assumed to have more influence on company performance.
The pay mix of fixed-STI-LTI for CEOs is roughly 30-30-40 in the AEX, 40-25-35 in the AMX and 50-25-25 in the AScX, expressing less focus on fixed pay and more focus on (long-term) variable pay in larger companies. This is also observed for CFOs and OMs.
Fixed salary STI LTI
26 | Executive Remuneration in the Netherlands 2019
Index Position2016 2017 2018
% Use Median % Use Median % Use Median
AEX
CEO 48% 300% 48% 300% 54% 300%
CFO 50% 200% 50% 200% 59% 200%
OM 54% 150% 54% 150% 57% 125%
AMX
CEO 26% 250% 35% 250% 37% 250%
CFO 28% 150% 39% 150% 41% 150%
OM 33% 125% 33% 125% 42% 125%
AScX
CEO 13% 200% 23% 200% 30% 150%
CFO 14% 200% 24% 200% 29% 125%
OM 20% 200% 33% 200% 25% 200%
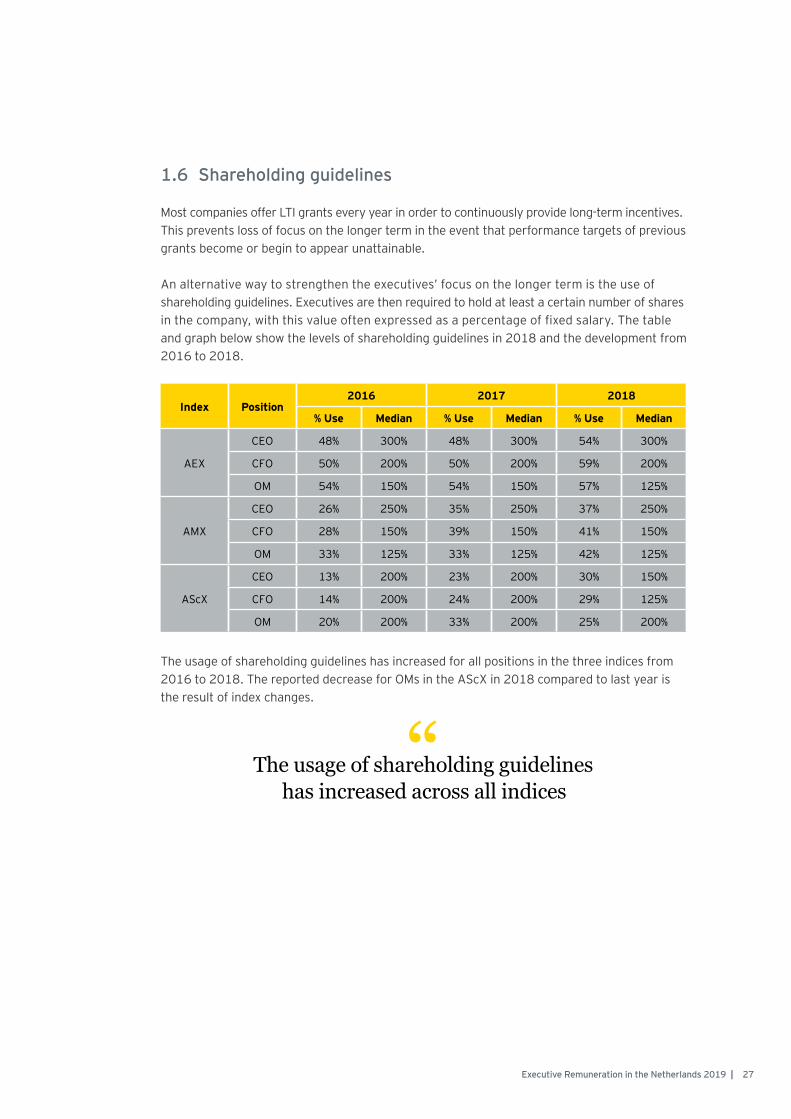
1.6 Shareholding guidelines
Most companies offer LTI grants every year in order to continuously provide long-term incentives. This prevents loss of focus on the longer term in the event that performance targets of previous grants become or begin to appear unattainable.
An alternative way to strengthen the executives’ focus on the longer term is the use of shareholding guidelines. Executives are then required to hold at least a certain number of shares in the company, with this value often expressed as a percentage of fixed salary. The table and graph below show the levels of shareholding guidelines in 2018 and the development from 2016 to 2018.
The usage of shareholding guidelines has increased for all positions in the three indices from 2016 to 2018. The reported decrease for OMs in the AScX in 2018 compared to last year is the result of index changes.
“The usage of shareholding guidelines has increased across all indices
27Executive Remuneration in the Netherlands 2019 |
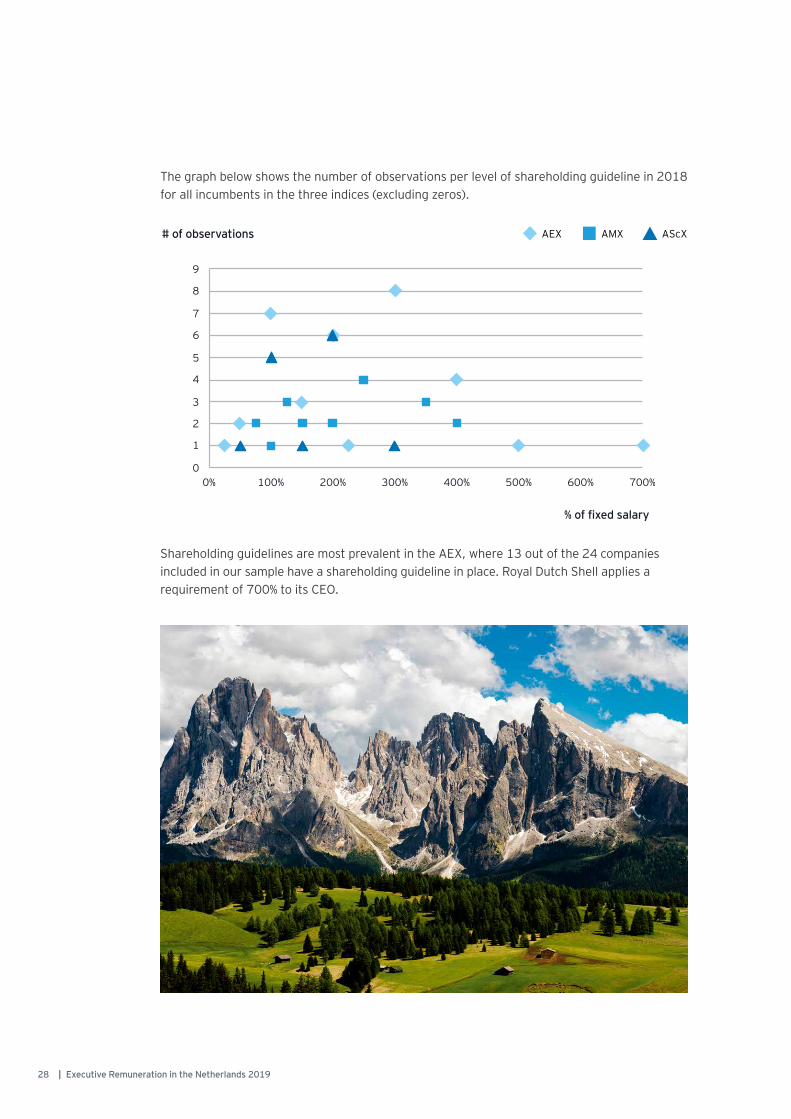
Shareholding guidelines are most prevalent in the AEX, where 13 out of the 24 companies included in our sample have a shareholding guideline in place. Royal Dutch Shell applies a requirement of 700% to its CEO.
The graph below shows the number of observations per level of shareholding guideline in 2018 for all incumbents in the three indices (excluding zeros).
AEX AScX# of observations AMX
% of fixed salary
28 | Executive Remuneration in the Netherlands 2019
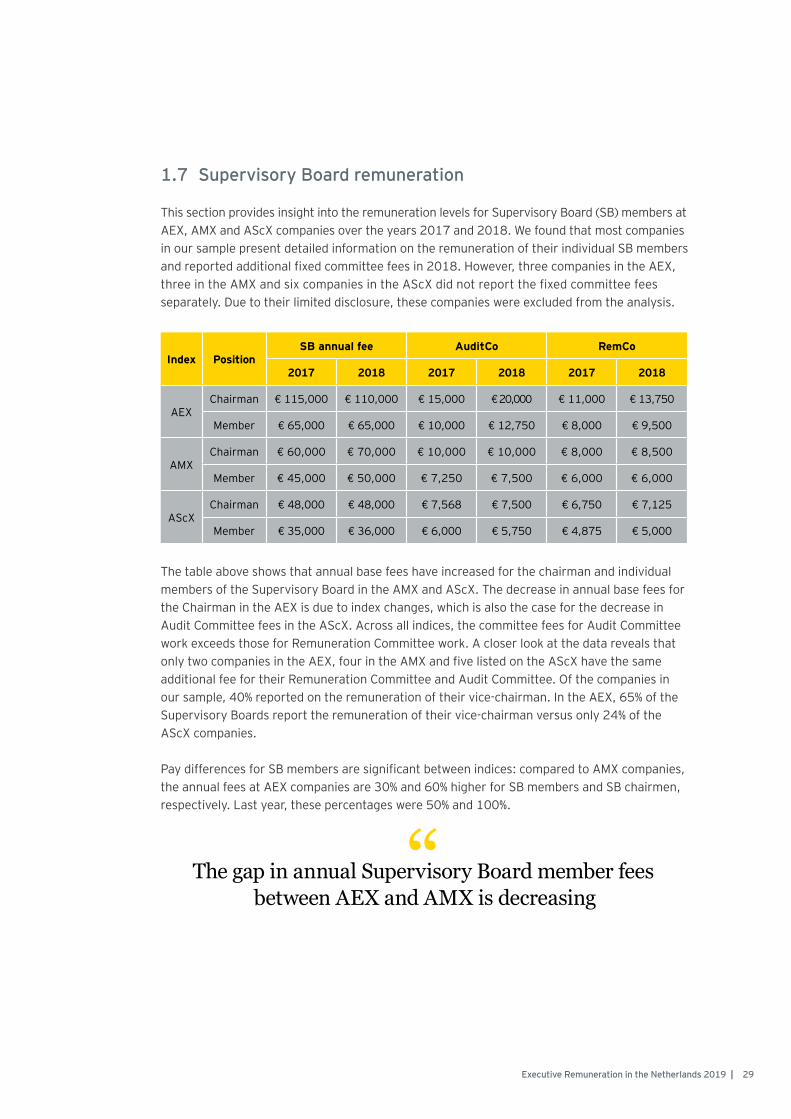
1.7 Supervisory Board remuneration
This section provides insight into the remuneration levels for Supervisory Board (SB) members at AEX, AMX and AScX companies over the years 2017 and 2018. We found that most companies in our sample present detailed information on the remuneration of their individual SB members and reported additional fixed committee fees in 2018. However, three companies in the AEX, three in the AMX and six companies in the AScX did not report the fixed committee fees separately. Due to their limited disclosure, these companies were excluded from the analysis.
Index PositionSB annual fee AuditCo RemCo
2017 2018 2017 2018 2017 2018
AEXChairman € 115,000 € 110,000 € 15,000 € 20,000 € 11,000 € 13,750
Member € 65,000 € 65,000 € 10,000 € 12,750 € 8,000 € 9,500
AMXChairman € 60,000 € 70,000 € 10,000 € 10,000 € 8,000 € 8,500
Member € 45,000 € 50,000 € 7,250 € 7,500 € 6,000 € 6,000
AScXChairman € 48,000 € 48,000 € 7,568 € 7,500 € 6,750 € 7,125
Member € 35,000 € 36,000 € 6,000 € 5,750 € 4,875 € 5,000
The table above shows that annual base fees have increased for the chairman and individual members of the Supervisory Board in the AMX and AScX. The decrease in annual base fees for the Chairman in the AEX is due to index changes, which is also the case for the decrease in Audit Committee fees in the AScX. Across all indices, the committee fees for Audit Committee work exceeds those for Remuneration Committee work. A closer look at the data reveals that only two companies in the AEX, four in the AMX and five listed on the AScX have the same additional fee for their Remuneration Committee and Audit Committee. Of the companies in our sample, 40% reported on the remuneration of their vice-chairman. In the AEX, 65% of the Supervisory Boards report the remuneration of their vice-chairman versus only 24% of the AScX companies.
Pay differences for SB members are significant between indices: compared to AMX companies, the annual fees at AEX companies are 30% and 60% higher for SB members and SB chairmen, respectively. Last year, these percentages were 50% and 100%.
“The gap in annual Supervisory Board member fees between AEX and AMX is decreasing
29Executive Remuneration in the Netherlands 2019 |
On 8 December 2016, the revised Dutch Corporate Governance Code was published. Amendments in the revised Code included the pay ratio and the inclusion of the Management Board members’ views on their own remuneration. This year, we have been evaluating multiple remuneration reports with respect to their reporting quality and compliance to the Code. This section presents our view on the overall transparency and completeness of disclosure. Finally, examples of FY18 remuneration reports are provided that give some guidance on how to disclose particular elements.
2.1 Internal pay ratios
The revised Code requires Dutch listed companies to take into account the internal pay ratios within the enterprise when formulating the remuneration policy for the Executive Board, and to disclose and discuss these ratios in the remuneration report.
A few side-notes apply before we present the results of pay ratio disclosure in 2018. First, pay ratios across industries are impacted by the varying workforces from one industry to another. Even within the same industry, comparing pay ratios is challenging due to different market conditions (e.g. mix of high- and low-paying countries) and organizational models. Second, pay ratios of individual companies can be quite volatile over time. They can vary with exchange rate movements and are dependent on a company’s annual performance, since this impacts the remuneration of the Executive Board much more than it influences the remuneration of employees. Third, it is important to note that a uniform approach regarding the disclosure of and methodology behind internal pay comparisons is currently non-existent. As a result, companies use different methodologies to calculate their pay ratios.
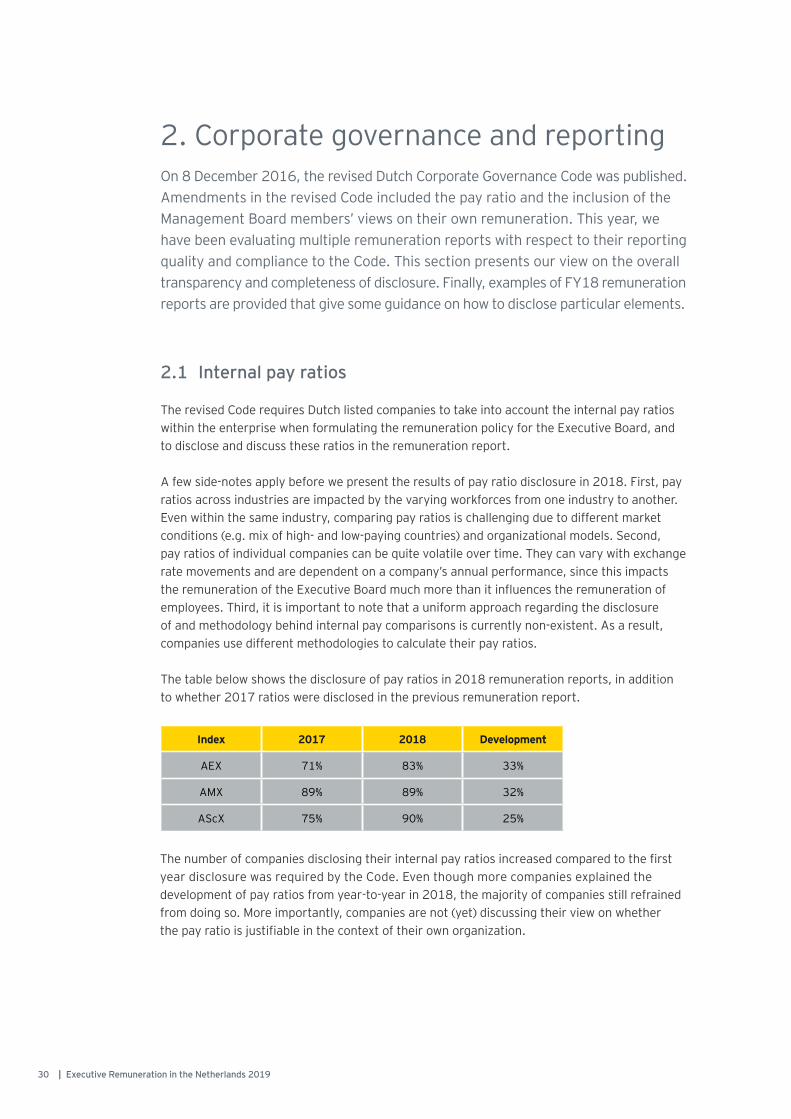
The table below shows the disclosure of pay ratios in 2018 remuneration reports, in addition to whether 2017 ratios were disclosed in the previous remuneration report.
2. Corporate governance and reporting
Index 2017 2018 Development
AEX 71% 83% 33%
AMX 89% 89% 32%
AScX 75% 90% 25%
The number of companies disclosing their internal pay ratios increased compared to the first year disclosure was required by the Code. Even though more companies explained the development of pay ratios from year-to-year in 2018, the majority of companies still refrained from doing so. More importantly, companies are not (yet) discussing their view on whether the pay ratio is justifiable in the context of their own organization.
30 | Executive Remuneration in the Netherlands 2019
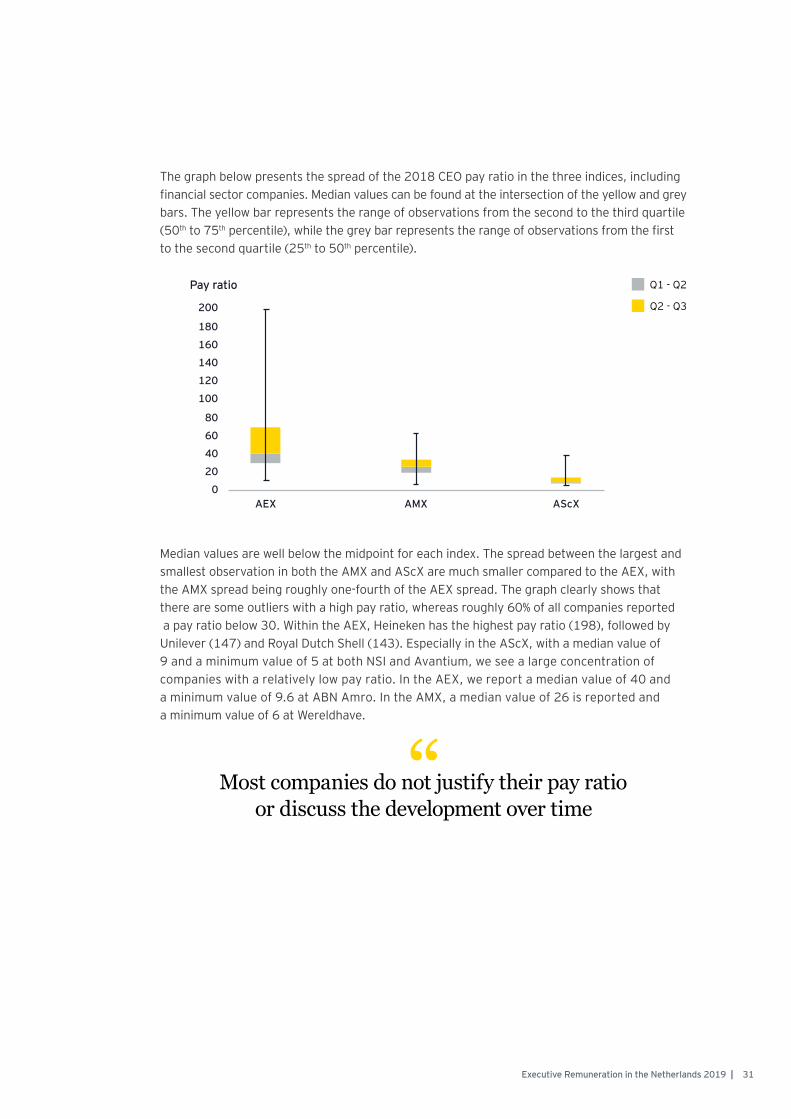
Median values are well below the midpoint for each index. The spread between the largest and smallest observation in both the AMX and AScX are much smaller compared to the AEX, with the AMX spread being roughly one-fourth of the AEX spread. The graph clearly shows that there are some outliers with a high pay ratio, whereas roughly 60% of all companies reported a pay ratio below 30. Within the AEX, Heineken has the highest pay ratio (198), followed by Unilever (147) and Royal Dutch Shell (143). Especially in the AScX, with a median value of 9 and a minimum value of 5 at both NSI and Avantium, we see a large concentration of companies with a relatively low pay ratio. In the AEX, we report a median value of 40 and a minimum value of 9.6 at ABN Amro. In the AMX, a median value of 26 is reported and a minimum value of 6 at Wereldhave.
Pay ratio
Q2 - Q3
Q1 - Q2
The graph below presents the spread of the 2018 CEO pay ratio in the three indices, including financial sector companies. Median values can be found at the intersection of the yellow and grey bars. The yellow bar represents the range of observations from the second to the third quartile (50th to 75th percentile), while the grey bar represents the range of observations from the first to the second quartile (25th to 50th percentile).
“Most companies do not justify their pay ratio or discuss the development over time
31Executive Remuneration in the Netherlands 2019 |
2.2 Reporting quality
The Dutch Corporate Governance Code requires companies to comply with the principles and best practices regarding remuneration. We found that few remuneration reports reflect the spirit of the revised Code. This section contains our perspective on the quality of remuneration reporting in regard to specific elements from the Code and common findings from our assessment. Finally, this section closes with some companies which we consider to reflect how some specific reporting categories should be disclosed.
2.2.1 Completeness of disclosureIn last year’s report, we assessed the extent to which companies applied the revised Code in their remuneration reports. The revised Code was to be reflected for the first time in FY17. We observed that many companies follow the Code to the letter, without taking the underlying principles of simplicity and transparency into account.
This observation also applies to the FY18 remuneration reports, as well as the reigning misconception that only stating a deviation from the Code suffices as a “comply or explain” statement. Compared to last year, we performed a more detailed analysis and identified several categories that companies generally disclose poorly.
The most defining factor for the total remuneration levels of executives is the market reference. Companies should disclose their specific reference market, the positioning within this reference market and the remuneration elements considered in the reference (e.g. base salary, total cash or total direct compensation). Furthermore, the appropriateness of the market positioning should be explained, in which the internal pay reference is to be included. In many FY18 remuneration reports the reference market or market positioning is not disclosed, with explanations for the appropriateness of the external and internal positioning being even more rare.
Any kind of variable pay should be discussed according to the Code, including an explanation of how it contributes to long-term value creation, what the predefined measurable performance criteria are and how the paid-out variable pay relates to actual performance. Many companies however neglect to discuss the relationship between variable pay executives receive for their performance in their FY18 remuneration report in sufficient detail. This is the case for both STI and LTI payments. Either only an aggregate target achievement level is presented or explanations per performance measure remain ambiguous. Phrases such as “actual performance and target levels are not disclosed because this is deemed commercially sensitive information” or “performance between threshold and target level” are not uncommon.
Other categories that could be further improved upon in terms of transparency and compliance to the Code concern discussing the development in internal pay ratios, performed scenario analyses and executives’ view on their own remuneration. Companies are also not fully complying with the requirement of overall readability and we still observe remuneration reports missing a clear, transparent and straightforward account of how the policy contributes to long-term value creation.
32 | Executive Remuneration in the Netherlands 2019
The new European Union Shareholders Rights Directive (SRD) will be upheld from FY19 onwards. The SRD contains stricter reporting guidelines than the Code does, such as being required to provide a 5-year comparison of executive remuneration levels in relation to company performance and average remuneration levels of other (non-executive) employees. A more standardized presentation of remuneration reports is expected as well. Whether and how this will affect remuneration reporting in the upcoming years remains to be seen.
2.2.2 Examples of appropriate disclosureIn this report we acknowledge companies that stand-out with regard to a particular disclosure categories rather than assessing their overall disclosure. Disclosure categories considered in the assessment relate to those that are generally poorly disclosed and can be greatly improved upon. The three categories that were considered were overall readability, market positioning and paid-out variable amounts.
By acknowledging examples of good disclosure, we aim to provide guidance on how to improve upon remuneration reporting and to promote high disclosure quality among companies. The companies listed are not alone in their adherence to these elements, but were chosen to illustrate how these categories may be reported.
In terms of readability, by providing an overview of the remuneration policy and how it was actually applied, IMCD serves as a good example of how to report on remuneration in a clear, understandable and structured manner. With respect to market positioning, Basic-Fit demonstrates how companies can incorporate the external and internal positioning in setting remuneration levels, in addition to explaining this in the remuneration report. Finally, we investigated whether companies reported on actual variable payouts in relation to performance in sufficient detail. The Code encourages companies to transparently disclose and explain this relationship. None of the FY18 remuneration reports we reviewed reach an appropriate disclosure level in this category, in particular with respect to disclosing the actual performance levels compared to target per performance measure. Some companies are however on their way of achieving the appropriate disclosure level. Philips for instance discloses their achieved LTI performance and resulting payout in a transparent way.
Finally, the revised Code requires companies to discuss the extent to which the remuneration policy is in line with the envisaged long-term value creation strategy. Despite the difficulty of evaluating how this is actually done in practice, we believe TomTom provides a good example of how to discuss factors such as company performance, executives’ views about their own remuneration and the distribution between fixed and variable pay in the remuneration report.
“Few companies reflect the spirit of the Code; IMCD, Basic-Fit, Philips and TomTom show appropriate
disclosure in certain categories
33Executive Remuneration in the Netherlands 2019 |

Appendices
34 | Executive Remuneration in the Netherlands 2019
Appendix 1: Companies and positions
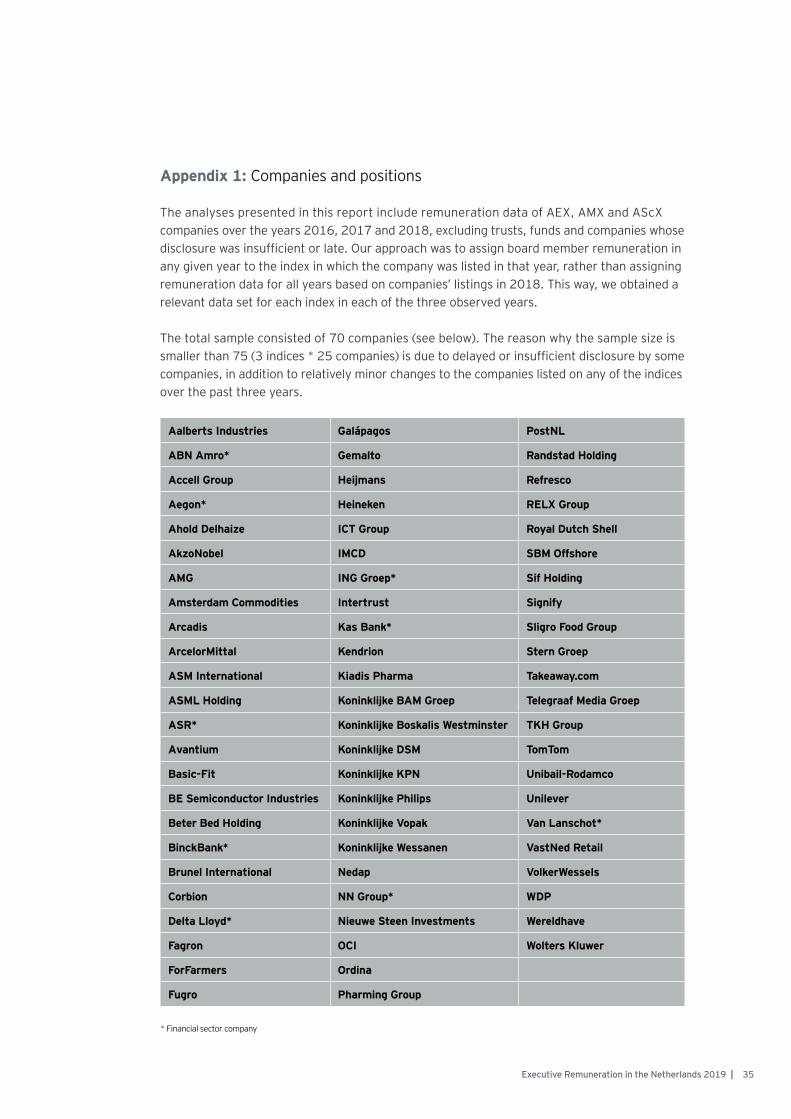
The analyses presented in this report include remuneration data of AEX, AMX and AScX companies over the years 2016, 2017 and 2018, excluding trusts, funds and companies whose disclosure was insufficient or late. Our approach was to assign board member remuneration in any given year to the index in which the company was listed in that year, rather than assigning remuneration data for all years based on companies’ listings in 2018. This way, we obtained a relevant data set for each index in each of the three observed years.
The total sample consisted of 70 companies (see below). The reason why the sample size is smaller than 75 (3 indices * 25 companies) is due to delayed or insufficient disclosure by some companies, in addition to relatively minor changes to the companies listed on any of the indices over the past three years.
* Financial sector company
Aalberts Industries Galápagos PostNL
ABN Amro* Gemalto Randstad Holding
Accell Group Heijmans Refresco
Aegon* Heineken RELX Group
Ahold Delhaize ICT Group Royal Dutch Shell
AkzoNobel IMCD SBM Offshore
AMG ING Groep* Sif Holding
Amsterdam Commodities Intertrust Signify
Arcadis Kas Bank* Sligro Food Group
ArcelorMittal Kendrion Stern Groep
ASM International Kiadis Pharma Takeaway.com
ASML Holding Koninklijke BAM Groep Telegraaf Media Groep
ASR* Koninklijke Boskalis Westminster TKH Group
Avantium Koninklijke DSM TomTom
Basic-Fit Koninklijke KPN Unibail-Rodamco
BE Semiconductor Industries Koninklijke Philips Unilever
Beter Bed Holding Koninklijke Vopak Van Lanschot*
BinckBank* Koninklijke Wessanen VastNed Retail
Brunel International Nedap VolkerWessels
Corbion NN Group* WDP
Delta Lloyd* Nieuwe Steen Investments Wereldhave
Fagron OCI Wolters Kluwer
ForFarmers Ordina
Fugro Pharming Group
35Executive Remuneration in the Netherlands 2019 |
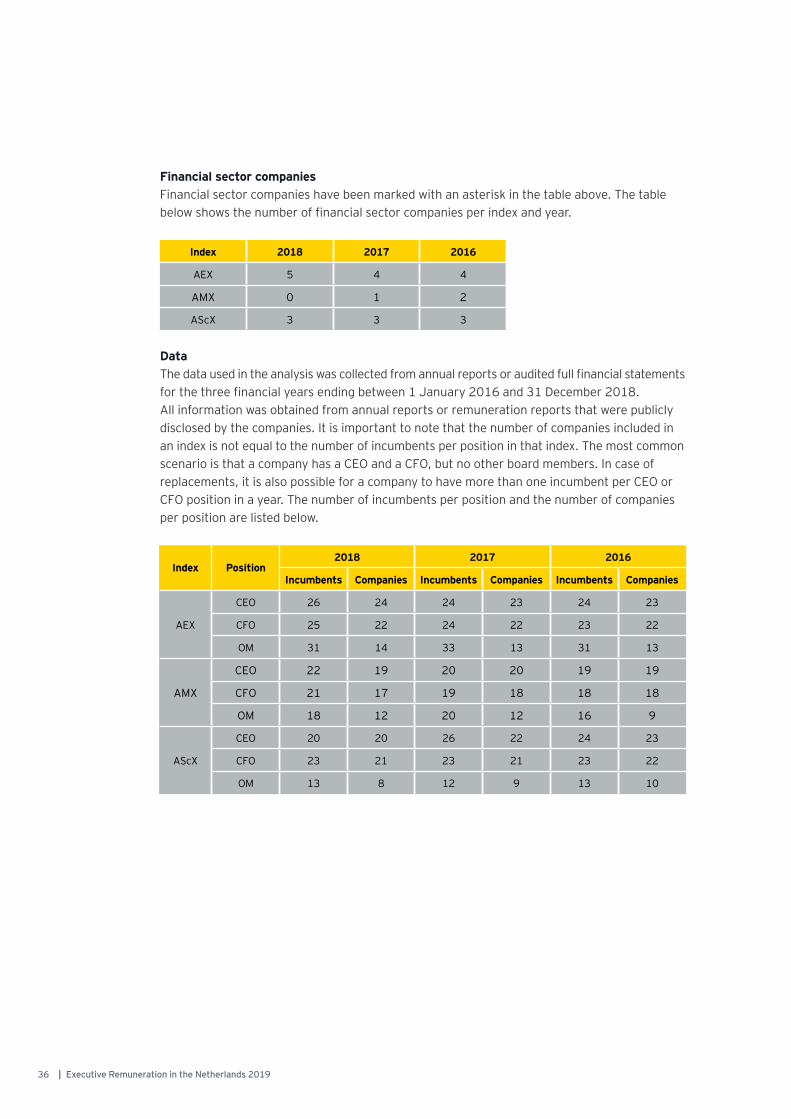
Financial sector companiesFinancial sector companies have been marked with an asterisk in the table above. The table below shows the number of financial sector companies per index and year.
DataThe data used in the analysis was collected from annual reports or audited full financial statements for the three financial years ending between 1 January 2016 and 31 December 2018. All information was obtained from annual reports or remuneration reports that were publicly disclosed by the companies. It is important to note that the number of companies included in an index is not equal to the number of incumbents per position in that index. The most common scenario is that a company has a CEO and a CFO, but no other board members. In case of replacements, it is also possible for a company to have more than one incumbent per CEO or CFO position in a year. The number of incumbents per position and the number of companies per position are listed below.
Index Position2018 2017 2016
Incumbents Companies Incumbents Companies Incumbents Companies
AEX
CEO 26 24 24 23 24 23
CFO 25 22 24 22 23 22
OM 31 14 33 13 31 13
AMX
CEO 22 19 20 20 19 19
CFO 21 17 19 18 18 18
OM 18 12 20 12 16 9
AScX
CEO 20 20 26 22 24 23
CFO 23 21 23 21 23 22
OM 13 8 12 9 13 10
Index 2018 2017 2016
AEX 5 4 4
AMX 0 1 2
AScX 3 3 3
36 | Executive Remuneration in the Netherlands 2019
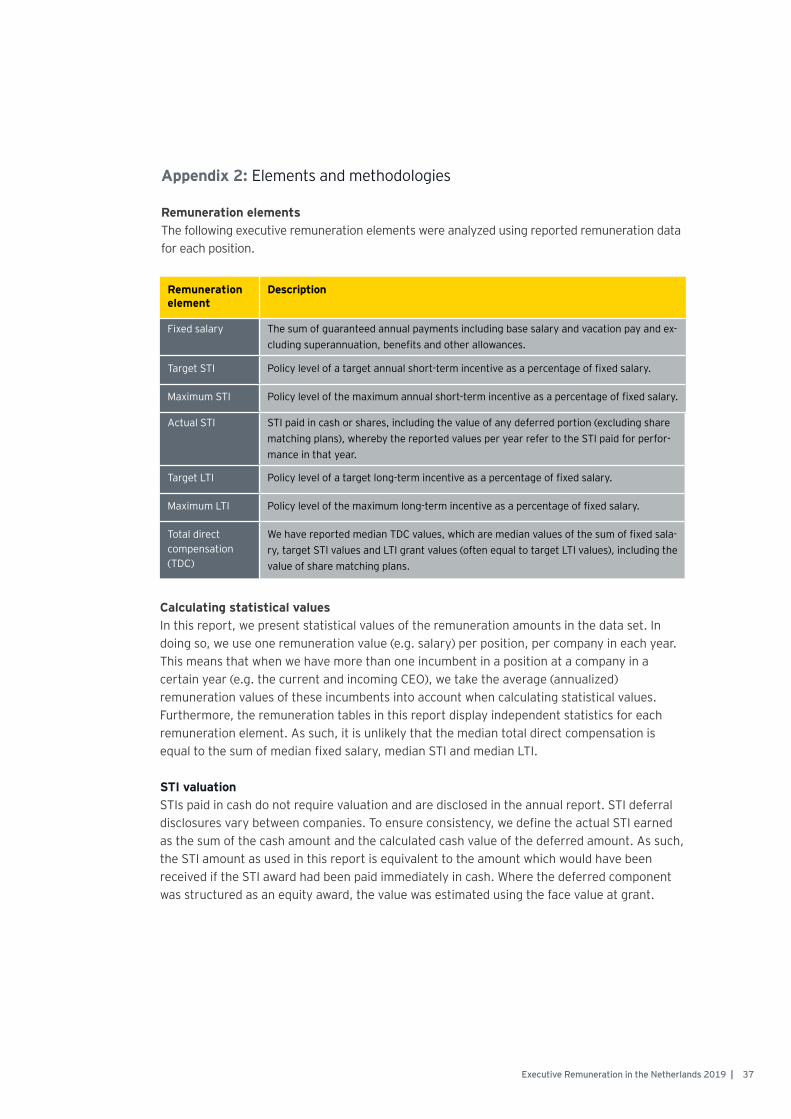
Remuneration element
Description
Fixed salary The sum of guaranteed annual payments including base salary and vacation pay and ex-cluding superannuation, benefits and other allowances.
Target STI Policy level of a target annual short-term incentive as a percentage of fixed salary.
Maximum STI Policy level of the maximum annual short-term incentive as a percentage of fixed salary.
Actual STI STI paid in cash or shares, including the value of any deferred portion (excluding share matching plans), whereby the reported values per year refer to the STI paid for perfor-mance in that year.
Target LTI Policy level of a target long-term incentive as a percentage of fixed salary.
Maximum LTI Policy level of the maximum long-term incentive as a percentage of fixed salary.
Total direct compensation (TDC)
We have reported median TDC values, which are median values of the sum of fixed sala-ry, target STI values and LTI grant values (often equal to target LTI values), including the value of share matching plans.
Appendix 2: Elements and methodologies
Remuneration elementsThe following executive remuneration elements were analyzed using reported remuneration data for each position.
Calculating statistical valuesIn this report, we present statistical values of the remuneration amounts in the data set. In doing so, we use one remuneration value (e.g. salary) per position, per company in each year. This means that when we have more than one incumbent in a position at a company in a certain year (e.g. the current and incoming CEO), we take the average (annualized) remuneration values of these incumbents into account when calculating statistical values. Furthermore, the remuneration tables in this report display independent statistics for each remuneration element. As such, it is unlikely that the median total direct compensation is equal to the sum of median fixed salary, median STI and median LTI.
STI valuationSTIs paid in cash do not require valuation and are disclosed in the annual report. STI deferral disclosures vary between companies. To ensure consistency, we define the actual STI earned as the sum of the cash amount and the calculated cash value of the deferred amount. As such, the STI amount as used in this report is equivalent to the amount which would have been received if the STI award had been paid immediately in cash. Where the deferred component was structured as an equity award, the value was estimated using the face value at grant.
37Executive Remuneration in the Netherlands 2019 |

LTI valuationTo ensure the comparability of LTI grant values, we used the target LTI value when the company provided an LTI grant in line with the target policy level. In this respect, we treated companies using a 3-month average share price the same as companies that used the share price on the grant date. We also treated performance hurdles as having no impact on LTI grant value, as we assumed achievement of target performance levels. Furthermore, when companies provided LTI grants at the maximum policy level, we used target LTI policy levels instead. Finally, when companies provided LTI grants which led to significantly different values than the target LTI value, we included the LTI value at grant as applied by the company. In this respect, we have taken into account special treatments such as discounts on the share price in calculating the number of (conditional) shares at grant and average share price over periods longer than 3 months preceding the grant.
38 | Executive Remuneration in the Netherlands 2019
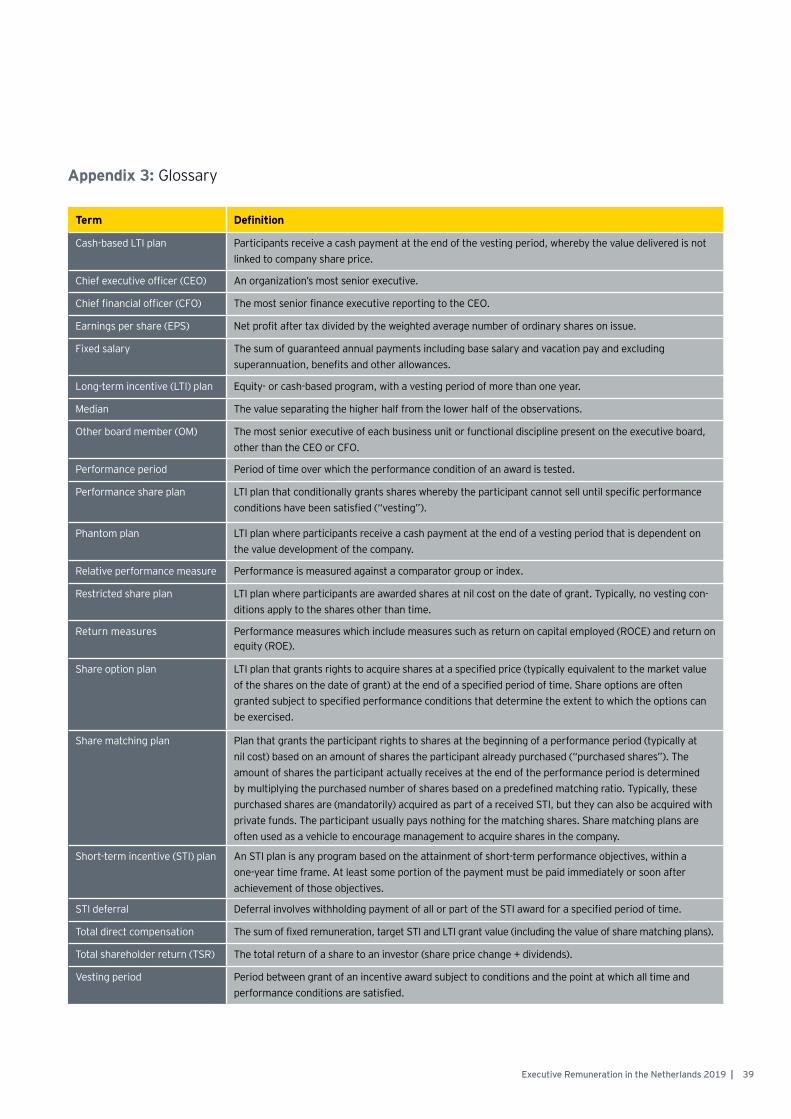
Appendix 3: Glossary
Term Definition
Cash-based LTI plan Participants receive a cash payment at the end of the vesting period, whereby the value delivered is not linked to company share price.
Chief executive officer (CEO) An organization’s most senior executive.
Chief financial officer (CFO) The most senior finance executive reporting to the CEO.
Earnings per share (EPS) Net profit after tax divided by the weighted average number of ordinary shares on issue.
Fixed salary The sum of guaranteed annual payments including base salary and vacation pay and excluding superannuation, benefits and other allowances.
Long-term incentive (LTI) plan Equity- or cash-based program, with a vesting period of more than one year.
Median The value separating the higher half from the lower half of the observations.
Other board member (OM) The most senior executive of each business unit or functional discipline present on the executive board, other than the CEO or CFO.
Performance period Period of time over which the performance condition of an award is tested.
Performance share plan LTI plan that conditionally grants shares whereby the participant cannot sell until specific performance conditions have been satisfied (“vesting”).
Phantom plan LTI plan where participants receive a cash payment at the end of a vesting period that is dependent on the value development of the company.
Relative performance measure Performance is measured against a comparator group or index.
Restricted share plan LTI plan where participants are awarded shares at nil cost on the date of grant. Typically, no vesting con-ditions apply to the shares other than time.
Return measures Performance measures which include measures such as return on capital employed (ROCE) and return on equity (ROE).
Share option plan LTI plan that grants rights to acquire shares at a specified price (typically equivalent to the market value of the shares on the date of grant) at the end of a specified period of time. Share options are often granted subject to specified performance conditions that determine the extent to which the options can be exercised.
Share matching plan Plan that grants the participant rights to shares at the beginning of a performance period (typically at nil cost) based on an amount of shares the participant already purchased (“purchased shares”). The amount of shares the participant actually receives at the end of the performance period is determined by multiplying the purchased number of shares based on a predefined matching ratio. Typically, these purchased shares are (mandatorily) acquired as part of a received STI, but they can also be acquired with private funds. The participant usually pays nothing for the matching shares. Share matching plans are often used as a vehicle to encourage management to acquire shares in the company.
Short-term incentive (STI) plan An STI plan is any program based on the attainment of short-term performance objectives, within a one-year time frame. At least some portion of the payment must be paid immediately or soon after achievement of those objectives.
STI deferral Deferral involves withholding payment of all or part of the STI award for a specified period of time.
Total direct compensation The sum of fixed remuneration, target STI and LTI grant value (including the value of share matching plans).
Total shareholder return (TSR) The total return of a share to an investor (share price change + dividends).
Vesting period Period between grant of an incentive award subject to conditions and the point at which all time and performance conditions are satisfied.
39Executive Remuneration in the Netherlands 2019 |
EY | Assurance | Tax | Transactions | Advisory
About EY EY is a global leader in assurance, tax, transaction and advisory services. The insights and quality services we deliver help build trust and confidence in the capital markets and in economies the world over. We develop outstanding leaders who team to deliver on our promises to all of our stakeholders. In so doing, we play a critical role in building a better working world for our people, for our clients and for our communities. EY refers to the global organization, and may refer to one or more, of the member firms of Ernst & Young Global Limited, each of which is a separate Legal entity. Ernst & Young Global Limited, a UK company limited by guarantee, does not provide services to clients. For more information about our organization, please visit ey.com.
About EY’s People Advisory ServicesIn today’s market, people make the difference between success and failure. As your organization grows, getting the right people in the right place when you need them is what gives you competitive advantage. Our performance and reward professionals help you design compensation programs and equity incentives that really engage your key people. Our global mobility team advises many of the world’s largest global employers — as well as those just venturing into their first foreign country. We help you meet your executive tax compliance obligations, stay on top of regulatory change, manage your global talent effectively and improve your function’s strategic alignment. Let us help your organization achieve its potential by turning complexity into competitive advantage. It’s how EY makes a difference.
© 2019 Ernst & Young Belastingadviseurs LLP.All Rights Reserved.
ED None155010505
This material has been prepared for general informational purposes only and is not intended to
be relied upon as accounting, tax or other professional advice. Please refer to your advisors for
specific advice.
ey.com/nl