Embed Size (px)
Citation preview

5
STATE PRE-K AFTER THE RECESSION: STALLED OR TURNING UP?
The 2012-2013 school year capped a dismal half-decade, with more bad news as well as a glimmer of hope. After the 2011-2012 downturn in spending and quality, many state pre-K program budgets leveled off and even regained some ground.This offers hope that as state budgets emerge from the recession, policymakers will prioritize early learning programs.However, this was also the first year since we began reporting (2001-2002), that states failed to increase the number ofchildren they serve in pre-K.
The loss of 9,160 children from enrollment at age 4 and 42 children at age 3 are modest changes, but this is the firstdecrease we have observed. At the same time, this represents a reversal—or at least a pause—of the trend towardspreading too little funding over ever more children, which led to expanded access while jeopardizing program quality.What remains to be seen is whether the small enrollment decrease of 2012-2013, coupled with a small increase in spending,represents a turning point after which both access and quality will be increased, or simply a new stasis in which neitheradvances significantly.
State funding for pre-K increased by $30.6 million in 2012-2013, adjusted for inflation. This is just a small step towardsreversing nearly a half a billion dollars in cuts in the previous school year, but it is a step in the right direction. Combinedwith the decrease in enrollment, the increased funding yielded a $36 increase in state spending per child, bringing thatamount to $4,026. In many states, local governments, primarily local education agencies, also contribute substantively tofunding for pre-K. Only some states systematically collect information on local funding, but what is documented addsanother $600 per child.
Progress on quality standards also appears to be in a holding pattern. Ohio met a new benchmark for adoptingcomprehensive early learning standards, making this the first item in NIEER’s quality standards checklist to be met by allprograms. On the other hand, Missouri lost a benchmark for reducing its professional development requirement below 15hours per year, while Arizona lost its benchmark for lead teacher credential, as its merger of two programs resulted in alowered requirement.

6
WHAT’S NEW?
• In 2012-2013, enrollment decreased—bymore than 9,000 children at age 4—fromthe prior year across the 40 states plusD.C.1 that offer pre-K. This is the firstenrollment decrease, nationally, NIEER has observed.
• Slightly more than 1.3 million childrenattended state-funded pre-K, 1.1 million of them at age 4. They account for fourpercent of 3-year-olds and 28 percent of 4-year-olds.
• Twenty states increased enrollment. Elevenstates reduced enrollment.
• One program improved against NIEER’sQuality Standards Benchmarks, while twofell back. For the first time, every state-funded pre-K program had comprehensiveearly learning standards.
• Four states, plus one of Louisiana’s threeprograms, met all 10 of NIEER’s benchmarks for state pre-K quality standards, the same as in the previous year. Thisremains down from the peak of five states in 2010-2011. Another 16 states met eight or more benchmarks.
• More than half a million children, or 41 percent of nationwide enrollment, were served in programs that met fewer thanhalf of the quality standards benchmarks.
• Total state funding for pre-K programs increased by $30 million in real dollars, about a 1 percent increase.
• State pre-K funding per child increased by $36 (inflation-adjusted) from the previous year, to $4,026. However, thatregains less than 10 percent of the prior year’s cut of $442 per child.
• State funding per child for pre-K increased by at least one percent in 18 of the 41 states with programs, when adjusted forinflation. Twenty states decreased per-child funding by at least 1 percent. In 5 states, per-child spending fell by 10 percentor more from the previous year; in 7 states, per-child spending increased by the same margin.
• Only 15 states could be verified as providing enough per-child funding to meet all 10 benchmarks for quality standards.As only 19 percent of the children enrolled in state-funded pre-K attend those programs, it is possible that most childrenserved by state pre-K attend programs where funding per child is inadequate to provide a quality early education.
AVERAGE STATE SPENDING PER CHILD ENROLLED(2013 DOLLARS)
$5,043 $5,032 $4,818 $4,692 $4,330 $4,339 $4,595 $4,493 $4,587 $4,418 $3,991 $4,026
2002 2003 2004 2005 2006 2007 2008 2009 2010 2011 2012 2013
PERCENT OF NATIONAL POPULATION ENROLLED
� 3-year-olds � 4-year-olds
2002 2003 2004 2005 2006 2007 2008 2009 2010 2011 2012 2013
3%14%
2%
16%
3%
17%
3%
17%
3%
20%
3%
22%
4%
24%
4%
25%
4%
27%
4%
28%
4%
28%
4%
28%
* For the sake of comparison, the District of Columbia will be referred to as a “state” throughout this report. Hence, a total of 41 states provide state-funded pre-K.
Progress on quality standards also appears to be in a holding pattern. Ohio met a new benchmark for adoptingcomprehensive early learning standards, making this the first item in NIEER’s quality standards checklist to be met by allprograms. On the other hand, Missouri lost a benchmark for reducing its professional development requirement below 15hours per year, while Arizona lost its benchmark for lead teacher credential, as its merger of two programs resulted in alowered requirement.
7
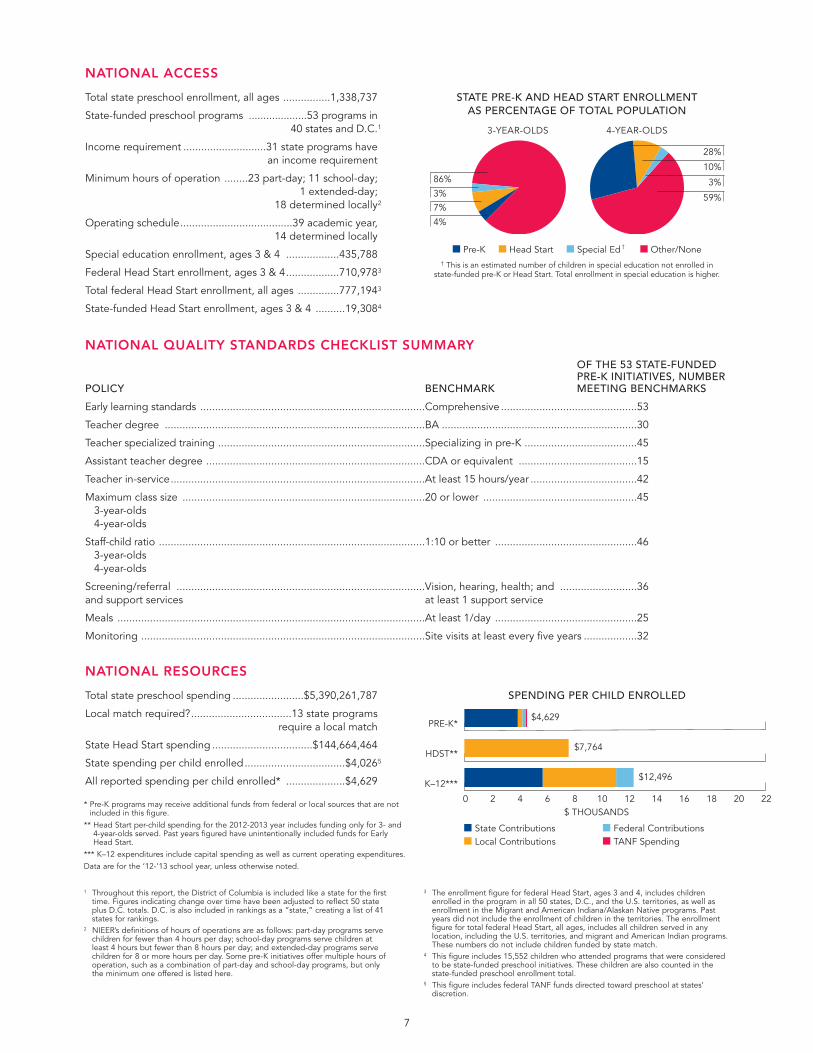
Total state preschool spending ........................$5,390,261,787
Local match required?..................................13 state programs require a local match
State Head Start spending ..................................$144,664,464
State spending per child enrolled..................................$4,0265
All reported spending per child enrolled* ....................$4,629
Total state preschool enrollment, all ages ................1,338,737
State-funded preschool programs ....................53 programs in 40 states and D.C.1
Income requirement ............................31 state programs have an income requirement
Minimum hours of operation ........23 part-day; 11 school-day; 1 extended-day; 18 determined locally2
Operating schedule......................................39 academic year, 14 determined locally
Special education enrollment, ages 3 & 4 ..................435,788
Federal Head Start enrollment, ages 3 & 4..................710,9783
Total federal Head Start enrollment, all ages ..............777,1943
State-funded Head Start enrollment, ages 3 & 4 ..........19,3084
1 Throughout this report, the District of Columbia is included like a state for the firsttime. Figures indicating change over time have been adjusted to reflect 50 stateplus D.C. totals. D.C. is also included in rankings as a “state,” creating a list of 41states for rankings.
2 NIEER’s definitions of hours of operations are as follows: part-day programs servechildren for fewer than 4 hours per day; school-day programs serve children atleast 4 hours but fewer than 8 hours per day; and extended-day programs servechildren for 8 or more hours per day. Some pre-K initiatives offer multiple hours ofoperation, such as a combination of part-day and school-day programs, but onlythe minimum one offered is listed here.
3 The enrollment figure for federal Head Start, ages 3 and 4, includes childrenenrolled in the program in all 50 states, D.C., and the U.S. territories, as well asenrollment in the Migrant and American Indiana/Alaskan Native programs. Pastyears did not include the enrollment of children in the territories. The enrollmentfigure for total federal Head Start, all ages, includes all children served in anylocation, including the U.S. territories, and migrant and American Indian programs.These numbers do not include children funded by state match.
4 This figure includes 15,552 children who attended programs that were consideredto be state-funded preschool initiatives. These children are also counted in thestate-funded preschool enrollment total.
5 This figure includes federal TANF funds directed toward preschool at states’discretion.
OF THE 53 STATE-FUNDED PRE-K INITIATIVES, NUMBER POLICY BENCHMARK MEETING BENCHMARKS
Early learning standards ............................................................................Comprehensive ..............................................53
Teacher degree ........................................................................................BA ..................................................................30
Teacher specialized training ......................................................................Specializing in pre-K ......................................45
Assistant teacher degree ..........................................................................CDA or equivalent ........................................15
Teacher in-service......................................................................................At least 15 hours/year ....................................42
Maximum class size ..................................................................................20 or lower ....................................................453-year-olds4-year-olds
Staff-child ratio ..........................................................................................1:10 or better ................................................463-year-olds4-year-olds
Screening/referral ....................................................................................Vision, hearing, health; and ..........................36and support services at least 1 support service
Meals ........................................................................................................At least 1/day ................................................25
Monitoring ................................................................................................Site visits at least every five years ..................32
NATIONAL ACCESS
NATIONAL QUALITY STANDARDS CHECKLIST SUMMARY
NATIONAL RESOURCES
* Pre-K programs may receive additional funds from federal or local sources that are notincluded in this figure.
** Head Start per-child spending for the 2012-2013 year includes funding only for 3- and 4-year-olds served. Past years figured have unintentionally included funds for Early Head Start.
*** K–12 expenditures include capital spending as well as current operating expenditures.Data are for the ‘12-’13 school year, unless otherwise noted.
STATE PRE-K AND HEAD START ENROLLMENTAS PERCENTAGE OF TOTAL POPULATION
� Pre-K � Head Start � Special Ed† � Other/None† This is an estimated number of children in special education not enrolled in
state-funded pre-K or Head Start. Total enrollment in special education is higher.
SPENDING PER CHILD ENROLLED
PRE-K*
HDST**
K–12***
0 2 4 6 8 10 12 14 16 18 20 22
� State Contributions� Local Contributions
� Federal Contributions� TANF Spending
$ THOUSANDS
$12,496
3-YEAR-OLDS 4-YEAR-OLDS
7%
4%
3%
86%
28%
10%
3%
59%
$4,629
$7,764
8
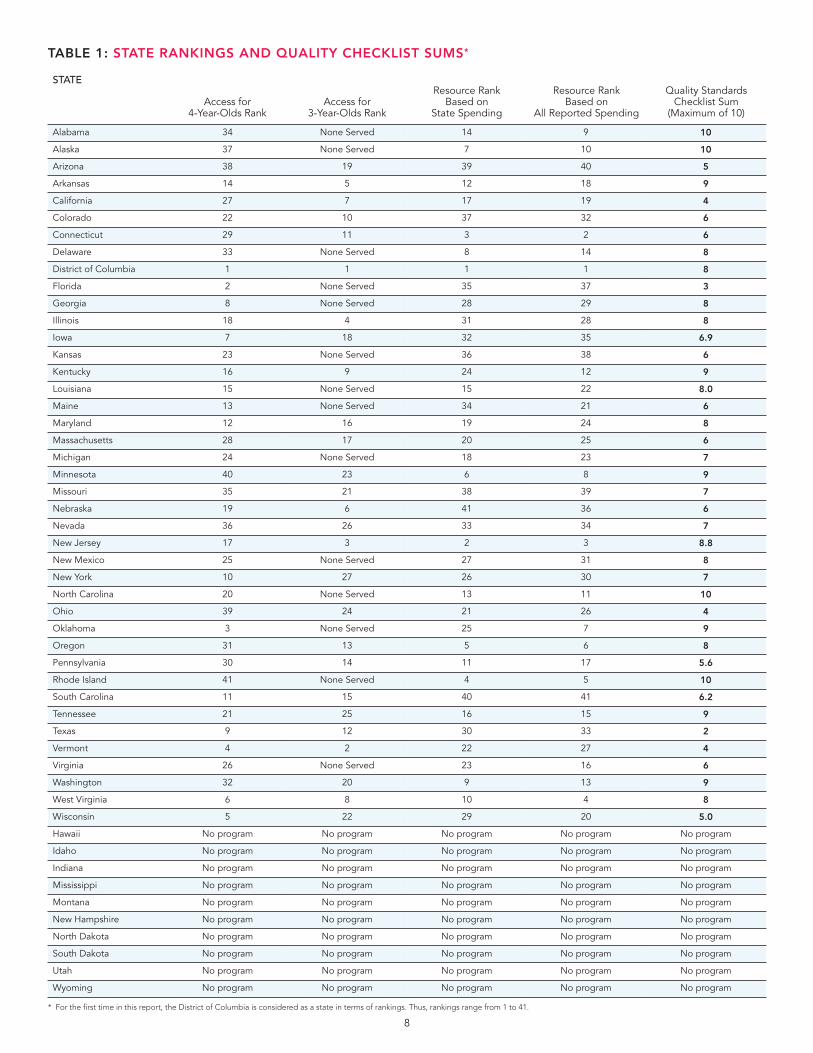
TABLE 1: STATE RANKINGS AND QUALITY CHECKLIST SUMS*
STATE
Access for4-Year-Olds Rank
Access for3-Year-Olds Rank
Resource RankBased on
State Spending
Resource RankBased on
All Reported Spending
Quality StandardsChecklist Sum
(Maximum of 10)
* For the first time in this report, the District of Columbia is considered as a state in terms of rankings. Thus, rankings range from 1 to 41.
Alabama 34 None Served 14 9 10
Alaska 37 None Served 7 10 10
Arizona 38 19 39 40 5
Arkansas 14 5 12 18 9
California 27 7 17 19 4
Colorado 22 10 37 32 6
Connecticut 29 11 3 2 6
Delaware 33 None Served 8 14 8
District of Columbia 1 1 1 1 8
Florida 2 None Served 35 37 3
Georgia 8 None Served 28 29 8
Illinois 18 4 31 28 8
Iowa 7 18 32 35 6.9
Kansas 23 None Served 36 38 6
Kentucky 16 9 24 12 9
Louisiana 15 None Served 15 22 8.0
Maine 13 None Served 34 21 6
Maryland 12 16 19 24 8
Massachusetts 28 17 20 25 6
Michigan 24 None Served 18 23 7
Minnesota 40 23 6 8 9
Missouri 35 21 38 39 7
Nebraska 19 6 41 36 6
Nevada 36 26 33 34 7
New Jersey 17 3 2 3 8.8
New Mexico 25 None Served 27 31 8
New York 10 27 26 30 7
North Carolina 20 None Served 13 11 10
Ohio 39 24 21 26 4
Oklahoma 3 None Served 25 7 9
Oregon 31 13 5 6 8
Pennsylvania 30 14 11 17 5.6
Rhode Island 41 None Served 4 5 10
South Carolina 11 15 40 41 6.2
Tennessee 21 25 16 15 9
Texas 9 12 30 33 2
Vermont 4 2 22 27 4
Virginia 26 None Served 23 16 6
Washington 32 20 9 13 9
West Virginia 6 8 10 4 8
Wisconsin 5 22 29 20 5.0
Hawaii No program No program No program No program No program
Idaho No program No program No program No program No program
Indiana No program No program No program No program No program
Mississippi No program No program No program No program No program
Montana No program No program No program No program No program
New Hampshire No program No program No program No program No program
North Dakota No program No program No program No program No program
South Dakota No program No program No program No program No program
Utah No program No program No program No program No program
Wyoming No program No program No program No program No program

ENROLLMENT BACKSLIDES
State-funded pre-K served 1,338,737 children in 2012-2013 across all ages. State pre-K continues to be primarily a programfor 4-year-olds in the vast majority of states, with more than 1.1 million served at age 4, which is about 85 percent of the total.
Across the nation, 28 percent of 4-year-olds were enrolled in state-funded pre-K programs; only 4 percent of 3-year-oldswere similarly enrolled, percentages that are unchanged since 2010-2011. Total enrollment decreased by 4,301 childrenfrom the prior year. While this is a small number relative to the total, it marks the first time since NIEER began trackingstate-funded pre-K that total enrollment has decreased. Table 2 reports both numbers: enrolled, and enrollment as apercentage of total population by state. Table 3 reports enrollment changes for 3- and 4-year-olds from the prior year andover the past decade.
Enrollment in state-funded pre-K programs varies widely from state to state. Figure 1 displays state pre-K enrollment at age4 by state, based on the detailed figures in Table 2. The District of Columbia served the highest percentage of children atages 3 and 4, followed by Florida, Oklahoma, and Vermont all of which served more than 70 percent of their state’s 4-year-olds. Vermont ranks second to D.C. for the percentage of 3-year-olds served, but enrolled a much lower 21 percent of 3-year-olds in state-funded pre-K.
Other states enrolling more than half of 4-year-olds include Georgia, Iowa, Texas, West Virginia, and Wisconsin. On theother end of the spectrum, 10 states offered no program at all and 10 more had programs that served less than 10 percentof 4-year-olds. Enrollment, of course, only tells part of the story. Program quality is essential if pre-K is to make a realcontribution to children’s learning and development. Not all the states that top the charts for enrollment adequately investin quality, as we discuss in the next section.
On enrollment, most states provide pre-K primarily to children in the year immediately before kindergarten, except forchildren served by special education programs. However, there are several notable exceptions. The District of Columbiaserves more than 75 percent of 3-year-old residents. New Jersey and Vermont serve about 1 in 5 3-year-olds, and Arkansas,California, Illinois, and Nebraska all serve 10 percent or more at age 3. Of the 27 states that enroll 3-year-olds in state-funded pre-K, 15 states increased their enrollment of 3-year-olds from the previous year.
The decrease in enrollment totals is unprecedented and, though small, requires further examination. California decreasedenrollment by almost 15,000 pre-K spots, a change large enough to have an impact on national trends, compounded bythe fact that an additional four states had decreases of more than 1,000 students. While more states increased enrollmentthan decreased it, the size of the decrease in large states such as California and Pennsylvania pulled the national total down.
FIGURE 1: PERCENT OF 4-YEAR-OLDS SERVED IN STATE PRE-K
(continued)
MT
WA
OR
CA
AK
NV
IDWY
CO
NM
TX
OK
KS
NE
SD
ND MN
WI
IL
MI
OH
KY
TN
MS AL GA
SC
NC
VA
NJ
VTNH
MA
CT
DE
RI
MDWV
FL
PA
NY
ME
IN
IA
MO
AR
LA
UT
AZ
HI
9
0% of 4-year-olds served
1–10% of 4-year-olds served
11–20% of 4-year-olds served
21–30% of 4-year-olds served
31–40% of 4-year-olds served
41–50% of 4-year-olds served
51–60% of 4-year-olds served
61-80% of 4-year-olds served

10
QUALITY STANDARDS
The Yearbook compares each state program’s standards against a checklist of 10 research-based quality standardsbenchmarks. The benchmarks track state progress in quality standards, but they are not, in themselves, guarantees ofquality. Arguably some of them are quite low (e.g., hours of professional development), even though many states do notmeet them. Moreover, they are primarily indicators of the resources available to programs, not whether these resources are used well. In addition to high standards, effective pre-K programs require adequate funding and the continuousimprovement of strong practices. For example, requirements that every teacher be highly qualified mean nothing if pre-K teacher salaries are not competitive with other educational sectors and occupations. Nor do the required hours of professional development matter if they consist of one-shot workshops on barely relevant topics.
While the benchmarks are derived from research, setting them is not an exact science, and they are not all equallyimportant, or important for the same reasons. For example, some state policy makers do not consider it desirable to requiremeals in part-day programs. In our view, as most programs target disadvantaged children who all too often experience foodinsecurity and poor nutrition, it is desirable to offer them a healthy meal no matter how short the day. Good teachers makemealtime a learning time broadly, and teach about healthy eating habits, so there is no loss of “instructional time.” However,this clearly is a crude indicator of whether programs adequately address children’s nutritional needs. A list of benchmarksand a summary of the supporting research are provided on page 22.
Figure 2 displays the percentage of programs meeting each of the quality standards from 2001-2002 through 2012-2013.Only one state had a policy change that met an additional benchmark in 2012-2013, as Ohio adopted comprehensive early learning standards. With this change, early learning standards became the first benchmark to have a 100 percentaccomplishment rate among state programs. Two states had policy changes that reduced the number of benchmarks met:Arizona merged preschool programs and no longer requires lead teachers to have a BA, while Missouri reduced its requiredprofessional development below 15 hours per year.
Teacher has BA Specialized training in EC
Assistant has CDAor higher
At least 15 hoursin-service training
Early Learning Standards
Class size 20 or lower Ratio 1:10 or better Screening/referral At least 1 meal Site visits
45
� 2001-2002
n = 42
� 2002-2003
n = 43
� 2004-2005
n = 47
� 2005-2006
n = 48
� 2006-2007
n = 49
� 2007-2008
n = 50
� 2008-2009
n = 51
� 2009-2010
n = 52
� 2010-2011
n = 51
� 2011-2012
n = 52
� 2012-2013
n = 53
100%
80%
60%
40%
20%
0%
58
47
24 23 21 19 18 2025
86 85 8578
84 85
64 63
84 8180 80 83
98
7784
86 8580 84 86 87
79
59 60 61
87 8779 8286 86 87
47 47 474646 4740 41
46
62
78 78 77
100%
80%
60%
40%
20%
0%
50505149 49
71707074
29 29 29
70 71
49
9492 92
72 71 74 74
88
52
7465 69 67
50 53
697370
FIGURE 2: PERCENT OF STATE PRE-K PROGRAMS MEETING BENCHMARKS 2002-2013
5752 55
73
28
76 79
3736
96100
74 74 7585
55
6860
76
11
As in 2011-2012, only five state programs met all 10 benchmarks: Alabama, Alaska, North Carolina, Rhode Island, and oneLouisiana program (NSECD). Seven states had programs that met nine of 10 benchmarks—Arkansas, Kentucky, Minnesota,New Jersey (Abbott pre-K only), Oklahoma, Tennessee, and Washington. Another eight states met eight benchmarks.
At the other end of the spectrum, five states met fewer than half of the 10 benchmarks—California, Ohio, and Vermont metfour; Florida met three; and Texas met only two benchmarks. In addition, two of Pennsylvania’s programs, Pennsylvania’sEABG and K4 programs, met four and two benchmarks respectively. The size of these programs makes their low qualitystandards particularly concerning. More than 500,000 children—41 percent of enrollment nationally—are served in programsmeeting fewer than five benchmarks. As of 2012-2013, Ohio now meets the benchmark for having comprehensive earlylearning standards, though this only brings the state to four benchmarks. Particularly concerning, Texas and Pennsylvania’s K4program not only miss the class size and staff-child ratio benchmarks, but in fact do not set statewide limits on these at all.
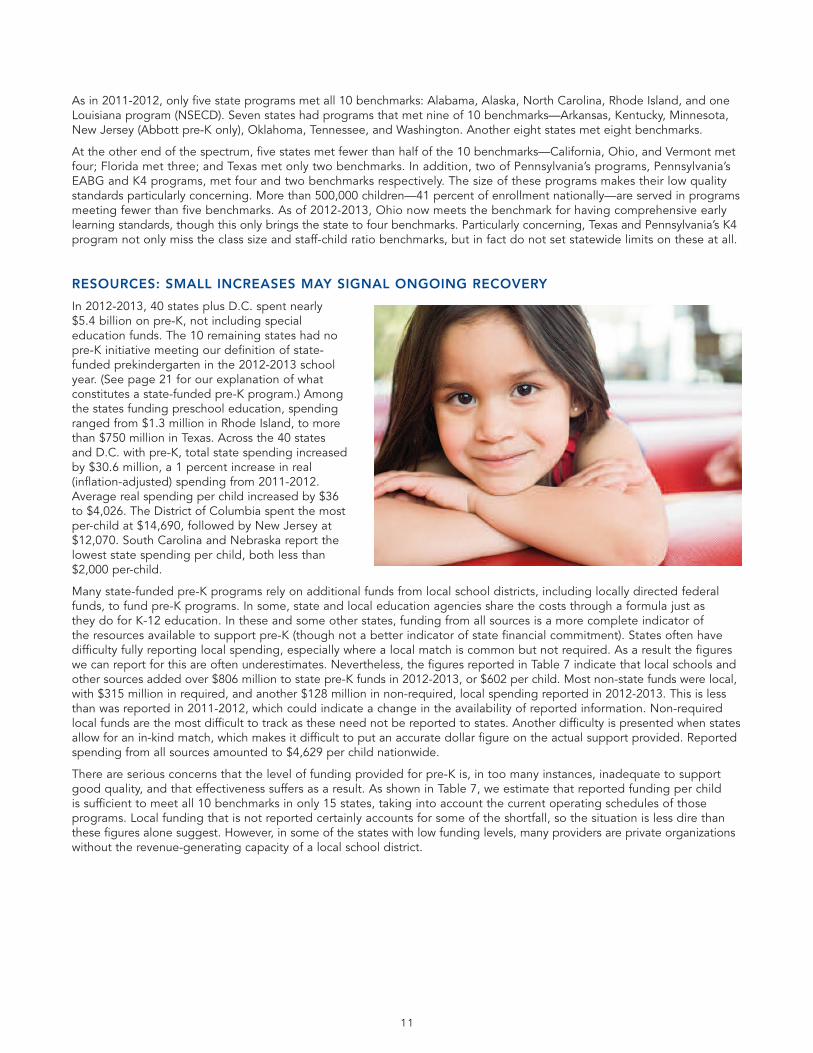
RESOURCES: SMALL INCREASES MAY SIGNAL ONGOING RECOVERY
In 2012-2013, 40 states plus D.C. spent nearly $5.4 billion on pre-K, not including specialeducation funds. The 10 remaining states had nopre-K initiative meeting our definition of state-funded prekindergarten in the 2012-2013 schoolyear. (See page 21 for our explanation of whatconstitutes a state-funded pre-K program.) Amongthe states funding preschool education, spendingranged from $1.3 million in Rhode Island, to morethan $750 million in Texas. Across the 40 statesand D.C. with pre-K, total state spending increasedby $30.6 million, a 1 percent increase in real(inflation-adjusted) spending from 2011-2012.Average real spending per child increased by $36to $4,026. The District of Columbia spent the mostper-child at $14,690, followed by New Jersey at$12,070. South Carolina and Nebraska report thelowest state spending per child, both less than$2,000 per-child.
Many state-funded pre-K programs rely on additional funds from local school districts, including locally directed federalfunds, to fund pre-K programs. In some, state and local education agencies share the costs through a formula just as they do for K-12 education. In these and some other states, funding from all sources is a more complete indicator of the resources available to support pre-K (though not a better indicator of state financial commitment). States often havedifficulty fully reporting local spending, especially where a local match is common but not required. As a result the figureswe can report for this are often underestimates. Nevertheless, the figures reported in Table 7 indicate that local schools andother sources added over $806 million to state pre-K funds in 2012-2013, or $602 per child. Most non-state funds were local,with $315 million in required, and another $128 million in non-required, local spending reported in 2012-2013. This is lessthan was reported in 2011-2012, which could indicate a change in the availability of reported information. Non-requiredlocal funds are the most difficult to track as these need not be reported to states. Another difficulty is presented when statesallow for an in-kind match, which makes it difficult to put an accurate dollar figure on the actual support provided. Reportedspending from all sources amounted to $4,629 per child nationwide.
There are serious concerns that the level of funding provided for pre-K is, in too many instances, inadequate to supportgood quality, and that effectiveness suffers as a result. As shown in Table 7, we estimate that reported funding per child is sufficient to meet all 10 benchmarks in only 15 states, taking into account the current operating schedules of thoseprograms. Local funding that is not reported certainly accounts for some of the shortfall, so the situation is less dire thanthese figures alone suggest. However, in some of the states with low funding levels, many providers are private organizationswithout the revenue-generating capacity of a local school district.

12
RECOMMENDATIONS:
• State pre-K programs appear to be at an important crossroads. Following a disastrous year in which the recessionintensified the negative effects of a longer-term trend, toward lower funding undermining educational effectiveness,funding increased slightly while enrollment declined. As state revenues return to normal growth, they need to movebeyond modest one or two percent increases just to make up for lost ground during the recession. If pre-K is to be made available to even all children under 200 percent of the poverty level within the next 20 years, even larger increaseswill be required.
• Major state policy changes will be required if states are to offer quality pre-K to all children, even in several states thatmade commitments to pre-K for all.
• States should set goals to increase enrollment substantially, while raising standards (or in fewer cases, maintaining highstandards) and providing stable funding at a level that can reasonably be expected to support those standards.
• States without limits on class size and ratio should collect data on actual class sizes to determine the distribution of thesewithin the state, particularly the extent to which there are very large classes. This is as simple as taking attendance andreporting average daily attendance, hardly a large reporting burden.
• States should collect data on the quality of teaching practices in their pre-K classrooms, from a sufficient sample to assesshow frequently good quality is provided, and to assess the strengths and weaknesses of current services.
• States should develop data systems that will provide demographic descriptions of who they serve in preschool and howwell they serve them. States should also identify where children are served (e.g., private programs or public schools) andall of the revenues supporting state pre-K, including those from local government, so that they know the true level offunding received by programs to support quality.
• The federal government should offer financial incentives for states to set and achieve ambitious goals for enrollment,quality standards, and state funding.
• Regardless of federal policy developments, every state should support high-quality pre-K, at least for children from low-income families.
• When states do not adequately support high-quality pre-K, counties, municipalities, and school districts can act on theirown. Across the nation, local initiatives are moving forward where states have lagged behind. In the 10 states that do not provide state-funded pre-K, at least 43,000 children receive preschool provided by their districts, according to datacollected by the Office of Civil Rights.
• Cities can follow the lead of a number of municipalities with notable efforts that exceed those of their states, includingBoston, Cleveland, Los Angeles, San Antonio, and San Francisco. Most recently, New York City’s commitment to Preschoolfor All paved the way for a remarkable renewed commitment by the state that could produce historic change beginningwith the 2014-2015 school year.
• Citizens can use the information provided here to compare their own state’s progress with that in other states and promisesmade by the Governor and state legislature, and to hold them accountable for results.

13
TABLE 2: PRE-K ACCESS BY STATE
ACCESS FOR4-YEAR-OLDSRANK STATE
PERCENT OF CHILDREN ENROLLED IN STATE PREKINDERGARTEN (2012-2013)
NUMBER OF CHILDREN ENROLLED IN STATE PREKINDERGARTEN (2012-2013)
4-year-olds 3-year-olds Total (3s and 4s) 4-year-olds 3-year-olds Total (3s and 4s)
For details about how these figures were calculated, see the Methodology section and Roadmap to the State Profile Pages.1 Nationwide, an additional 14,141 children of other ages were enrolled in state prekindergarten, for a total enrollment of 1,338,737.
1 DC 94% 80% 87% 6,518 5,401 11,919
2 Florida 78% 0% 40% 174,145 — 174,145
3 Oklahoma 74% 0% 37% 40,114 — 40,114
4 Vermont 71% 21% 46% 4,601 1,267 5,868
5 Wisconsin 64% 1% 33% 46,321 738 47,059
6 West Virginia 62% 9% 36% 13,394 1,912 15,306
7 Iowa 60% 4% 32% 24,710 1,462 26,172
8 Georgia 58% 0% 30% 81,683 — 81,683
9 Texas 52% 6% 29% 205,056 22,120 227,176
10 New York 45% 0% 23% 103,132 215 103,347
11 South Carolina 40% 4% 23% 24,929 2,548 27,477
12 Maryland 35% 4% 20% 26,402 3,005 29,407
13 Maine 34% 0% 18% 4,850 — 4,850
14 Arkansas 33% 14% 24% 13,240 5,503 18,743
15 Louisiana 31% 0% 16% 19,871 — 19,871
16 Kentucky 29% 8% 19% 16,639 4,178 20,817
17 New Jersey 28% 20% 24% 31,020 20,706 51,726
18 Illinois 27% 18% 23% 45,324 29,981 75,305
19 Nebraska 26% 11% 19% 6,914 2,979 9,893
20 North Carolina 23% 0% 12% 29,572 — 29,572
21 Tennessee 21% 1% 11% 17,893 601 18,494
22 Colorado 21% 7% 14% 14,789 4,481 19,270
23 Kansas 21% 0% 10% 8,514 — 8,514
24 Michigan 21% 0% 10% 24,547 — 24,547
25 New Mexico 18% 0% 9% 5,331 — 5,331
26 Virginia 17% 0% 8% 17,313 — 17,313
27 California 15% 10% 13% 79,474 47,463 126,937
28 Massachusetts 14% 4% 9% 10,499 2,665 13,165
29 Connecticut 13% 6% 10% 5,302 2,517 7,819
30 Pennsylvania 12% 5% 9% 17,910 7,442 25,353
31 Oregon 10% 5% 8% 4,716 2,449 7,165
32 Washington 8% 1% 5% 7,241 1,150 8,391
33 Delaware 7% 0% 4% 843 — 843
34 Alabama 6% 0% 3% 3,897 — 3,897
35 Missouri 3% 1% 2% 2,698 977 3,675
36 Nevada 3% 0% 2% 1,272 107 1,379
37 Alaska 3% 0% 2% 345 — 345
38 Arizona 3% 2% 3% 2,932 2,085 5,017
39 Ohio 2% 1% 2% 3,457 1,360 4,817
40 Minnesota 1% 1% 1% 1,044 687 1,731
41 Rhode Island 1% 0% 1% 144 — 144
No Program Hawaii 0.0% 0.0% 0.0% 0 0 0
No Program Idaho 0.0% 0.0% 0.0% 0 0 0
No Program Indiana 0.0% 0.0% 0.0% 0 0 0
No Program Mississippi 0.0% 0.0% 0.0% 0 0 0
No Program Montana 0.0% 0.0% 0.0% 0 0 0
No Program New Hampshire 0.0% 0.0% 0.0% 0 0 0
No Program North Dakota 0.0% 0.0% 0.0% 0 0 0
No Program South Dakota 0.0% 0.0% 0.0% 0 0 0
No Program Utah 0.0% 0.0% 0.0% 0 0 0
No Program Wyoming 0.0% 0.0% 0.0% 0 0 0
United States 27.9% 4.4% 16.4% 1,148,597 175,999 1,324,596

14
ENROLLMENT CHANGES FROM 2001-2002 TO 2012-2013 ENROLLMENT CHANGES FROM 2011-2012 TO 2012-2013Change in 3-year-olds Change in 4-year-olds Change in 3-year-olds Change in 4-year-olds
STATE NumberPercentage
Point NumberPercentage
Point NumberPercentage
Point NumberPercentage
Point
* At least one program in these states did not break down total enrollment figures into specific numbers of 3- and 4-year-olds served. As a result, the figures in this table are estimates.
TABLE 3: CHANGE IN PRESCHOOL ENROLLMENT OVER TIME
Alabama 0 0% 3,141 5% 0 0% -9 0%
Alaska 0 0% 345 3% 0 0% 134 1%
Arizona* 2,085 2% -1,345 -2% 1,800 2% 51 1%
Arkansas 4,561 12% 11,016 27% 1,019 3% -2,044 -1%
California 36,539 7% 34,940 7% -712 0% -14,392 -1%
Colorado 3,751 5% 6,469 7% 189 0% -119 0%
Connecticut 982 3% 885 3% -540 -1% -94 -1%
Delaware 0 0% 0 -1% 0 0% 0 0%
D.C. 4,276 60% 3,507 50% 679 11% -427 0%
Florida 0 0% 174,145 78% 0 0% -977 0%
Georgia 0 0% 18,070 5% 0 0% -1,185 0%
Hawaii 0 0% 0 0% 0 0% 0 0%
Idaho 0 0% 0 0% 0 0% 0 0%
Illinois 15,883 10% 6,422 6% -3,721 -2% -1,573 -1%
Indiana 0 0% 0 0% 0 0% 0 0%
Iowa 951 2% 23,154 56% 400 1% 3,045 5%
Kansas 0 0% 6,284 15% 0 0% -79 0%
Kentucky -694 -2% 3,822 5% 495 1% -838 0%
Louisiana 0 0% 12,352 19% 0 0% -550 0%
Maine 0 0% 3,410 25% 0 0% 345 2%
Maryland 1,597 2% 8,028 10% 80 0% 724 1%
Massachusetts* -6,767 -8% 1,067 2% 240 0% -214 0%
Michigan 0 0% -1,930 1% 0 0% 968 1%
Minnesota* -128 0% -226 0% 0 0% 0 0%
Mississippi 0 0% 0 0% 0 0% 0 0%
Missouri -1,569 -2% -988 -1% -68 0% -360 0%
Montana 0 0% 0 0% 0 0% 0 0%
Nebraska 2,855 11% 6,558 24% -593 -2% 1,007 1%
Nevada -4 0% 951 2% -133 0% 245 0%
New Hampshire 0 0% 0 0% 0 0% 0 0%
New Jersey 7,921 8% 7,139 8% 400 1% -214 1%
New Mexico -470 -2% 4,961 17% 0 0% 740 1%
New York -5,620 -2% 39,633 20% 14 0% 765 1%
North Carolina 0 0% 28,332 22% 0 0% 4,736 2%
North Dakota 0 0% 0 0% 0 0% 0 0%
Ohio -8,354 -5% -10,428 -7% -249 0% -107 0%
Oklahoma 0 0% 14,235 19% 0 0% 25 0%
Oregon 1,340 3% 2,127 4% 9 0% -13 0%
Pennsylvania* 7,442 5% 15,360 10% -373 0% -2,801 -1%
Rhode Island 0 0% 144 1% 0 0% 36 0%
South Carolina 2,198 4% 9,279 11% 37 0% -1,681 -1%
South Dakota 0 0% 0 0% 0 0% 0 0%
Tennessee -241 0% 16,135 19% 0 0% 0 0%
Texas 2,379 0% 77,473 12% 615 0% 1,913 0%
Utah 0 0% 0 0% 0 0% 0 0%
Vermont* 898 15% 3,981 63% 229 4% 249 5%
Virginia 0 0% 11,417 10% 0 0% 695 0%
Washington 1 0% 2,456 2% 126 0% -126 0%
West Virginia 144 1% 8,309 38% 5 0% 561 2%
Wisconsin* 50 0% 32,817 45% 10 0% 2,404 2%
Wyoming 0 0% 0 0% 0 0% 0 0%
U.S. 72,006 2% 583,448 14% -42 0% -9,160 -1%

TABLE 4: 2012-2013 ENROLLMENT OF 3- AND 4-YEAR-OLDS IN STATE PRE-K, PRESCHOOL SPECIAL EDUCATION, AND FEDERAL AND STATE HEAD START
15
* These states serve special education children in their state pre-K programs but were not able to provide an unduplicated count for at least one of their programs. Estimations were used based on theaverage percent of special education students in state pre-K and enrollment numbers for each program.
† These states serve special education children in their state-funded Head Start pre-K programs but were not able to provide an unduplicated count for the Head Start program. Estimations were usedbased on the percent of children with IEPs as reported by the PIR.
††This figure includes federally funded and state funded Head Start enrollment. For details about how these figures were calculated, see the Methodology section and the Roadmap to the State Profile Pages.
STATE
Pre-K + Pre-K Special Education Pre-K + Pre-K Special Education + Head Start††
3-year-olds 4-year-olds 3-year-olds 4-year-oldsNumberEnrolled
Percent of StatePopulation
NumberEnrolled
Percent of StatePopulation
NumberEnrolled
Percent of StatePopulation
NumberEnrolled
Percent of StatePopulation
Alabama 961 1.6% 5,202 8.3% 6,304 10.5% 14,338 22.9%
Alaska* 401 3.7% 975 9.1% 1,442 13.5% 2,340 21.7%
Arizona 4,821 5.4% 7,548 8.1% 9,850 11.0% 17,660 19.0%
Arkansas 7,320 18.8% 15,194 37.8% 11,911 30.6% 20,311 50.6%
California* 54,037 10.9% 93,775 18.2% 86,958 17.5% 148,254 28.7%
Colorado 7,175 10.5% 18,656 26.7% 11,070 16.5% 23,853 34.1%
Connecticut 4,277 10.9% 7,427 18.1% 6,836 17.4% 10,615 25.9%
Delaware† 463 4.2% 1,520 13.4% 1,273 11.6% 2,149 18.9%
D.C. 5,401 79.8% 6,518 93.9% 6,457 95.5% 6,945 100.0%
Florida 5,880 2.8% 176,361 79.5% 18,977 8.9% 196,576 88.6%
Georgia 2,331 1.7% 83,113 59.0% 13,638 10.1% 92,913 65.9%
Hawaii 632 3.6% 702 4.0% 1,601 9.1% 2,360 13.4%
Idaho 658 2.8% 1,002 4.1% 1,545 6.5% 3,129 12.8%
Illinois 32,320 19.9% 50,733 30.3% 47,392 29.2% 69,541 41.4%
Indiana 3,850 4.5% 5,131 5.8% 8,536 10.0% 12,728 14.5%
Iowa 2,326 5.8% 25,516 62.2% 4,911 12.3% 28,875 70.4%
Kansas 2,228 5.5% 11,822 28.5% 5,268 13.0% 14,988 36.2%
Kentucky 4,178 7.6% 16,639 29.0% 9,627 17.5% 25,434 44.3%
Louisiana* 1,197 1.9% 21,336 33.2% 11,407 18.4% 29,306 45.0%
Maine* 712 5.3% 5,903 42.0% 1,601 11.9% 7,284 51.8%
Maryland 5,867 8.1% 30,405 40.4% 12,120 16.7% 36,079 48.3%
Massachusetts 5,989 8.3% 13,801 18.4% 10,100 14.0% 18,969 25.3%
Michigan 3,751 3.2% 24,547 20.5% 16,164 14.0% 42,459 35.5%
Minnesota† 3,531 5.1% 5,506 7.4% 7,424 10.6% 11,034 15.2%
Mississippi 719 1.7% 1,770 4.1% 11,038 26.7% 16,024 37.0%
Missouri 3,445 4.4% 7,225 9.2% 9,302 12.2% 14,958 19.0%
Montana 187 1.4% 395 3.1% 1,765 14.1% 2,735 21.8%
Nebraska 2,979 11.3% 6,914 25.8% 4,703 17.9% 9,256 34.6%
Nevada 1,720 4.7% 3,868 10.1% 2,806 7.7% 5,342 13.9%
New Hampshire 867 6.4% 950 6.9% 1,392 10.3% 1,709 12.3%
New Jersey 25,165 23.8% 36,906 33.7% 31,119 29.5% 43,653 39.8%
New Mexico 1,264 4.4% 7,285 24.6% 4,377 15.4% 11,578 39.1%
New York* 16,304 7.2% 116,943 50.6% 34,329 15.2% 139,893 60.5%
North Carolina 3,527 2.8% 33,025 25.6% 10,440 8.3% 44,149 34.2%
North Dakota 282 3.0% 460 5.0% 1,371 14.7% 2,073 22.4%
Ohio 5,624 4.0% 10,434 7.2% 18,486 13.1% 27,597 19.1%
Oklahoma 802 1.5% 40,114 74.1% 8,141 15.5% 47,145 87.1%
Oregon 4,362 9.3% 7,089 14.6% 6,876 14.6% 11,156 23.0%
Pennsylvania*† 14,315 10.0% 26,804 18.1% 24,436 17.0% 42,005 28.4%
Rhode Island 604 5.5% 977 8.4% 1,287 11.8% 2,152 18.4%
South Carolina* 3,612 6.0% 25,953 42.1% 9,699 16.1% 31,421 50.9%
South Dakota 428 3.6% 780 6.4% 1,949 16.4% 2,942 24.0%
Tennessee 2,206 2.7% 19,684 23.4% 7,831 9.7% 29,092 34.6%
Texas 27,957 7.5% 208,856 52.6% 55,523 14.5% 244,713 61.6%
Utah 2,194 4.2% 3,103 5.9% 4,203 8.0% 6,884 13.0%
Vermont 1,446 23.5% 4,601 71.2% 1,822 29.5% 5,142 79.6%
Virginia* 3,221 3.2% 20,868 19.9% 7,954 7.9% 27,804 26.5%
Washington 3,993 4.4% 11,096 12.3% 7,916 8.9% 18,164 20.1%
West Virginia 1,912 9.3% 13,394 62.4% 3,790 18.4% 18,304 85.3%
Wisconsin† 3,410 4.9% 47,217 65.1% 9,393 13.4% 52,520 72.4%
Wyoming 610 7.7% 1,055 12.9% 1,244 15.7% 1,986 24.2%
50 States 293,462 7.4% 1,287,677 31.3% 564,709 14.2% 1,649,607 40.1%

TABLE 5: 2012-2013 STATE PRE-K QUALITY STANDARDS
16
STATE/PROGRAM
Teacherhas BA
Specializedtrainingin pre-K
Assistantteacher
has CDAor equiv.
At least15 hrs/yrin-service
Classsize 20
or lower
Staff-child
ratio 1:10or better
Vision,hearing,
health, and one support
serviceAt least
one mealSitevisits
QualityStandardsChecklist
Sum2012-2013
Alabama � � � � � � � � � � 10
Alaska � � � � � � � � � � 10
Arizona � � � � � 6
Arkansas � � � � � � � � � 9
California � � � � 4
Colorado � � � � � � 6
Connecticut � � � � � � 6
Delaware � � � � � � � � 8
D.C. � � � � � � � � 8
Florida � � � 3
Georgia � � � � � � � � 8
Illinois � � � � � � � � 8
Iowa Shared Visions � � � � � � 6
Iowa SVPP � � � � � � � 7
Kansas At-Risk � � � � � � 6
Kansas Pilot Pre-K � � � � � � 6
Kentucky � � � � � � � � � 9
Louisiana 8(g) � � � � � � � 7
Louisiana LA4 � � � � � � � � 8
Louisiana NSECD � � � � � � � � � � 10
Maine � � � � � � 6
Maryland � � � � � � � � 8
Massachusetts � � � � � � 6
Michigan � � � � � � � 7
Minnesota � � � � � � � � � 9
Missouri � � � � � � � 8
Nebraska � � � � � � 6
Nevada � � � � � � � 7
New Jersey Abbott � � � � � � � � � 9
New Jersey ECPA � � � � � � � � 8
New Jersey ELLI � � � � � � � � 8
New Mexico � � � � � � � � 8
New York � � � � � � � 7
North Carolina � � � � � � � � � � 10
Ohio ECE � � � � 4
Oklahoma � � � � � � � � � 9
Oregon � � � � � � � � 8
Pennsylvania EABG � � � � 4
Pennsylvania HSSAP � � � � � � � � 8
Pennsylvania K4 � � 2
Pennsylvania Pre-K Counts � � � � � � � 7
Rhode Island � � � � � � � � � � 10
South Carolina 4K � � � � � � 6
South Carolina CDEPP � � � � � � � 7
Tennessee � � � � � � � � � 9
Texas � � 2
Vermont Act 62 � � � � 4
Vermont EEI � � � � 4
Virginia � � � � � � 6
Washington � � � � � � � � � 9
West Virginia � � � � � � � � 8
Wisconsin 4K � � � � � 5
Wisconsin HdSt � � � � � � � 7
Totals 53 30 45 15 42 45 46 36 25 32
Comprehensiveearly learning
standards

TABLE 6: PRE-K RESOURCES PER CHILD ENROLLED BY STATE
17
For details about how these figures were calculated, see the Methodology section and Roadmap to the State Profile Pages.
STATE
Resources rankbased on
state spendingState $ per childenrolled in pre-K
Change in stateper-child spending from2011-2012 to 2012-2013
Adjusted dollars
Total statepreschool spending
in 2012-2013
Change in total state spending from
2011-2012 to 2012-2013Adjusted dollars
District of Columbia 1 $14,690 $497 $175,096,000 $15,182,177
New Jersey 2 $12,070 $228 $624,344,361 $14,008,769
Connecticut 3 $9,810 $1,290 $93,064,999 $16,448,214
Rhode Island 4 $9,278 $5,911 $1,336,000 $972,375
Oregon 5 $8,491 -$151 $61,000,000 -$958,481
Minnesota 6 $7,592 -$119 $13,764,296 -$216,276
Alaska 7 $7,246 -$937 $2,500,000 $773,288
Delaware 8 $6,795 -$107 $5,727,800 -$90,000
Washington 9 $6,672 -$98 $55,980,678 -$826,039
West Virginia 10 $5,894 -$203 $92,946,182 -$138,034
Pennsylvania 11 $5,680 $120 $145,529,413 -$14,538,694
Arkansas 12 $5,514 $20 $111,000,000 -$1,744,121
North Carolina 13 $4,960 -$281 $146,677,533 $16,516,619
Alabama 14 $4,898 -$65 $19,087,050 -$299,812
Louisiana 15 $4,620 $91 $91,803,989 -$692,615
Tennessee 16 $4,611 $12 $85,807,267 $228,622
California 17 $4,541 $340 $588,454,032 -$16,539,537
Michigan 18 $4,452 -$40 $109,275,000 $3,361,548
Maryland 19 $4,386 $721 $128,992,934 $24,107,939
Massachusetts 20 $3,966 -$156 $52,887,295 -$1,798,307
Ohio 21 $3,927 -$116 $22,385,387 -$659,558
Vermont 22 $3,778 -$25 $22,469,844 $1,775,261
Virginia 23 $3,752 -$86 $64,953,097 $1,186,463
Kentucky 24 $3,621 $32 $75,373,534 -$566,394
Oklahoma 25 $3,611 -$98 $144,859,409 -$3,847,604
New York 26 $3,609 -$155 $373,010,631 -$13,133,011
New Mexico 27 $3,604 $393 $19,214,600 $4,472,240
Georgia 28 $3,599 $54 $293,939,678 $172,523
Wisconsin 29 $3,366 $50 $167,264,100 $10,982,364
Texas 30 $3,311 $28 $753,338,055 $14,698,154
Illinois 31 $3,189 -$72 $241,161,135 -$22,691,485
Iowa 32 $2,674 -$803 $71,234,408 -$8,489,383
Nevada 33 $2,397 -$236 $3,338,875 -$52,463
Maine 34 $2,296 $48 $11,680,725 $927,358
Florida 35 $2,242 -$75 $390,360,150 -$15,380,093
Kansas 36 $2,163 $7 $18,417,032 -$113,005
Colorado 37 $2,159 $216 $42,181,888 $4,341,080
Missouri 38 $2,067 -$658 $7,595,493 -$3,582,359
Arizona 39 $2,028 -$932 $13,211,842 $3,843,026
South Carolina 40 $1,300 $54 $35,708,905 -$561,087
Nebraska 41 $1,273 $314 $13,288,170 $3,507,374
Hawaii No program $0 $0 $0 $0
Idaho No program $0 $0 $0 $0
Indiana No program $0 $0 $0 $0
Mississippi No program $0 $0 $0 $0
Montana No program $0 $0 $0 $0
New Hampshire No program $0 $0 $0 $0
North Dakota No program $0 $0 $0 $0
South Dakota No program $0 $0 $0 $0
Utah No program $0 $0 $0 $0
Wyoming No program $0 $0 $0 $0
United States $4,026 $36 $5,390,261,787 $30,587,038
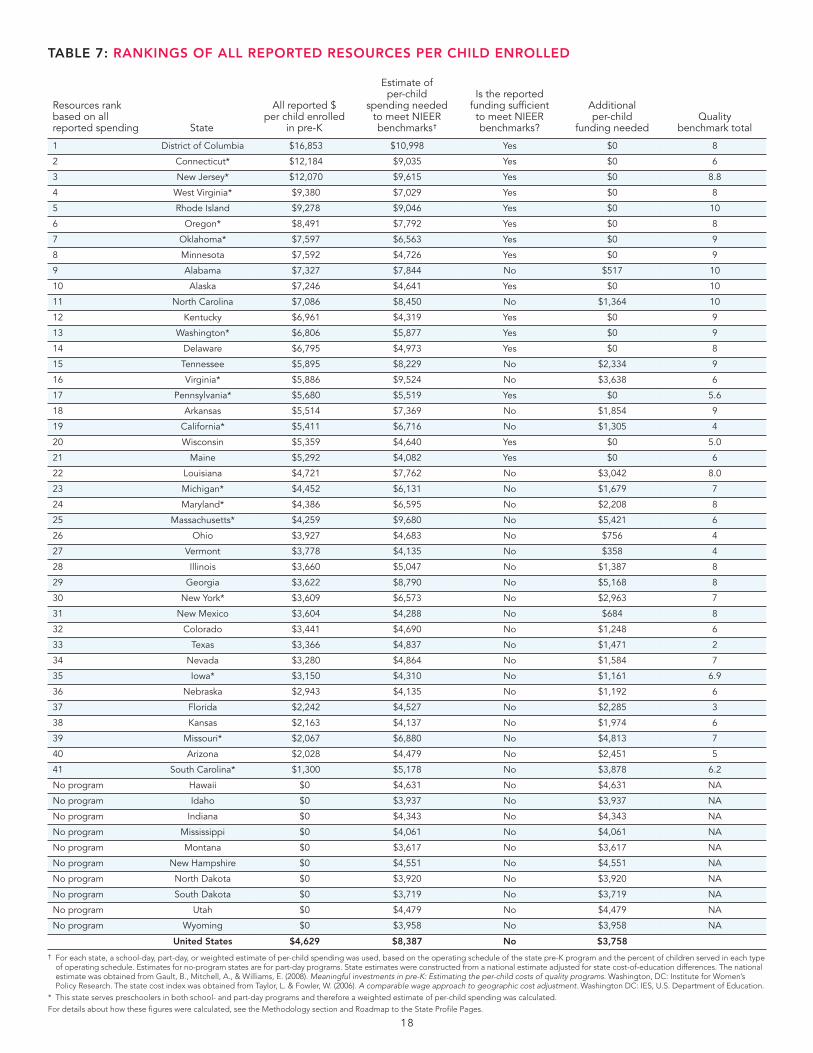
TABLE 7: RANKINGS OF ALL REPORTED RESOURCES PER CHILD ENROLLED
18
Resources rankbased on allreported spending State
All reported $per child enrolled
in pre-K
Estimate ofper-child
spending neededto meet NIEERbenchmarks†
Is the reportedfunding sufficientto meet NIEERbenchmarks?
Additionalper-child
funding neededQuality
benchmark total
† For each state, a school-day, part-day, or weighted estimate of per-child spending was used, based on the operating schedule of the state pre-K program and the percent of children served in each typeof operating schedule. Estimates for no-program states are for part-day programs. State estimates were constructed from a national estimate adjusted for state cost-of-education differences. The nationalestimate was obtained from Gault, B., Mitchell, A., & Williams, E. (2008). Meaningful investments in pre-K: Estimating the per-child costs of quality programs. Washington, DC: Institute for Women’sPolicy Research. The state cost index was obtained from Taylor, L. & Fowler, W. (2006). A comparable wage approach to geographic cost adjustment. Washington DC: IES, U.S. Department of Education.
* This state serves preschoolers in both school- and part-day programs and therefore a weighted estimate of per-child spending was calculated.For details about how these figures were calculated, see the Methodology section and Roadmap to the State Profile Pages.
1 District of Columbia $16,853 $10,998 Yes $0 8
2 Connecticut* $12,184 $9,035 Yes $0 6
3 New Jersey* $12,070 $9,615 Yes $0 8.8
4 West Virginia* $9,380 $7,029 Yes $0 8
5 Rhode Island $9,278 $9,046 Yes $0 10
6 Oregon* $8,491 $7,792 Yes $0 8
7 Oklahoma* $7,597 $6,563 Yes $0 9
8 Minnesota $7,592 $4,726 Yes $0 9
9 Alabama $7,327 $7,844 No $517 10
10 Alaska $7,246 $4,641 Yes $0 10
11 North Carolina $7,086 $8,450 No $1,364 10
12 Kentucky $6,961 $4,319 Yes $0 9
13 Washington* $6,806 $5,877 Yes $0 9
14 Delaware $6,795 $4,973 Yes $0 8
15 Tennessee $5,895 $8,229 No $2,334 9
16 Virginia* $5,886 $9,524 No $3,638 6
17 Pennsylvania* $5,680 $5,519 Yes $0 5.6
18 Arkansas $5,514 $7,369 No $1,854 9
19 California* $5,411 $6,716 No $1,305 4
20 Wisconsin $5,359 $4,640 Yes $0 5.0
21 Maine $5,292 $4,082 Yes $0 6
22 Louisiana $4,721 $7,762 No $3,042 8.0
23 Michigan* $4,452 $6,131 No $1,679 7
24 Maryland* $4,386 $6,595 No $2,208 8
25 Massachusetts* $4,259 $9,680 No $5,421 6
26 Ohio $3,927 $4,683 No $756 4
27 Vermont $3,778 $4,135 No $358 4
28 Illinois $3,660 $5,047 No $1,387 8
29 Georgia $3,622 $8,790 No $5,168 8
30 New York* $3,609 $6,573 No $2,963 7
31 New Mexico $3,604 $4,288 No $684 8
32 Colorado $3,441 $4,690 No $1,248 6
33 Texas $3,366 $4,837 No $1,471 2
34 Nevada $3,280 $4,864 No $1,584 7
35 Iowa* $3,150 $4,310 No $1,161 6.9
36 Nebraska $2,943 $4,135 No $1,192 6
37 Florida $2,242 $4,527 No $2,285 3
38 Kansas $2,163 $4,137 No $1,974 6
39 Missouri* $2,067 $6,880 No $4,813 7
40 Arizona $2,028 $4,479 No $2,451 5
41 South Carolina* $1,300 $5,178 No $3,878 6.2
No program Hawaii $0 $4,631 No $4,631 NA
No program Idaho $0 $3,937 No $3,937 NA
No program Indiana $0 $4,343 No $4,343 NA
No program Mississippi $0 $4,061 No $4,061 NA
No program Montana $0 $3,617 No $3,617 NA
No program New Hampshire $0 $4,551 No $4,551 NA
No program North Dakota $0 $3,920 No $3,920 NA
No program South Dakota $0 $3,719 No $3,719 NA
No program Utah $0 $4,479 No $4,479 NA
No program Wyoming $0 $3,958 No $3,958 NA
United States $4,629 $8,387 No $3,758

19
NIEER’s State Preschool Yearbook series focuses on state-funded preschool education initiatives meeting thefollowing criteria:
• The initiative is funded, controlled, and directed by the state.
• The initiative serves children of preschool age, usually 3 and/or 4. Although initiatives in some states servebroader age ranges, programs that serve only infants and toddlers are excluded.
• Early childhood education is the primary focus of the initiative. This does not exclude programs that offer parenteducation, but does exclude programs that mainly focus on parent education. Programs that focus on parentwork status or programs where child eligibility is tied to work status are also excluded.
• The initiative offers a group learning experience to children at least two days per week.
• State-funded preschool education initiatives must be distinct from the state’s system for subsidized child care.However, preschool initiatives may be coordinated and integrated with the subsidy system for child care.
• The initiative is not primarily designed to serve children with disabilities, but services may be offered to children with disabilities.
• State supplements to the federal Head Start program are considered to constitute de facto state preschoolprograms if they substantially expand the number of children served, and if the state assumes someadministrative responsibility for the program. State supplements to fund quality improvements, extended days, or other program enhancements or to fund expanded enrollment only minimally are not consideredequivalent to a state preschool program.
While ideally this report would identify all preschool education funding streams at the federal, state, and locallevels, there are a number of limitations on the data that make this extremely difficult to do. For example,preschool is only one of several types of education programs toward which local districts can target their Title Ifunds. Many states do not track how Title I funds are used at the local level and therefore do not know the extentto which they are spent on preschool education. Another challenge involves tracking total state spending for child care, using a variety of available sources, such as CCDF dollars, TANF funds, and any state funding above and beyond the required matches for federal funds. Although some of these child care funds may be used forhigh-quality, educational, center-based programs for 3- and 4-year-olds that closely resemble programs supportedby state-funded preschool education initiatives, it is nearly impossible to determine what proportion of the childcare funds are spent this way.
WHAT QUALIFIES AS A STATE PRESCHOOL PROGRAM?
AGE GROUPINGS USED IN THIS REPORT
Children considered to be 3 years old during the 2012-2013 school year are those who are eligible to enterkindergarten two years later, during the 2014-2015 school year. Children considered to be 4 years old duringthe 2012-2013 school year were eligible to enter kindergarten one year later, during the 2013-2014 schoolyear. Children considered to be 5 years old during 2012-2013 school year were already eligible forkindergarten at the beginning of the 2012-2013 school year.


![Food security and nutrition: building a global narrative ... · EXECUTIVE SUMMARY EXECUTIVE SUMMARY EXECUTIVE SUMMARY EXECUTIVE SUMMAR Y [ 2 ] This document contains the Summary and](https://img.pdfslide.net/doc/110x75/5ff5433612d22125fb06e6b5/food-security-and-nutrition-building-a-global-narrative-executive-summary-executive.jpg)