Embed Size (px)
Citation preview
Government Finance Officers Association Award ................................. ES-3Association of School Business Officials International Award ....................... ES-4Board of School Trustees ..................................................................... ES-5Executive Cabinet ................................................................................. ES-6Administrative Responsibilities Descriptions ........................................ ES-7Superintendent’s Transmittal Letter ...................................................... ES-9
Executive Summary: Budget Presentation ...........................................................................ES-10 Financial Reporting Entity ...................................................................ES-10 Majors Goals and Objectives ..............................................................ES-10 Budget Process ..................................................................................ES-11 Budget Policies and Organization.......................................................ES-11 Governmental Accounting - Funds Overview .....................................ES-12 Financial Plan .....................................................................................ES-12 Districtwide Funds Analysis ................................................................ES-13 The General Operating Budget – General and Special Education Funds Combined ...........................ES-14 Debt Service Funds ............................................................................ES-17 Capital Projects Funds........................................................................ES-17 Other Funds ........................................................................................ES-18 Fiscal Year 2017-18 Budget Development Considerations ................ES-18 Economic Environment in Southern Nevada ......................................ES-18 Enrollment...........................................................................................ES-19 District Organization Plan ...................................................................ES-19 “ACHIEVE” - Reorganization of the District ........................................ES-19 Need for Future Classrooms...............................................................ES-21 Student Achievement ..........................................................................ES-21 School Accountability ..........................................................................ES-21
ES-12017-18 Comprehensive Annual Budget Report |
Executive Summary

ES-2 | Clark County School District
This page is intentionally left blank
Exec
utiv
e Su
mm
ary
ES-32017-18 Comprehensive Annual Budget Report |
Exec
utiv
e Su
mm
ary
The Government Finance Officers Association of the United States and Canada (GFOA) presented an award for Distinguished Presentation to the Clark County School District for its annual budget for the fiscal year beginning July 1, 2016.
In order to receive this award, a governmental unit must publish a budget document that meets program criteria as a policy document, as an operations guide, as a financial plan, and as a communications device.
The award is valid for a period of one year only. We believe our current budget continues to conform to program requirements, and we are submitting it to GFOA to determine its eligibility for another award.
ES-4 | Clark County School District
This Meritorious Budget Award is presented to
CLARK COUNTY SCHOOL DISTRICTfor excellence in the preparation and issuance of its budget
for the Fiscal Year 2016-2017.
The budget adheres to the principles and standards of ASBO International’s Meritorious Budget Award criteria.
Brenda R. Burkett, CPA, CSBA, SFO John D. Musso, CAE, RSBAPresident Executive Director

ES-52017-18 Comprehensive Annual Budget Report |
http://ccsd.net/trustees/details/E
Exec
utiv
e Su
mm
ary
The Clark County Board of School Trustees is a dedicated group of community leaders who are elected to overlapping four-year terms and represent a specific geographic region of Clark County. Although each trustee represents a different region, they are dedicated to ensuring the success of every student in the district through clear, concise direction to the superintendent. The trustees bring a wealth of experience and concern for children
to their position.
Vision StatementAll students progress in school and graduate prepared to succeed and contribute in a diverse global society.
Board of School Trustees
PresidentDeanna L. WrightDistrict Ahttp://ccsd.net/trustees/details/A
MemberLinda Cavozos
District Ghttp://ccsd.net/trustees/details/G
MemberKevin L. Child
District Dhttp://ccsd.net/trustees/details/D
ClerkCarolyn EdwardsDistrict Fhttp://ccsd.net/trustees/details/F
MemberLola Brooks
District Ehttp://ccsd.net/trustees/details/E
MemberChris Garvey
District Bhttp://ccsd.net/trustees/details/B
Vice PresidentDr. Linda E. YoungDistrict Chttp://ccsd.net/trustees/details/C
5100 West Sahara AvenueLas Vegas, NV 89146
http://ccsd.net/trustees/

ES-6 | Clark County School District
Carlos McDadeChief General Counsel
This publication is designed to provide helpful information to parents, students, employees, and governmental agencies, and to better inform all readers about the District’s budget and our many strengths. You also will discover a host of facts about our financial history, capital improvement projects, day-to-day operations, and a great deal of other information. With the current economic challenges facing the District and our need to reduce costs while improving performance, this publication is more important than ever. We are committed to providing the best education possible for every child.
“Together, we can ensure the success of every student in every classroom, without exceptions, without excuses.”
Pat SkorkowskySuperintendentOffice of the Superintendent5100 West Sahara Avenue Las Vegas, NV 89146
Executive Cabinet
Communications Office(702) 799-5304newsroom.ccsd.net
Kimberly WoodenDeputy Superintendent
Edward GoldmanAssociate Superintendent of Employee Management Relations and Chief Negotiator
Kirsten SearerChief Communications, Marketing and Strategy Officer
Jason GoudieChief Financial Officer
Andre LongChief Human Resources Officer
Mike BartonChief Academic Officer
Greta PeayChief Instructional Services Officer
Nicole RourkeAssociate Superintendent of Community and Government Relations
Richard NealChief Operating Officer
Exec
utiv
e Su
mm
ary
ES-72017-18 Comprehensive Annual Budget Report |
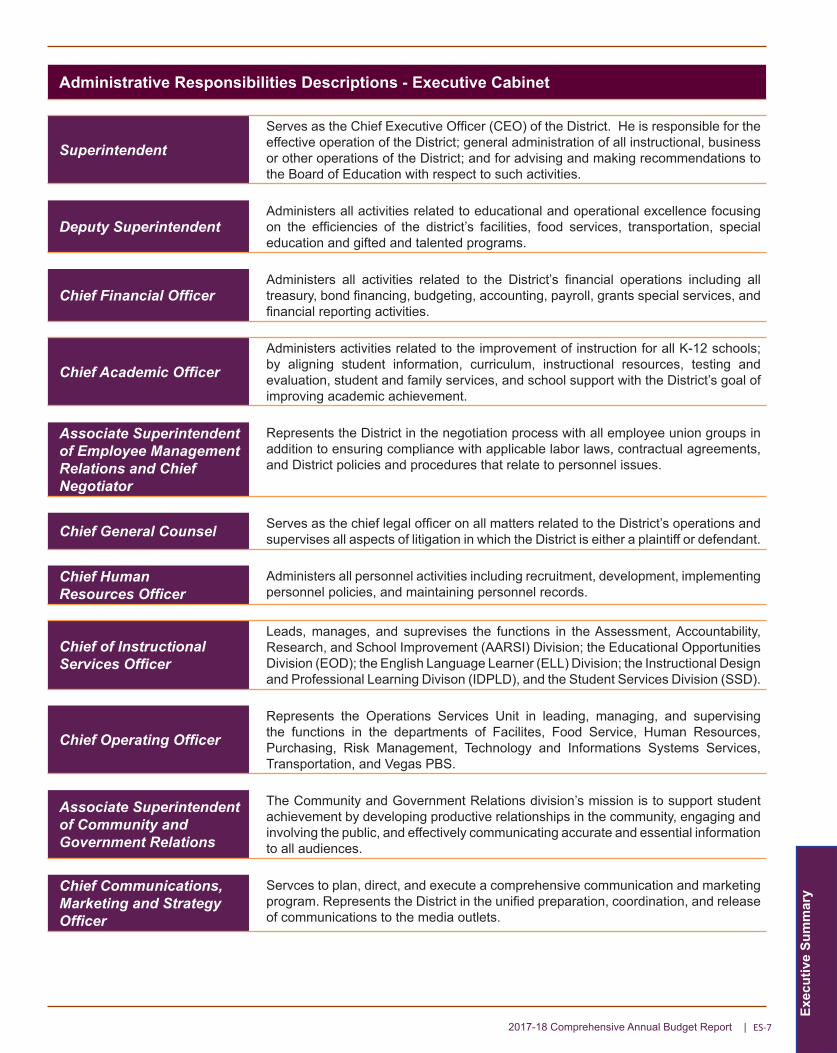
Administrative Responsibilities Descriptions - Executive Cabinet
SuperintendentServes as the Chief Executive Officer (CEO) of the District. He is responsible for the effective operation of the District; general administration of all instructional, business or other operations of the District; and for advising and making recommendations to the Board of Education with respect to such activities.
Deputy SuperintendentAdministers all activities related to educational and operational excellence focusing on the efficiencies of the district’s facilities, food services, transportation, special education and gifted and talented programs.
Chief Financial OfficerAdministers all activities related to the District’s financial operations including all treasury, bond financing, budgeting, accounting, payroll, grants special services, and financial reporting activities.
Chief Academic Officer Administers activities related to the improvement of instruction for all K-12 schools; by aligning student information, curriculum, instructional resources, testing and evaluation, student and family services, and school support with the District’s goal of improving academic achievement.
Associate Superintendent of Employee Management Relations and Chief Negotiator
Represents the District in the negotiation process with all employee union groups in addition to ensuring compliance with applicable labor laws, contractual agreements, and District policies and procedures that relate to personnel issues.
Chief General Counsel Serves as the chief legal officer on all matters related to the District’s operations and supervises all aspects of litigation in which the District is either a plaintiff or defendant.
Chief Human Resources Officer
Administers all personnel activities including recruitment, development, implementing personnel policies, and maintaining personnel records.
Chief of Instructional Services Officer
Leads, manages, and suprevises the functions in the Assessment, Accountability, Research, and School Improvement (AARSI) Division; the Educational Opportunities Division (EOD); the English Language Learner (ELL) Division; the Instructional Design and Professional Learning Divison (IDPLD), and the Student Services Division (SSD).
Chief Operating OfficerRepresents the Operations Services Unit in leading, managing, and supervising the functions in the departments of Facilites, Food Service, Human Resources, Purchasing, Risk Management, Technology and Informations Systems Services, Transportation, and Vegas PBS.
Associate Superintendent of Community and Government Relations
The Community and Government Relations division’s mission is to support student achievement by developing productive relationships in the community, engaging and involving the public, and effectively communicating accurate and essential information to all audiences.
Chief Communications, Marketing and Strategy Officer
Servces to plan, direct, and execute a comprehensive communication and marketing program. Represents the District in the unified preparation, coordination, and release of communications to the media outlets.
ES-8 | Clark County School District
This page is intentionally left blank

ES-92017-18 Comprehensive Annual Budget Report |
Exec
utiv
e Su
mm
ary
ES-10 | Clark County School District
Budget Presentation
The Comprehensive Annual Budget Report is intended to provide a comprehensive disclosure of all budgetary matters impacting the District’s financial plan. It is prepared in accordance with the professional best practices provided by the Government Finance Officers Association (GFOA) and Association of School Business Officials International (ASBO) budget preparation award programs for the benefit of the citizens and other users of its financial information.
The District’s budgeted financial information is prepared and maintained using the modified accrual basis of accounting for all governmental funds and the accrual basis of accounting for all proprietary funds. These bases conform with generally accepted accounting principles (GAAP). Unencumbered appropriations are not carried forward into subsequent fiscal periods.
The Comprehensive Annual Budget Report conforms to recommended practices put forth by the ASBO’s Meritorious Budget Award (MBA) program while maintaining its practices acceptable to the GFOA’s Distinguished Budget Presentation Award program. This report is organized into an executive summary and organizational, financial, and informational sections. Please reference the table of contents for indexed location of financial information.
Financial Reporting Entity
The Comprehensive Annual Budget Report includes all of the activities that comprise the financial reporting entity of the Clark County School District (“District”). The District is governed by an elected, seven member Board of School Trustees (“Board”). The Board is legally separate and fiscally independent from other governing bodies; therefore, the District is a primary government and is not reported as a component unit by any other governmental unit. The District’s boundaries are contiguous with Clark County, Nevada and encompass 8,012 square miles of the southern tip of the State.
Comprehensive educational services are provided to all resident students in grades kindergarten through twelfth. The District operates 358 schools and will serve an estimated 323,380 students during 2017-18.
Major Goals and Objectives
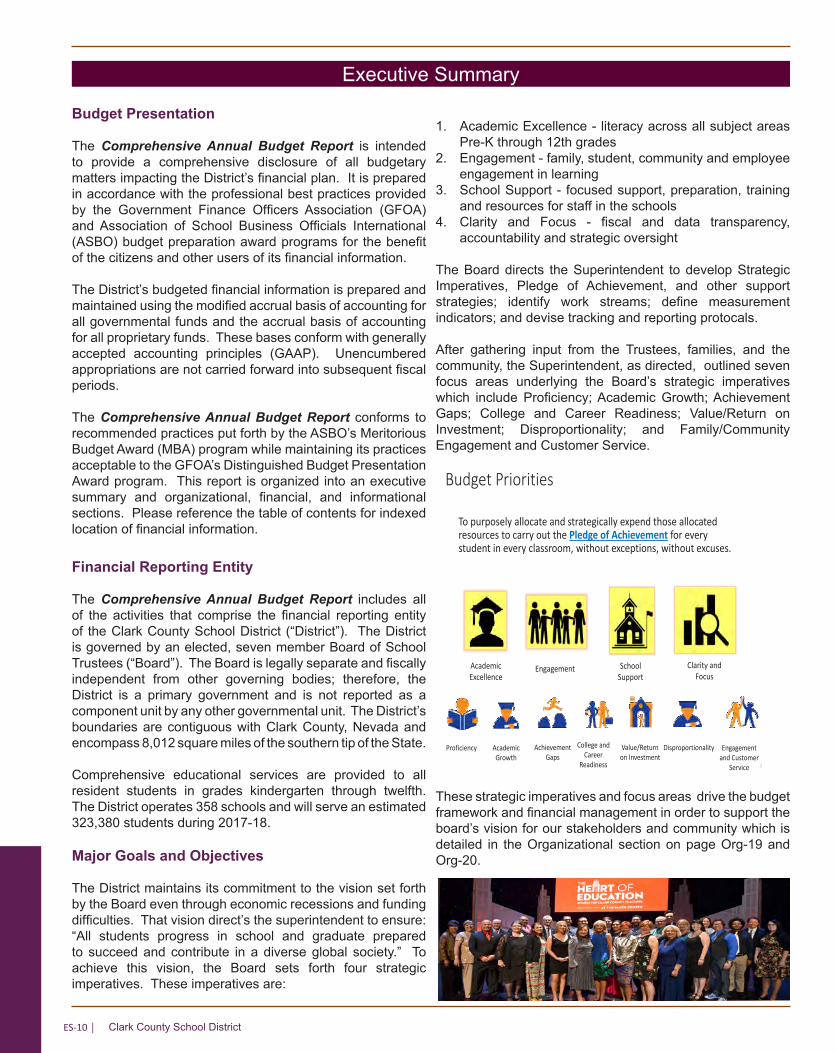
The District maintains its commitment to the vision set forth by the Board even through economic recessions and funding difficulties. That vision direct’s the superintendent to ensure: “All students progress in school and graduate prepared to succeed and contribute in a diverse global society.” To achieve this vision, the Board sets forth four strategic imperatives. These imperatives are:
1. Academic Excellence - literacy across all subject areas Pre-K through 12th grades
2. Engagement - family, student, community and employee engagement in learning
3. School Support - focused support, preparation, training and resources for staff in the schools
4. Clarity and Focus - fiscal and data transparency, accountability and strategic oversight
The Board directs the Superintendent to develop Strategic Imperatives, Pledge of Achievement, and other support strategies; identify work streams; define measurement indicators; and devise tracking and reporting protocals.
After gathering input from the Trustees, families, and the community, the Superintendent, as directed, outlined seven focus areas underlying the Board’s strategic imperatives which include Proficiency; Academic Growth; Achievement Gaps; College and Career Readiness; Value/Return on Investment; Disproportionality; and Family/Community Engagement and Customer Service.
These strategic imperatives and focus areas drive the budget framework and financial management in order to support the board’s vision for our stakeholders and community which is detailed in the Organizational section on page Org-19 and Org-20.
Executive Summary
Budget Priorities
To purposely allocate and strategically expend those allocated resources to carry out the Pledge of Achievement for every student in every classroom, without exceptions, without excuses.
1
Proficiency Achievement Gaps
Academic Growth
DisproportionalityValue/Return on Investment
College and Career
Readiness
Academic Excellence
Engagement School Support
Clarity and Focus
Engagement and Customer
Service
Exec
utiv
e Su
mm
ary
ES-112017-18 Comprehensive Annual Budget Report |
Budget Policies and Organization
Resource management is guided and constrained by Board policies. These policies, as they relate to budget and finance, are established through Board regulations 3110 and 3130. These Board regulations set forth the authority and expectations to manage District resources based on established guidelines.
Additional guidelines are provided through performance measurements set in the negative. These performance measurements, as they relate to budget and finance, are communicated through Superintendent Evaluations (SE). Superintendent Evaluations communicate expectations for management by limiting the abilities of management to harm the organization through strategic planning and/or day to day operational decision making.
The accounting and budgeting policies of the District conform to the accounting principles and budgeting best practices for local districts as prescribed by the Nevada Department of Education and generally accepted accounting principles.
Basis of budgeting refers to when revenues and expenditures or expenses are recognized in the accounts and reported on the financial statements. Basis of budgeting relates to the timing of the measurement made, regardless of the measurement focus applied.
Funds included in the preparation of the fiscal year 2017-18 budget are reflected on the following page titled District Funds.
Budget Process
Budgeting in the District is on a July 1 through June 30 fiscal year basis and is a year-round process. The cycle begins in the fall of the prior school year and continues until a final budget is filed with the Nevada Department of Education and the Nevada Department of Taxation in the spring of the following year. After the Average Daily Enrollment (ADE) is calculated for the first quarter of the fiscal year, the District is required to adopt an amended final budget on or before January 1, reflecting any adjustments necessary as a result of the Average Daily Enrollment.
The process of budget formulation begins with the Budget Department. This process of budget formulation is a participation process, led by the Chief Academic Officer, that includes the Superintendent’s Executive Cabinet (Superintendency). After reviewing their various budget needs, the Superintendency submits their requests for staffing, supplies, and equipment to the Budget Department. These requests are then summarized by the Budget Department, whose responsibility is to prepare a tentative budget for consideration by the superintendent and presentation to the Board for approval.
An amended budget may be approved by the Board in any year in which the legislature increases (or decreases) the revenues of a local government, if the increase (or decrease) was not included or anticipated in the local government’s final budget as adopted. The 2017-18 Final Budget was adopted by the Board on May 17, 2017. This 2017-18 Comprehensive Annual Budget Report reflects the final budget.
After the Board approved the amended final budget, it became the responsibility of the Budget Department to implement and monitor the budget. A system of budget allotments is established for each departmental unit (reference unit budgets in the General Operating Budget section). Daily review of transaction data is available with user access through network connections which reflect appropriation levels, encumbrances, and year-to-date expenditures. This reporting system also enables the Budget Department to monitor all of the District’s budgets on a regular basis and provides the necessary controls.
If it becomes necessary during the course of the year to change any of the departmental budgets, transfers are initiated by department heads and approved by the appropriate administrator. Transfers between programs or function classifications require approval of the Board.
ES-12 | Clark County School District
Governmental Accounting - Funds Overview
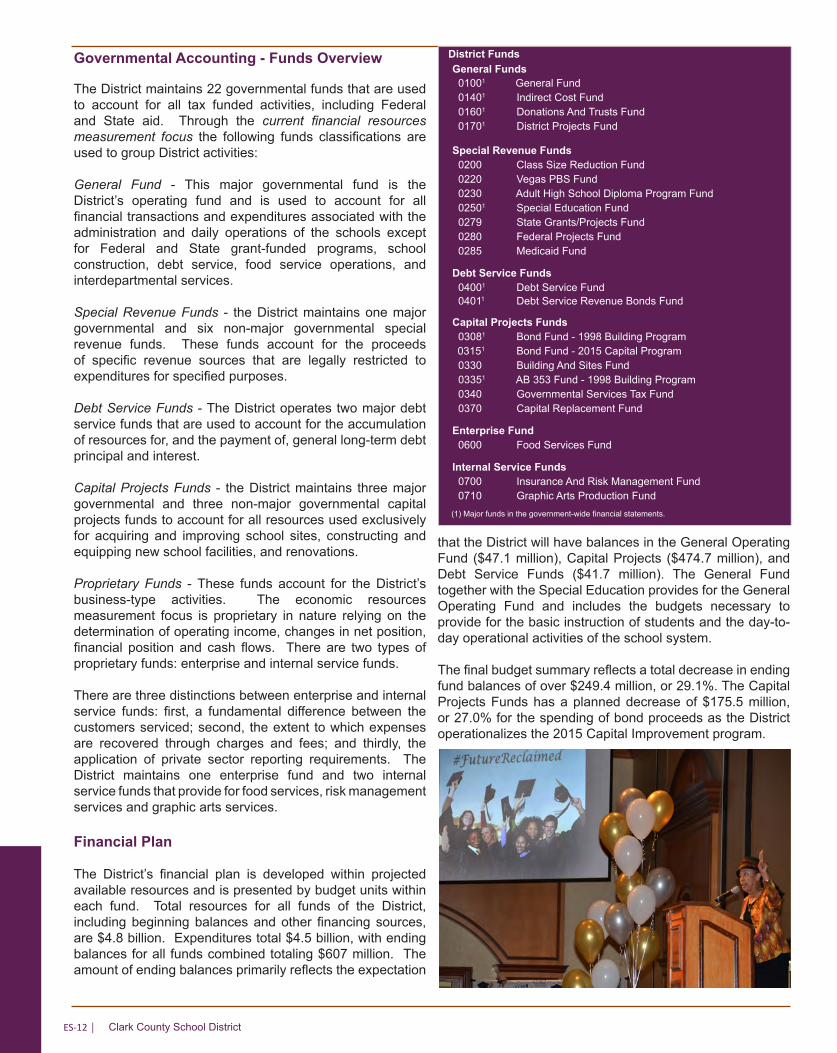
The District maintains 22 governmental funds that are used to account for all tax funded activities, including Federal and State aid. Through the current financial resources measurement focus the following funds classifications are used to group District activities:
General Fund - This major governmental fund is the District’s operating fund and is used to account for all financial transactions and expenditures associated with the administration and daily operations of the schools except for Federal and State grant-funded programs, school construction, debt service, food service operations, and interdepartmental services.
Special Revenue Funds - the District maintains one major governmental and six non-major governmental special revenue funds. These funds account for the proceeds of specific revenue sources that are legally restricted to expenditures for specified purposes.
Debt Service Funds - The District operates two major debt service funds that are used to account for the accumulation of resources for, and the payment of, general long-term debt principal and interest.
Capital Projects Funds - the District maintains three major governmental and three non-major governmental capital projects funds to account for all resources used exclusively for acquiring and improving school sites, constructing and equipping new school facilities, and renovations.
Proprietary Funds - These funds account for the District’s business-type activities. The economic resources measurement focus is proprietary in nature relying on the determination of operating income, changes in net position, financial position and cash flows. There are two types of proprietary funds: enterprise and internal service funds.
There are three distinctions between enterprise and internal service funds: first, a fundamental difference between the customers serviced; second, the extent to which expenses are recovered through charges and fees; and thirdly, the application of private sector reporting requirements. The District maintains one enterprise fund and two internal service funds that provide for food services, risk management services and graphic arts services.
Financial Plan
The District’s financial plan is developed within projected available resources and is presented by budget units within each fund. Total resources for all funds of the District, including beginning balances and other financing sources, are $4.8 billion. Expenditures total $4.5 billion, with ending balances for all funds combined totaling $607 million. The amount of ending balances primarily reflects the expectation
that the District will have balances in the General Operating Fund ($47.1 million), Capital Projects ($474.7 million), and Debt Service Funds ($41.7 million). The General Fund together with the Special Education provides for the General Operating Fund and includes the budgets necessary to provide for the basic instruction of students and the day-to-day operational activities of the school system.
The final budget summary reflects a total decrease in ending fund balances of over $249.4 million, or 29.1%. The Capital Projects Funds has a planned decrease of $175.5 million, or 27.0% for the spending of bond proceeds as the District operationalizes the 2015 Capital Improvement program.
District Funds General Funds 01001 General Fund 01401 Indirect Cost Fund 01601 Donations And Trusts Fund 01701 District Projects Fund
Special Revenue Funds 0200 Class Size Reduction Fund 0220 Vegas PBS Fund 0230 Adult High School Diploma Program Fund 02501 Special Education Fund 0279 State Grants/Projects Fund 0280 Federal Projects Fund 0285 Medicaid Fund
Debt Service Funds 04001 Debt Service Fund 04011 Debt Service Revenue Bonds Fund
Capital Projects Funds 03081 Bond Fund - 1998 Building Program03151 Bond Fund - 2015 Capital Program
0330 Building And Sites Fund 03351 AB 353 Fund - 1998 Building Program 0340 Governmental Services Tax Fund 0370 Capital Replacement Fund
Enterprise Fund 0600 Food Services Fund
Internal Service Funds 0700 Insurance And Risk Management Fund 0710 Graphic Arts Production Fund
(1) Major funds in the government-wide financial statements.
Exec
utiv
e Su
mm
ary
ES-132017-18 Comprehensive Annual Budget Report |
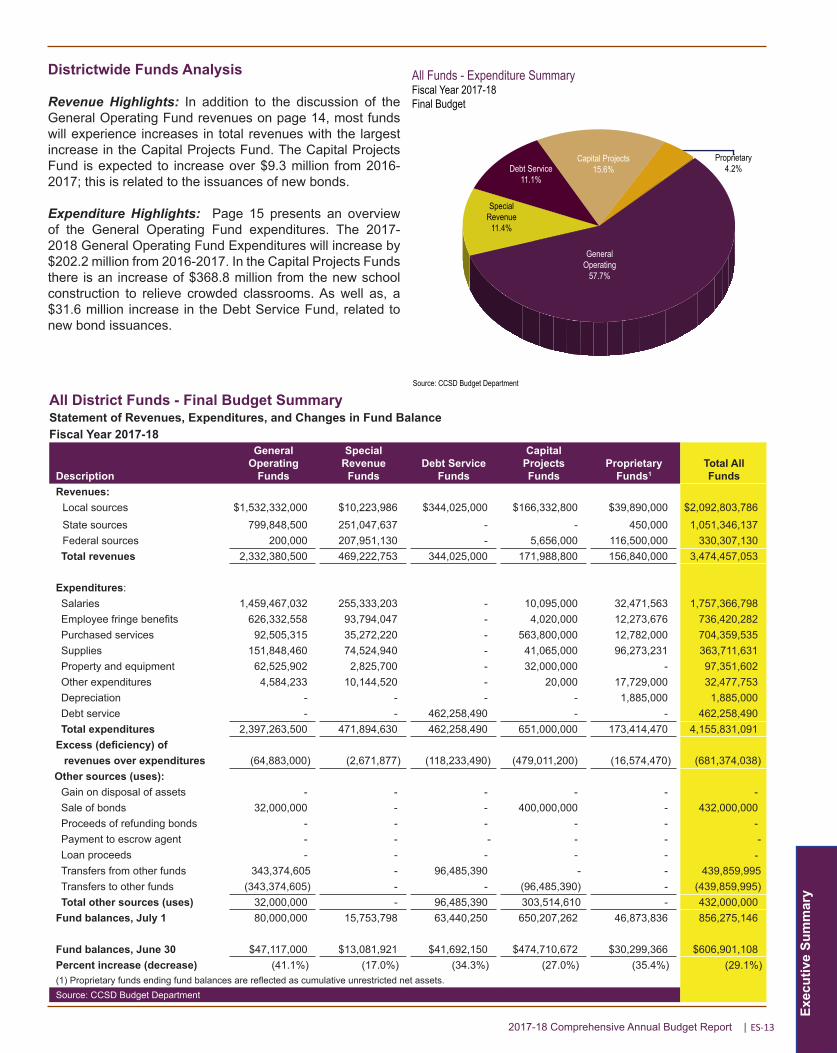
Districtwide Funds Analysis
Revenue Highlights: In addition to the discussion of the General Operating Fund revenues on page 14, most funds will experience increases in total revenues with the largest increase in the Capital Projects Fund. The Capital Projects Fund is expected to increase over $9.3 million from 2016-2017; this is related to the issuances of new bonds.
Expenditure Highlights: Page 15 presents an overview of the General Operating Fund expenditures. The 2017-2018 General Operating Fund Expenditures will increase by $202.2 million from 2016-2017. In the Capital Projects Funds there is an increase of $368.8 million from the new school construction to relieve crowded classrooms. As well as, a $31.6 million increase in the Debt Service Fund, related to new bond issuances.
Proprietary4.2%Debt Service
11.1%
Special Revenue
11.4%
General Operating
57.7%
Capital Projects15.6%
All Funds - Expenditure SummaryFiscal Year 2017-18Final Budget
Source: CCSD Budget Department
All District Funds - Final Budget SummaryStatement of Revenues, Expenditures, and Changes in Fund BalanceFiscal Year 2017-18
Description
General Operating
Funds
Special Revenue
FundsDebt Service
Funds
Capital Projects Funds
Proprietary Funds1
Total All Funds
Revenues:Local sources $1,532,332,000 $10,223,986 $344,025,000 $166,332,800 $39,890,000 $2,092,803,786 State sources 799,848,500 251,047,637 - - 450,000 1,051,346,137 Federal sources 200,000 207,951,130 - 5,656,000 116,500,000 330,307,130 Total revenues 2,332,380,500 469,222,753 344,025,000 171,988,800 156,840,000 3,474,457,053
Expenditures:Salaries 1,459,467,032 255,333,203 - 10,095,000 32,471,563 1,757,366,798 Employee fringe benefits 626,332,558 93,794,047 - 4,020,000 12,273,676 736,420,282 Purchased services 92,505,315 35,272,220 - 563,800,000 12,782,000 704,359,535 Supplies 151,848,460 74,524,940 - 41,065,000 96,273,231 363,711,631 Property and equipment 62,525,902 2,825,700 - 32,000,000 - 97,351,602 Other expenditures 4,584,233 10,144,520 - 20,000 17,729,000 32,477,753 Depreciation - - - - 1,885,000 1,885,000 Debt service - - 462,258,490 - - 462,258,490 Total expenditures 2,397,263,500 471,894,630 462,258,490 651,000,000 173,414,470 4,155,831,091
Excess (deficiency) of revenues over expenditures (64,883,000) (2,671,877) (118,233,490) (479,011,200) (16,574,470) (681,374,038)
Other sources (uses):Gain on disposal of assets - - - - - - Sale of bonds 32,000,000 - - 400,000,000 - 432,000,000 Proceeds of refunding bonds - - - - - - Payment to escrow agent - - - - - - Loan proceeds - - - - - - Transfers from other funds 343,374,605 - 96,485,390 - - 439,859,995 Transfers to other funds (343,374,605) - - (96,485,390) - (439,859,995)Total other sources (uses) 32,000,000 - 96,485,390 303,514,610 - 432,000,000
Fund balances, July 1 80,000,000 15,753,798 63,440,250 650,207,262 46,873,836 856,275,146
Fund balances, June 30 $47,117,000 $13,081,921 $41,692,150 $474,710,672 $30,299,366 $606,901,108 Percent increase (decrease) (41.1%) (17.0%) (34.3%) (27.0%) (35.4%) (29.1%)(1) Proprietary funds ending fund balances are reflected as cumulative unrestricted net assets.Source: CCSD Budget Department
ES-14 | Clark County School District
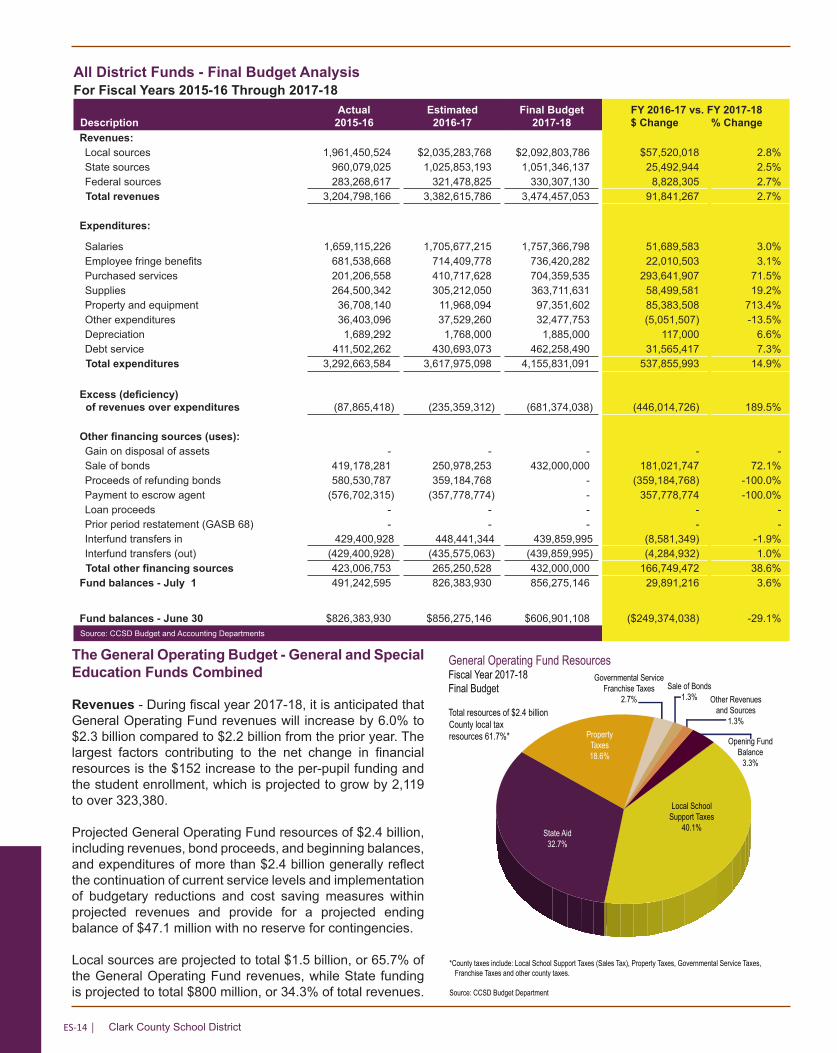
The General Operating Budget - General and Special Education Funds Combined
Revenues - During fiscal year 2017-18, it is anticipated that General Operating Fund revenues will increase by 6.0% to $2.3 billion compared to $2.2 billion from the prior year. The largest factors contributing to the net change in financial resources is the $152 increase to the per-pupil funding and the student enrollment, which is projected to grow by 2,119 to over 323,380.
Projected General Operating Fund resources of $2.4 billion, including revenues, bond proceeds, and beginning balances, and expenditures of more than $2.4 billion generally reflect the continuation of current service levels and implementation of budgetary reductions and cost saving measures within projected revenues and provide for a projected ending balance of $47.1 million with no reserve for contingencies.
Local sources are projected to total $1.5 billion, or 65.7% of the General Operating Fund revenues, while State funding is projected to total $800 million, or 34.3% of total revenues.
All District Funds - Final Budget AnalysisFor Fiscal Years 2015-16 Through 2017-18
DescriptionActual
2015-16Estimated 2016-17
Final Budget 2017-18
FY 2016-17 vs. FY 2017-18$ Change % Change
Revenues:Local sources 1,961,450,524 $2,035,283,768 $2,092,803,786 $57,520,018 2.8%State sources 960,079,025 1,025,853,193 1,051,346,137 25,492,944 2.5%Federal sources 283,268,617 321,478,825 330,307,130 8,828,305 2.7%
Total revenues 3,204,798,166 3,382,615,786 3,474,457,053 91,841,267 2.7%
Expenditures:
Salaries 1,659,115,226 1,705,677,215 1,757,366,798 51,689,583 3.0%Employee fringe benefits 681,538,668 714,409,778 736,420,282 22,010,503 3.1%Purchased services 201,206,558 410,717,628 704,359,535 293,641,907 71.5%Supplies 264,500,342 305,212,050 363,711,631 58,499,581 19.2%Property and equipment 36,708,140 11,968,094 97,351,602 85,383,508 713.4%Other expenditures 36,403,096 37,529,260 32,477,753 (5,051,507) -13.5%Depreciation 1,689,292 1,768,000 1,885,000 117,000 6.6%Debt service 411,502,262 430,693,073 462,258,490 31,565,417 7.3%
Total expenditures 3,292,663,584 3,617,975,098 4,155,831,091 537,855,993 14.9%
Excess (deficiency) of revenues over expenditures (87,865,418) (235,359,312) (681,374,038) (446,014,726) 189.5%
Other financing sources (uses): Gain on disposal of assets - - - - - Sale of bonds 419,178,281 250,978,253 432,000,000 181,021,747 72.1%Proceeds of refunding bonds 580,530,787 359,184,768 - (359,184,768) -100.0%Payment to escrow agent (576,702,315) (357,778,774) - 357,778,774 -100.0%Loan proceeds - - - - - Prior period restatement (GASB 68) - - - - -Interfund transfers in 429,400,928 448,441,344 439,859,995 (8,581,349) -1.9%Interfund transfers (out) (429,400,928) (435,575,063) (439,859,995) (4,284,932) 1.0%
Total other financing sources 423,006,753 265,250,528 432,000,000 166,749,472 38.6%Fund balances - July 1 491,242,595 826,383,930 856,275,146 29,891,216 3.6%
Fund balances - June 30 $826,383,930 $856,275,146 $606,901,108 ($249,374,038) -29.1%Source: CCSD Budget and Accounting Departments
Opening Fund Balance
3.3%
Property Taxes18.6%
State Aid32.7%
Local School Support Taxes
40.1%
Governmental Service Franchise Taxes
2.7% Other Revenues and Sources
1.3%
General Operating Fund ResourcesFiscal Year 2017-18Final Budget
Total resources of $2.4 billion
*County taxes include: Local School Support Taxes (Sales Tax), Property Taxes, Governmental Service Taxes, Franchise Taxes and other county taxes.
Source: CCSD Budget Department
County local tax resources 61.7%*
Sale of Bonds1.3%
Exec
utiv
e Su
mm
ary
ES-152017-18 Comprehensive Annual Budget Report |
Federal revenues from claims for Medicaid administration, Impact Aid, and the National Forest Service are estimated to total $200 thousand. Other resource components are the sale of $32.0 million in medium-term financing bonds and the projected beginning fund balance is $80.0 million. The opening fund balance component reflects the General Fund’s estimated 2016-17 ending fund balance and is subject to change based on the verification of the annual financial audit to be completed in October.
Expenditures - Expenditure appropriations are just shy of more than $2.4 billion to fund the District’s strategic priorities and reflect the intent to address and accomplish the Board’s strategic imperatives directed at improving student achievement with a major focus on classroom instruction. Total expenditure allocations are projected to increase by $202.2 million from 2016-2017 and are aligned with budgetary priorities established by the Board of Trustees.
General Operating Fund - Projected BudgetsFor Fiscal Years 2017-18 Through 2020-21
Description2017-18
Budgeted2018-19
Projected2019-20
Projected2020-21
ProjectedProjected
Growth Rate
Revenues 2,332,380,500 2,385,900,000 2,419,980,000 $2,462,060,000 1.7%Expenditures 2,397,263,500 2,400,600,000 2,421,000,000 2,463,000,000 1.7%Deficiency of revenues over expenditures (64,883,000) (14,700,000) (1,020,000) (940,000) (7.8)%Other sources and (uses) 32,000,000 32,050,000 50,000 50,000 -Opening fund balance - July 1 80,000,000 47,117,000 64,467,000 63,497,000 (1.5)%
Ending fund balance - June 30 $47,117,000 $64,467,000 $63,497,000 $62,607,000 (1.4)%
Fund Balance:
Nonspendable $4,500,000 $5,000,000 $5,100,000 $5,200,000 2.0%Restricted - 500,000 500,000 500,000 -Assigned 1,800,000 11,267,000 3,497,000 1,507,000 (56.9)%Unassigned 40,817,000 47,700,000 54,400,000 55,400,000 1.8%
Total Fund Balance $47,117,000 $64,467,000 $63,497,000 $62,607,000 (1.4)%
Tax Base and Rate Trends
The taxable assessed valuation is expected to increase slightly by $4.7 billion, or 6.1%, to $81.3 billion in the fiscal year 2018. General Operating Fund property tax collections are projected to grow by $10.7 million to $455.7 million and Debt Service Fund collections by $3.0 million to $343.0 million, while maintaining the prior year’s total tax levy ratio of .013034.
Projections - Looking Forward
Distributive School Account (DSA) funding is a significant component (84.1%) of the General Operating Fund revenues and is mostly determined by the biennial Nevada State Legislature. Key funding elements involve LSST (sales) taxes and property tax collections based upon fluctuating local property valuations. It is highly likely that the revenue projections below could vary somewhat. Expenditures for salaries and benefits could also fluctuate based upon final agreements from the ongoing negotiations with each of the employee unions.
General Operating Fund - History Of ResourcesFor Fiscal Years 2008-09 Through 2017-18
County % of State % of Federal % of Other % of Opening % of TotalYear Taxes Total Sources Total Sources Total Sources 4 Total Balances Total Resources
2008-09 1,263,951,844 57.4 666,045,473 30.2 82,265,3772 3.8 27,802,582 1.3 163,474,529 7.4 2,203,899,8052009-10 1,300,965,604 59.2 692,694,166 31.5 303,570 - 37,188,412 1.7 167,310,793 7.6 2,198,462,5452010-11 1,206,926,415 56.3 686,744,074 32.0 337,954 - 106,618,891 5.0 145,055,694 6.8 2,145,683,0282011-12 1,222,078,785 58.7 688,533,420 33.1 839,281 - 75,042,1013 3.6 96,620,752 4.6 2,083,114,3392012-13 1,238,522,974 59.5 693,193,421 33.3 374,155 - 73,960,0663 3.6 76,982,721 3.7 2,083,033,3372013-14 1,284,847,936 57.9 752,389,804 33.9 237,429 - 90,901,504 4.1 92,596,487 4.2 2,220,973,1602014-15 1,349,860,724 59.4 736,734,504 32.4 340,659 - 64,009,929 2.8 119,902,569 5.3 2,270,848,3852015-16 1,409,496,515 61.6 700,582,079 30.6 157,399 - 71,405,217 3.1 105,624,469 4.6 2,287,265,6792016-171 1,464,409,000 63.6 708,993,000 30.8 215,000 - 58,576,500 2.5 71,835,199 3.1 2,304,028,6992017-181 1,507,154,000 61.7 799,848,500 32.7 200,000 - 57,178,000 2.3 80,000,000 3.3 2,444,380,500
1 Projected amounts2 Includes $82,239,829 from the American Recovery and Reinvestment Act3 Class Size Reduction transfer reversal as reflected in previous years4 Chart includes transfers in and medium-term financing
Source: CCSD Budget and Accounting Departments
ES-16 | Clark County School District
Future LSST tax collection projections are based upon a conservative vision for a local economy. Future property tax collection projections are based on a flat growth due to the 0.2% cap in place for the 2016-2017 year. Expenditure projections were determined through a conservative historical trending that assumes no cost of living increases to employee salary schedules and contained expenditure appropriations to arrive at a nominal ending fund balance.
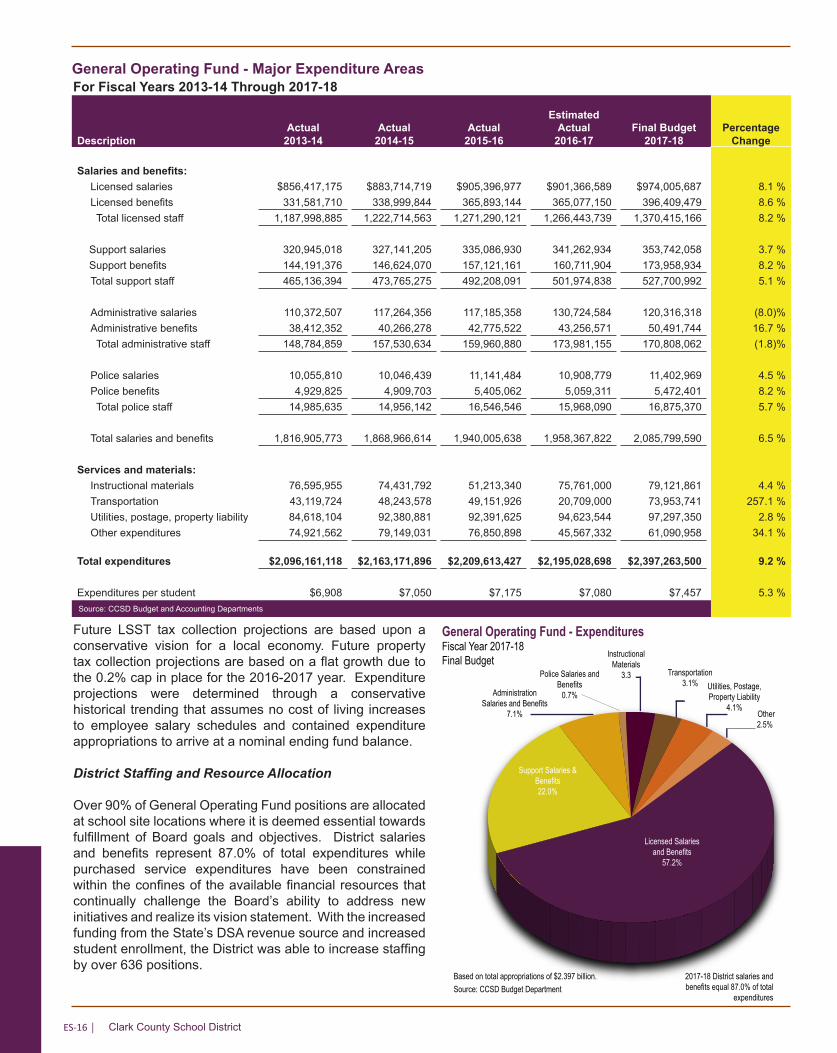
District Staffing and Resource Allocation
Over 90% of General Operating Fund positions are allocated at school site locations where it is deemed essential towards fulfillment of Board goals and objectives. District salaries and benefits represent 87.0% of total expenditures while purchased service expenditures have been constrained within the confines of the available financial resources that continually challenge the Board’s ability to address new initiatives and realize its vision statement. With the increased funding from the State’s DSA revenue source and increased student enrollment, the District was able to increase staffing by over 636 positions.
General Operating Fund - Major Expenditure AreasFor Fiscal Years 2013-14 Through 2017-18
Actual Actual ActualEstimated
Actual Final Budget PercentageDescription 2013-14 2014-15 2015-16 2016-17 2017-18 Change
Salaries and benefits:Licensed salaries $856,417,175 $883,714,719 $905,396,977 $901,366,589 $974,005,687 8.1 %Licensed benefits 331,581,710 338,999,844 365,893,144 365,077,150 396,409,479 8.6 % Total licensed staff 1,187,998,885 1,222,714,563 1,271,290,121 1,266,443,739 1,370,415,166 8.2 %
Support salaries 320,945,018 327,141,205 335,086,930 341,262,934 353,742,058 3.7 %Support benefits 144,191,376 146,624,070 157,121,161 160,711,904 173,958,934 8.2 %Total support staff 465,136,394 473,765,275 492,208,091 501,974,838 527,700,992 5.1 %
Administrative salaries 110,372,507 117,264,356 117,185,358 130,724,584 120,316,318 (8.0)%Administrative benefits 38,412,352 40,266,278 42,775,522 43,256,571 50,491,744 16.7 % Total administrative staff 148,784,859 157,530,634 159,960,880 173,981,155 170,808,062 (1.8)%
Police salaries 10,055,810 10,046,439 11,141,484 10,908,779 11,402,969 4.5 %Police benefits 4,929,825 4,909,703 5,405,062 5,059,311 5,472,401 8.2 % Total police staff 14,985,635 14,956,142 16,546,546 15,968,090 16,875,370 5.7 %
Total salaries and benefits 1,816,905,773 1,868,966,614 1,940,005,638 1,958,367,822 2,085,799,590 6.5 %
Services and materials:Instructional materials 76,595,955 74,431,792 51,213,340 75,761,000 79,121,861 4.4 %Transportation 43,119,724 48,243,578 49,151,926 20,709,000 73,953,741 257.1 %Utilities, postage, property liability 84,618,104 92,380,881 92,391,625 94,623,544 97,297,350 2.8 %Other expenditures 74,921,562 79,149,031 76,850,898 45,567,332 61,090,958 34.1 %
Total expenditures $2,096,161,118
$2,163,171,896
$2,209,613,427
$2,195,028,698
$2,397,263,500 9.2 %
Expenditures per student $6,908 $7,050 $7,175 $7,080 $7,457 5.3 %Source: CCSD Budget and Accounting Departments
Licensed Salaries and Benefits
57.2%
Support Salaries & Benefits22.0%
Instructional Materials
3.3 Transportation3.1% Utilities, Postage,
Property Liability4.1%
Other2.5%
General Operating Fund - ExpendituresFiscal Year 2017-18Final Budget
Based on total appropriations of $2.397 billion.
Administration Salaries and Benefits
7.1%
Police Salaries and Benefits
0.7%
2017-18 District salaries and benefits equal 87.0% of total
expendituresSource: CCSD Budget Department

Exec
utiv
e Su
mm
ary
ES-172017-18 Comprehensive Annual Budget Report |
Improvement Program approved in the 2015 Legislative Session per Senate Bills 119 (SB119) and 207 (SB207). The Capital Projects Funds budget includes revenues of $571.9 million, including proceeds of $400 million and an increase of the opening fund balance of $4.0 million from FY17 estimated, to fund expenditure appropriations in the amount of $651.0 million and transfers to other funds totaling $96.5 million. This budget outlines the District’s final stages for the capital improvements that are to be funded from the proceeds of the 1998 and the start up of 2015 bond program described in the Other Funds Section.
Debt Service Funds
The Debt Service Funds budgeted revenues are projected to total $343.0 million using a continued tax rate of 55.34 cents per $100 of taxable property in Clark County. Statutory debt capacity is established by Nevada Statutes and is approved annually by the Board and filed with the Nevada Department of Taxation and the Clark County Debt Management Commission. The Statutory Debt Limitation Schedule shown in the Other Funds Section reveals that, notwithstanding the District’s significant capital programs, outstanding debt is only 20.0% of statutory limits based upon the Department of Taxation’s estimate of assessed valuation.
Balances in the District’s Debt Service Funds are restricted by statute only for debt service and reflect the fluctuations in property valuations in Clark County during the past decade. These balances, being restricted from other use, provide both a margin of security for the District’s school construction bonds and the opportunity to support substantial increases in bonded debt while maintaining stability in property tax rates.
Maintenance of the current property tax rate will be sufficient through fiscal 2018 to retire the existing bonded debt since the District issued previous bonds based upon the factors of growth in assessed valuation in addition to increases in student population. The Capital Improvement Program provided authority to issue general obligation bonds until 2025 and will be repaid from a fixed tax rate of 55.34 cents per $100 of net taxable property. School districts in the State receive operational funding on a per student basis, which recognizes growth in enrollment. This funding is the basis for offsetting costs (school site staffing, additional instructional materials, utilities, etc.) to the General Operating Fund associated with the acquisition of new school facilities.
Capital Projects Funds
The District has previously been ranked as one of the fastest growing school districts in the nation. Total enrollment increased by 12,159 students since 2009, or an increase of over 3.94%. For new growth in enrollment the District plans to construct of 37 new schools, 16 replacement schools, and 54 additions to schools financed through the proactive Capital Summary of Debt ServiceAs of July 1, 2017
Fiscal Year Principal InterestTotal
Requirements2018 $307,535,000 $118,734,928 $426,269,928 2019 287,950,000 104,537,665 392,487,665 2020 233,745,000 90,334,065 324,079,065 2021 229,460,000 78,650,715 308,110,715 2022 204,155,000 67,116,215 271,271,2152023-27 855,350,000 187,294,897 1,042,644,897
2028-37 319,925,000 62,648,700 382,573,700
Totals $2,438,120,000 $709,317,683 $3,147,437,683Source: Schedule of Debt Repayment as of 7/1/17
Capital Improvement PlanFor Fiscal Year 2017-18Descriptions FY 2017-18
1998 Capital Improvement Program:New Construction:Replacement/Phased Replacement Schools $ - Additions to Existing Schools 15,000,000 Rehab/Modernization 10,000,000Fund Total 25,000,000
2015 Capital Improvement ProgramLand Acquisition/Land Improvements: 30,000,000 New Construction: New Schools 165,000,000 Replacement Schools 110,000,000
Additions for Capacity 115,000,000 Rehab/Modernization 125,000,000 Rehab/Modernization 35,000,000
Fund Total 580,000,000
Building and SitesLand Acquisition: -
Site Improvements: 1,000,000 Fund Total 1,000,000
Governmental Services Tax New Construction: Other Buildings - Rehab/Modernization: 37,500,000 Purchase Portable Classrooms 2,000,000 Relocate Portable Classrooms 5,500,000 Fund Total 45,000,000
Capital Replacement FundRehab/Modernization: -Technology/Equipment: -Fund Total -
Total All Capital Funds $ 651,000,000
Source: CCSD Facilities and Bond Financial Management
ES-18 | Clark County School District
Legislation was enacted in 2005 to provide partial abatement of ad valorem taxes to provide relief from escalating assessments resulting from previous increases to the market values of real property in Clark County. The cap limits each property’s tax increase to no more than 3% above that assessed during the prior year on all single-family, owner-occupied residences, because the cap is based on a 10-year average of property value growth, and that average has fallen below zero because it contains the years immediately after the housing downturn when values tanked, the limit will sink to 0.2% in fiscal year 2017. All other real property categories are limited to an increase in tax of no more than 8%. Assessed valuations in the County are anticipated to increase by 6%.
Assembly Bill 469 (AB469), provides for the reorganization of large school districts in the State of Nevada. The bill applies to Clark County School District and brings many challenges in regards to transferring centralized operations to each school precinct with a goal of providing 85% of the unrestricted budget to the school precincts. AB469 and further details can be found at https://www.leg.state.nv.us/.
Economic Environment in Southern Nevada
Southern Nevada’s commitment to diversification in the business sector and a favorable tax base has made it an ideal area for relocation and business expansion. Nevada does not impose corporate or personal income taxes, or inventory, special intangible, inheritance, estate, or gift taxes. Nevada continues to maintain one of the most beneficial tax structures for both personal as well as business growth. Las Vegas’ offerings and infrastructure continue to affirm the desirability of living within this metropolitan area.
Situated in one of the nation’s fastest growing areas, the District has been previously challenged by an associated growth in student enrollment. Over 28 years ago, the District was ranked by the Educational Research Service as the 18th largest school district in the country. The District currently ranks as the fifth largest. The projected enrollment count for 2017-18 is 323,380, as compared to 321,261 last year’s estimated enrollment, or a increase of 0.7%. The 2017 population of Clark County is estimated to be 2,198,682 an increase of 32,501 residents (1.5%) over the 2016 population of 2,166,181.
Only within the last eighteen years, Las Vegas, as a city, joined the classification of “major city”. As a result, there are fewer older neighborhoods than in most other major cities, and the popular concept of master planned communities has become more desirable in residential planning. These communities are planned with a variety of amenities, including parks, schools, churches, libraries, and shopping. Some of the nation’s most successful master planned communities are located in southern Nevada.
Tourism and gaming jointly remain southern Nevada’s largest industry and somewhat cushion the effects from the
Other Funds
Special Revenue Funds, Internal Service Funds, and the Enterprise Fund comprise a small percentage of the total budget and are discussed in more detail in the Other Funds Section.
Fiscal Year 2017-18 Budget Development Considerations
Planning for the fiscal 2018 budget began in October 2016. Budget calendars shown in the Budget Policy Section reveal the input and discussion received from all levels of the District. In addition to input from the Chief Academic Officer and the Superintendency, work sessions were conducted throughout the year with the Board of School Trustees and the public to determine priorities, strategic imperatives, and focus areas to operate within a balanced budget.
Benchmarks for contingency and General Fund ending balances are specified in Clark County School District Regulation 3110. Due to limited funding resources, and in order to achieve a balanced budget, the Board of School Trustees (since 2010) has been forced to temporarily suspend the regulation that seeks an unassigned ending fund balance that is equal to approximately 2.0% of revenues. Now, the fiscal 2018 budget projects an unassigned ending fund balance of 1.75% of revenues with no reserve for contingencies. It still remains the goal of the Board to reach 2.0% in 2019, was achieved and the District is now in good standing with Regulation 3110.
Employee salary and fringe benefits represent over 87% of total expenditure appropriations and are projected to increase by almost $55 million, this increase is primarily due to new Clark County Education Association’s agreement. No cost of living increases have been added to existing salary schedules for 2017-18. Employee group health insurance premiums are unchanged from 2016-2017 with no increases forecast. Should provider premiums increase subsequently, contract negotiations with employee association groups may be necessary to operate within a balanced budget.
Exec
utiv
e Su
mm
ary
ES-192017-18 Comprehensive Annual Budget Report |
District Organization Plan
In the past, the District has structured its central administrative services to provide more mission-driven guidance and support to direct more focus on improving student achievement into 16 performance zones. All schools in each of these zones were vertically aligned, forming a cluster around a high school feeder school pattern. Although they were clustered by academic performances, they tended to cluster geographically.
Each performance zone included an average between 10 and 27 schools. Where lower-performing schools faced greater challenges, fewer schools were included in the zone. Those schools receive more oversight and less autonomy. Benefits such as having the first opportunity to hire new talent or professional development funds are granted to schools in higher-need zones. Schools in a higher-performing zone receive less oversight and more autonomy.
“ACHIEVE” - Reorganization of the District
Currently, the District is undergoing a major reorganization which has been branded as “ACHIEVE” by CCSD.
Assembly Bill No. 469. During the 2015 legislative session, the Nevada Legislature adopted, and the Governor signed, Assembly Bill No. 394 (“AB 394”), which required the development of a plan to reorganize the District. On September 1, 2016, the Nevada State Board of Education approved a plan for reorganization (the “Reorganization Plan”) and adopted Regulation No. R142-16 (the “Regulations”). On September 9, 2016, the Nevada Legislative Counsel
substantial decline in the new housing construction market. In 2016, Las Vegas is home to the largest 15 hotels in the nation. With a room inventory of over 149,000, an occupancy rate that increased slightly to 89.1%, convention delegates of over 6.3 million, and a visitor volume of over 42.9 million, southern Nevada received an economic impact benefit of over $60.0 billion from the tourism industry.
Enrollment
During the past decade, the District has added more than 12,000 students creating a strain on facilities and service levels. Since 2012, the District has returned to being among the fastest growing school districts in the nation. The slow economic upturn should be a positive impact on the District’s future funding resources. The upward enrollment trends demand that the District utilize flexible, realistic methods of projection.
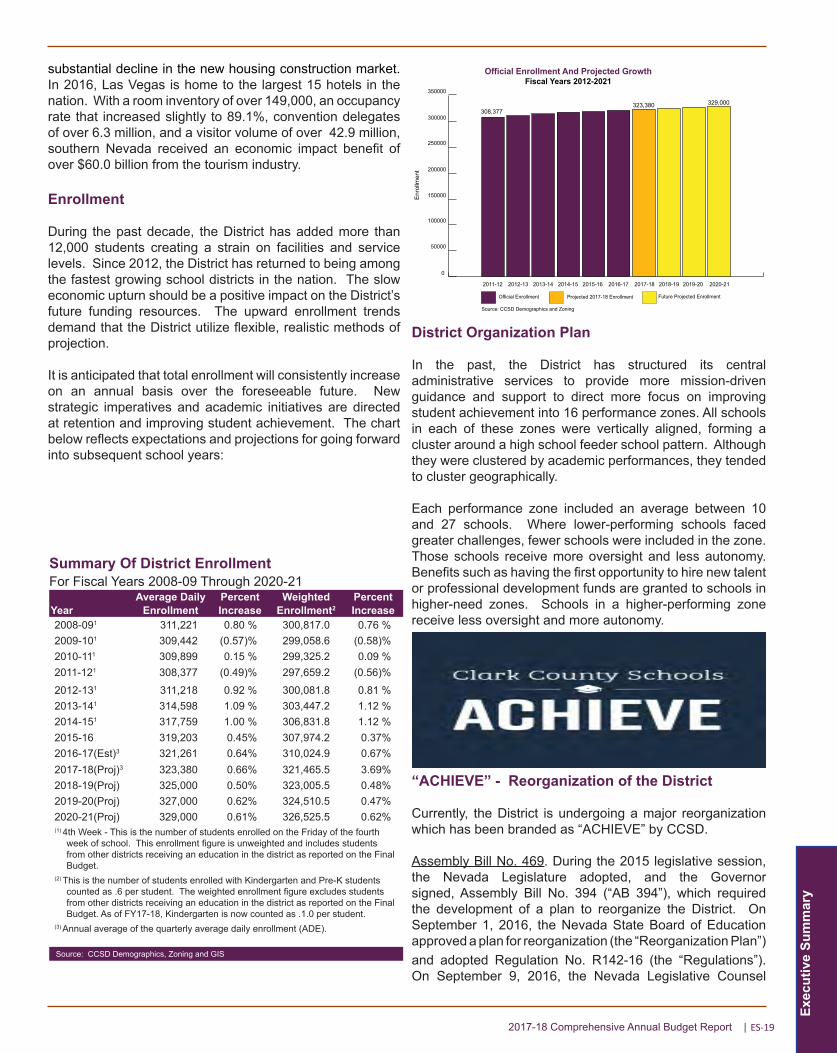
It is anticipated that total enrollment will consistently increase on an annual basis over the foreseeable future. New strategic imperatives and academic initiatives are directed at retention and improving student achievement. The chart below reflects expectations and projections for going forward into subsequent school years:
Summary Of District EnrollmentFor Fiscal Years 2008-09 Through 2020-21
Average Daily Percent Weighted PercentYear Enrollment Increase Enrollment2 Increase2008-091 311,221 0.80 % 300,817.0 0.76 %2009-101 309,442 (0.57)% 299,058.6 (0.58)%2010-111 309,899 0.15 % 299,325.2 0.09 %2011-121 308,377 (0.49)% 297,659.2 (0.56)%
2012-131 311,218 0.92 % 300,081.8 0.81 %2013-141 314,598 1.09 % 303,447.2 1.12 %2014-151 317,759 1.00 % 306,831.8 1.12 %2015-16 319,203 0.45% 307,974.2 0.37%2016-17(Est)3 321,261 0.64% 310,024.9 0.67%2017-18(Proj)3 323,380 0.66% 321,465.5 3.69%2018-19(Proj) 325,000 0.50% 323,005.5 0.48%2019-20(Proj) 327,000 0.62% 324,510.5 0.47%2020-21(Proj) 329,000 0.61% 326,525.5 0.62%(1) 4th Week - This is the number of students enrolled on the Friday of the fourth
week of school. This enrollment figure is unweighted and includes students from other districts receiving an education in the district as reported on the Final Budget.
(2) This is the number of students enrolled with Kindergarten and Pre-K students counted as .6 per student. The weighted enrollment figure excludes students from other districts receiving an education in the district as reported on the Final Budget. As of FY17-18, Kindergarten is now counted as .1.0 per student.
(3) Annual average of the quarterly average daily enrollment (ADE).
Source: CCSD Demographics, Zoning and GIS
0
50000
100000
150000
200000
250000
300000
350000
Official Enrollment And Projected GrowthFiscal Years 2012-2021
323,380
2012-13 2013-14 2014-15 2015-16 2016-17 2017-18 2018-19 2019-20 2020-212011-12
Official Enrollment Projected 2017-18 Enrollment Future Projected Enrollment
329,000308,377
Source: CCSD Demographics and Zoning
Enr
ollm
ent
ES-20 | Clark County School District
Bureau approved the Reorganization Plan. During the 2017 legislative session, the Nevada Legislature adopted, and the Governor signed, Assembly Bill No. 469 (“AB 469”). AB 469 repealed AB 394 but still requires reorganization. AB 469 codifies the Regulations into law and applies it to any large school district, which is defined as a school district that has an enrollment of 100,000 or more students.
Pursuant to AB 469, an advisory committee and a technical committee which previously worked on the Reorganization Plan pursuant to AB 394 are required to continue to monitor the reorganization to ensure autonomy is granted to schools and that Reorganization Plan is put into place no later than the 2018-2019 school year. AB 469 takes into consideration 20 factors involving precinct boundaries, curriculum, staffing, safety, ensuring equity with response to the Nevada Plan and other issues. The listed factors related to debt and finance include: (a) the allocation, dedication and transfer of revenues to schools for capital projects and programming; (b) the authority to issue bonds or otherwise raise revenue; (c) the application for and receipt of any grant; (d) the creation and administration of accounts to manage any money for the individual schools; (e) financial planning for programs, pupil funding and capital projects; (f) the liability of schools with respect to any duties and obligations of the Board which will be assumed by the governing body of an individual school. The advisory committee is required to continue to ensure that the District is funded in accordance with the Nevada Plan; authorize the schools to request that the District issue bonds on their behalf; require the District to issue bonds upon receiving such a request, except for good cause; and require a school on behalf of which bonds are issued to use the proceeds on a “per pupil basis.”
Procedural History. The advisory committee held eight public meetings commencing October 12, 2015. The technical advisory committee held 12 public meetings commencing November 10, 2015. In July 2016, the advisory committee proposed a Reorganization Plan to the Board of County Commissioners. The Board of County Commissioners held eight public meetings in July and August 2016. Revisions were made to the Reorganization Plan and it was then submitted to the State Board of Education on August 22, 2016. On September 1, 2016, the State Board of Education approved the Reorganization Plan and adopted the Regulations. On September 9, 2016, the Legislative Counsel Bureau approved the Reorganization Plan. The Reorganization Plan and Regulations then had the force of law and no additional public meetings or approvals were necessary to implement AB 394. During the 2017 legislative session, AB 394 was repealed and replaced with AB 469 as described above.
Description of the Reorganization Plan. The Reorganization Plan “envisions turning the present administrative structure upside down, or, more accurately, right-side up, with the schools becoming front and center at the heart of the operation of the school district” (see pages Org-16 and Org-17). The Reorganization Plan reconfigures the District’s
structure in a manner that provided public schools with autonomy regarding certain operations, management and financial decisions. This model places the decisions that have an immediate impact on student achievement in the hands of parents, teachers and principals. The Reorganization Plan requires the District to allocate financial resources on a per-pupil basis, such that each school may carry out these responsibilities. The Reorganization Plan gives the District an organizational structure focused on the needs of each individual school, along with transparency and higher levels of efficiency with regard to budgeting and spending decisions. During the initial phase of the implementation of the Reorganization Plan, any costs incurred by the District in carrying out the Reorganization Plan were paid for through the redistribution of existing District funds.
The Superintendent is required to make financial estimates and determinations regarding the schools on a yearly basis. Each school is overseen by the school’s principal, who will be responsible for the school’s Plan of Operation. The Superintendent transferred to each school the authority to: 1) select and supervise staff, 2) procure necessary equipment, services and supplies to carry out operational plans and 3) develop a balanced budget. In return, schools are held to a higher level of accountability. To serve as a linkage between the principals and the Superintendent, a new position was developed within the District’s central administration: “School Associate Superintendent.” Each School Associate Superintendent shall oversee a group of no more than 25 schools and in conjunction with the Chief Academic Officer, report directly to the Superintendent. The School Associate Superintendents are also required to provide supervision and training to principals, and ensure that the schools remain in compliance with all federal, state and local laws. Each school is also required to be guided by an organizational team made up of licensed, support and administrative employees, as well as parents and community leaders. Utilizing the advice of the School Associate Superintendents and the organizational team, the principal of each school is required to develop a Plan of Operation based on the needs of the students and the surrounding community.
With this administrative revision, the local school precincts are expected to have a direct link to the central administration, removing the need for an intermediate level of bureaucracy. A Central Services team, an entity separate and distinct from the Superintendent, will remain in place to render certain services to all of the local school precincts. Such services are expected to include, among other things: financial services, including payroll services, transportation services, food services and certain human resource services. The District is currently identifying services provided by Central Services and the costs associated with those services that may be transferred to local school precincts. The local school precincts will then have the flexibility to continue to purchase services through Central Services or from external vendors.
Since the Reorganization Plan stated that it would go into
Exec
utiv
e Su
mm
ary
ES-212017-18 Comprehensive Annual Budget Report |
effect for the 2017-2018 school year, one year earlier than required by AB 394, District officials immediately began the training of all central office administrators and principals, who in turn trained thousands of teachers, support staff and parents. In addition, the Superintendent stated that the 2017-2018 school year would serve as a transition year in which certain portions of the Reorganization Plan would be implemented. In particular, the Superintendent continued the use of Central Services as the sole provider of goods and services to local school precincts during the 2017-2018 school year.
The district, currently and aggressively, is working on the following objectives in the “ACHIEVE” reogranization process:
• Developing a process to transfer more authority and decision making to Local Schools (increasing autonomy)
• Evaluating how to transfer centrally controlled money to school budgets
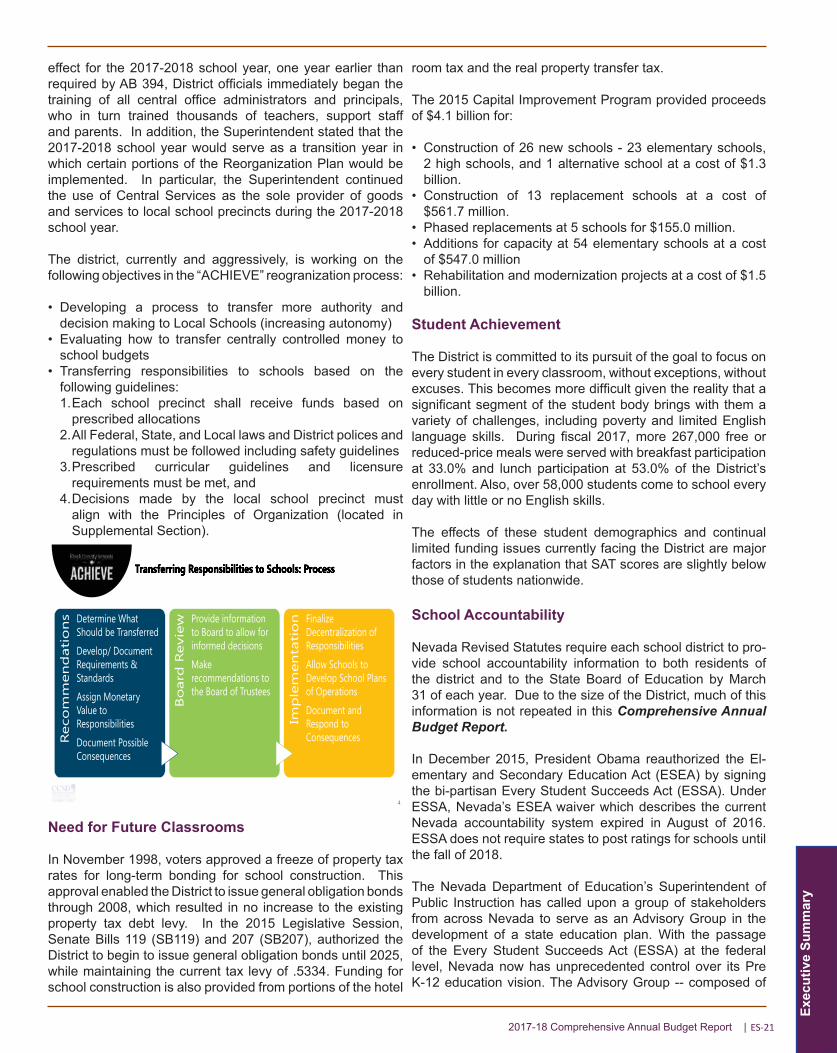
• Transferring responsibilities to schools based on the following guidelines:1. Each school precinct shall receive funds based on
prescribed allocations2. All Federal, State, and Local laws and District polices and
regulations must be followed including safety guidelines3. Prescribed curricular guidelines and licensure
requirements must be met, and4. Decisions made by the local school precinct must
align with the Principles of Organization (located in Supplemental Section).
Need for Future Classrooms
In November 1998, voters approved a freeze of property tax rates for long-term bonding for school construction. This approval enabled the District to issue general obligation bonds through 2008, which resulted in no increase to the existing property tax debt levy. In the 2015 Legislative Session, Senate Bills 119 (SB119) and 207 (SB207), authorized the District to begin to issue general obligation bonds until 2025, while maintaining the current tax levy of .5334. Funding for school construction is also provided from portions of the hotel
room tax and the real property transfer tax.
The 2015 Capital Improvement Program provided proceeds of $4.1 billion for:
• Construction of 26 new schools - 23 elementary schools, 2 high schools, and 1 alternative school at a cost of $1.3 billion.
• Construction of 13 replacement schools at a cost of $561.7 million.
• Phased replacements at 5 schools for $155.0 million.• Additions for capacity at 54 elementary schools at a cost
of $547.0 million• Rehabilitation and modernization projects at a cost of $1.5
billion.
Student Achievement
The District is committed to its pursuit of the goal to focus on every student in every classroom, without exceptions, without excuses. This becomes more difficult given the reality that a significant segment of the student body brings with them a variety of challenges, including poverty and limited English language skills. During fiscal 2017, more 267,000 free or reduced-price meals were served with breakfast participation at 33.0% and lunch participation at 53.0% of the District’s enrollment. Also, over 58,000 students come to school every day with little or no English skills.
The effects of these student demographics and continual limited funding issues currently facing the District are major factors in the explanation that SAT scores are slightly below those of students nationwide.
School Accountability
Nevada Revised Statutes require each school district to pro-vide school accountability information to both residents of the district and to the State Board of Education by March 31 of each year. Due to the size of the District, much of this information is not repeated in this Comprehensive Annual Budget Report.
In December 2015, President Obama reauthorized the El-ementary and Secondary Education Act (ESEA) by signing the bi-partisan Every Student Succeeds Act (ESSA). Under ESSA, Nevada’s ESEA waiver which describes the current Nevada accountability system expired in August of 2016. ESSA does not require states to post ratings for schools until the fall of 2018.
The Nevada Department of Education’s Superintendent of Public Instruction has called upon a group of stakeholders from across Nevada to serve as an Advisory Group in the development of a state education plan. With the passage of the Every Student Succeeds Act (ESSA) at the federal level, Nevada now has unprecedented control over its Pre K-12 education vision. The Advisory Group -- composed of
4
Reco
mm
en
dati
on
s Determine What Should be Transferred
Develop/ Document Requirements & Standards
Assign Monetary Value to Responsibilities
Document Possible Consequences
Bo
ard
Revi
ew Provide information
to Board to allow for informed decisions
Make recommendations to the Board of Trustees
Imp
lem
en
tati
on Finalize
Decentralization of Responsibilities
Allow Schools to Develop School Plans of Operations
Document and Respond to Consequences
ES-22 | Clark County School District
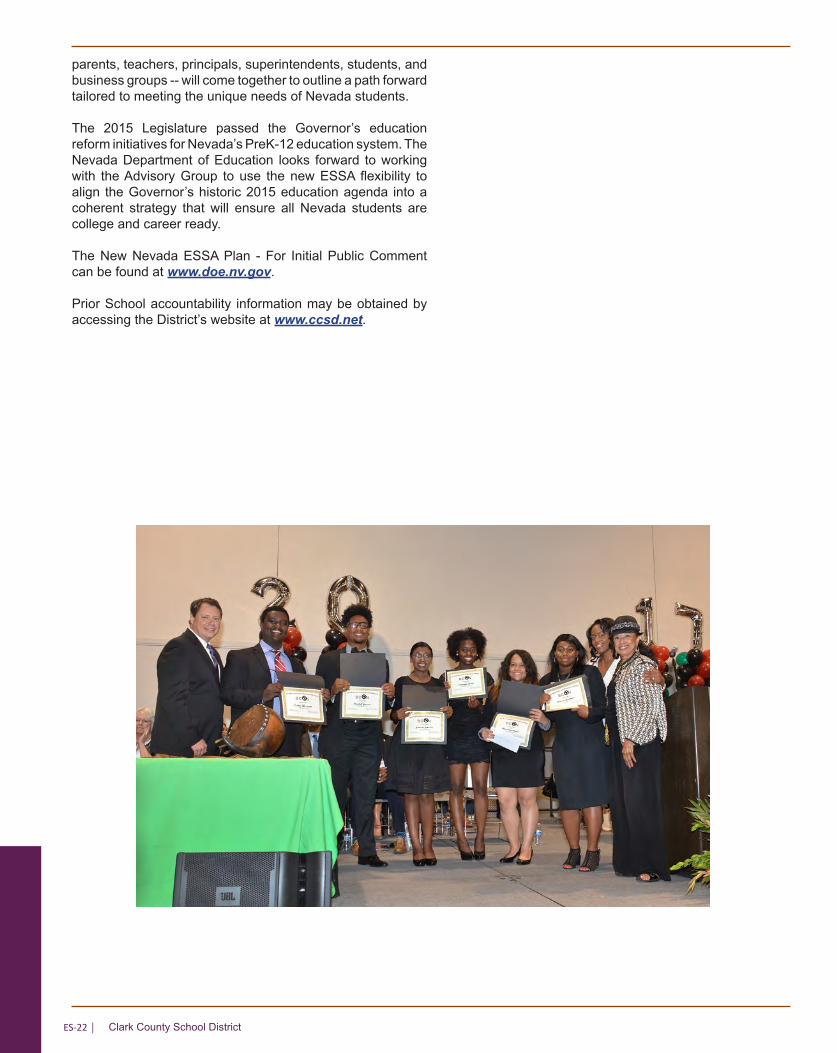
parents, teachers, principals, superintendents, students, and business groups -- will come together to outline a path forward tailored to meeting the unique needs of Nevada students.
The 2015 Legislature passed the Governor’s education reform initiatives for Nevada’s PreK-12 education system. The Nevada Department of Education looks forward to working with the Advisory Group to use the new ESSA flexibility to align the Governor’s historic 2015 education agenda into a coherent strategy that will ensure all Nevada students are college and career ready.
The New Nevada ESSA Plan - For Initial Public Comment can be found at www.doe.nv.gov.
Prior School accountability information may be obtained by accessing the District’s website at www.ccsd.net.


![[PPT]PowerPoint Template - Clark County School Districtccsd.net/.../docs/planning/action-planning.ppt · Web viewAction Planning & Monitoring Assessment, Accountability, Research,](https://img.pdfslide.net/doc/110x75/5aa5db1d7f8b9ab4788dbb78/pptpowerpoint-template-clark-county-school-viewaction-planning-monitoring-assessment.jpg)