Embed Size (px)
Citation preview
11The Emissions Gap Report 2015 – Executive Summary
Executive Summary
The year 2015 has the potential to become a turning point in global efforts to transform the prevailing social and economic development paradigm into a more sustainable one.
The global community reached agreement in September 2015 on a set of 17 sustainable development goals to be achieved by 2030, including climate change. Countries will meet again at the United Nations Framework Convention on Climate Change (UNFCCC) 21st Conference of the Parties (COP 21) in Paris with the aim of establishing a new global agreement on climate change, hereafter the ‘Paris Agreement’, with the ambition of limiting changes in global temperatures to below 2 °C or 1.5 °C warming in 2100 compared to pre-industrial levels. The Paris Agreement will also aim to establish a framework to provide technological and financial support for developing countries to accelerate the transition towards low carbon and climate resilient development paths.
The architecture of a new climate agreement has many facets with an array of issues under negotiation that have become significantly more complex since the Framework Convention on Climate Change entered into force in 1994. The core structure of the Paris Agreement will comprise the “Intended Nationally Determined Contributions” (INDCs) as well as the process by which implementation of the agreement will proceed over time to advance the objectives of the UNFCCC. In addition, a number of key decisions will be required covering issues like adaptation, finance, technology, and capacity building.
1. What is covered in the 2015 Emissions Gap Report?
This sixth UNEP Emissions Gap Report provides a scientific assessment of the mitigation contributions from the submitted INDCs. As in the previous reports, it then compares the resulting emission levels in 2030 with what science tells us is required to be on track towards the agreed target of a global average temperature increase below 2 °C by 2100. The Report also provides data for the aspirational target of keeping the temperature increase below 1.5 °C.
In addition, the Report presents selected areas where enhanced action can be taken, accelerated and scaled up to close the emissions gap.
The 2015 Emissions Gap Report addresses the following key questions:
• What are the latest estimates of 2025 and 2030 total global emissions levels consistent with the goal of holding the global average temperature rise below 2 °C/1.5 °C above pre-industrial levels by 2100?
• What is the progress on implementation of the Cancun pledges for the period to 2020?
• Will the combined INDC commitments for 2030 (if fully implemented) be sufficient to stay within the range consistent with the 2 °C temperature goal?
• What are possible contributions in selected key areas, where action can be accelerated to enhance the ambition of national pledges both in the period before and after the expected entry into force in 2020 of the Paris Agreement? This year the detailed assessment is on possible mitigation contributions from International Cooperative Initiatives (ICIs) and enhanced forest-related mitigation activities with a focus on Reducing Emissions from Deforestation and Forest Degradation (REDD+).
By 1 October 2015, a total of 119 INDCs had been submitted to the UNFCCC. Fifteen INDCs included only mitigation, while most included both adaptation and mitigation components. The report only presents qualitative information about the adaptation component of the INDCs submitted.
The report has been prepared by an international team of leading scientists assessing all available information, including that reviewed by the IPCC in its fifth assessment report, as well as more recent scientific studies. The assessment production process has been transparent and participatory. The assessment methodology and preliminary findings were made available to governments and stakeholders concerned during relevant international fora as well as on the UNEP Live website. The governments of the countries with specific mention in the report have been invited to comment on the assessment findings.
22 The Emissions Gap Report 2015 – Executive Summary
2. What are current emissions and what emission levels in 2030 are consistent with the 2 °C and the 1.5 °C targets?
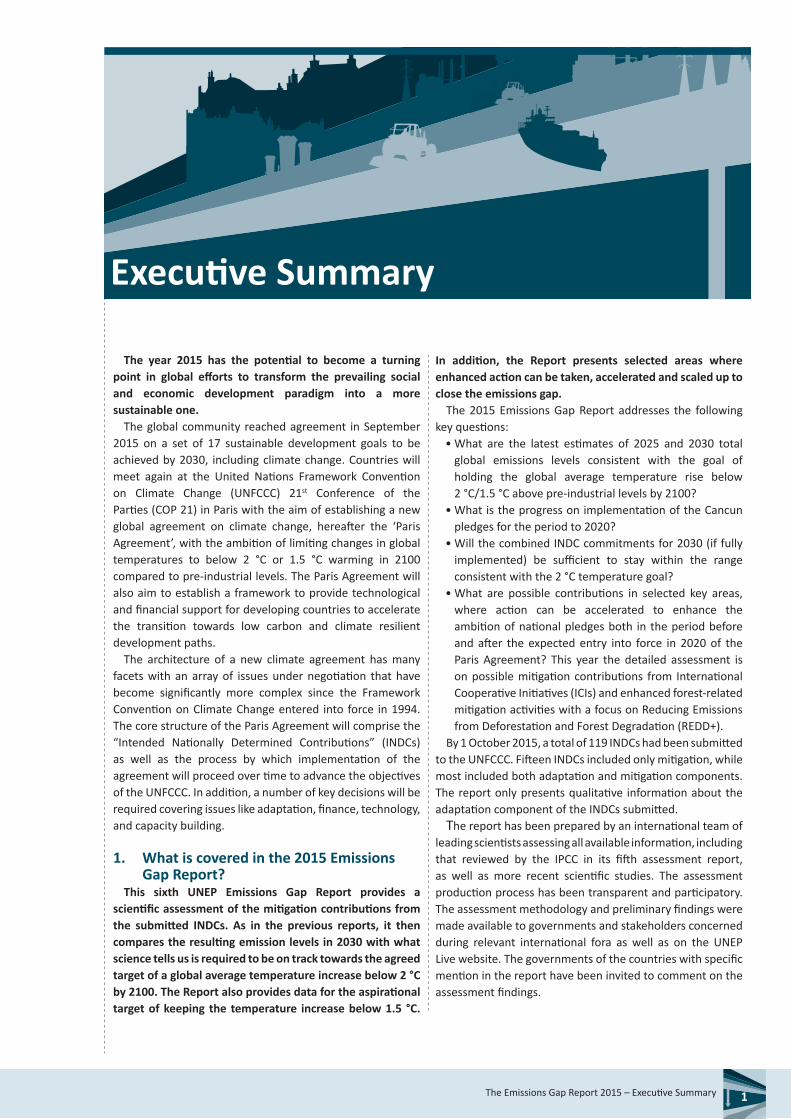
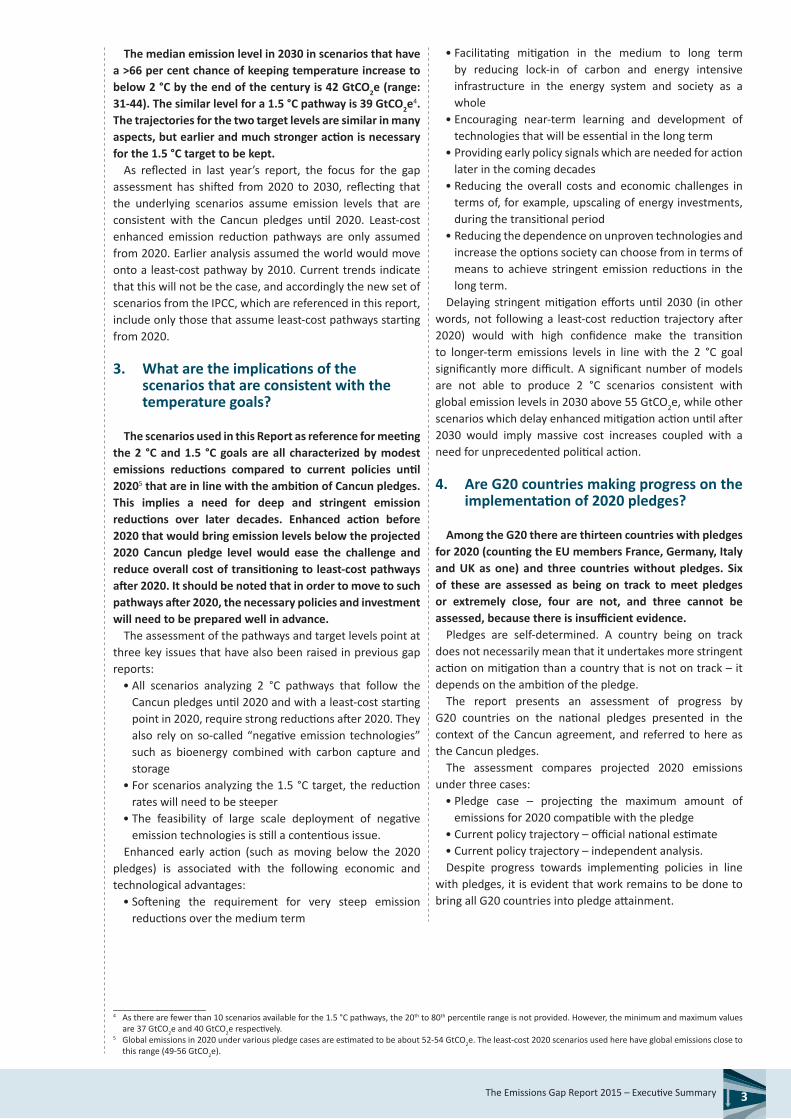
Over the past decades global GHG emissions have been increasing steadily, with small variations around a longer-term trend.
The most recent global emission estimates1 are available for the year 2014. In that year, total global Kyoto-GHG emissions2 amounted to about 52.7 GtCO2e (range: 47.9-57.5). Global carbon-dioxide (CO2) emissions from fossil-fuel and industry were estimated at 35.5 GtCO2 for 2014 (range: 32.5-38.5).
Staying below 2 °C temperature rise implies that CO2
emissions are reduced to net zero by 2060-2075.The IPCC in its fifth assessment report concluded that to
limit global warming to below 2 °C, the remaining cumulative CO2 emissions – the so-called carbon budget – are in the order of 1 000 GtCO2. This remaining budget can be utilized in different ways, but given the most recent assessment of current trends, net global carbon emissions will eventually need to be reduced to zero between 2060 and 20753. For a detailed discussion of the carbon budget, see the 2014 Emissions Gap Report.
The 2015 Report presents an updated set of possible pathways to stay within this budget, and also includes an updated assessment of the pathways and requirements to stay within the more ambitious 1.5 °C temperature goal.
____________________1 Data for 2014 are available from EDGAR and PRIMAP, see Chapter 2.2 The six greenhouse gases covered by the UNFCCC/Kyoto Protocol — carbon dioxide, methane, nitrous oxide, hydrofluorocarbons, perfluorocarbons and sulphur
hexafluoride. Here aggregated with 100-year Global Warming Potentials (GWPs) of the IPCC Second Assessment Report.3 Based on the final released IPCC AR5 scenarios database data.
1990 2000 2010 2020 2030 2040 2050 2100
120
100
80
60
40
20
0
+ 7°C
+ 6°C
+ 5°C
+ 4°C
+ 3°C
+2°C
+ 1°C
+/- 0
Kyoto-GHG emissions(GtCO2e)
scenariomedian
20-80% scenario range
20-80% scenario range +climate uncertaintyrange
warming by 2100(°C rel. 1850-1900)
scenario median
20-80% scenario range +climate uncertainty range
20-80% scenario range
Baseline
2°C(> 66% chance)
EDGAR estimates(including large-scalebiomass burning)
IPCC AR5 scenarios
Baselinemedian (line),20-80% (darker)min. – max. (lighter)
2°C limitmedian (line),20-80% (darker)min. – max. (lighter)
all excludingbiomass burningemissions
PRIMAPCAIT
EDGAR
Figure ES1: Historical greenhouse (GHG) emissions and projections until 2050
33The Emissions Gap Report 2015 – Executive Summary
The median emission level in 2030 in scenarios that have a >66 per cent chance of keeping temperature increase to below 2 °C by the end of the century is 42 GtCO2e (range: 31-44). The similar level for a 1.5 °C pathway is 39 GtCO2e
4. The trajectories for the two target levels are similar in many aspects, but earlier and much stronger action is necessary for the 1.5 °C target to be kept.
As reflected in last year’s report, the focus for the gap assessment has shifted from 2020 to 2030, reflecting that the underlying scenarios assume emission levels that are consistent with the Cancun pledges until 2020. Least-cost enhanced emission reduction pathways are only assumed from 2020. Earlier analysis assumed the world would move onto a least-cost pathway by 2010. Current trends indicate that this will not be the case, and accordingly the new set of scenarios from the IPCC, which are referenced in this report, include only those that assume least-cost pathways starting from 2020.
3. What are the implications of the scenarios that are consistent with the temperature goals?
The scenarios used in this Report as reference for meeting the 2 °C and 1.5 °C goals are all characterized by modest emissions reductions compared to current policies until 20205 that are in line with the ambition of Cancun pledges. This implies a need for deep and stringent emission reductions over later decades. Enhanced action before 2020 that would bring emission levels below the projected 2020 Cancun pledge level would ease the challenge and reduce overall cost of transitioning to least-cost pathways after 2020. It should be noted that in order to move to such pathways after 2020, the necessary policies and investment will need to be prepared well in advance.
The assessment of the pathways and target levels point at three key issues that have also been raised in previous gap reports:
• All scenarios analyzing 2 °C pathways that follow the Cancun pledges until 2020 and with a least-cost starting point in 2020, require strong reductions after 2020. They also rely on so-called “negative emission technologies” such as bioenergy combined with carbon capture and storage
• For scenarios analyzing the 1.5 °C target, the reduction rates will need to be steeper
• The feasibility of large scale deployment of negative emission technologies is still a contentious issue.
Enhanced early action (such as moving below the 2020 pledges) is associated with the following economic and technological advantages:
• Softening the requirement for very steep emission reductions over the medium term
• Facilitating mitigation in the medium to long term by reducing lock-in of carbon and energy intensive infrastructure in the energy system and society as a whole
• Encouraging near-term learning and development of technologies that will be essential in the long term
• Providing early policy signals which are needed for action later in the coming decades
• Reducing the overall costs and economic challenges in terms of, for example, upscaling of energy investments, during the transitional period
• Reducing the dependence on unproven technologies and increase the options society can choose from in terms of means to achieve stringent emission reductions in the long term.
Delaying stringent mitigation efforts until 2030 (in other words, not following a least-cost reduction trajectory after 2020) would with high confidence make the transition to longer-term emissions levels in line with the 2 °C goal significantly more difficult. A significant number of models are not able to produce 2 °C scenarios consistent with global emission levels in 2030 above 55 GtCO2e, while other scenarios which delay enhanced mitigation action until after 2030 would imply massive cost increases coupled with a need for unprecedented political action.
4. Are G20 countries making progress on the implementation of 2020 pledges?
Among the G20 there are thirteen countries with pledges for 2020 (counting the EU members France, Germany, Italy and UK as one) and three countries without pledges. Six of these are assessed as being on track to meet pledges or extremely close, four are not, and three cannot be assessed, because there is insufficient evidence.
Pledges are self-determined. A country being on track does not necessarily mean that it undertakes more stringent action on mitigation than a country that is not on track – it depends on the ambition of the pledge.
The report presents an assessment of progress by G20 countries on the national pledges presented in the context of the Cancun agreement, and referred to here as the Cancun pledges.
The assessment compares projected 2020 emissions under three cases:
• Pledge case – projecting the maximum amount of emissions for 2020 compatible with the pledge
• Current policy trajectory – official national estimate• Current policy trajectory – independent analysis.Despite progress towards implementing policies in line
with pledges, it is evident that work remains to be done to bring all G20 countries into pledge attainment.
____________________4 As there are fewer than 10 scenarios available for the 1.5 °C pathways, the 20th to 80th percentile range is not provided. However, the minimum and maximum values
are 37 GtCO2e and 40 GtCO2e respectively.5 Global emissions in 2020 under various pledge cases are estimated to be about 52-54 GtCO2e. The least-cost 2020 scenarios used here have global emissions close to
this range (49-56 GtCO2e).
44 The Emissions Gap Report 2015 – Executive Summary
5. What is the emissions gap in 2025 and 2030 assuming full implementation of the INDCs?
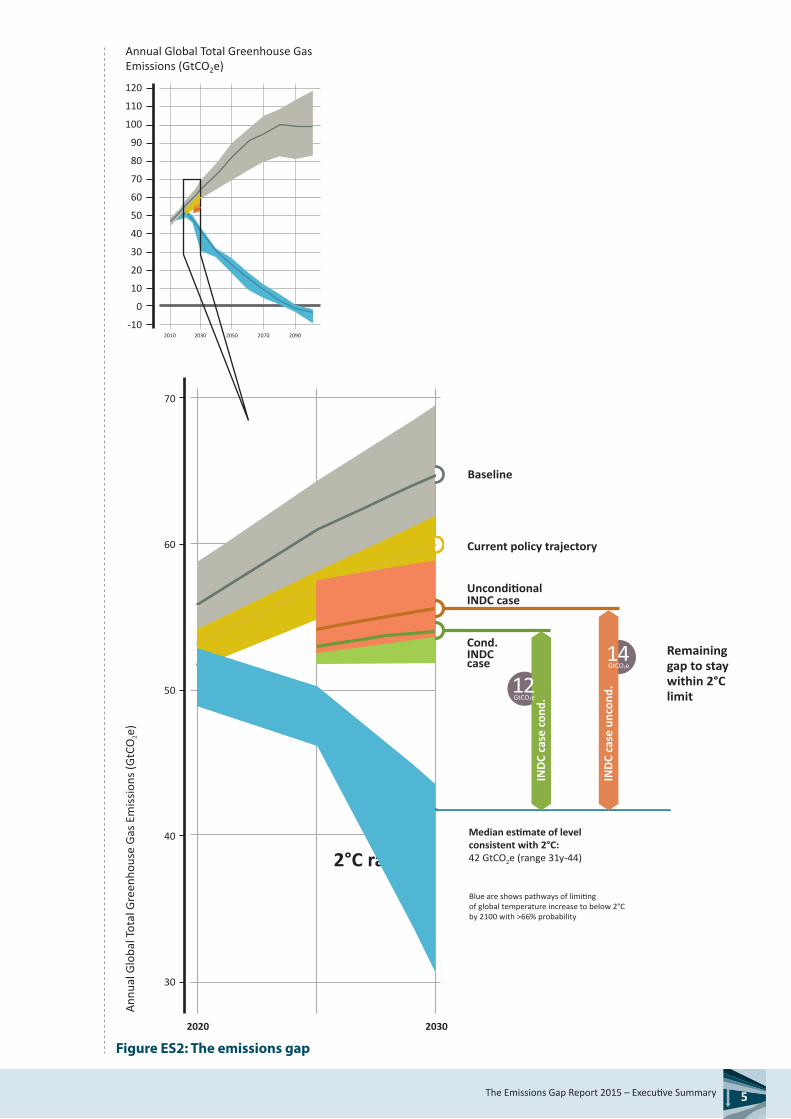
The emissions gap between what the full implementation of the unconditional INDCs contribute and the least-cost emission level for a pathway to stay below 2 °C, is estimated to be 14 GtCO2e (range: 12-17) in 2030 and 7 GtCO2e (range: 5-10) in 2025. When conditional INDCs are included as fully implemented, the emissions gap in 2030 is estimated to be 12 GtCO2e (range: 10-15) and 5 GtCO2e (range: 4-8) in 2025.
If countries that have not yet submitted an INDC were to reduce their emissions at the same percentage below current policy trajectories as those that have already submitted, the projected global emissions would be further reduced, and the gap narrowed, by a further 0.5 GtCO2e in 2025 and 1 GtCO2e in 2030.
Full implementation of unconditional INDC results in emission level estimates in 2030 that are most consistent with scenarios that limit global average temperature increase to below 3.5 °C until 2100 with a greater than 66 per cent chance. INDC estimates do, however, come with uncertainty ranges. When taking this into account the 3.5 °C value could decrease to 3 °C or increase towards 4 °C for the low and high unconditional INDC estimates, respectively. When including the full implementation of conditional INDCs, the emissions level estimates become most consistent with long-term scenarios that limit global average temperature increase to <3-3.5 °C by the end of the century with a greater than 66 per cent chance.
These numbers essentially tell two stories. Firstly the INDCs do present a real increase in the ambition level compared to a projection of current policies; all global modelling groups that have been assessed reached this conclusion. Secondly the submitted contributions are far from enough and the emissions gap in both 2025 and 2030 will be very significant.
The Report presents an assessment of the 119 INDCs submitted by 1 October 2015, covering 146 countries and 85-88 per cent of global GHG emissions in 2012. A final update of the assessment including later submissions will be presented on the UNEP Live website before the start of COP 21.
In the absence of agreed formats for reporting on mitigation contributions, including on the units in which those might be expressed, Parties have chosen a wide variety of forms and contributions: for example, targets used include:
• Economy-wide absolute reduction from historical base year emissions
• Emissions reduction relative to a baseline projection for the emissions associated with energy consumption
• Trajectory target for specific sectors or gases• Specifying a peaking year• Emissions intensity of GDP• A fixed level target.This has increased the analytical challenge of ensuring
consistency when comparing and aggregating different mitigation contributions. The assessment builds on a combination of global and country-specific modelling studies from independent research teams, and official country-specific data sources.
The global emission levels in 2030 consistent with having a likely chance (>66 per cent) of staying below the 2 °C goal in 2100, following a least-cost pathway from 2020 with only modest improvement of the GHG intensity until then, is 42 GtCO2e (range: 31-44). In 2025 this level is 48 GtCO2e (range: 46-50).
In comparison, global GHG emissions, based on assessment of the INDCs submitted by 1 October 2015, are for the unconditional INDCs projected to be at 54 GtCO2e (range: 53-58) in 2025, and 56 GtCO2e (range: 54-59) in 2030. If conditional INDCs are included, the global emissions projection is 53 GtCO2e (range: 52-56) in 2025 and 54 GtCO2e (range: 52-57) in 2030. The emission levels resulting from submitted INDCs are 4 to 6 GtCO2e lower than the current policy trajectory in 2030 of 60 GtCO2e (range: 58-62). They are 9 to 11 GtCO2e lower than the baseline of 65 GtCO2e (range: 60-70), which is based on IPCC AR5 scenarios and assumes no additional climate policies are put in place after 2010.
6. Can the INDC process become a foundation for enhancing ambition?
It is clear from the assessment of the mitigation contributions from the INDCs that much more needs to be done. This round of INDCs should therefore be considered as the first step in building foundations for a successful global climate agreement. The social and political effects of the INDCs and the processes undertaken at national level transcend the aggregate effect they are estimated to have on total global GHG emission levels in 2025 and 2030. The preparation of the INDCs has in many countries incentivized exploration of linkages between development and climate, as well as development of new national climate polices, and can be seen as an important step in a transition towards low carbon economies.
The Paris Agreement can support these national transitions and provide the framework for mobilization of the enhanced mitigation effort that is required to align national efforts with the global mitigation ambition indicated by the 2 °C pathways. Establishing a robust, effective and transparent follow-up and review framework as part of the Paris Agreement will be critical in this context.
The INDCs and options for enhanced mitigation action must be seen in the broader context of economic growth and sustainable development. The Sustainable Development Goals (SDGs) recently adopted in New York by Heads of State of all member states of the United Nations explicitly recognise the interdependence between the achievement of climate, development and sustainability goals and recommends prioritizing coherence, co-benefits, and complementarity between the SDGs and a climate change agreement under the UNFCCC.
The SDG Goal 13 “Take urgent action to combat climate change and its impacts” specifically acknowledges that the United Nations Framework Convention on Climate Change is the primary international, intergovernmental forum for negotiating the global response to climate change, and the targets associated with the goal are clearly aligned with the ambitions in the INDCs.
55The Emissions Gap Report 2015 – Executive Summary
2020
Baseline
Median estimate of levelconsistent with 2°C:42 GtCO2e (range 31y-44)
Blue are shows pathways of limiting of global temperature increase to below 2°Cby 2100 with >66% probability
Remaininggap to staywithin 2°Climit
2030
Current policy trajectory
Cond.INDCcase
2°C range
2010 2030 2050 2070
120
110
100
90
80
70
60
50
40
30
20
10
0
-10
Annual Global Total Greenhouse Gas Emissions (GtCO2e)
2090
70
60
50
40
30
INDC caseUnconditional
12GtCO2e
INDC
cas
e co
nd.
14GtCO2e
INDC
cas
e un
cond
.
Annu
al G
loba
l Tot
al G
reen
hous
e G
as E
miss
ions
(GtC
O2e
)
Figure ES2: The emissions gap
66 The Emissions Gap Report 2015 – Executive Summary
7. What are some of the options for closing the gap?
A number of recent global studies conclude that there is a significant potential to reduce global emissions in 2030 – beyond the reductions resulting from implementation of the INDCs. If this potential is fully exploited, it could bring global emissions to a level very close to bridge the emissions gap in 2030. Furthermore, the studies suggest that this can be done by relying on proven technologies and policies.
A number of recent studies and reports, including by the IPCC and leading international research institutions, identifies a significant emissions reduction potential by 2030. Acknowledging that the methodologies, assumptions, scope and coverage of measures considered vary across the assessed studies, they all show that tapping into unused emission reduction potential could narrow the emissions gap in 2030 considerably. Taken together, they indicate that global greenhouse gas emissions could be further reduced by between 5 to 12 GtCO2e/yr (range: 3-13) relative to the emissions level resulting from implementation of the unconditional INDCs, and between 5 to 10 GtCO2e/yr (range: 1-11) relative to the emissions level associated with implementation of the conditional INDCs. These reductions could contribute to the reductions needed to bridge the emissions gap in 2030, which as previously stated is estimated at 14 GtCO2e (range: 12-17) for the unconditional INDC case and at 12 GtCO2e (range: 10-15), if both unconditional and conditional INDCs are implemented.
There is considerable uncertainty associated with the possibilities for achieving the emission reduction opportunities put forward in some of these studies. At the same time, the studies assessed do not cover all relevant measures, thematic areas and sectors. In other words the total technical and economic emission reduction potential in 2030 could be larger than indicated in the studies assessed. In comparison the Fourth Assessment Report of the IPCC indicated a total emission reduction potential in 2030 of 23 GtCO2e (range: 16-31). No update of the total emission reduction potential in 2030 was provided in the Fifth Assessment Report of the IPCC, but sectoral updates in this report indicate emission reduction potentials in 2030 of the same order of magnitude.
The assessed recent studies emphasize the key importance of enhanced energy efficiency with a particular emphasis on industry, buildings and transport, and expanded use of renewable energy technologies for power production combined with increased efficiency of fossil fuel-based power production will all be critical for achievement of the desired large-scale emission reductions. Other key sectors for enhanced mitigation action emphasized in the studies include forestry, agriculture and waste.
These are all sectors that have been assessed in earlier UNEP Emissions Gap Reports and where significant opportunities for bridging the gap have been highlighted through possibilities for replication, acceleration and scaling up proven good practices and policies.
8. How can International Cooperative Initiatives contribute to implementation of INDCs and enhance ambitions?
The impact of actions by International Cooperative Initiatives can potentially be significant. Preliminary assessments indicate a contribution in the range of 2.5 to 4 GtCO2e in 2020, if fully implemented. Part of this contribution falls within the Cancun pledges while the additional contribution may be in the range of 0.75 to 2 GtCO2e in 2020.
Significant attention has been put on mitigation actions by ICIs including actors other than Parties to the UNFCCC.
ICIs include a wide variety of activities, which makes consistent and thorough assessment difficult. Nevertheless, an effort has been made to assess all available information and organize it under a simple catalogue of actions categorized by type of constituent engaged. This catalogue serves to focus on those ICIs that have the most impact potential and by disentangling the various initiatives the overlap and double-counting risks with the national pledges can be minimized.
The report examines initiatives in three broad categories:• Cities and regions • Companies• SectorsA few examples below illustrate the wide span of ICIs:• C40 Cities Climate Leadership Group – is a network of
the world’s megacities committed to taking action that reduces global GHG emissions. It has 75 affiliated cities (as of July 2015) and a total of 80 total participants
• The Compact of Mayors - is an agreement by three city networks to undertake a transparent and supportive approach to reduce city-level emissions, and to reduce vulnerability from, and enhance resilience to, climate change, in a consistent and complementary manner to national level climate protection efforts. It builds on ongoing city-level efforts
• Cement Sustainability Initiative (CSI) - is an alliance of 25 leading companies in the global cement industry created under the auspices of the World Business Council for Sustainable Development (WBCSD). Participants commit to developing a climate change mitigation strategy, setting reduction targets for CO2 and reporting annually on their progress.
A number of new studies have examined the major initiatives and this report presents an assessment of these studies and their estimates of the emission reduction potential for each category of initiative. The studies list a number of challenges related to the analyzed ICIs including elements of overlap between initiatives and comparability of transparent monitoring, reporting and verification (MRV) of results. It is therefore difficult to assess whether all the international initiatives actually deliver on promises, as most initiatives propose only voluntary commitments and hence make it difficult for accountability and compliance to be enforced and sometimes lack robust Monitoring, Reporting and Verification (MRV).
77The Emissions Gap Report 2015 – Executive Summary
Many initiatives can, however, play important roles to advance climate action, as they:
• Encourage or facilitate emission reductions at the city and regional level, via knowledge sharing, capacity building and technical support for project planning and implementation
• Identify partnerships and support local communities to become climate resilient
• Represent common city-level interests to influence policymakers at other levels
• Help implement climate plans and low-carbon and climate-resilient economic development projects
• Achieve transparency and accountability by encouraging best practice in GHG emission reporting
• Help overcome financial barriers and attract investors and accelerate additional capital flows into cities for low carbon projects.
The studies compare the emissions reduction potential for the different categories of initiatives compared to a current trajectory baseline (noting that studies are not necessarily using same baseline approaches). Even if uncertainties are quite large, it is interesting that results are quite comparable at the aggregate level, even if the assessment of the different groups of initiatives varies significantly.
The assessment notes that the impact of non-state climate commitments can be significant, most likely in the range between 2.5 and 4 GtCO2e in 2020 (taking into account that not all initiatives are included in all assessments). These numbers include an estimate of overlaps between the various initiatives, in terms of actual actions, sectors, greenhouse gases and regions.
It is harder to estimate the overlap between these non-state initiatives and government emission reduction pledges for 2020. The recent studies examined in this assessment
suggest that the overlap ranges between 33 and 70 per cent, resulting in possible additional net contributions of the order of 0.75 to 2 GtCO2e in 2020.
Even if ICIs are not necessarily additional to national 2020 pledges, they can be an important component of actually implementing these and at the same time facilitate or even drive increased national ambition. Only one study extrapolates the potential reductions to 2030, so it is not possible to present numbers here, but the study indicates that the mitigation contribution from existing ICIs would be substantial.
9. What is the potential for greater forest-related mitigation, in particular through REDD+?
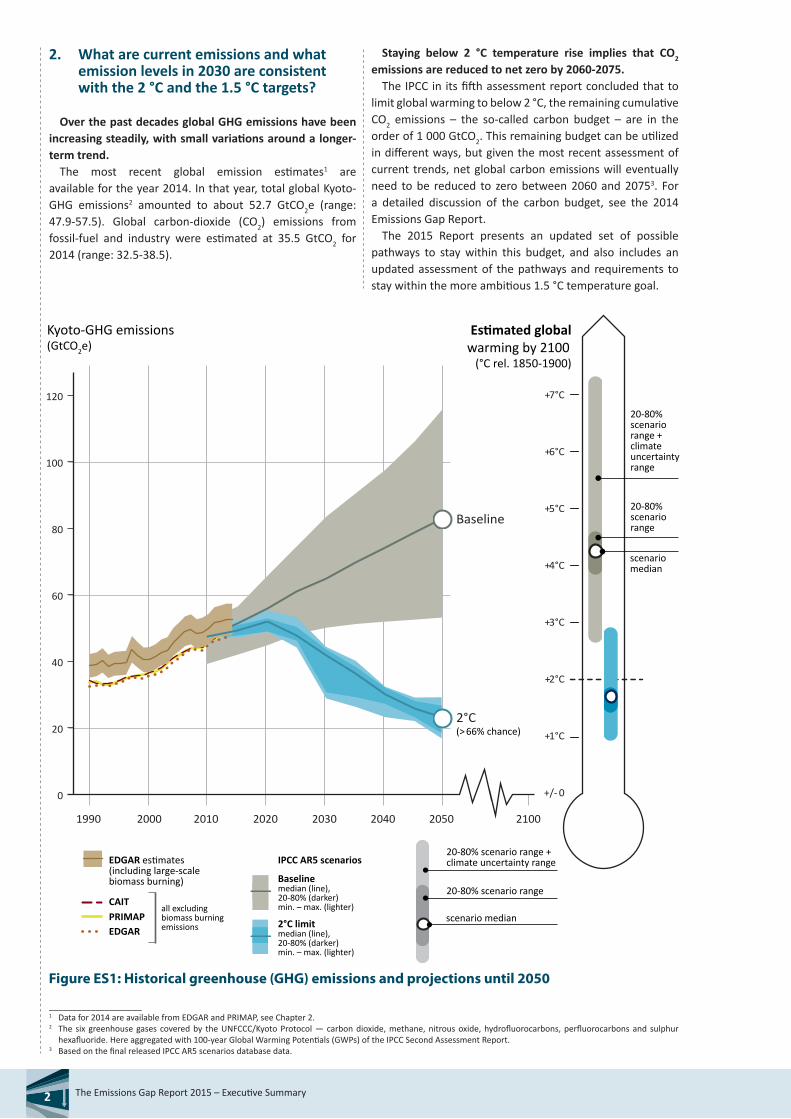
Forest-related mitigation activities in both developing and developed countries are attracting significant political attention, both in the negotiation process over the last years and in many of the submitted INDCs. Special focus is on policies and actions under REDD+ as the theoretical potential of forest-related mitigation activities in developing countries is estimated to be up to 9 GtCO2 in 2030. The realization of this theoretical potential will be constrained by economic and land-use factors.
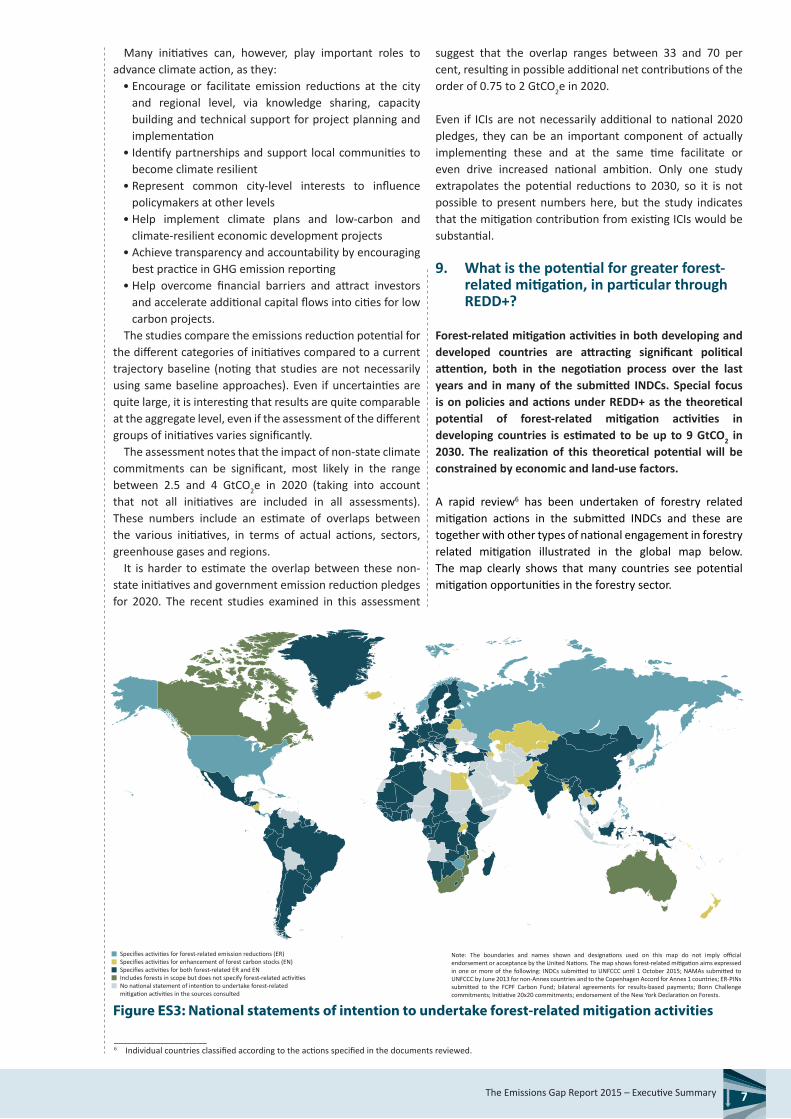
A rapid review6 has been undertaken of forestry related mitigation actions in the submitted INDCs and these are together with other types of national engagement in forestry related mitigation illustrated in the global map below. The map clearly shows that many countries see potential mitigation opportunities in the forestry sector.
____________________6 Individual countries classified according to the actions specified in the documents reviewed.
Figure ES3: National statements of intention to undertake forest-related mitigation activities
Specifies activities for forest-related emission reductions (ER)Specifies activities for enhancement of forest carbon stocks (EN)Specifies activities for both forest-related ER and ENIncludes forests in scope but does not specify forest-related activitiesNo national statement of intention to undertake forest-relatedmitigation activities in the sources consulted
Note: The boundaries and names shown and designations used on this map do not imply official endorsement or acceptance by the United Nations. The map shows forest-related mitigation aims expressed in one or more of the following: INDCs submitted to UNFCCC until 1 October 2015; NAMAs submitted to UNFCCC by June 2013 for non-Annex countries and to the Copenhagen Accord for Annex 1 countries; ER-PINs submitted to the FCPF Carbon Fund; bilateral agreements for results-based payments; Bonn Challenge commitments; Initiative 20x20 commitments; endorsement of the New York Declaration on Forests.
88 The Emissions Gap Report 2015 – Executive Summary
A special focus in the assessment has been devoted to the set of policy approaches and actions known as REDD+ as one option for facilitating cost-effective contributions to climate change mitigation, in developing countries. REDD+ (as defined under the UNFCCC) includes - reducing greenhouse gas emissions from deforestation and forest degradation, conservation of forest carbon stocks, sustainable management of forests and enhancement of forest carbon stocks.
REDD+ has seen marked progress under the UNFCCC negotiations over the last ten years, as a policy tool to reduce forest related emissions, including on measurement, safeguards and eligibility for results-based finance. In order for developing countries to access results-based finance for REDD+ emissions reductions or enhanced removals of carbon from the atmosphere, they need to have in place:
• A national strategy or action plan• A national forest monitoring system• A safeguards information system and a summary of
information on how the REDD+ safeguards have been addressed and respected
• A forest reference emissions level or forest reference level
• Fully measured, reported and verified results, in terms of emission reductions/enhanced removals.
These requirements place some constraints on the potential for REDD+ implementation in the short term, for example the speed at which policies can be put in place and governance improvements can be implemented. The availability of finance, whether domestic or international, to cover the upfront costs of REDD+ measures will also be a determining factor. Results-based finance, by its nature, will be released only after success has been achieved. Many developing countries have expressed their interest in large-scale forest-related actions, both in their INDCs and a range of other statements.
The theoretical emissions reduction potential has been assessed for Africa, Asia-Pacific, and Latin America and the Caribbean and is broadly in the range 2.7-3.3 GtCO2 in 2030 for each region. However, the realization of this theoretical potential will be significantly constrained by economic and land-use factors.