Embed Size (px)
Citation preview
Economic Benefits of the Forest Industry in Georgia: 2016 Page 1
Table of Contents Executive Summary ......................................................... 2
Introduction .................................................................. 8
Definition of the Forest Industry in Georgia ............................ 9
Economic Benefits .......................................................... 16
Economic Impact of Urban and Community Forestry ................. 24
Economic Impact by Regional Commission .............................. 25
References ................................................................... 28
Appendix ..................................................................... 29
Economic Benefits of the Forest Industry in Georgia: 2016 Page 2
Executive Summary Georgia’s forest industry has many components, which interact with all other
sectors of the economy in complex ways. The purposes of this analysis are to: (1) quantify the level of economic activity conducted by the components of the forest industry, (2) estimate economic activity supported in all Georgia sectors by the industry’s activities, (3) compare the level of activity in the forest industry with other industries, and (4) quantify the economic activity of forest industry sectors within each of the 12 regional commissions in Georgia.
This report is the latest in a series that began in 2002, but underwent a significant restructuring in 2003 to reflect the change in industry classification systems from Standard Industrial Classification (SIC) to North American Industry Classification System (NAICS) used by data collection agencies (primarily the Georgia Department of Labor) that provide much of the data used in these analyses. Also, some minor adjustments were made in the 2011 NAICS list to reflect the changes in the new 2012 NAICS code definitions.
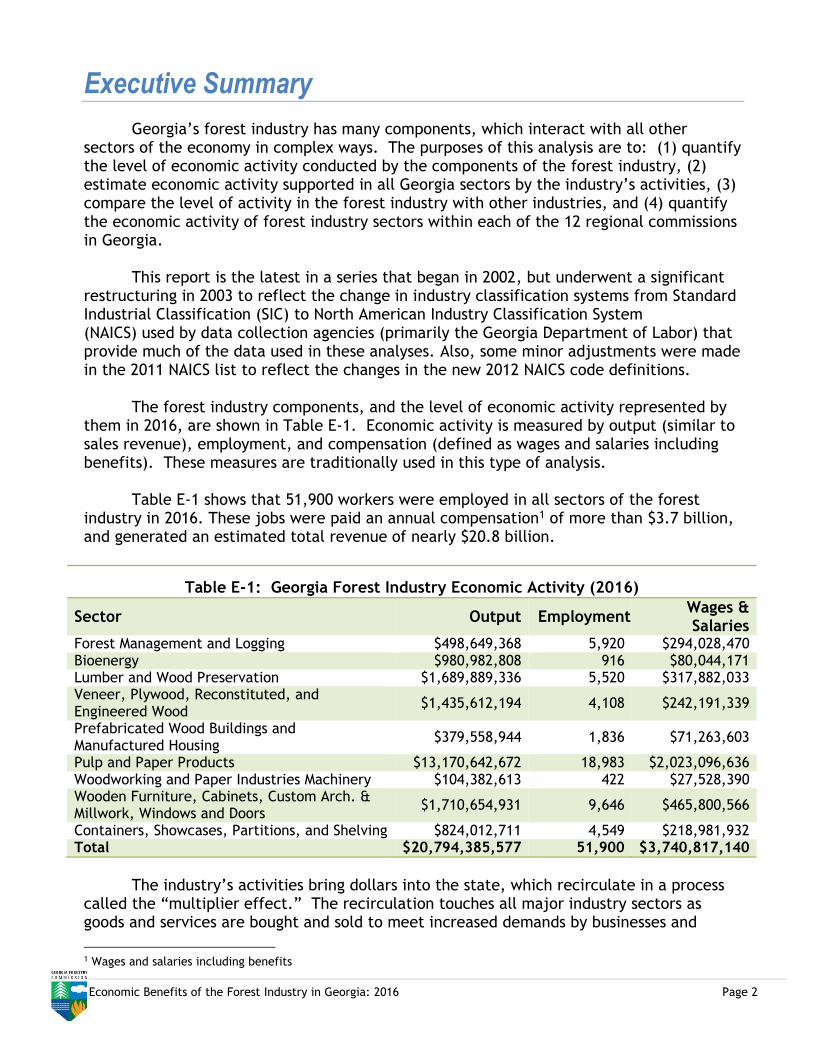
The forest industry components, and the level of economic activity represented by them in 2016, are shown in Table E-1. Economic activity is measured by output (similar to sales revenue), employment, and compensation (defined as wages and salaries including benefits). These measures are traditionally used in this type of analysis.
Table E-1 shows that 51,900 workers were employed in all sectors of the forest industry in 2016. These jobs were paid an annual compensation1 of more than $3.7 billion, and generated an estimated total revenue of nearly $20.8 billion.
Table E-1: Georgia Forest Industry Economic Activity (2016)
Sector Output Employment Wages & Salaries
Forest Management and Logging $498,649,368 5,920 $294,028,470 Bioenergy $980,982,808 916 $80,044,171 Lumber and Wood Preservation $1,689,889,336 5,520 $317,882,033 Veneer, Plywood, Reconstituted, and Engineered Wood
$1,435,612,194 4,108 $242,191,339
Prefabricated Wood Buildings and Manufactured Housing
$379,558,944 1,836 $71,263,603
Pulp and Paper Products $13,170,642,672 18,983 $2,023,096,636 Woodworking and Paper Industries Machinery $104,382,613 422 $27,528,390 Wooden Furniture, Cabinets, Custom Arch. & Millwork, Windows and Doors
$1,710,654,931 9,646 $465,800,566
Containers, Showcases, Partitions, and Shelving $824,012,711 4,549 $218,981,932 Total $20,794,385,577 51,900 $3,740,817,140
The industry’s activities bring dollars into the state, which recirculate in a process
called the “multiplier effect.” The recirculation touches all major industry sectors as goods and services are bought and sold to meet increased demands by businesses and
1 Wages and salaries including benefits
Economic Benefits of the Forest Industry in Georgia: 2016 Page 3
households resulting from the new resources brought into the state by the forest industry.
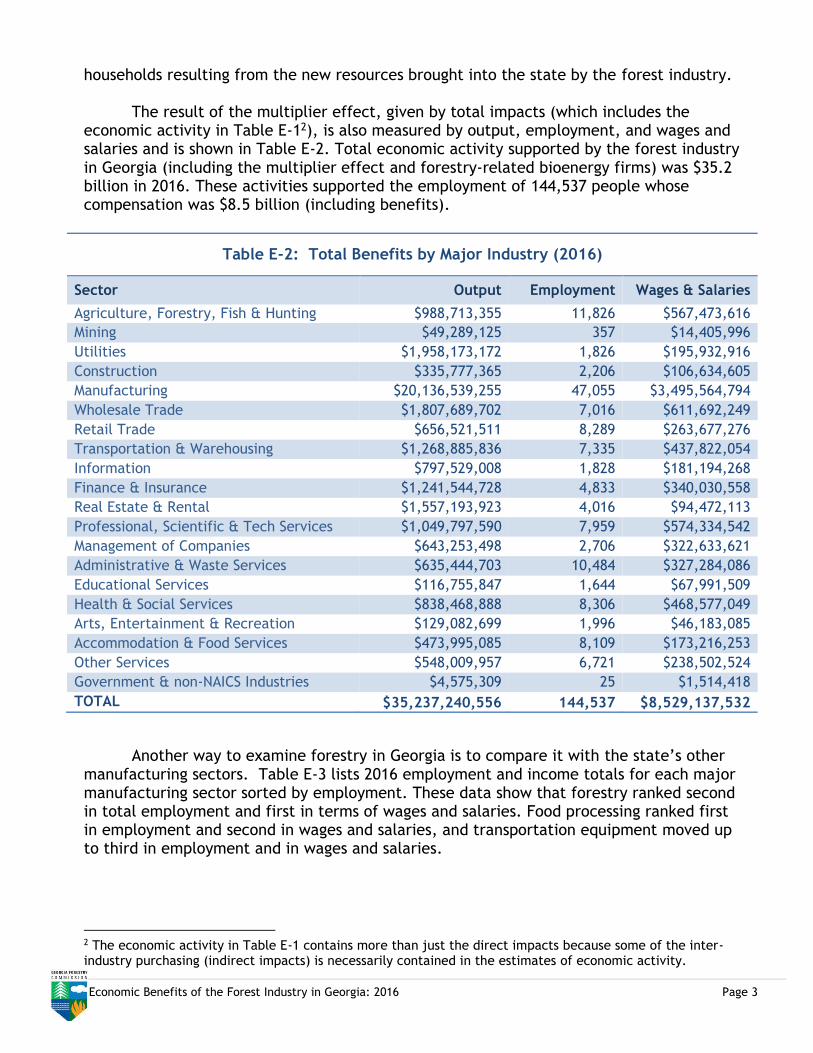
The result of the multiplier effect, given by total impacts (which includes the economic activity in Table E-12), is also measured by output, employment, and wages and salaries and is shown in Table E-2. Total economic activity supported by the forest industry in Georgia (including the multiplier effect and forestry-related bioenergy firms) was $35.2 billion in 2016. These activities supported the employment of 144,537 people whose compensation was $8.5 billion (including benefits).
Table E-2: Total Benefits by Major Industry (2016)
Sector Output Employment Wages & Salaries
Agriculture, Forestry, Fish & Hunting $988,713,355 11,826 $567,473,616
Mining $49,289,125 357 $14,405,996
Utilities $1,958,173,172 1,826 $195,932,916
Construction $335,777,365 2,206 $106,634,605
Manufacturing $20,136,539,255 47,055 $3,495,564,794
Wholesale Trade $1,807,689,702 7,016 $611,692,249
Retail Trade $656,521,511 8,289 $263,677,276
Transportation & Warehousing $1,268,885,836 7,335 $437,822,054
Information $797,529,008 1,828 $181,194,268
Finance & Insurance $1,241,544,728 4,833 $340,030,558
Real Estate & Rental $1,557,193,923 4,016 $94,472,113
Professional, Scientific & Tech Services $1,049,797,590 7,959 $574,334,542
Management of Companies $643,253,498 2,706 $322,633,621
Administrative & Waste Services $635,444,703 10,484 $327,284,086
Educational Services $116,755,847 1,644 $67,991,509
Health & Social Services $838,468,888 8,306 $468,577,049
Arts, Entertainment & Recreation $129,082,699 1,996 $46,183,085
Accommodation & Food Services $473,995,085 8,109 $173,216,253
Other Services $548,009,957 6,721 $238,502,524
Government & non-NAICS Industries $4,575,309 25 $1,514,418
TOTAL $35,237,240,556 144,537 $8,529,137,532
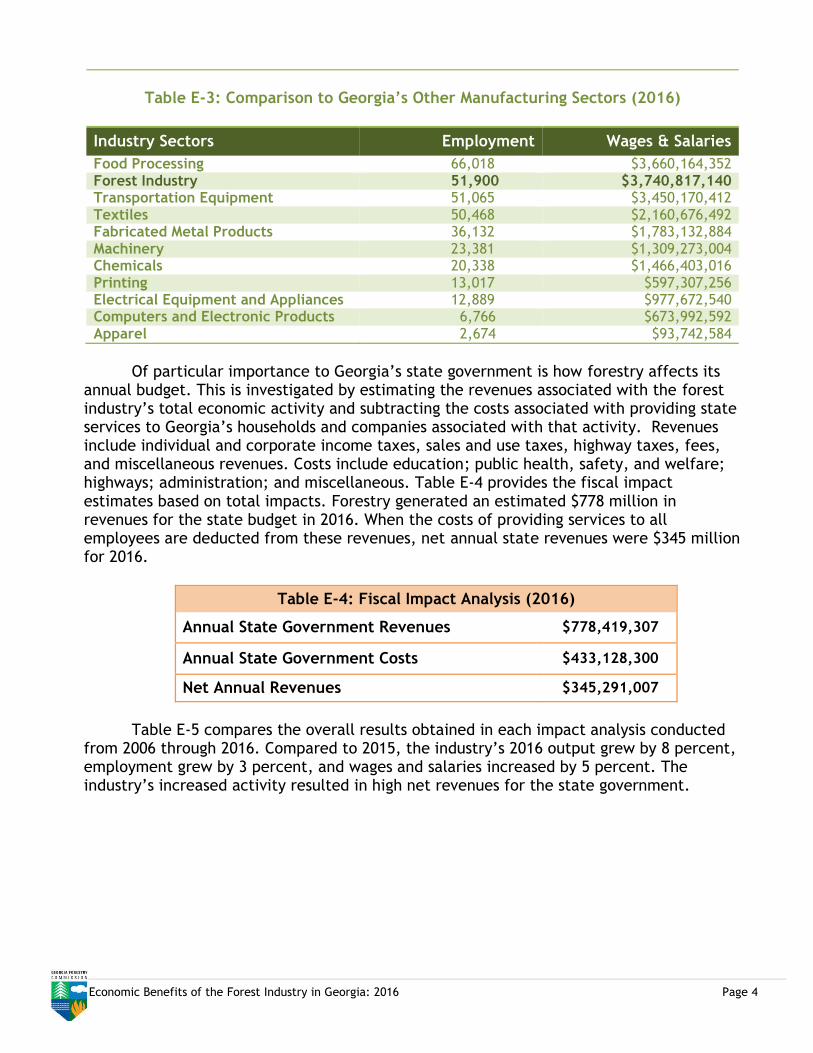
Another way to examine forestry in Georgia is to compare it with the state’s other manufacturing sectors. Table E-3 lists 2016 employment and income totals for each major manufacturing sector sorted by employment. These data show that forestry ranked second in total employment and first in terms of wages and salaries. Food processing ranked first in employment and second in wages and salaries, and transportation equipment moved up to third in employment and in wages and salaries.
2 The economic activity in Table E-1 contains more than just the direct impacts because some of the inter-industry purchasing (indirect impacts) is necessarily contained in the estimates of economic activity.
Economic Benefits of the Forest Industry in Georgia: 2016 Page 4
Of particular importance to Georgia’s state government is how forestry affects its
annual budget. This is investigated by estimating the revenues associated with the forest industry’s total economic activity and subtracting the costs associated with providing state services to Georgia’s households and companies associated with that activity. Revenues include individual and corporate income taxes, sales and use taxes, highway taxes, fees, and miscellaneous revenues. Costs include education; public health, safety, and welfare; highways; administration; and miscellaneous. Table E-4 provides the fiscal impact estimates based on total impacts. Forestry generated an estimated $778 million in revenues for the state budget in 2016. When the costs of providing services to all employees are deducted from these revenues, net annual state revenues were $345 million for 2016.
Table E-4: Fiscal Impact Analysis (2016)
Annual State Government Revenues $778,419,307
Annual State Government Costs $433,128,300
Net Annual Revenues $345,291,007
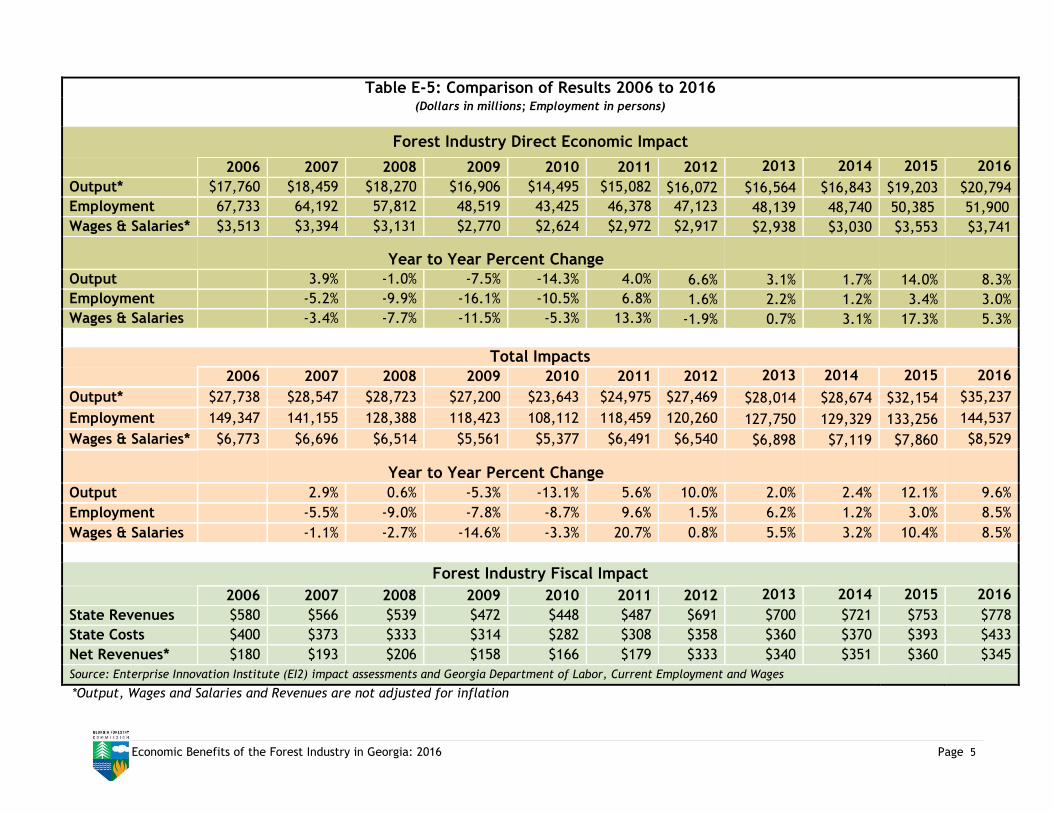
Table E-5 compares the overall results obtained in each impact analysis conducted
from 2006 through 2016. Compared to 2015, the industry’s 2016 output grew by 8 percent, employment grew by 3 percent, and wages and salaries increased by 5 percent. The industry’s increased activity resulted in high net revenues for the state government.
Table E-3: Comparison to Georgia’s Other Manufacturing Sectors (2016)
Industry Sectors Employment Wages & Salaries
Food Processing 66,018 $3,660,164,352 Forest Industry 51,900 $3,740,817,140 Transportation Equipment 51,065 $3,450,170,412 Textiles 50,468 $2,160,676,492 Fabricated Metal Products 36,132 $1,783,132,884 Machinery 23,381 $1,309,273,004 Chemicals 20,338 $1,466,403,016 Printing 13,017 $597,307,256 Electrical Equipment and Appliances 12,889 $977,672,540 Computers and Electronic Products 6,766 $673,992,592 Apparel 2,674 $93,742,584
Economic Benefits of the Forest Industry in Georgia: 2016 Page 5
Table E-5: Comparison of Results 2006 to 2016 (Dollars in millions; Employment in persons)
Forest Industry Direct Economic Impact
2006 2007 2008 2009 2010 2011 2012 2013 2014 2015 2016
Output* $17,760 $18,459 $18,270 $16,906 $14,495 $15,082 $16,072 $16,564 $16,843 $19,203 $20,794
Employment 67,733 64,192 57,812 48,519 43,425 46,378 47,123 48,139 48,740 50,385 51,900
Wages & Salaries* $3,513 $3,394 $3,131 $2,770 $2,624 $2,972 $2,917 $2,938 $3,030 $3,553 $3,741
Year to Year Percent Change
Output 3.9% -1.0% -7.5% -14.3% 4.0% 6.6% 3.1% 1.7% 14.0% 8.3%
Employment -5.2% -9.9% -16.1% -10.5% 6.8% 1.6% 2.2% 1.2% 3.4% 3.0%
Wages & Salaries -3.4% -7.7% -11.5% -5.3% 13.3% -1.9% 0.7% 3.1% 17.3% 5.3%
Total Impacts
2006 2007 2008 2009 2010 2011 2012 2013 2014 2015 2016
Output* $27,738 $28,547 $28,723 $27,200 $23,643 $24,975 $27,469 $28,014 $28,674 $32,154 $35,237
Employment 149,347 141,155 128,388 118,423 108,112 118,459 120,260 127,750 129,329 133,256 144,537
Wages & Salaries* $6,773 $6,696 $6,514 $5,561 $5,377 $6,491 $6,540 $6,898 $7,119 $7,860 $8,529
Year to Year Percent Change
Output 2.9% 0.6% -5.3% -13.1% 5.6% 10.0% 2.0% 2.4% 12.1% 9.6%
Employment -5.5% -9.0% -7.8% -8.7% 9.6% 1.5% 6.2% 1.2% 3.0% 8.5%
Wages & Salaries -1.1% -2.7% -14.6% -3.3% 20.7% 0.8% 5.5% 3.2% 10.4% 8.5%
Forest Industry Fiscal Impact
2006 2007 2008 2009 2010 2011 2012 2013 2014 2015 2016
State Revenues $580 $566 $539 $472 $448 $487 $691 $700 $721 $753 $778
State Costs $400 $373 $333 $314 $282 $308 $358 $360 $370 $393 $433
Net Revenues* $180 $193 $206 $158 $166 $179 $333 $340 $351 $360 $345
Source: Enterprise Innovation Institute (EI2) impact assessments and Georgia Department of Labor, Current Employment and Wages
*Output, Wages and Salaries and Revenues are not adjusted for inflation
Economic Benefits of the Forest Industry in Georgia: 2016 Page 6
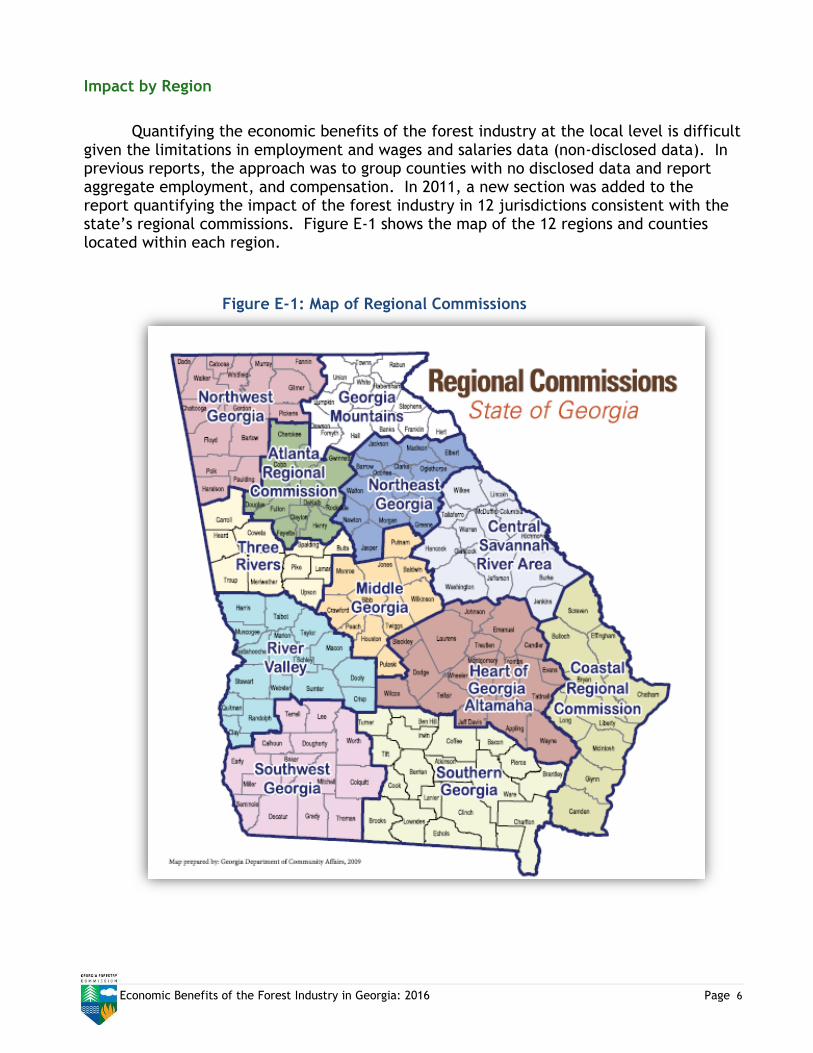
Impact by Region
Quantifying the economic benefits of the forest industry at the local level is difficult given the limitations in employment and wages and salaries data (non-disclosed data). In previous reports, the approach was to group counties with no disclosed data and report aggregate employment, and compensation. In 2011, a new section was added to the report quantifying the impact of the forest industry in 12 jurisdictions consistent with the state’s regional commissions. Figure E-1 shows the map of the 12 regions and counties located within each region.
Figure E-1: Map of Regional Commissions
Economic Benefits of the Forest Industry in Georgia: 2016 Page 7
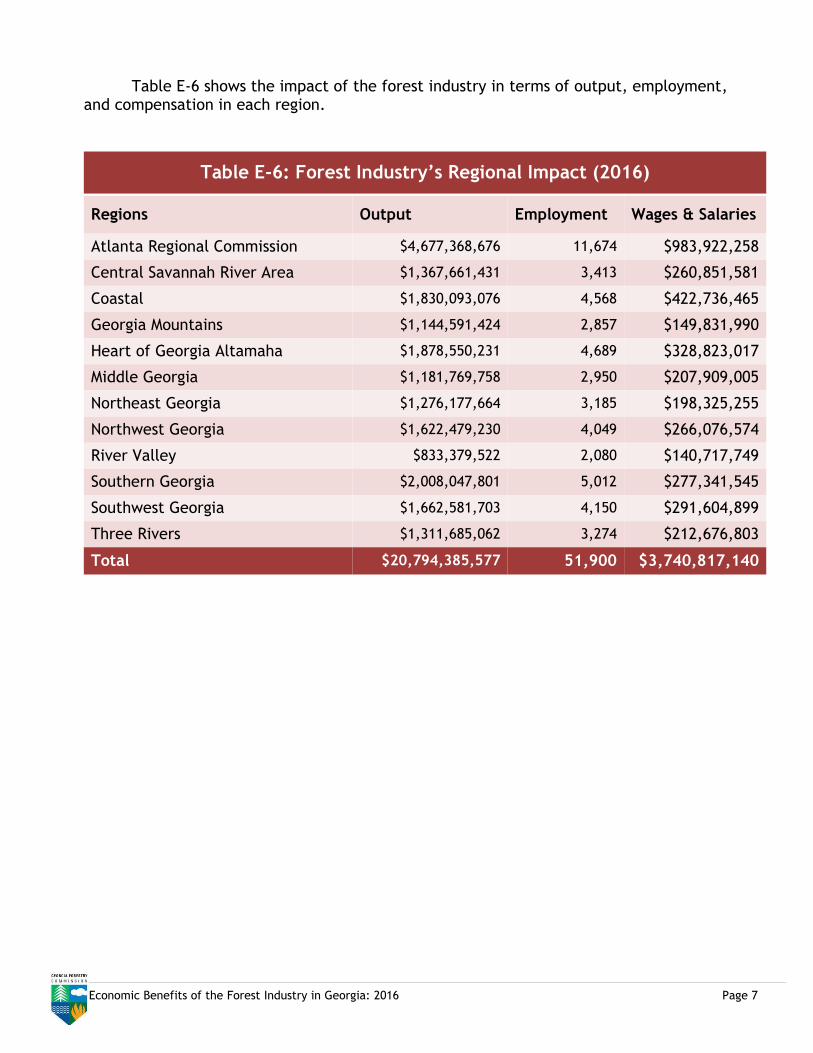
Table E-6 shows the impact of the forest industry in terms of output, employment, and compensation in each region.
Table E-6: Forest Industry’s Regional Impact (2016)
Regions Output Employment Wages & Salaries
Atlanta Regional Commission $4,677,368,676 11,674 $983,922,258
Central Savannah River Area $1,367,661,431 3,413 $260,851,581
Coastal $1,830,093,076 4,568 $422,736,465
Georgia Mountains $1,144,591,424 2,857 $149,831,990
Heart of Georgia Altamaha $1,878,550,231 4,689 $328,823,017
Middle Georgia $1,181,769,758 2,950 $207,909,005
Northeast Georgia $1,276,177,664 3,185 $198,325,255
Northwest Georgia $1,622,479,230 4,049 $266,076,574
River Valley $833,379,522 2,080 $140,717,749
Southern Georgia $2,008,047,801 5,012 $277,341,545
Southwest Georgia $1,662,581,703 4,150 $291,604,899
Three Rivers $1,311,685,062 3,274 $212,676,803
Total $20,794,385,577 51,900 $3,740,817,140
Economic Benefits of the Forest Industry in Georgia: 2016 Page 8
SECTION 1
Introduction
Georgia’s forest industry contains many components and supports a significant proportion of the state’s economic activity. This analysis quantifies that activity in terms of economic output, employment, and employee compensation. Economic output is defined as business revenues, and employee compensation is defined as wages and salaries including benefits paid by employers. Additional factors considered include how the manufacturing components in the forest industry compare to other manufacturing sectors, and how the forest industry affects state government costs and revenues.
The first step in this process was to define the limits of what constitutes the “forest industry.” This was not a simple task because the borders of one industry overlap those of other industries. How this was done and its results appear in Section 2, which also contains estimates of how much economic activity is occurring in each component of the forest industry.
After the industry was defined and activities quantified, the total economic activity supported by the forest industry was estimated. Total activity is generally referred to as the “multiplier effect.” This effect occurs whenever dollars are brought into the state’s economy and recirculated before leaking out. Section 3 explains the methodology used to estimate total economic activity and provides perspective on how important these activities are in the overall Georgia economy.
Section 4 quantifies the economic impact of urban and community forestry, a sector that was added to this year’s report. Section 5 shows forest industry’s output, employment, and compensation in the state’s 12 regional commissions.
This report is the latest of a series of reports that began with an analysis of the 2002 impacts and continuing annually to the present analysis. The 2002 analysis is not comparable to the subsequent analyses, however, because of a significant change in the industry classification systems implemented in the 2003 data set. The 2002 analysis was based on the Standard Industry Classification system (SIC), and the later data sets used the North American Industrial Classification System (NAICS). Industry classification changes introduced by NAICS 2012 code required minor adjustments in the NAICS code selection in the 2011 analysis. The new classification was also used in this year’s analysis.
The 2014 report includes revisions of 2012 and 2013 historical data, which were
made as a result of a more objective and efficient methodology of retrieving data from the ES202 database provided by the Georgia Department of Labor.
Economic Benefits of the Forest Industry in Georgia: 2016 Page 9
SECTION 2
Definition of the Forest Industry in Georgia
The forest industry in Georgia has many diverse components. A general definition
would include all service and manufacturing activity related to the growth, harvesting, and use of forest materials that would not exist in Georgia without the presence of extensive forests or forest industries. For example, the papermaking industry would be a part of the forest industry definition, but retail sales of that paper would not. States without commercial forests still sell paper within their borders.
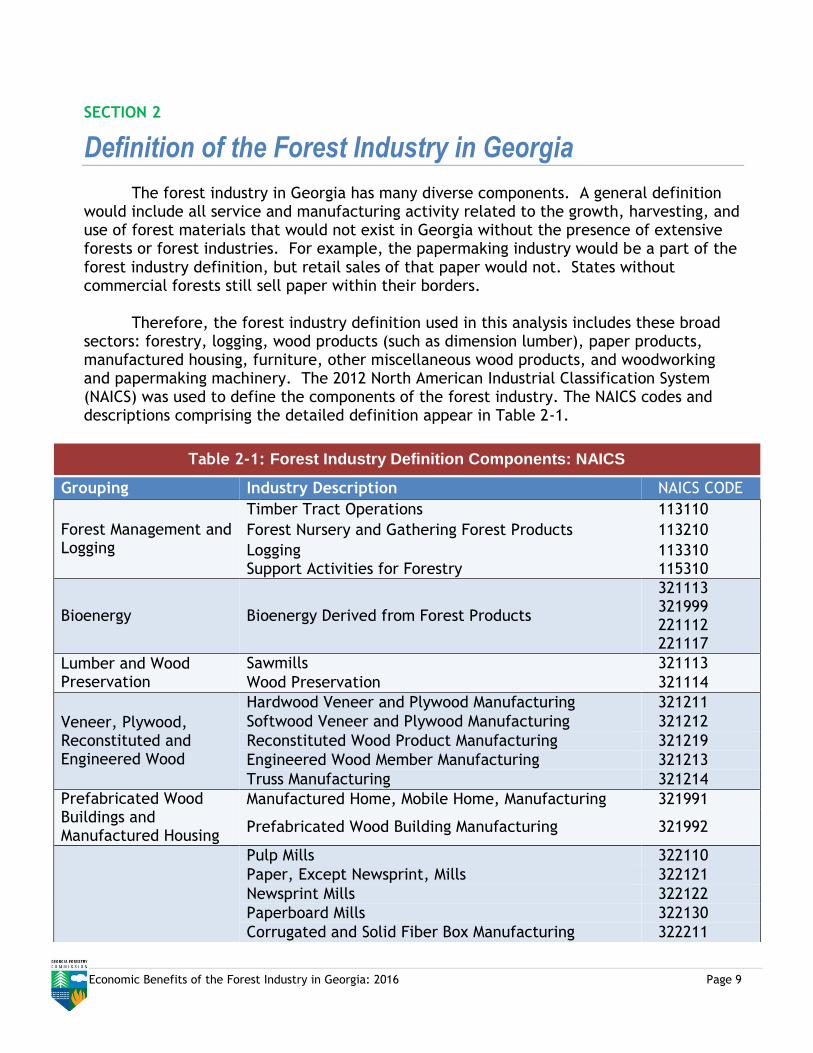
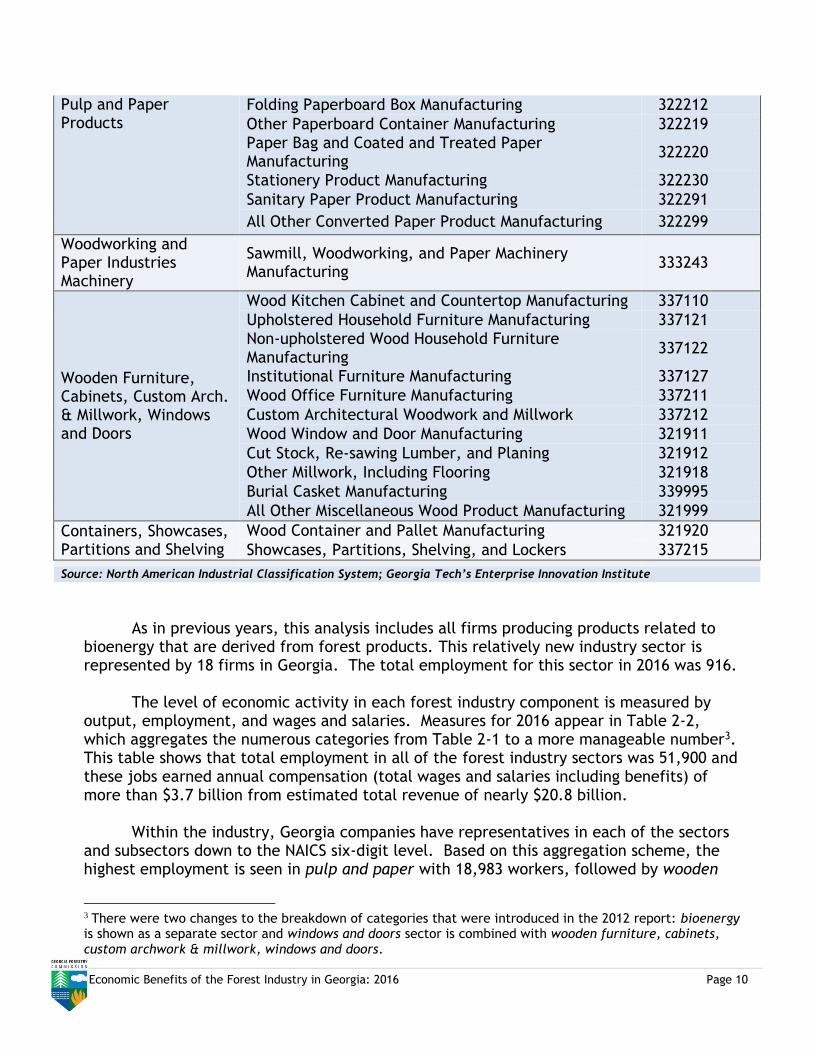
Therefore, the forest industry definition used in this analysis includes these broad sectors: forestry, logging, wood products (such as dimension lumber), paper products, manufactured housing, furniture, other miscellaneous wood products, and woodworking and papermaking machinery. The 2012 North American Industrial Classification System (NAICS) was used to define the components of the forest industry. The NAICS codes and descriptions comprising the detailed definition appear in Table 2-1.
Table 2-1: Forest Industry Definition Components: NAICS
Grouping Industry Description NAICS CODE
Forest Management and Logging
Timber Tract Operations 113110
Forest Nursery and Gathering Forest Products 113210
Logging Support Activities for Forestry
113310 115310
Bioenergy Bioenergy Derived from Forest Products
321113 321999 221112 221117
Lumber and Wood Preservation
Sawmills 321113
Wood Preservation 321114
Veneer, Plywood, Reconstituted and Engineered Wood
Hardwood Veneer and Plywood Manufacturing 321211
Softwood Veneer and Plywood Manufacturing 321212
Reconstituted Wood Product Manufacturing 321219
Engineered Wood Member Manufacturing 321213
Truss Manufacturing 321214
Prefabricated Wood Buildings and Manufactured Housing
Manufactured Home, Mobile Home, Manufacturing 321991
Prefabricated Wood Building Manufacturing 321992
Pulp Mills 322110
Paper, Except Newsprint, Mills 322121
Newsprint Mills 322122
Paperboard Mills 322130
Corrugated and Solid Fiber Box Manufacturing 322211
Economic Benefits of the Forest Industry in Georgia: 2016 Page 10
Pulp and Paper Products
Folding Paperboard Box Manufacturing 322212
Other Paperboard Container Manufacturing 322219
Paper Bag and Coated and Treated Paper Manufacturing
322220
Stationery Product Manufacturing 322230
Sanitary Paper Product Manufacturing 322291
All Other Converted Paper Product Manufacturing 322299
Woodworking and Paper Industries Machinery
Sawmill, Woodworking, and Paper Machinery Manufacturing
333243
Wooden Furniture, Cabinets, Custom Arch. & Millwork, Windows and Doors
Wood Kitchen Cabinet and Countertop Manufacturing 337110
Upholstered Household Furniture Manufacturing 337121
Non-upholstered Wood Household Furniture Manufacturing
337122
Institutional Furniture Manufacturing 337127
Wood Office Furniture Manufacturing 337211
Custom Architectural Woodwork and Millwork 337212
Wood Window and Door Manufacturing 321911
Cut Stock, Re-sawing Lumber, and Planing 321912
Other Millwork, Including Flooring 321918
Burial Casket Manufacturing 339995
All Other Miscellaneous Wood Product Manufacturing 321999
Containers, Showcases, Partitions and Shelving
Wood Container and Pallet Manufacturing 321920
Showcases, Partitions, Shelving, and Lockers 337215
Source: North American Industrial Classification System; Georgia Tech’s Enterprise Innovation Institute
As in previous years, this analysis includes all firms producing products related to bioenergy that are derived from forest products. This relatively new industry sector is represented by 18 firms in Georgia. The total employment for this sector in 2016 was 916.
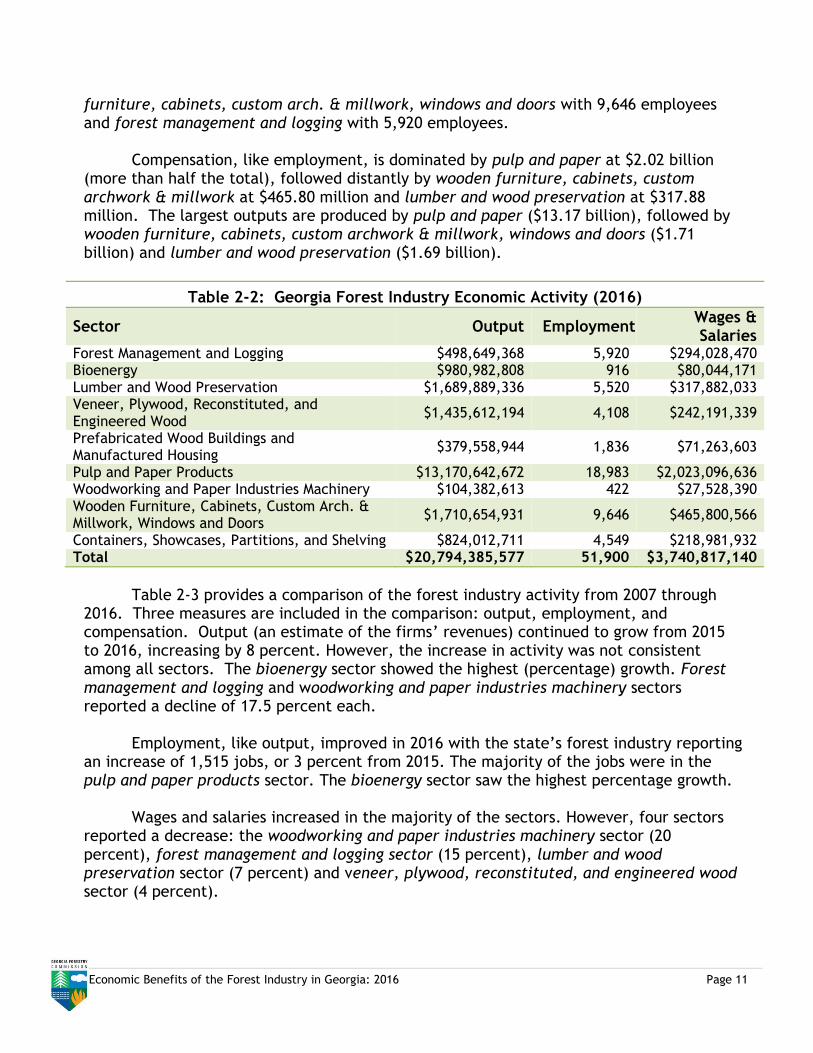
The level of economic activity in each forest industry component is measured by output, employment, and wages and salaries. Measures for 2016 appear in Table 2-2, which aggregates the numerous categories from Table 2-1 to a more manageable number3. This table shows that total employment in all of the forest industry sectors was 51,900 and these jobs earned annual compensation (total wages and salaries including benefits) of more than $3.7 billion from estimated total revenue of nearly $20.8 billion.
Within the industry, Georgia companies have representatives in each of the sectors and subsectors down to the NAICS six-digit level. Based on this aggregation scheme, the highest employment is seen in pulp and paper with 18,983 workers, followed by wooden
3 There were two changes to the breakdown of categories that were introduced in the 2012 report: bioenergy is shown as a separate sector and windows and doors sector is combined with wooden furniture, cabinets, custom archwork & millwork, windows and doors.
Economic Benefits of the Forest Industry in Georgia: 2016 Page 11
furniture, cabinets, custom arch. & millwork, windows and doors with 9,646 employees and forest management and logging with 5,920 employees.
Compensation, like employment, is dominated by pulp and paper at $2.02 billion (more than half the total), followed distantly by wooden furniture, cabinets, custom archwork & millwork at $465.80 million and lumber and wood preservation at $317.88 million. The largest outputs are produced by pulp and paper ($13.17 billion), followed by wooden furniture, cabinets, custom archwork & millwork, windows and doors ($1.71 billion) and lumber and wood preservation ($1.69 billion).
Table 2-2: Georgia Forest Industry Economic Activity (2016)
Sector Output Employment Wages & Salaries
Forest Management and Logging $498,649,368 5,920 $294,028,470 Bioenergy $980,982,808 916 $80,044,171 Lumber and Wood Preservation $1,689,889,336 5,520 $317,882,033 Veneer, Plywood, Reconstituted, and Engineered Wood
$1,435,612,194 4,108 $242,191,339
Prefabricated Wood Buildings and Manufactured Housing
$379,558,944 1,836 $71,263,603
Pulp and Paper Products $13,170,642,672 18,983 $2,023,096,636 Woodworking and Paper Industries Machinery $104,382,613 422 $27,528,390 Wooden Furniture, Cabinets, Custom Arch. & Millwork, Windows and Doors
$1,710,654,931 9,646 $465,800,566
Containers, Showcases, Partitions, and Shelving $824,012,711 4,549 $218,981,932 Total $20,794,385,577 51,900 $3,740,817,140
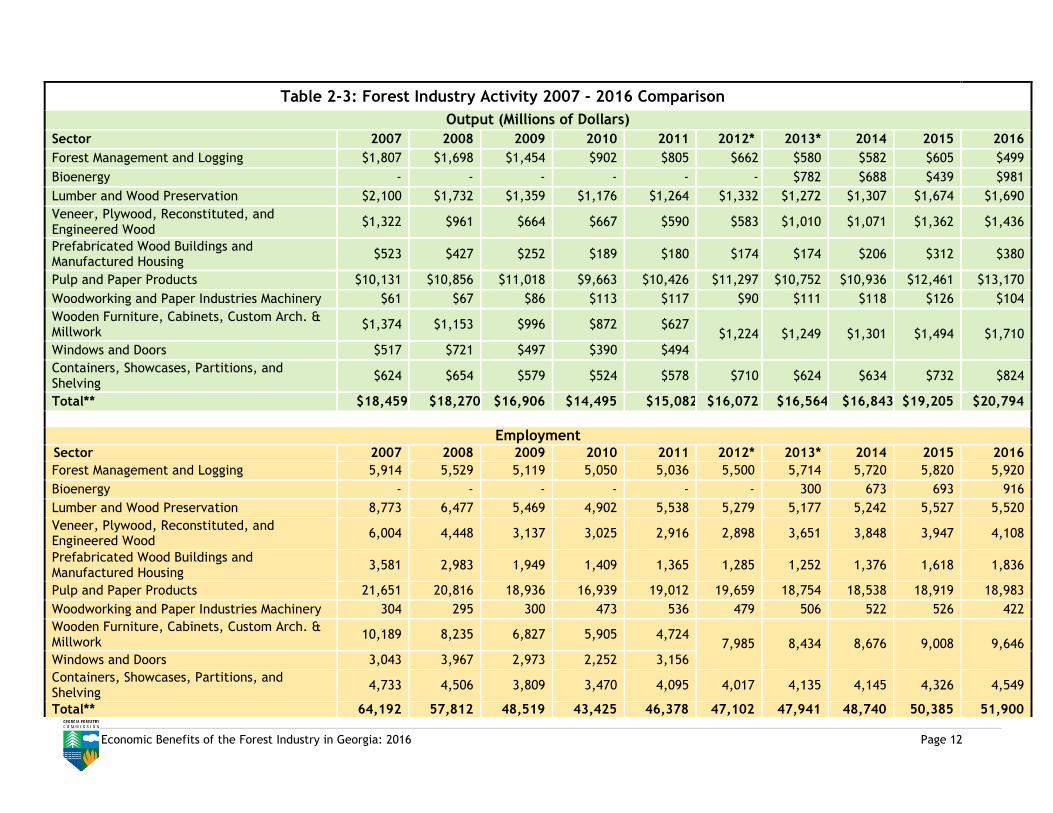
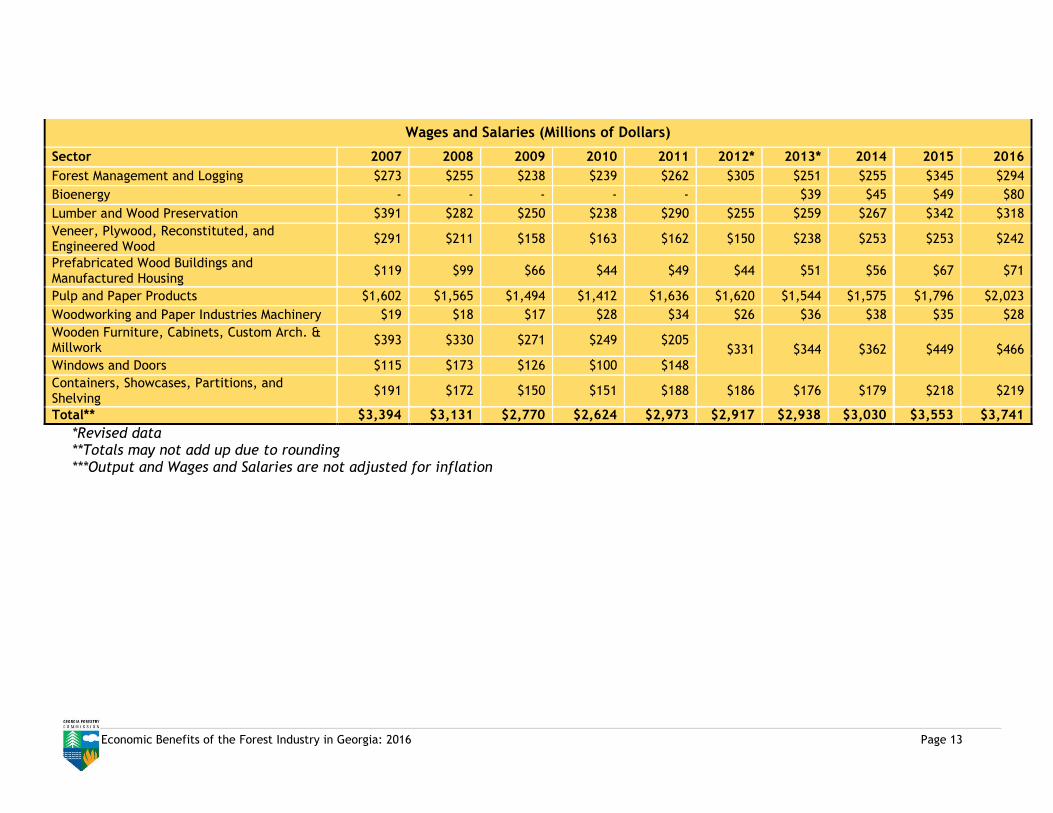
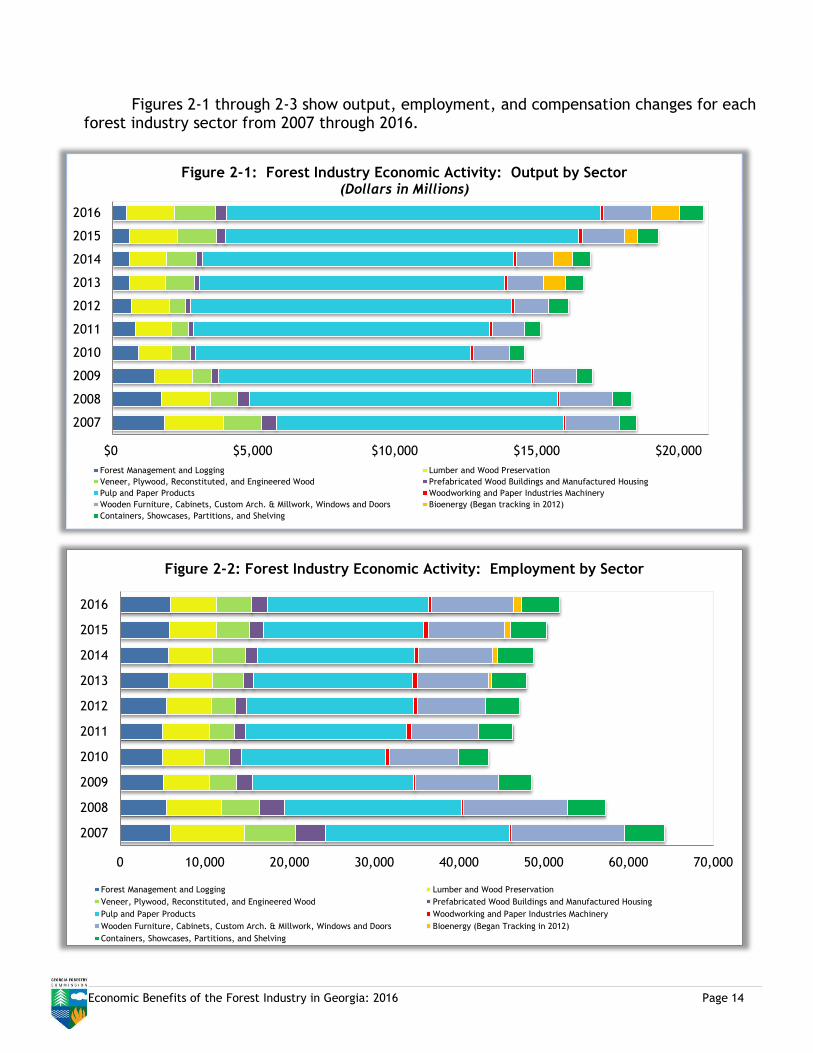
Table 2-3 provides a comparison of the forest industry activity from 2007 through
2016. Three measures are included in the comparison: output, employment, and compensation. Output (an estimate of the firms’ revenues) continued to grow from 2015 to 2016, increasing by 8 percent. However, the increase in activity was not consistent among all sectors. The bioenergy sector showed the highest (percentage) growth. Forest management and logging and woodworking and paper industries machinery sectors reported a decline of 17.5 percent each.
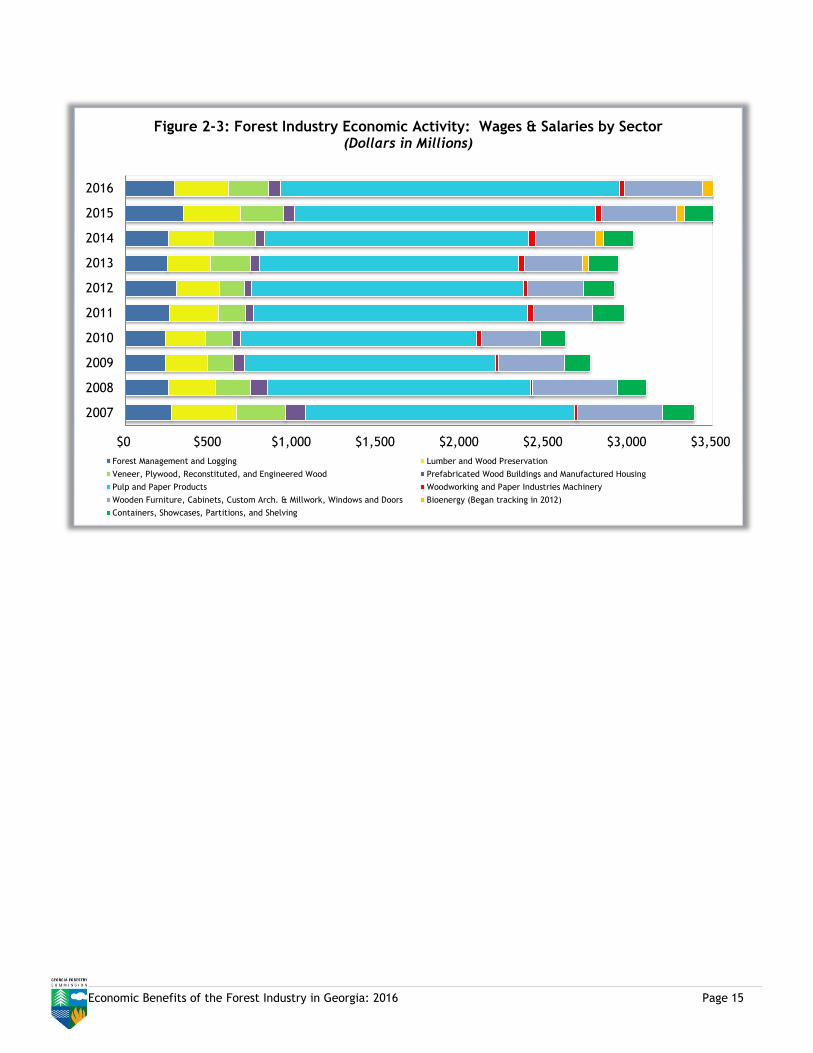
Employment, like output, improved in 2016 with the state’s forest industry reporting an increase of 1,515 jobs, or 3 percent from 2015. The majority of the jobs were in the pulp and paper products sector. The bioenergy sector saw the highest percentage growth.
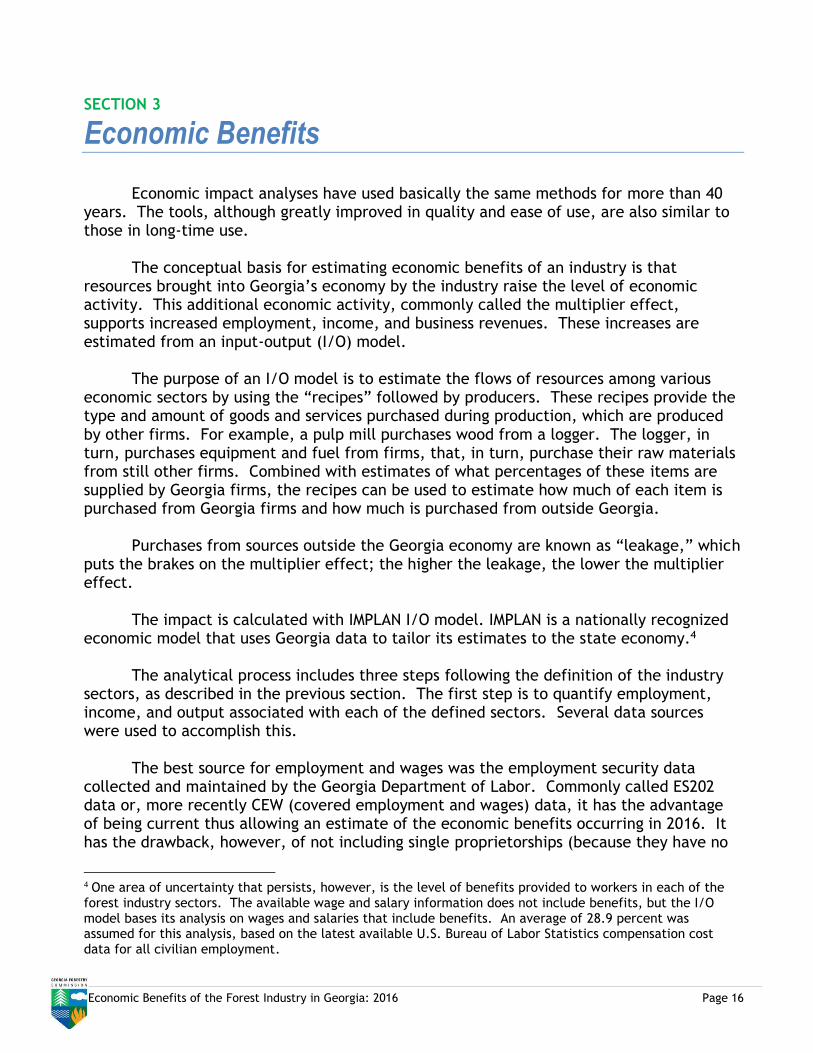
Wages and salaries increased in the majority of the sectors. However, four sectors reported a decrease: the woodworking and paper industries machinery sector (20 percent), forest management and logging sector (15 percent), lumber and wood preservation sector (7 percent) and veneer, plywood, reconstituted, and engineered wood sector (4 percent).
Economic Benefits of the Forest Industry in Georgia: 2016 Page 12
Table 2-3: Forest Industry Activity 2007 - 2016 Comparison
Output (Millions of Dollars)
Sector 2007 2008 2009 2010 2011 2012* 2013* 2014 2015 2016
Forest Management and Logging $1,807 $1,698 $1,454 $902 $805 $662 $580 $582 $605 $499
Bioenergy - - - - - - $782 $688 $439 $981
Lumber and Wood Preservation $2,100 $1,732 $1,359 $1,176 $1,264 $1,332 $1,272 $1,307 $1,674 $1,690
Veneer, Plywood, Reconstituted, and Engineered Wood
$1,322 $961 $664 $667 $590 $583 $1,010 $1,071 $1,362 $1,436
Prefabricated Wood Buildings and Manufactured Housing
$523 $427 $252 $189 $180 $174 $174 $206 $312 $380
Pulp and Paper Products $10,131 $10,856 $11,018 $9,663 $10,426 $11,297 $10,752 $10,936 $12,461 $13,170
Woodworking and Paper Industries Machinery $61 $67 $86 $113 $117 $90 $111 $118 $126 $104
Wooden Furniture, Cabinets, Custom Arch. & Millwork
$1,374 $1,153 $996 $872 $627 $1,224 $1,249 $1,301 $1,494 $1,710
Windows and Doors $517 $721 $497 $390 $494
Containers, Showcases, Partitions, and Shelving
$624 $654 $579 $524 $578 $710 $624 $634 $732 $824
Total** $18,459 $18,270 $16,906 $14,495 $15,082 $16,072 $16,564 $16,843 $19,205 $20,794
Employment Sector 2007 2008 2009 2010 2011 2012* 2013* 2014 2015 2016
Forest Management and Logging 5,914 5,529 5,119 5,050 5,036 5,500 5,714 5,720 5,820 5,920
Bioenergy - - - - - - 300 673 693 916
Lumber and Wood Preservation 8,773 6,477 5,469 4,902 5,538 5,279 5,177 5,242 5,527 5,520
Veneer, Plywood, Reconstituted, and Engineered Wood
6,004 4,448 3,137 3,025 2,916 2,898 3,651 3,848 3,947 4,108
Prefabricated Wood Buildings and Manufactured Housing
3,581 2,983 1,949 1,409 1,365 1,285 1,252 1,376 1,618 1,836
Pulp and Paper Products 21,651 20,816 18,936 16,939 19,012 19,659 18,754 18,538 18,919 18,983
Woodworking and Paper Industries Machinery 304 295 300 473 536 479 506 522 526 422
Wooden Furniture, Cabinets, Custom Arch. & Millwork
10,189 8,235 6,827 5,905 4,724 7,985 8,434 8,676 9,008 9,646
Windows and Doors 3,043 3,967 2,973 2,252 3,156
Containers, Showcases, Partitions, and Shelving
4,733 4,506 3,809 3,470 4,095 4,017 4,135 4,145 4,326 4,549
Total** 64,192 57,812 48,519 43,425 46,378 47,102 47,941 48,740 50,385 51,900
Economic Benefits of the Forest Industry in Georgia: 2016 Page 13
*Revised data **Totals may not add up due to rounding ***Output and Wages and Salaries are not adjusted for inflation
Wages and Salaries (Millions of Dollars)
Sector 2007 2008 2009 2010 2011 2012* 2013* 2014 2015 2016
Forest Management and Logging $273 $255 $238 $239 $262 $305 $251 $255 $345 $294
Bioenergy - - - - - $39 $45 $49 $80
Lumber and Wood Preservation $391 $282 $250 $238 $290 $255 $259 $267 $342 $318
Veneer, Plywood, Reconstituted, and Engineered Wood
$291 $211 $158 $163 $162 $150 $238 $253 $253 $242
Prefabricated Wood Buildings and Manufactured Housing
$119 $99 $66 $44 $49 $44 $51 $56 $67 $71
Pulp and Paper Products $1,602 $1,565 $1,494 $1,412 $1,636 $1,620 $1,544 $1,575 $1,796 $2,023
Woodworking and Paper Industries Machinery $19 $18 $17 $28 $34 $26 $36 $38 $35 $28
Wooden Furniture, Cabinets, Custom Arch. & Millwork
$393 $330 $271 $249 $205 $331 $344 $362 $449 $466
Windows and Doors $115 $173 $126 $100 $148
Containers, Showcases, Partitions, and Shelving
$191 $172 $150 $151 $188 $186 $176 $179 $218 $219
Total** $3,394 $3,131 $2,770 $2,624 $2,973 $2,917 $2,938 $3,030 $3,553 $3,741
Economic Benefits of the Forest Industry in Georgia: 2016 Page 14
Figures 2-1 through 2-3 show output, employment, and compensation changes for each forest industry sector from 2007 through 2016.
$0 $5,000 $10,000 $15,000 $20,000
2007
2008
2009
2010
2011
2012
2013
2014
2015
2016
Figure 2-1: Forest Industry Economic Activity: Output by Sector (Dollars in Millions)
Forest Management and Logging Lumber and Wood Preservation
Veneer, Plywood, Reconstituted, and Engineered Wood Prefabricated Wood Buildings and Manufactured Housing
Pulp and Paper Products Woodworking and Paper Industries Machinery
Wooden Furniture, Cabinets, Custom Arch. & Millwork, Windows and Doors Bioenergy (Began tracking in 2012)
Containers, Showcases, Partitions, and Shelving
0 10,000 20,000 30,000 40,000 50,000 60,000 70,000
2007
2008
2009
2010
2011
2012
2013
2014
2015
2016
Figure 2-2: Forest Industry Economic Activity: Employment by Sector
Forest Management and Logging Lumber and Wood Preservation
Veneer, Plywood, Reconstituted, and Engineered Wood Prefabricated Wood Buildings and Manufactured Housing
Pulp and Paper Products Woodworking and Paper Industries Machinery
Wooden Furniture, Cabinets, Custom Arch. & Millwork, Windows and Doors Bioenergy (Began Tracking in 2012)
Containers, Showcases, Partitions, and Shelving
Economic Benefits of the Forest Industry in Georgia: 2016 Page 15
$0 $500 $1,000 $1,500 $2,000 $2,500 $3,000 $3,500
2007
2008
2009
2010
2011
2012
2013
2014
2015
2016
Figure 2-3: Forest Industry Economic Activity: Wages & Salaries by Sector (Dollars in Millions)
Forest Management and Logging Lumber and Wood Preservation
Veneer, Plywood, Reconstituted, and Engineered Wood Prefabricated Wood Buildings and Manufactured Housing
Pulp and Paper Products Woodworking and Paper Industries Machinery
Wooden Furniture, Cabinets, Custom Arch. & Millwork, Windows and Doors Bioenergy (Began tracking in 2012)
Containers, Showcases, Partitions, and Shelving
Economic Benefits of the Forest Industry in Georgia: 2016 Page 16
SECTION 3
Economic Benefits
Economic impact analyses have used basically the same methods for more than 40 years. The tools, although greatly improved in quality and ease of use, are also similar to those in long-time use.
The conceptual basis for estimating economic benefits of an industry is that resources brought into Georgia’s economy by the industry raise the level of economic activity. This additional economic activity, commonly called the multiplier effect, supports increased employment, income, and business revenues. These increases are estimated from an input-output (I/O) model.
The purpose of an I/O model is to estimate the flows of resources among various economic sectors by using the “recipes” followed by producers. These recipes provide the type and amount of goods and services purchased during production, which are produced by other firms. For example, a pulp mill purchases wood from a logger. The logger, in turn, purchases equipment and fuel from firms, that, in turn, purchase their raw materials from still other firms. Combined with estimates of what percentages of these items are supplied by Georgia firms, the recipes can be used to estimate how much of each item is purchased from Georgia firms and how much is purchased from outside Georgia.
Purchases from sources outside the Georgia economy are known as “leakage,” which puts the brakes on the multiplier effect; the higher the leakage, the lower the multiplier effect.
The impact is calculated with IMPLAN I/O model. IMPLAN is a nationally recognized economic model that uses Georgia data to tailor its estimates to the state economy.4
The analytical process includes three steps following the definition of the industry sectors, as described in the previous section. The first step is to quantify employment, income, and output associated with each of the defined sectors. Several data sources were used to accomplish this.
The best source for employment and wages was the employment security data collected and maintained by the Georgia Department of Labor. Commonly called ES202 data or, more recently CEW (covered employment and wages) data, it has the advantage of being current thus allowing an estimate of the economic benefits occurring in 2016. It has the drawback, however, of not including single proprietorships (because they have no
4 One area of uncertainty that persists, however, is the level of benefits provided to workers in each of the forest industry sectors. The available wage and salary information does not include benefits, but the I/O model bases its analysis on wages and salaries that include benefits. An average of 28.9 percent was assumed for this analysis, based on the latest available U.S. Bureau of Labor Statistics compensation cost data for all civilian employment.
Economic Benefits of the Forest Industry in Georgia: 2016 Page 17
employees), and it also does not include employees not covered by unemployment insurance, such as some governmental employees.
The second task was to divide the forest industry output into two categories; (1) output sold to another Georgia firm and (2) output sold outside the state. Another way to look at this is to recall that the multiplier effect starts from dollars brought into the Georgia economy. Output not sold to another Georgia firm is, by definition, bringing in resources from outside the Georgia economy, and it is these “exports” that fuel the multiplier effect. Forest industry output used as an input to another Georgia forestry-industry firm is already accounted for in the multiplier effect; counting it again would result in double-counting and would imply a level of production from the input-supplying industry higher than actually observed. For example, if the multiplier effect was calculated for the paper industry, it will include some of the activities of Georgia logging operations. If the entire output from logging was then added to the multiplier effect for paper, it would double-count the logging output that went to the paper industry. The I/O model is used iteratively for these estimations, with the resulting estimates called “direct impacts.” Direct impacts are measures of the output from, in this case, forest industries that is exported to entities outside Georgia (these are considered exports even if they only go to Alabama).
The third step was to use the I/O model to estimate total impacts, which were divided into three components. The first is the direct impacts (the value of resources brought into the state); the second is indirect impacts (impacts from recirculation of resources resulting from forest industry purchases from other industries; and the third is induced impacts, which result from activities in the household sector. Adding direct, indirect, and induced impacts yields total impacts.
Three measures of economic impacts are provided. The first, output, is a measure of how much each industry or sector produced in 2016 – roughly equivalent to a measure of sales revenue. The second measure is compensation, including all household income and employee benefits. The third measure is employment, or number of jobs, in each forestry-related industry.
Findings
Table 3-1 provides estimates of direct impacts for each of the forest industry sectors contained in the industry’s definition. These differ from the level of economic activity shown in Tables 2-2 and 2-3 because Table 3-1 eliminates production consumed by another sector. This eliminates the double counting of production in the multiplier effect of the consuming-industry sector. For example, Table 3-1 does not contain much output from the forest management and logging industry segment because most of it appears to be consumed by the various Georgia wood-using industries such as paper and lumber. Logging operations are included primarily as part of the multiplier effect by these consuming industries, not as a direct impact separate from them.
Economic Benefits of the Forest Industry in Georgia: 2016 Page 18
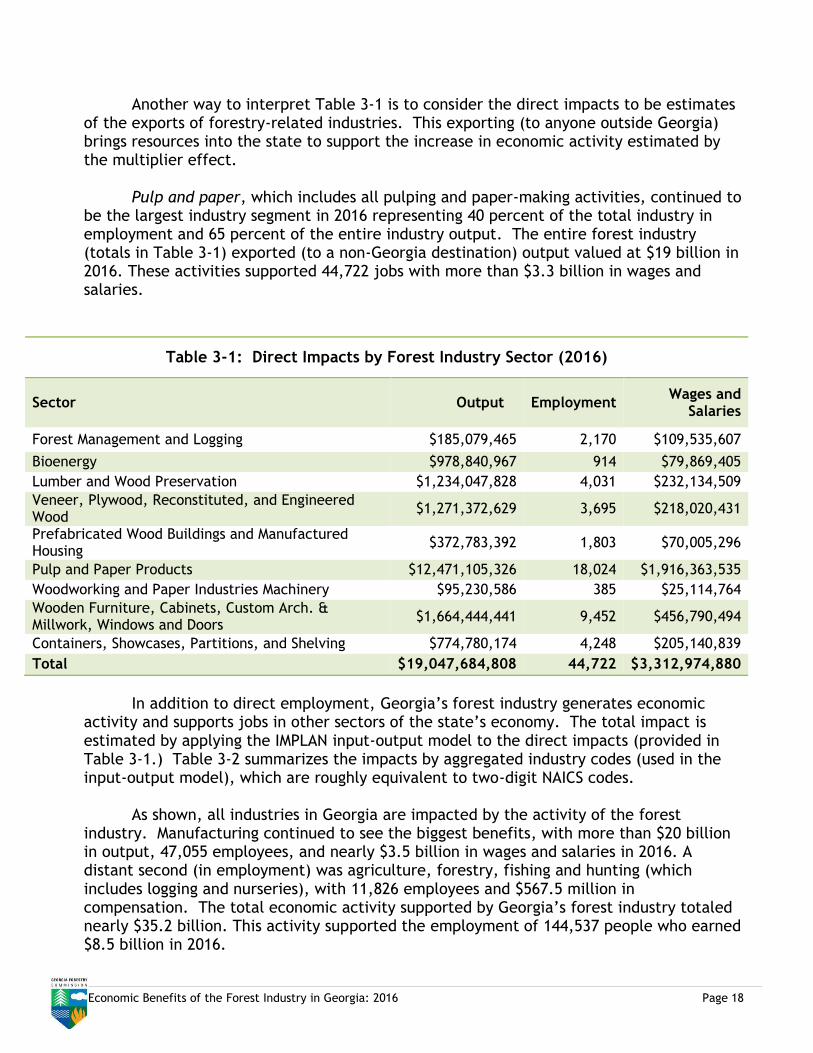
Another way to interpret Table 3-1 is to consider the direct impacts to be estimates of the exports of forestry-related industries. This exporting (to anyone outside Georgia) brings resources into the state to support the increase in economic activity estimated by the multiplier effect.
Pulp and paper, which includes all pulping and paper-making activities, continued to be the largest industry segment in 2016 representing 40 percent of the total industry in employment and 65 percent of the entire industry output. The entire forest industry (totals in Table 3-1) exported (to a non-Georgia destination) output valued at $19 billion in 2016. These activities supported 44,722 jobs with more than $3.3 billion in wages and salaries.
Table 3-1: Direct Impacts by Forest Industry Sector (2016)
Sector Output Employment Wages and
Salaries
Forest Management and Logging $185,079,465 2,170 $109,535,607
Bioenergy $978,840,967 914 $79,869,405
Lumber and Wood Preservation $1,234,047,828 4,031 $232,134,509
Veneer, Plywood, Reconstituted, and Engineered Wood
$1,271,372,629 3,695 $218,020,431
Prefabricated Wood Buildings and Manufactured Housing
$372,783,392 1,803 $70,005,296
Pulp and Paper Products $12,471,105,326 18,024 $1,916,363,535
Woodworking and Paper Industries Machinery $95,230,586 385 $25,114,764
Wooden Furniture, Cabinets, Custom Arch. & Millwork, Windows and Doors
$1,664,444,441 9,452 $456,790,494
Containers, Showcases, Partitions, and Shelving $774,780,174 4,248 $205,140,839
Total $19,047,684,808 44,722 $3,312,974,880
In addition to direct employment, Georgia’s forest industry generates economic
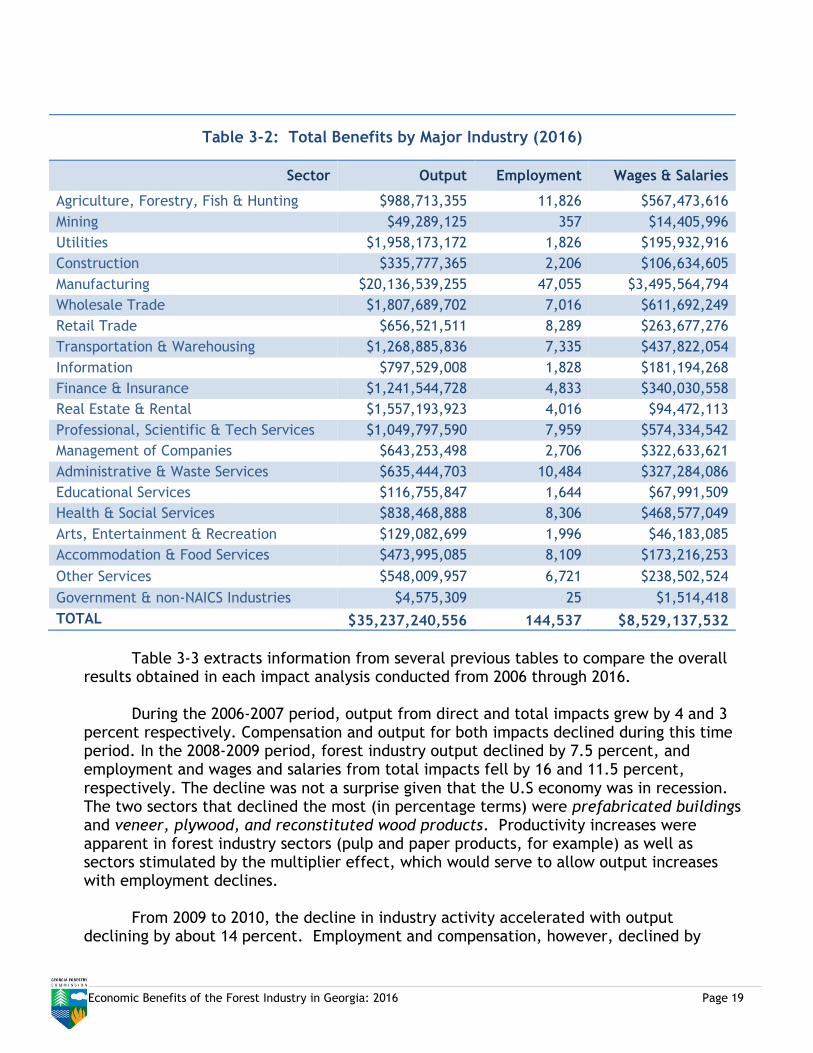
activity and supports jobs in other sectors of the state’s economy. The total impact is estimated by applying the IMPLAN input-output model to the direct impacts (provided in Table 3-1.) Table 3-2 summarizes the impacts by aggregated industry codes (used in the input-output model), which are roughly equivalent to two-digit NAICS codes.
As shown, all industries in Georgia are impacted by the activity of the forest industry. Manufacturing continued to see the biggest benefits, with more than $20 billion in output, 47,055 employees, and nearly $3.5 billion in wages and salaries in 2016. A distant second (in employment) was agriculture, forestry, fishing and hunting (which includes logging and nurseries), with 11,826 employees and $567.5 million in compensation. The total economic activity supported by Georgia’s forest industry totaled nearly $35.2 billion. This activity supported the employment of 144,537 people who earned $8.5 billion in 2016.
Economic Benefits of the Forest Industry in Georgia: 2016 Page 19
Table 3-2: Total Benefits by Major Industry (2016)
Sector Output Employment Wages & Salaries
Agriculture, Forestry, Fish & Hunting $988,713,355 11,826 $567,473,616
Mining $49,289,125 357 $14,405,996
Utilities $1,958,173,172 1,826 $195,932,916
Construction $335,777,365 2,206 $106,634,605
Manufacturing $20,136,539,255 47,055 $3,495,564,794
Wholesale Trade $1,807,689,702 7,016 $611,692,249
Retail Trade $656,521,511 8,289 $263,677,276
Transportation & Warehousing $1,268,885,836 7,335 $437,822,054
Information $797,529,008 1,828 $181,194,268
Finance & Insurance $1,241,544,728 4,833 $340,030,558
Real Estate & Rental $1,557,193,923 4,016 $94,472,113
Professional, Scientific & Tech Services $1,049,797,590 7,959 $574,334,542
Management of Companies $643,253,498 2,706 $322,633,621
Administrative & Waste Services $635,444,703 10,484 $327,284,086
Educational Services $116,755,847 1,644 $67,991,509
Health & Social Services $838,468,888 8,306 $468,577,049
Arts, Entertainment & Recreation $129,082,699 1,996 $46,183,085
Accommodation & Food Services $473,995,085 8,109 $173,216,253
Other Services $548,009,957 6,721 $238,502,524
Government & non-NAICS Industries $4,575,309 25 $1,514,418
TOTAL $35,237,240,556 144,537 $8,529,137,532
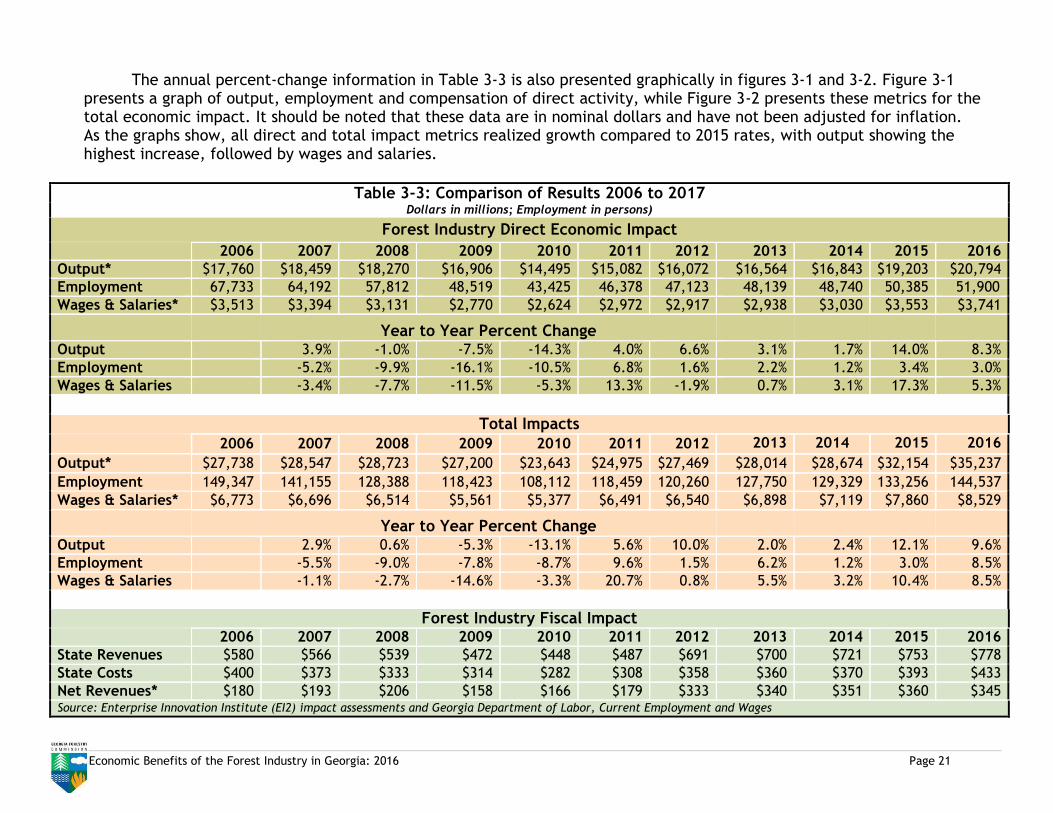
Table 3-3 extracts information from several previous tables to compare the overall
results obtained in each impact analysis conducted from 2006 through 2016.
During the 2006-2007 period, output from direct and total impacts grew by 4 and 3 percent respectively. Compensation and output for both impacts declined during this time period. In the 2008-2009 period, forest industry output declined by 7.5 percent, and employment and wages and salaries from total impacts fell by 16 and 11.5 percent, respectively. The decline was not a surprise given that the U.S economy was in recession. The two sectors that declined the most (in percentage terms) were prefabricated buildings and veneer, plywood, and reconstituted wood products. Productivity increases were apparent in forest industry sectors (pulp and paper products, for example) as well as sectors stimulated by the multiplier effect, which would serve to allow output increases with employment declines.
From 2009 to 2010, the decline in industry activity accelerated with output declining by about 14 percent. Employment and compensation, however, declined by
Economic Benefits of the Forest Industry in Georgia: 2016 Page 20
smaller percentages, compared to the previous year, with declines of almost 11 percent and 5 percent, respectively. Total impacts did not decline as much in percentage terms in all parameters, probably because compensation declined the least, and induced impacts almost always depend on income. In the fiscal impact analysis, both revenues and costs declined, but because the cost decline was slightly larger than the revenue decline, net revenues actually increased slightly.
The forest industry’s activity picked up pace in 2011, showing growth after three years of continuous decline. Output increased by 4 percent, nearly the same growth rate as in the 2006-2007 period. Employment and compensation also showed improvement, with 7 percent and 13 percent growth rates, respectively. These improvements were also reflected in total impacts which showed higher growth in percentage terms than direct impact. In the 2010 to 2011 period output increased by nearly 6 percent, employment increased by nearly 10 percent, and wages and salaries increased by an impressive 21 percent.
The trend of positive growth continued in the 2011-2012 period. Output increased
by nearly 7 percent, employment increased by 2 percent. However, compensation showed a slight decline. During the 2012-2013 period and 2013-2014 period, the direct and total economic impacts of the forest industry showed positive growth.
In 2014-2015 period, the forest industry showed solid growth. Direct and total
output impacts showed the highest in percent, 14 and 12 percent respectively. Compensation grew by 17 percent for direct impact and 10 percent for total impacts. Employment also showed positive growth, albeit at lower levels – 3 percent for both direct and total impacts.
All measures show growth from 2015 to 2016. The highest growth rates occurred in
industry output, which grew 8 percent for the direct and 10 percent for the total forest industry activity. During this period, compensation for the direct forest industry activity increased at 5 percent for direct impacts and 8.5 percent for total impacts. Employment from direct impacts increased by 3 percent, while employment from total impacts increased by 8.5 percent.
Economic Benefits of the Forest Industry in Georgia: 2016 Page 21
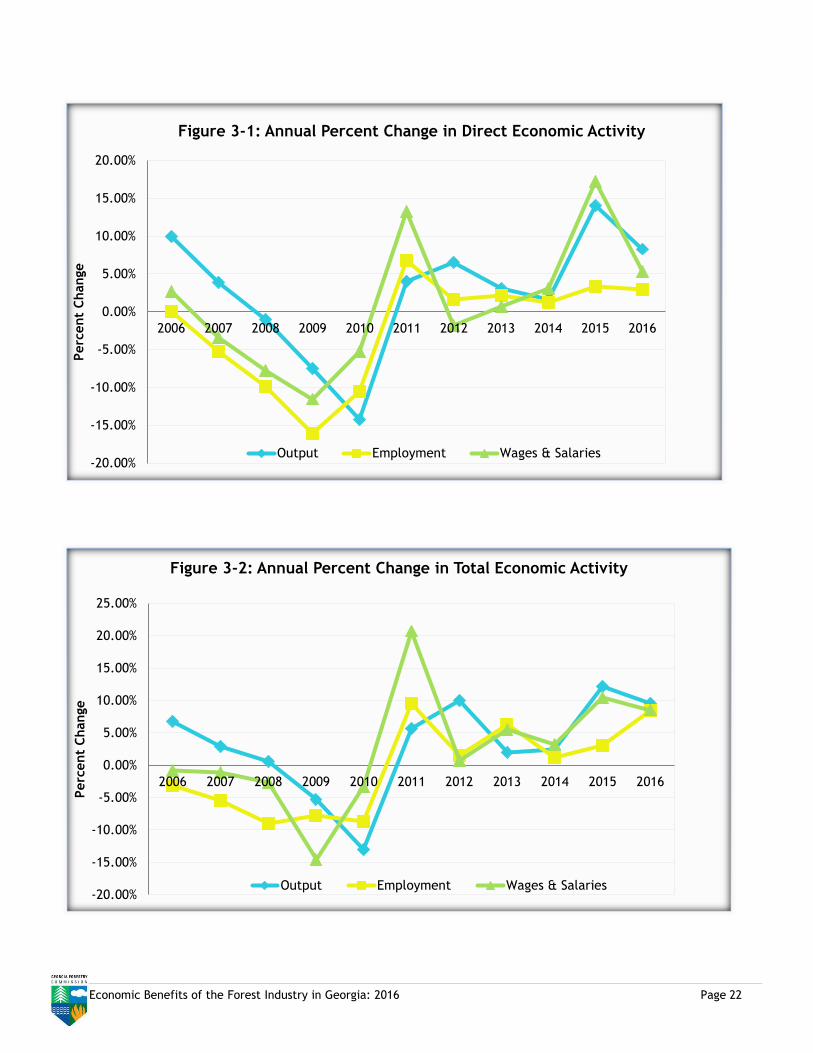
The annual percent-change information in Table 3-3 is also presented graphically in figures 3-1 and 3-2. Figure 3-1 presents a graph of output, employment and compensation of direct activity, while Figure 3-2 presents these metrics for the total economic impact. It should be noted that these data are in nominal dollars and have not been adjusted for inflation. As the graphs show, all direct and total impact metrics realized growth compared to 2015 rates, with output showing the highest increase, followed by wages and salaries.
Table 3-3: Comparison of Results 2006 to 2017 Dollars in millions; Employment in persons)
Forest Industry Direct Economic Impact
2006 2007 2008 2009 2010 2011 2012 2013 2014 2015 2016
Output* $17,760 $18,459 $18,270 $16,906 $14,495 $15,082 $16,072 $16,564 $16,843 $19,203 $20,794
Employment 67,733 64,192 57,812 48,519 43,425 46,378 47,123 48,139 48,740 50,385 51,900
Wages & Salaries* $3,513 $3,394 $3,131 $2,770 $2,624 $2,972 $2,917 $2,938 $3,030 $3,553 $3,741
Year to Year Percent Change
Output 3.9% -1.0% -7.5% -14.3% 4.0% 6.6% 3.1% 1.7% 14.0% 8.3%
Employment -5.2% -9.9% -16.1% -10.5% 6.8% 1.6% 2.2% 1.2% 3.4% 3.0%
Wages & Salaries -3.4% -7.7% -11.5% -5.3% 13.3% -1.9% 0.7% 3.1% 17.3% 5.3%
Total Impacts
2006 2007 2008 2009 2010 2011 2012 2013 2014 2015 2016
Output* $27,738 $28,547 $28,723 $27,200 $23,643 $24,975 $27,469 $28,014 $28,674 $32,154 $35,237
Employment 149,347 141,155 128,388 118,423 108,112 118,459 120,260 127,750 129,329 133,256 144,537
Wages & Salaries* $6,773 $6,696 $6,514 $5,561 $5,377 $6,491 $6,540 $6,898 $7,119 $7,860 $8,529
Year to Year Percent Change
Output 2.9% 0.6% -5.3% -13.1% 5.6% 10.0% 2.0% 2.4% 12.1% 9.6%
Employment -5.5% -9.0% -7.8% -8.7% 9.6% 1.5% 6.2% 1.2% 3.0% 8.5%
Wages & Salaries -1.1% -2.7% -14.6% -3.3% 20.7% 0.8% 5.5% 3.2% 10.4% 8.5%
Forest Industry Fiscal Impact 2006 2007 2008 2009 2010 2011 2012 2013 2014 2015 2016
State Revenues $580 $566 $539 $472 $448 $487 $691 $700 $721 $753 $778
State Costs $400 $373 $333 $314 $282 $308 $358 $360 $370 $393 $433
Net Revenues* $180 $193 $206 $158 $166 $179 $333 $340 $351 $360 $345 Source: Enterprise Innovation Institute (EI2) impact assessments and Georgia Department of Labor, Current Employment and Wages
Economic Benefits of the Forest Industry in Georgia: 2016 Page 22
-20.00%
-15.00%
-10.00%
-5.00%
0.00%
5.00%
10.00%
15.00%
20.00%
2006 2007 2008 2009 2010 2011 2012 2013 2014 2015 2016
Perc
ent
Change
Figure 3-1: Annual Percent Change in Direct Economic Activity
Output Employment Wages & Salaries
-20.00%
-15.00%
-10.00%
-5.00%
0.00%
5.00%
10.00%
15.00%
20.00%
25.00%
2006 2007 2008 2009 2010 2011 2012 2013 2014 2015 2016
Perc
ent
Change
Figure 3-2: Annual Percent Change in Total Economic Activity
Output Employment Wages & Salaries
Economic Benefits of the Forest Industry in Georgia: 2016 Page 23
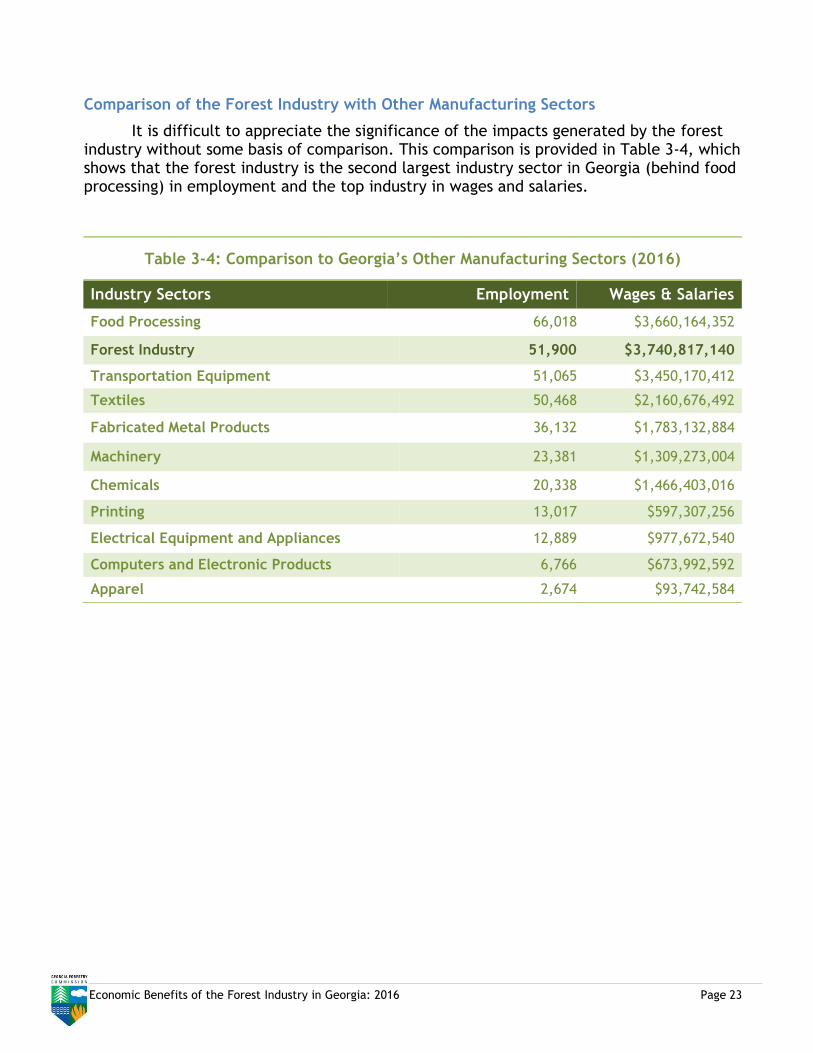
Comparison of the Forest Industry with Other Manufacturing Sectors
It is difficult to appreciate the significance of the impacts generated by the forest industry without some basis of comparison. This comparison is provided in Table 3-4, which shows that the forest industry is the second largest industry sector in Georgia (behind food processing) in employment and the top industry in wages and salaries.
Table 3-4: Comparison to Georgia’s Other Manufacturing Sectors (2016)
Industry Sectors Employment Wages & Salaries
Food Processing 66,018 $3,660,164,352
Forest Industry 51,900 $3,740,817,140
Transportation Equipment 51,065 $3,450,170,412
Textiles 50,468 $2,160,676,492
Fabricated Metal Products 36,132 $1,783,132,884
Machinery 23,381 $1,309,273,004
Chemicals 20,338 $1,466,403,016
Printing 13,017 $597,307,256
Electrical Equipment and Appliances 12,889 $977,672,540
Computers and Electronic Products 6,766 $673,992,592
Apparel 2,674 $93,742,584
Economic Benefits of the Forest Industry in Georgia: 2016 Page 24
SECTION 4
Economic Impact of Urban and Community Forestry
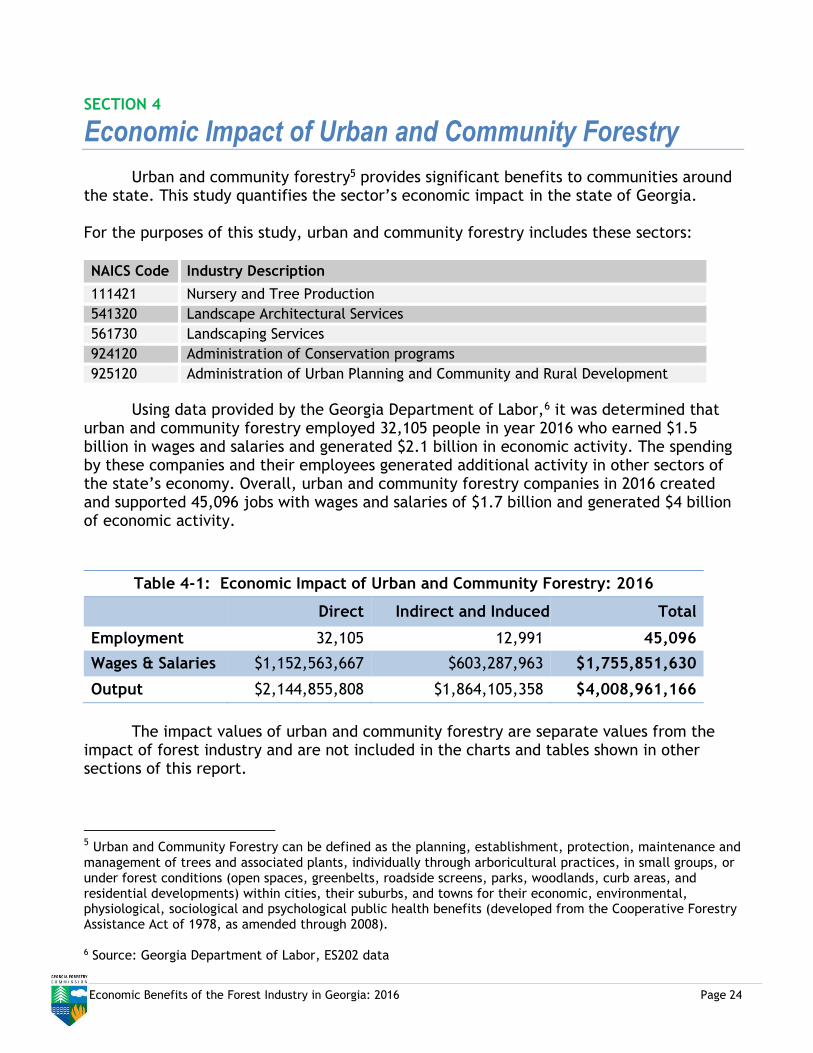
Urban and community forestry5 provides significant benefits to communities around the state. This study quantifies the sector’s economic impact in the state of Georgia. For the purposes of this study, urban and community forestry includes these sectors:
NAICS Code Industry Description
111421 Nursery and Tree Production
541320 Landscape Architectural Services
561730 Landscaping Services
924120 Administration of Conservation programs
925120 Administration of Urban Planning and Community and Rural Development
Using data provided by the Georgia Department of Labor,6 it was determined that urban and community forestry employed 32,105 people in year 2016 who earned $1.5 billion in wages and salaries and generated $2.1 billion in economic activity. The spending by these companies and their employees generated additional activity in other sectors of the state’s economy. Overall, urban and community forestry companies in 2016 created and supported 45,096 jobs with wages and salaries of $1.7 billion and generated $4 billion of economic activity.
Table 4-1: Economic Impact of Urban and Community Forestry: 2016
Direct Indirect and Induced Total
Employment 32,105 12,991 45,096
Wages & Salaries $1,152,563,667 $603,287,963 $1,755,851,630
Output $2,144,855,808 $1,864,105,358 $4,008,961,166
The impact values of urban and community forestry are separate values from the
impact of forest industry and are not included in the charts and tables shown in other sections of this report.
5 Urban and Community Forestry can be defined as the planning, establishment, protection, maintenance and
management of trees and associated plants, individually through arboricultural practices, in small groups, or under forest conditions (open spaces, greenbelts, roadside screens, parks, woodlands, curb areas, and residential developments) within cities, their suburbs, and towns for their economic, environmental, physiological, sociological and psychological public health benefits (developed from the Cooperative Forestry Assistance Act of 1978, as amended through 2008). 6 Source: Georgia Department of Labor, ES202 data
Economic Benefits of the Forest Industry in Georgia: 2016 Page 25
SECTION 5
Economic Impact by Regional Commission
Regional Economies
Economies are interwoven in a complex web. In general, however, a local economy’s economic health depends on the inflow and outflow of resources. Economic base theory calls economic sectors responsible for bringing resources in “basic” or “traded” sectors. The resources that are brought in are then (at least partially) recirculated within the local economy to support the “non-basic” sectors. For example, a sawmill will generally sell its products to builders or lumber supply houses outside the local economy. The revenue it receives from these sales is then used to purchase logs from, perhaps, a local logging firm. It also pays its employees who spend their wages in local restaurants, grocery stores, and the like. As the basic sector grows or declines, so does the non-basic sector.
Forest industry components are very much part of Georgia’s basic industry sector, with products sold worldwide. As such, it is one of the key sources of funds flowing into many local Georgia economies. Where the local economy has many sources of such flows, the growth or decline of any specific sector, such as forestry, may not have significant effects. However, in those communities where forestry is a large proportion of the local basic industry, all economic support activities, such as retail, are likewise generally dependent. Approach
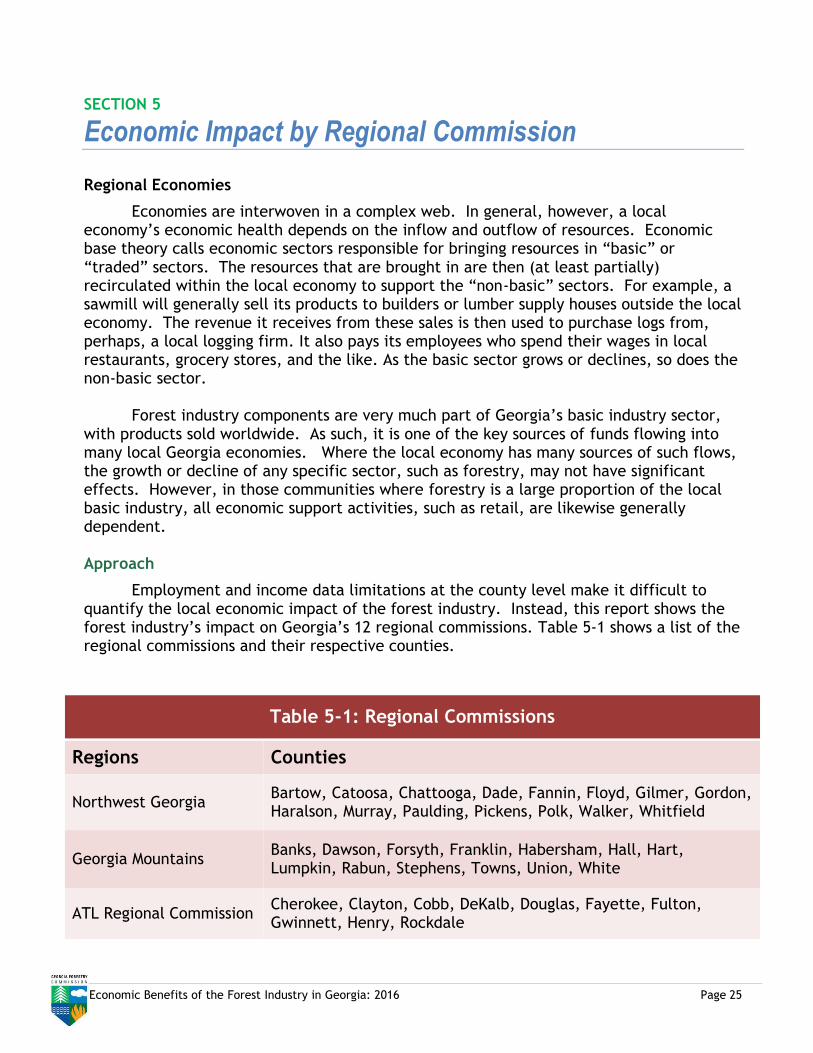
Employment and income data limitations at the county level make it difficult to quantify the local economic impact of the forest industry. Instead, this report shows the forest industry’s impact on Georgia’s 12 regional commissions. Table 5-1 shows a list of the regional commissions and their respective counties.
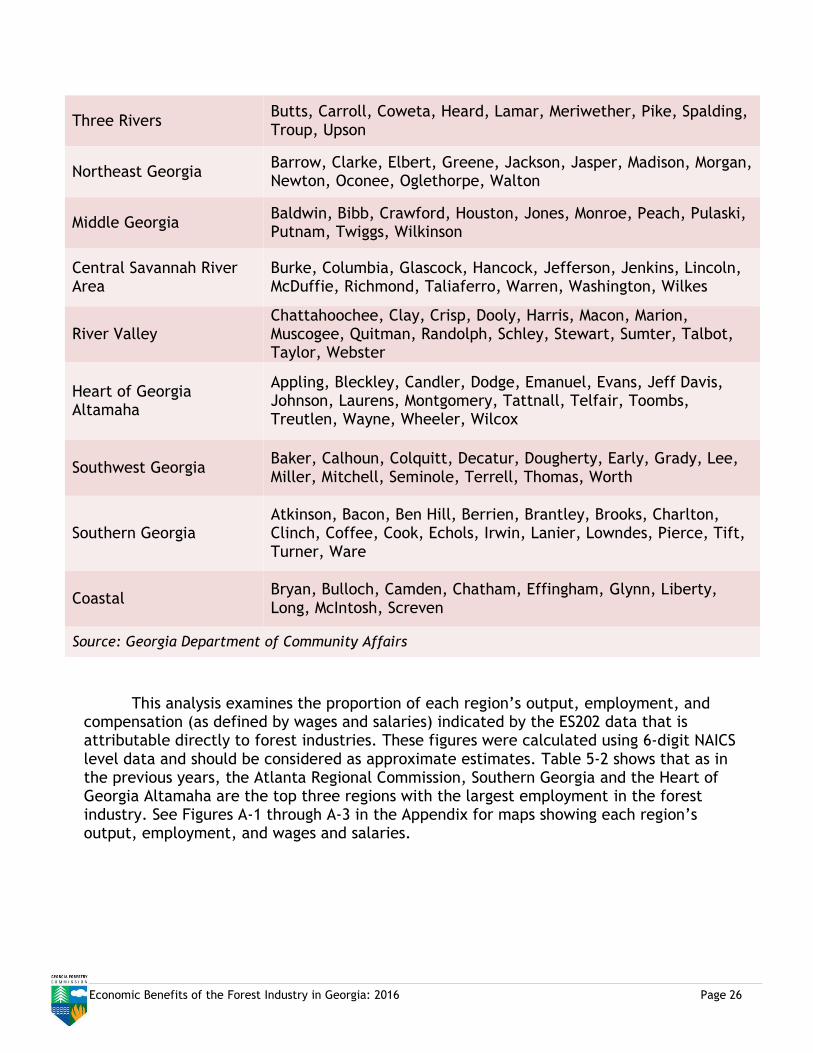
Table 5-1: Regional Commissions
Regions Counties
Northwest Georgia Bartow, Catoosa, Chattooga, Dade, Fannin, Floyd, Gilmer, Gordon, Haralson, Murray, Paulding, Pickens, Polk, Walker, Whitfield
Georgia Mountains Banks, Dawson, Forsyth, Franklin, Habersham, Hall, Hart, Lumpkin, Rabun, Stephens, Towns, Union, White
ATL Regional Commission Cherokee, Clayton, Cobb, DeKalb, Douglas, Fayette, Fulton, Gwinnett, Henry, Rockdale
Economic Benefits of the Forest Industry in Georgia: 2016 Page 26
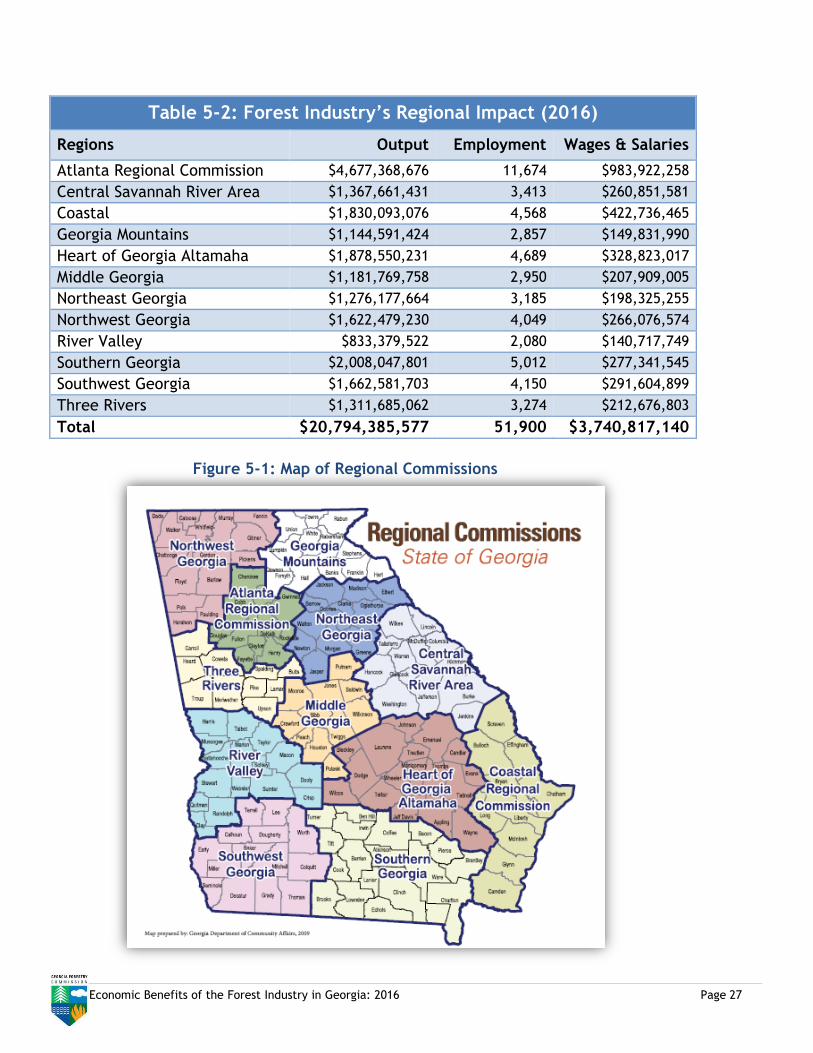
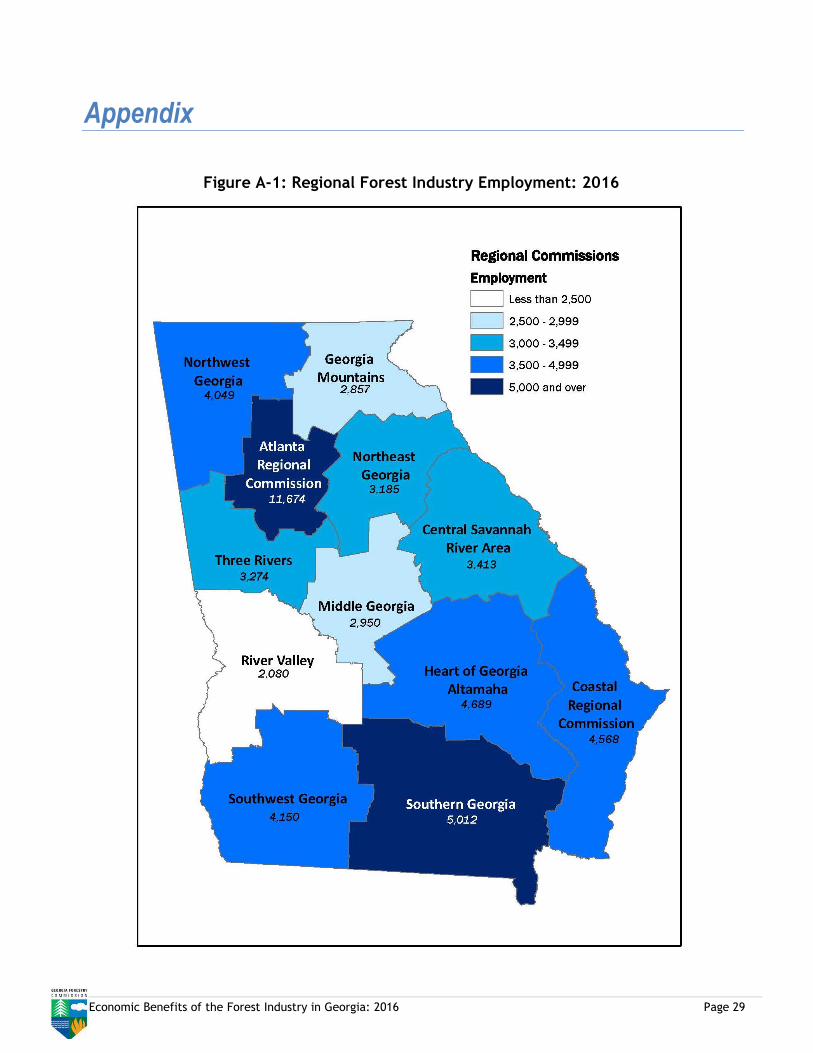
This analysis examines the proportion of each region’s output, employment, and compensation (as defined by wages and salaries) indicated by the ES202 data that is attributable directly to forest industries. These figures were calculated using 6-digit NAICS level data and should be considered as approximate estimates. Table 5-2 shows that as in the previous years, the Atlanta Regional Commission, Southern Georgia and the Heart of Georgia Altamaha are the top three regions with the largest employment in the forest industry. See Figures A-1 through A-3 in the Appendix for maps showing each region’s output, employment, and wages and salaries.
Three Rivers Butts, Carroll, Coweta, Heard, Lamar, Meriwether, Pike, Spalding, Troup, Upson
Northeast Georgia Barrow, Clarke, Elbert, Greene, Jackson, Jasper, Madison, Morgan, Newton, Oconee, Oglethorpe, Walton
Middle Georgia Baldwin, Bibb, Crawford, Houston, Jones, Monroe, Peach, Pulaski, Putnam, Twiggs, Wilkinson
Central Savannah River Area
Burke, Columbia, Glascock, Hancock, Jefferson, Jenkins, Lincoln, McDuffie, Richmond, Taliaferro, Warren, Washington, Wilkes
River Valley Chattahoochee, Clay, Crisp, Dooly, Harris, Macon, Marion, Muscogee, Quitman, Randolph, Schley, Stewart, Sumter, Talbot, Taylor, Webster
Heart of Georgia Altamaha
Appling, Bleckley, Candler, Dodge, Emanuel, Evans, Jeff Davis, Johnson, Laurens, Montgomery, Tattnall, Telfair, Toombs, Treutlen, Wayne, Wheeler, Wilcox
Southwest Georgia Baker, Calhoun, Colquitt, Decatur, Dougherty, Early, Grady, Lee, Miller, Mitchell, Seminole, Terrell, Thomas, Worth
Southern Georgia Atkinson, Bacon, Ben Hill, Berrien, Brantley, Brooks, Charlton, Clinch, Coffee, Cook, Echols, Irwin, Lanier, Lowndes, Pierce, Tift, Turner, Ware
Coastal Bryan, Bulloch, Camden, Chatham, Effingham, Glynn, Liberty, Long, McIntosh, Screven
Source: Georgia Department of Community Affairs
Economic Benefits of the Forest Industry in Georgia: 2016 Page 27
Table 5-2: Forest Industry’s Regional Impact (2016)
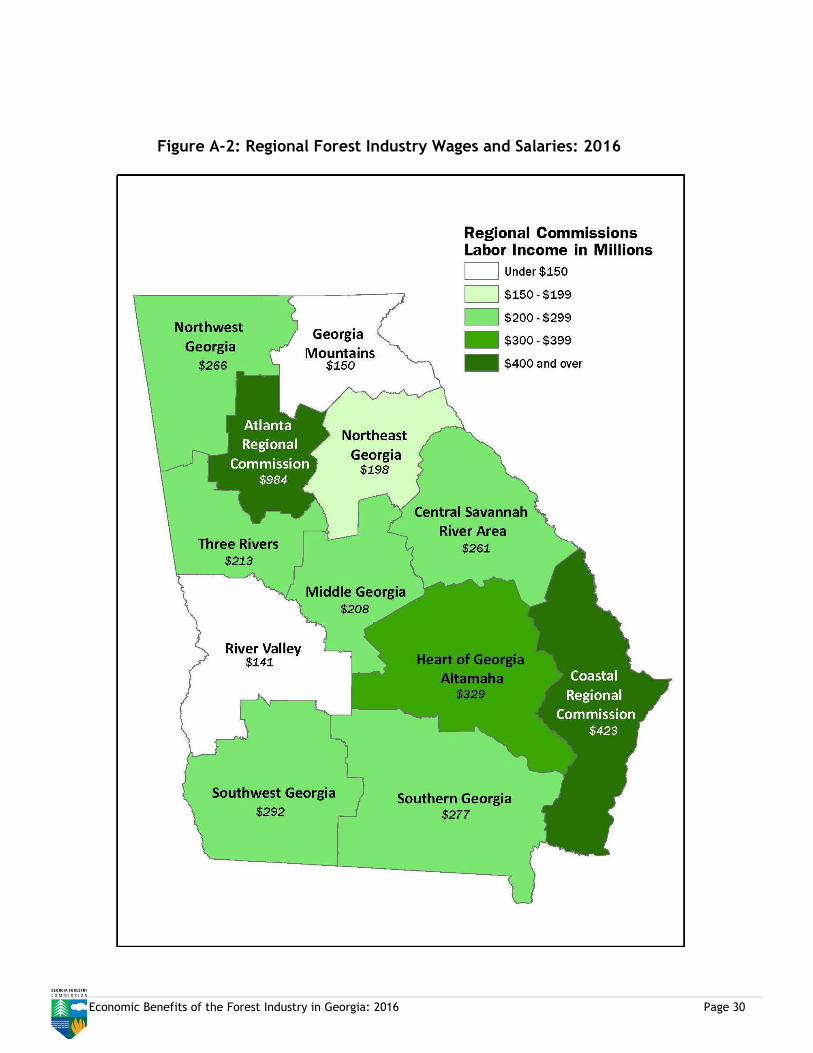
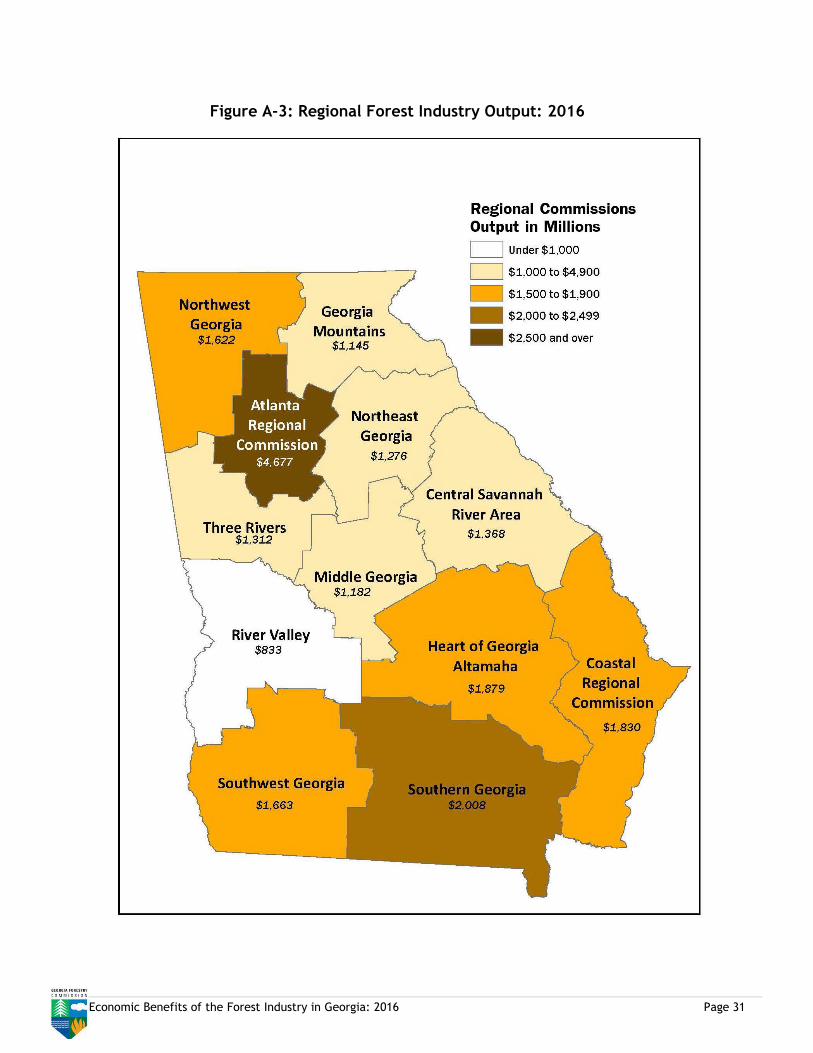
Regions Output Employment Wages & Salaries
Atlanta Regional Commission $4,677,368,676 11,674 $983,922,258
Central Savannah River Area $1,367,661,431 3,413 $260,851,581
Coastal $1,830,093,076 4,568 $422,736,465
Georgia Mountains $1,144,591,424 2,857 $149,831,990
Heart of Georgia Altamaha $1,878,550,231 4,689 $328,823,017
Middle Georgia $1,181,769,758 2,950 $207,909,005
Northeast Georgia $1,276,177,664 3,185 $198,325,255
Northwest Georgia $1,622,479,230 4,049 $266,076,574
River Valley $833,379,522 2,080 $140,717,749
Southern Georgia $2,008,047,801 5,012 $277,341,545
Southwest Georgia $1,662,581,703 4,150 $291,604,899
Three Rivers $1,311,685,062 3,274 $212,676,803
Total $20,794,385,577 51,900 $3,740,817,140
Figure 5-1: Map of Regional Commissions
Economic Benefits of the Forest Industry in Georgia: 2016 Page 28
References Bureau of Economic Analysis Input-Output Sectors as contained in “IMPLAN Pro: Data Guide,” IMPLAN Group, Inc.,2016. Georgia Department of Labor, ES202 Wage and Employment Data: 2016. North American Industrial Classification System (NAICS): http://www.census.gov/epcd/www/naicstab.htm U.S. Department of Labor, Bureau of Labor Statistics, “Employer Costs for Employee Compensation,” http://data.bls.gov/cgi-bin/surveymost
Economic Benefits of the Forest Industry in Georgia: 2016 Page 29
Appendix
Figure A-1: Regional Forest Industry Employment: 2016
Economic Benefits of the Forest Industry in Georgia: 2016 Page 30
Figure A-2: Regional Forest Industry Wages and Salaries: 2016
Economic Benefits of the Forest Industry in Georgia: 2016 Page 31
Figure A-3: Regional Forest Industry Output: 2016