Embed Size (px)
Citation preview
2010 Montana State Rail Plan
Cambridge Systematics, Inc. ES-1
Executive Summary
The 2010 Montana State Rail Plan describes historical and forecasted freight trends, provides operating and system characteristics of the State’s freight rail system, and summarizes ongoing efforts to expand and secure funding for addi-tional passenger rail service through the State. The Plan also describes the impact of grain facility consolidation; identifies potential rail funding programs to acquire, improve, establish, or rehabilitate intermodal rail equipment or facili-ties; and lists several other ongoing issues affecting rail service in Montana, such as rail competition and growing freight volumes. The following sections sum-marize the key topics in each chapter of the 2010 Montana State Rail Plan.
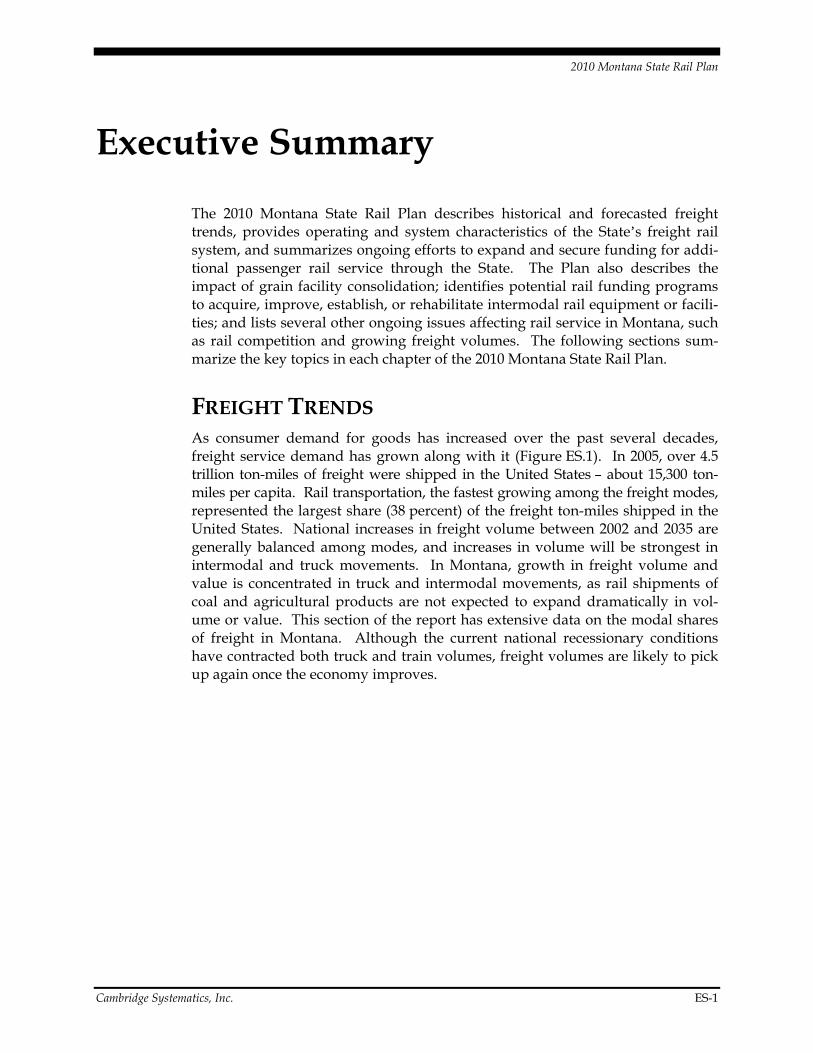
FREIGHT TRENDS As consumer demand for goods has increased over the past several decades, freight service demand has grown along with it (Figure ES.1). In 2005, over 4.5 trillion ton-miles of freight were shipped in the United States – about 15,300 ton-miles per capita. Rail transportation, the fastest growing among the freight modes, represented the largest share (38 percent) of the freight ton-miles shipped in the United States. National increases in freight volume between 2002 and 2035 are generally balanced among modes, and increases in volume will be strongest in intermodal and truck movements. In Montana, growth in freight volume and value is concentrated in truck and intermodal movements, as rail shipments of coal and agricultural products are not expected to expand dramatically in vol-ume or value. This section of the report has extensive data on the modal shares of freight in Montana. Although the current national recessionary conditions have contracted both truck and train volumes, freight volumes are likely to pick up again once the economy improves.
2010 Montana State Rail Plan
ES-2 Cambridge Systematics, Inc.
Figure ES.1 U.S. Combination Truck Vehicle-Miles and Train-Miles
By 2035, total freight tonnage in Montana is projected to increase by 101 percent to 216.8 million tons. In both 2002 and 2035, truck shipments account for the largest share of within-state tonnage, with rail transport a distant second. The majority of freight shipped to Montana is similarly split between truck and rail. However, rail dominates from-state tonnage and is expected to account for 81 percent of exports from the State in 2035. This reflects the fact that rail is the preferred mode for transporting basic bulk commodities produced by Montana’s mining and agricultural industries.
Montana is situated on a trade corridor that links the midwestern and northwestern port markets. As a result, there is significant demand for through-bound rail service. Table ES.1 shows that almost three quarters of all rail freight by revenue passes through the State, hauling high-value interurban shipments and bulk commodity shipments originating elsewhere. Shipments originating from Montana account for most of the remainder (22 percent by revenue). Rail trips terminating in Montana (3 percent by revenue) and those completely con-tained within the State (1 percent by revenue) make up smaller shares of the total, reflecting the State’s relatively low population and status as a net exporter of goods shipped by rail. Most higher-value (i.e., finished) goods produced and consumed in the State rely on truck traffic.
0
100
200
300
400
500
600
0
20,000
40,000
60,000
80,000
100,000
120,000
140,000
160,000
1960
1965
1970
1975
1980
1985
1990
1991
1992
1993
1994
1995
1996
1997
1998
1999
2000
2001
2002
2003
2004
2005
Combination Truck (Left Axis) Class I Freight Train (Right Axis)

2010 Montana State Rail Plan
Cambridge Systematics, Inc. ES-3
Table ES.1 Summary of Rail Freight Tonnage and Revenue by Trip Type
Trip Type Tonnage (Millions) Revenue (Millions Dollars)
Through Trips 56.4 $2,673.9
Originated Trips 42.0 $800.4
Terminated Trips 2.8 $94.5
Intrastate Trips 2.1 $20.4
Total 103.4 $3,589.0
Source: Cambridge Systematics analysis of STB waybill sample data.
Measuring in tonnage alters the picture slightly, primarily because of the high amount of bulk commodities shipped by rail from Montana, such as coal, miner-als, metallic ores, and cereal grains. Through trips account for 54 percent of the total tonnage, while 41 percent originates in the State. This section of the report describes in greater detail the rail traffic originating and terminating in Montana and traffic moving through the State.
Of rail shipments originating in Montana, coal accounts for 71 percent of the ton-nage, followed by farm products (15 percent), petroleum or coal products (5 per-cent), with all other commodities less than 10 percent of tonnage. Coal accounts for 48 percent of the value of rail shipments originating in Montana, followed by farm products (24 percent), petroleum and coal products (10 percent), lumber and wood products (10 percent) and all other commodities less than 8 percent. This difference in volume and value indicates that farm products (particularly wheat) are a high-value product for Montana rail shippers. The top states receiving rail traffic are Minnesota, Wisconsin, Washington, and Oregon. Three of these states have export ports that distribute Montana products.
Of rail traffic moving through Montana (the majority of shipments moving in the State), intermodal/miscellaneous mixed shipments and farm products comprise the two highest value commodities (each are 25 percent of total value), followed by lumber/wood products. In terms of tons, farm products are the largest com-modity (37 percent of volume), followed by intermodal/miscellaneous mixed shipments (19 percent), lumber/wood products (9 percent). The Pacific Basin ports in Washington and Oregon are the prime origins or destinations for through rail traffic by value, including Washington-Illinois (both ways), Minnesota to Washington and South Dakota to Washington. The largest state pairs by tons are Minnesota to Washington and South Dakota to Washington. Data indicates that other movements (almost 50 percent of value and 45 percent of tons) are generally from West Coast states and the Midwest and Mountain West, and from states and Canada.

2010 Monta
ES-4
ana State Rail P
Forecacountincreachangthe larwill aCoastdeman
Figure
Source:
lan
ast populatiies) will inc
asing the demge in Montanrgest compolso expand a and Midwnd for freigh
e ES.2 ProjBy C
Census and EcServices, 2007
ion growth crease the sizmand for frena counties
onent of rail as populatioest grow. Oht rail servic
ected PopuCounty
conomic Informatio.
(greater thaze of local ceight transp from 2005 t movementson, productioOverall, thece in Montan
ulation Chan
on Center, Montan
n 60 percenconsuming mportation. Fito 2030. Ths in Montanaon, and distse trends po
na.
nge 2005-203
na Department of
Camb
nt from 2005markets in Migure ES.2 sh
hrough-rail fa by both wetribution cenoint to long
30
Commerce, analy
bridge Systemati
to 2030 in Montana, fuhows popul
freight – whieight and vanters on the g-term grow
ysis by NCS Data
ics, Inc.
some urther lation ich is
alue – West
wth in

2010 Montana State Rail Plan
Cambridge Systematics, Inc. ES-5
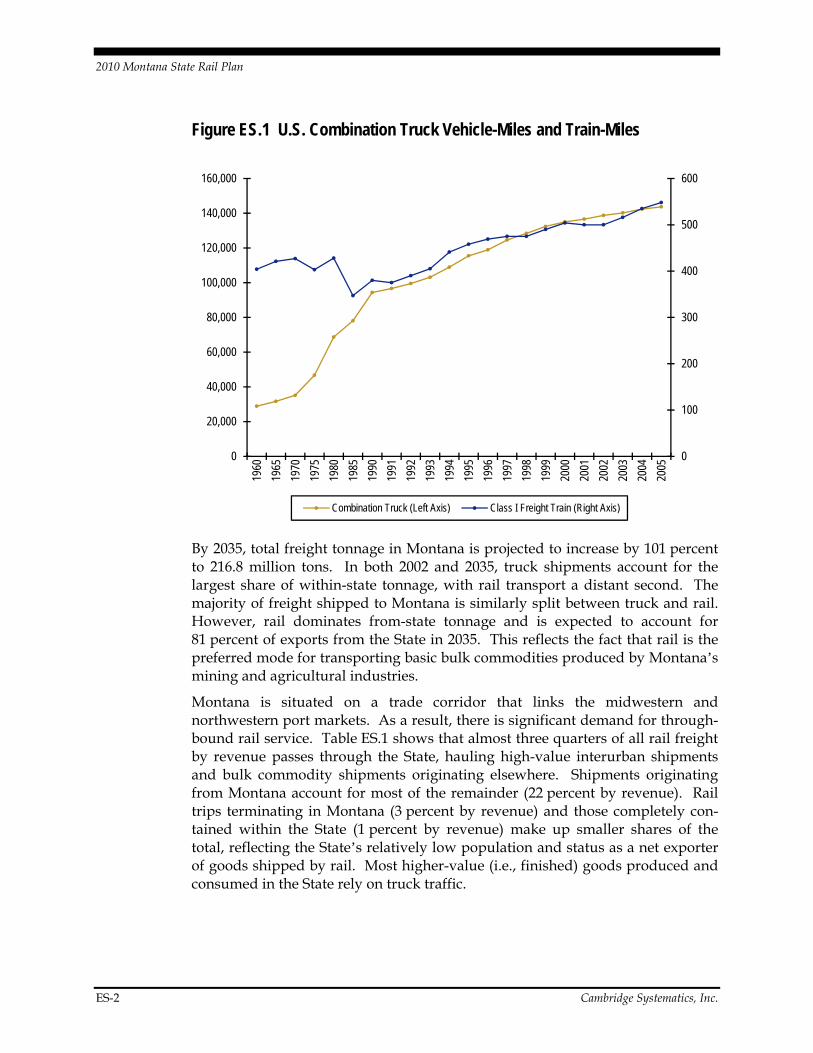
STATE RAIL PLANNING In 2006, eight freight railroads operated 3,270 rail miles in Montana. Combined, Montana’s railroads carried over 2.1 million total carloads, accounting for nearly 110 million total tons of freight, in 2006.1 Table ES.2 summarizes the rail miles contributed by each carrier and Figure ES.3 illustrates the State’s freight railroad network. This section of the report describes each subdivision of Burlington Northern Santa Fe (BNSF) and Montana Rail Link railroads, and maps and describes each other railroad operating in the State.
Table ES.2 Montana Railroad Statistics
Miles of Railroad Operated in Montana 2000 2005 2006
BNSF Railway 2,135 1,983 1,942
Union Pacific 125 125 125
Class I Railroads Total 2,260 2,108 2,067
Dakota, Missouri Valley, and Western 57 58 58
Montana Rail Link 812 807 807
Regional Railroads Total 869 865 865
Central Montana Rail 87 88 88
Mission Mountain Railroad N/A 39 39
Yellowstone Valley Railroad N/A 186 186
Montana Western Railway 59 N/A N/A
Butte, Anaconda and Pacific Railway 69 25 25
Local Railroads Total 215 338 338
Network Total 3,344 3,311 3,270
Source: 2005 and 2006 data from the Association of American Railroads, 2000 data from the 2000 Montana State Rail Plan Update.
Note: Miles operated includes trackage rights. One mile of single track is counted the same as one mile of double track.
1 Association of American Railroads, Railroad Service in Montana 2006, June 2008.
Available at: http://www.aar.org/PubCommon/Documents/AboutTheIndustry/RRState_MT.pdf.
2
E
F
2010 Montana State
ES-6
Figure ES.3 Mo
Rail Plan
ontana Rail Sysstem
Cambridge Syystematics, Inc.
2010 Montana State Rail Plan
Cambridge Systematics, Inc. ES-7
BNSF is the largest railroad operator in Montana, accounting for 94 percent of the State’s Class I rail miles. In 2007, BNSF hauled $131 million of revenue freight within Montana, realizing a 6 percent growth since 2005.2 Coal accounts for approximately 75 percent of BNSF’s revenue freight (in terms of tonnage) origi-nating within Montana. Other key commodities hauled by BNSF in Montana include farm products, lumber and wood products, and petroleum and coal products. BNSF rail lines with the most traffic include the entire route across the northern section of the State, from Snowden east to Libby and beyond (generally referred to as the Hi-Line), the routes with coal traffic – from the Big Horn sub-division to the line from near Billings to Glendive, and then to North Dakota beyond Wibaux. The BNSF line from Laurel to Great Falls and Shelby has mod-erately heavy volume.
Union Pacific (UP) is the other Class I railroad operating in Montana. Despite having a relatively limited number of track miles in the State, UP provides a critical connection between the Port of Montana in Silver Bow County (where UP owns and operates an automotive distribution center) and markets in the western U.S. and southwestern U.S., which are not accessible by other rail carri-ers in the State. Forest products, combined with lumber and wood products, accounted for approximately 75 percent of UP’s tonnage originating in Montana. Other key commodities transported on the line include chemicals and allied products, petroleum and coal products, and nonmetallic minerals (except fuels).
Dakota, Missouri Valley, and Western Railroad (DMVW) is a regional railroad, formerly part of the Soo Line Railroad, with 364 total track miles in Montana and North Dakota. Located in the northeast corner of the State, DMVW operates 57 miles of road in Montana. Wheat is the primary commodity hauled on this line, accounting for almost 96 percent of total revenue freight in 2007.3
After assuming control of Montana’s southern route from the Burlington Northern Railroad in 1987, Montana Rail Link (MRL) is one of two Class II regional railroads operating in the State. Of the 875 miles of MRL track located in Montana, MRL leases approximately 70 percent of its road, including 557 miles of main line leased from BNSF.4 Between 2005 and 2007, MRL experienced notable increases in both carloads and tonnage primarily due to increases in coal movements. In addition to coal, the primary commodities transported by MRL in Montana include farm products, petroleum and coal products, and lumber and wood products. The main line from Laurel to Bozeman, Helena, Missoula northwest to Sandpoint, Idaho is the heaviest traveled MRL line.
2 BNSF Railway, 2005 and 2007 Annual Reports to the Montana Public Service Commission.
3 Dakota, Missouri Valley, and Western Railroad, Annual Report to the Montana Public Service Commission, 2007.
4 Montana Rail Link, Annual Report to the Montana Public Service Commission, 2007.

2010 Montana State Rail Plan
ES-8 Cambridge Systematics, Inc.
Central Montana Rail, Inc. (CMR), a Class III local railroad, operates 87 route miles in the center of the State with a connection to a BNSF main line at Moccasin. While wheat accounts for approximately 92 percent of CMR’s total revenue freight, CMR also hauls barley, fertilizer, and scrap.5 In 2007, CMR transported a total of 82,100 tons, attributing to an intrastate operating revenue of $617,827. A seasonal passenger/tourism train also operates on the line.
The Mission Mountain Railroad (MMR), a subsidiary of Watco Industries that owns and operates 17 short-line railroads across the country, consists of two rail segments totaling nearly 47 miles in Montana. In 2007, MMR hauled 164,620 freight car-miles and 9,790 gross ton-miles, primarily transporting barley, lumber, and various wood products.6
Similar to MMR, Watco Industries also operates the Yellowstone Valley Railroad (YVR) short-line railroad. YVR operates in Northeast Montana and serves sev-eral grain elevators along its 179-mile route. With intrastate operating revenues totaling $353,000 in 2007, YVR’s primary commodities included fertilizer, petro-leum, and wheat.7
Butte, Anaconda & Pacific Railway (BA&P), formerly referred to as the Rarus Railway, operates 25 miles of road between Butte and Anaconda in the south-west area of the State. While an excursion train also operates on the line between June and September, the principal commodities hauled on the line include cop-per concentrate and mine tailings.8
Two additional Montana freight rail lines are in various planning stages. Global Rail Group, a division of Signal Peak Energy (formerly Bull Mountain Rail), finished construction in 2009 of a 36 miles single-track rail spur to serve the Signal Peak Coal Mine in southeastern Montana. The line’s initial haulage capacity is 10 million gross tons annually, and will increase to 15 million tons as necessary. Portions of the Tongue River Railroad have been proposed for con-struction since 1983, and have been subjects of various proceedings at the U.S. Surface Transportation Board (STB) and its predecessor, the Interstate Commerce Commission. While legal challenges remain, however, no definitive timeframe has been set for construction and operation of the Tongue River Railroad.
5 Central Montana Rail, Inc., Annual Report to the Montana Public Service Commission,
2005-2007.
6 Mission Mountain Railroad, Annual Report to the Montana Public Service Commission, 2007.
7 Yellowstone Valley Railroad, Annual Report to the Montana Public Service Commission, 2007.
8 Butte, Anaconda, and Pacific Railway, Annual Report to the Montana Public Service Commission, 2007.
2010 Montana State Rail Plan
Cambridge Systematics, Inc. ES-9
Several segments of existing rail lines are currently at risk for abandonment. Changing economic conditions, such as the relocation of a major shipper or a reduction in commodity value or variety, may entice a rail carrier to pursue abandonment if revenues do not support a line segment’s operating and maintenance costs. On the BNSF network, abandonment is in process for nearly two miles of road near Great Falls, while abandonment of a section near Glendive-Circle is currently on hold. Several segments of MRL are currently out of service and the YVR segment between Plentywood and Scobey has been a candidate for abandonment for several years.
PASSENGER RAIL SERVICE For most of the last century, passenger rail service was available between the Midwest and the Pacific Northwest, over the Empire Builder along the Great Northern Railroad, and the North Coast Limited along the Northern Pacific Railroad. Today, the Empire Builder still serves Montana communities and remains one of Amtrak’s most popular long-distance routes, but no passenger rail service has been available in southern Montana since the late 1970s. In FY 2009, the Empire Builder had the highest ridership of all of Amtrak’s long-distance trains, 515,444, as well as the highest revenue, $59.7 million. Nationally, this train was the second best performing long-distance train, as measured by the operating loss per passenger-mile.9 The Empire Builder provides valuable benefits to north-ern Montana residents who depend on passenger rail for medical appointments, sending children to college, and traveling to larger cities along the route for shopping.
Passenger rail advocates, Montana legislators, and Montana Department of Transportation (MDT) officials have been discussing the possibilities of resuming passenger rail service among Montana’s largest cities in the south once served by the North Coast Hiawatha. In most cases, Amtrak is authorized and generally willing to provide intrastate passenger rail service if a state government is willing to provide capital costs for infrastructure and equipment and pay the dif-ference between operating expenses and revenues on an annual basis. Many states support these kinds of services, and some state-supported routes are among Amtrak’s most financially successful services. Amtrak’s legacy routes from its 1971 creation, generally referred to as long-distance trains (such as the Empire Builder), are supported by Federal appropriations for Amtrak operating expenses. 9 Operating loss per passenger mile is calculated as the difference between operating
expense and operating revenue divided by the number of passenger miles. Operating expenses include direct expenses directly attributable to train operations (crews, fuel, equipment maintenance, ticketing, route stations) and indirect expenses shared by all Amtrak routes (shared stations, training and supervision, police and safety, insurance, marketing, yard operations). Revenues include ticket revenue and sleeper car revenues.

2010 Montana State Rail Plan
ES-10 Cambridge Systematics, Inc.
In 2008, Congress directed Amtrak to examine the possibility of reinstating pas-senger rail service on the North Coast Hiawatha route. 10 Amtrak published the resulting study findings in October 2009. The report examined the route generally followed by the former North Coast Hiawatha (NCH) route with a few exceptions. Amtrak estimated the capital and up-front costs of the NCH route to total $1.043 billion. Amtrak estimated that the NCH annual operating cost would be $74.1 million, resulting in a $31.1 million operating loss. The NCH revenues would cover 58 percent of operating costs, which suggests that the NCH would perform better financially than most Amtrak long-distance trains.
Amtrak produced a study in 2010 for Montana that analyzes two route segments in southern Montana: the corridor between Billings and Missoula (considered in greater depth, and referred to in this text as the Tier 1 analysis); and a longer cor-ridor that includes the Billings-Missoula segment extending from Williston, North Dakota to Sandpoint, Idaho (referred to as the Tier 2 analysis).11
The two-tiered study of new passenger rail service in Montana provided by Amtrak, illustrated in Figure ES.4, addresses:
1. Capital and operating costs, ridership, and revenue for intercity passenger rail service from Billings to Missoula along routes operated by the Montana Rail Link (MRL), via Bozeman, Livingston, and Helena (Tier 1) (see Figure 4.3); and
2. Route assessment and implementation of intercity passenger rail service from Williston, North Dakota to Sandpoint, Idaho over routes operated by the Yellowstone Valley Railroad, BNSF, and MRL (Tier 2).
The Tier 1 analysis estimated capital and up-front costs, developed a proposed operating schedule for Tier 1 service, and estimated annual ridership, revenues, and operating costs. Table ES.3 lists the summary information from the Tier 1 analysis.
10 PRIIA Section 224 North Coast Hiawatha Passenger Rail Study (“NCH Study”), found
on http://www.amtrak.com/servlet/ContentServer/Page/1241245669222/1237608345018, under PRIIA submissions and reports, October 16, 2009.
11 Amtrak Montana Report, 2010: Feasibility and Route Assessment.

Cambridge Systematics, Inc
Figure
Table
Eleme
One Ti
Estima
Estima
Estima
Estima
Source:
For thnecessthe reroadstions a
The TTier 1conditthe ea
c.
e ES.4 AmtTwo
ES.3 Sum
nt
ime Capital Cost
ated Annual Ride
ated Annual Pass
ated Annual Ope
ated Annual Ope
Amtrak Montan
he Tier 2 ansary betwee
equirements . This assesand through
Tier 2 analys. The MRLtion and woastern segm
trak Analysi Tiers
mmary Inform
ts
ership
senger Revenue
erating Costs
erating Subsidy
na Report, 2010: F
nalysis, Amten Williston, of passengessment was h information
sis did not L segments oould likely r
ments from G
s
mation for T
e
Feasibility and Ro
trak assesse, North Daker service an accomplishn from the h
include capof the line (require only Glendive to
Tier 1 Route
oute Assessment.
d capital imkota, and Sannd the oper
hed by a limhost railroad
pital cost es(Missoula to modest cap
o Snowden w
Billings to M
Sandpoint, I
2010 M
e
A
$15
$1
$1
mprovementndpoint, Idarating needs
mited sampleds.
stimates simo Sandpoint)pital investmwill require
Missoula (Tie
ID to Willisto
Montana State Ra
Amount
59,050,000
15,300
$400,000
12,600,000
12,200,000
ts that woulaho to meet s of the hoste of route in
milar to tho) are in exce
ments. Howe more exte
er 1)
on, ND (Tier 2
ail Plan
ES-11
ld be both t rail-
nspec-
ose in ellent
wever, nsive
2)
2010 Montana State Rail Plan
ES-12 Cambridge Systematics, Inc.
infrastructure improvements: track and signal upgrades and maintenance, expanded sidings, and grade crossing protection upgrades. Capital cost estimates for these segments would be highly speculative without more detailed engineering analysis, and therefore this 2010 State Rail Plan does not include those capital cost estimates.
To begin new service, non-Federal funding will likely be required to leverage Federal grants for planning and capital improvements (infrastructure and rolling stock) and to provide ongoing operating support for new service.
Various new Federal funding programs for passenger rail have been authorized in the past 12 months and further appropriations for passenger rail are expected in the 2010 fiscal year and beyond. These programs include:
American Recovery and Reinvestment Act (ARRA) of 2009 Discretionary Multimodal program, providing $1.5 billion for passenger rail improvements;
ARRA High-Speed Rail program, allocating $8 billion for projects with envi-ronmental clearance, corridor planning, and state rail planning;
Intercity Passenger Rail Improvements (IPR), providing $90 million to aug-ment ARRA and fund corridor and state rail planning;
Passenger Rail Investment and Improvement Act (PRIIA) of 2008, which has allocated $1.9 billion to intercity passenger rail, $1.5 billion to high-speed rail, and $0.3 billion for congestion relief; and
Rail Rehabilitation and Improvement Financing (RRIF) Loans, providing up to $35 billion for rail infrastructure capacity.
Additional provisions for passenger rail improvements may be included in the next Surface Transportation Authorization Bill.
GRAIN CAR CONSOLIDATION FACILITY IMPACT ANALYSIS Grain shuttle facilities – large grain elevators designed to load 100 to 110-car trainloads quickly – are playing an increasingly important role in the distribution of Montana grain. Their emergence and increasing prominence represents a technological shift that affects Montana farmers, grain elevator operations, short-line and larger railroad operators, and the State’s roadway system.
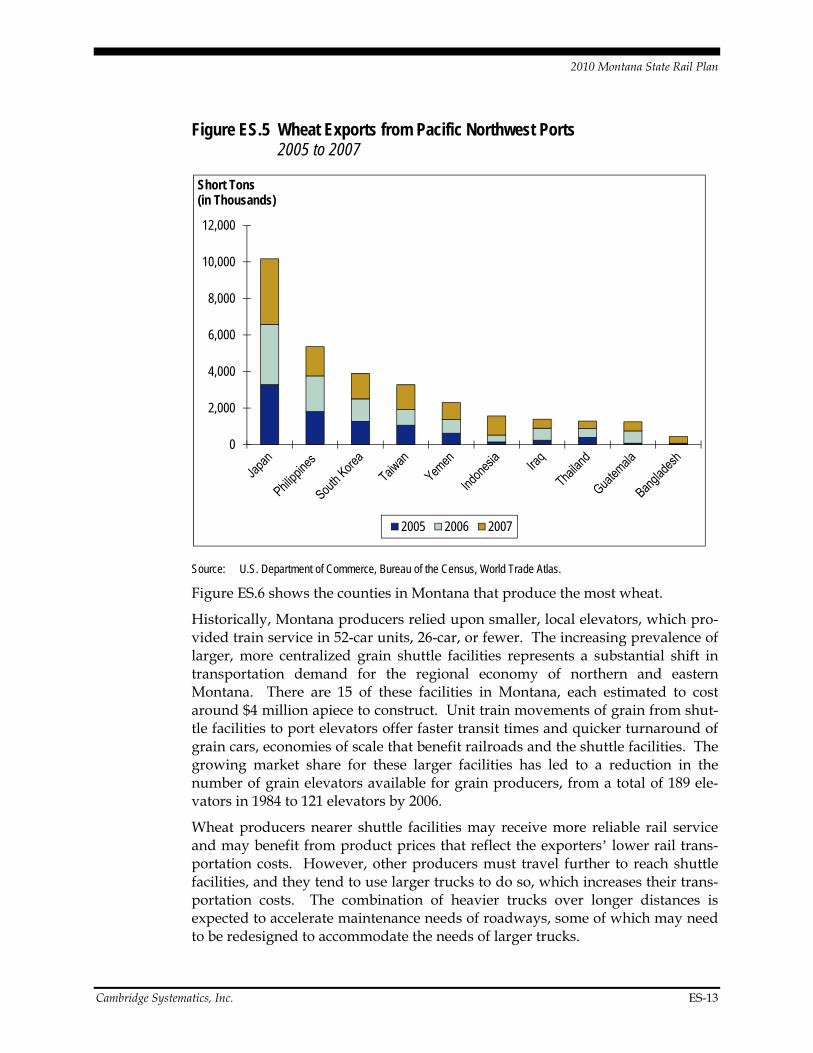
Wheat is Montana’s primary international export, representing 31.64 percent of the State’s export value in 2006. Pacific rim countries are the biggest consumers of Montana wheat, led by Japan, the Philippines, South Korea, and Taiwan, illu-strated in Figure ES.5.
2010 Montana State Rail Plan
Cambridge Systematics, Inc. ES-13
Figure ES.5 Wheat Exports from Pacific Northwest Ports 2005 to 2007
Source: U.S. Department of Commerce, Bureau of the Census, World Trade Atlas.
Figure ES.6 shows the counties in Montana that produce the most wheat.
Historically, Montana producers relied upon smaller, local elevators, which pro-vided train service in 52-car units, 26-car, or fewer. The increasing prevalence of larger, more centralized grain shuttle facilities represents a substantial shift in transportation demand for the regional economy of northern and eastern Montana. There are 15 of these facilities in Montana, each estimated to cost around $4 million apiece to construct. Unit train movements of grain from shut-tle facilities to port elevators offer faster transit times and quicker turnaround of grain cars, economies of scale that benefit railroads and the shuttle facilities. The growing market share for these larger facilities has led to a reduction in the number of grain elevators available for grain producers, from a total of 189 ele-vators in 1984 to 121 elevators by 2006.
Wheat producers nearer shuttle facilities may receive more reliable rail service and may benefit from product prices that reflect the exporters’ lower rail trans-portation costs. However, other producers must travel further to reach shuttle facilities, and they tend to use larger trucks to do so, which increases their trans-portation costs. The combination of heavier trucks over longer distances is expected to accelerate maintenance needs of roadways, some of which may need to be redesigned to accommodate the needs of larger trucks.
0
2,000
4,000
6,000
8,000
10,000
12,000
Short Tons (in Thousands)
2005 2006 2007

2010 Monta
ES-14
ana State Rail P
Figure
Source:
Whileand thfinanctranspportatTheseTransin coo
Over produtive imstreamand g
lan
e ES.6 Whe1980
Cambridge SysAgriculture, dow
e the railroadhe port loadcial benefits portation cotion costs an
e trends arportation Su
operation wi
the long terucers, indepempacts for
m to producereater region
eat Producti0 to 2007
stematics analysiswnloaded from htt
ds and expoding facilities of the efficists are shift
nd higher coe indicated
urveys produith MDT.
rm from a stendent elevrail and ele
ers in the fornal competit
ion by Coun
s of data from the Ntp://www.nass.usd
ort shippers s in the Paciiency improting to farmosts to goverd in data cuced for the
tatewide peators, and sevator operarm of better tiveness.
nty
National Agricultuda.gov/QuickStats/
(who own mific Northwe
ovements gram producers
rnments to mcollected ine Montana W
rspective, pshort-lines aators, benef prices and s
Camb
ral Statistics Serv/Create_County_I
many of theest) appear tain shuttle fin the form
maintain roan the MontWheat and B
potentially neare somewhafits that couservices, bett
bridge Systemati
vice, U.S. DepartmIndv.jsp.
e shuttle facito be reapinfacilities pro
m of higher tadway netwtana Rail G
Barley Comm
egative effecat offset by uld move dter market a
ics, Inc.
ment of
ilities ng the ovide, trans-
works. Grain mittee
cts to posi-
down-access

2010 Montana State Rail Plan
Cambridge Systematics, Inc. ES-15
PUBLIC RAIL FUNDING PROGRAMS In the 1970s, rail planning became a requirement of states wishing to participate in the Local Rail Service Assistance program, a Federal rail financing program. In 1989, the Federal Railroad Administration (FRA) updated the program and renamed it the Local Railroad Financing Assistance (LRFA) program. Federal appropriations to the program stopped in 1995, and states continued to make grants and loans for rail-related projects under Federal oversight. Under these programs, between 1979 and 2008, Montana made a total of $11,112,682 in grants and loans for rail improvements.
In 2005, the Montana Essential Freight Rail Act established in state law guide-lines for the Montana Essential Rail Freight Loan Program. The program is a revolving loan fund administered by MDT to encourage projects for construction, reconstruction, or rehabilitation of railroads and related facilities in the State. Although the program enables bonding and includes statutory authority of up to $2 million annually, no additional funds have been budgeted for the program to date. The MRFL fund currently has a balance of about $1.14 million, comprised of repayments from previous Federal loans.
Various other Federal programs provide financial support for rail improvements. Federal support to states go to safety improvements for road-rail crossings through the Highway Safety Improvement Program (HSIP), which became a core Federal-aid funding program with the passage in 2005 of the Federal transporta-tion reauthorization bill, SAFETEA-LU. Federal funds for grade crossing protec-tion devices have been a feature of Federal highway funding programs for decades, and are distributed to states on a formula basis.
In October 2008, Congress enacted legislation, the Rail Safety Improvement Act of 2008 and the Passenger Rail Investment and Improvement Act (PRIIA) of 2008 (Federal passenger rail investment programs are described in more detail in the Passenger Rail section). The safety provisions do not authorize the scale of Federal investments included in PRIIA, but two authorized grant programs may provide opportunities for Montana. Also, the Rail Rehabilitation and Improvement Financing (RRIF) program provides loans and credit assistance to both public and private sponsors of rail and intermodal projects. RRIF funding may be used to acquire, improve, establish, or rehabilitate intermodal rail equipment or facilities, and is a good match for Montana rail carriers and shippers with projects with revenue potential for loan repayments.
MONTANA RAIL ISSUES Limited rail competition in Montana provides shippers with few competitive options to moderate rail rates, car availability, or services. However, a 2004 rail competition study by R.L. Banks & Associates found that limited rail competition is only one of several other factors contributing to the dual problems of high
2010 Montana State Rail Plan
ES-16 Cambridge Systematics, Inc.
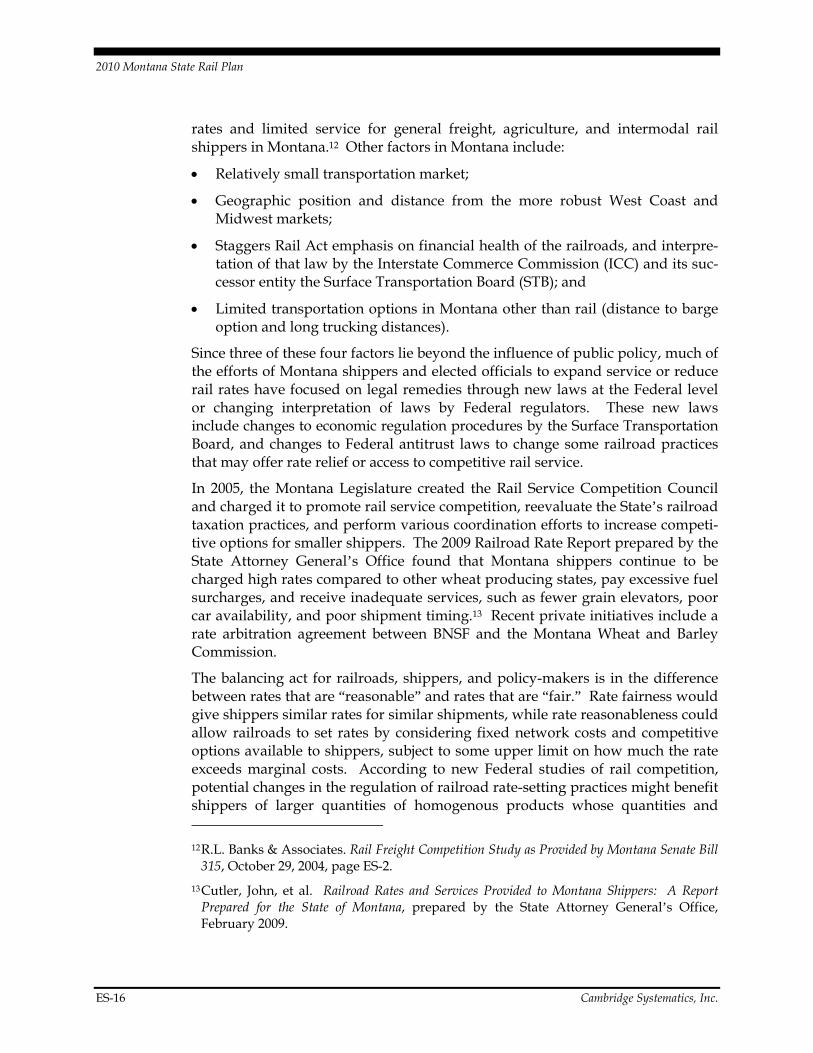
rates and limited service for general freight, agriculture, and intermodal rail shippers in Montana.12 Other factors in Montana include:
Relatively small transportation market;
Geographic position and distance from the more robust West Coast and Midwest markets;
Staggers Rail Act emphasis on financial health of the railroads, and interpre-tation of that law by the Interstate Commerce Commission (ICC) and its suc-cessor entity the Surface Transportation Board (STB); and
Limited transportation options in Montana other than rail (distance to barge option and long trucking distances).
Since three of these four factors lie beyond the influence of public policy, much of the efforts of Montana shippers and elected officials to expand service or reduce rail rates have focused on legal remedies through new laws at the Federal level or changing interpretation of laws by Federal regulators. These new laws include changes to economic regulation procedures by the Surface Transportation Board, and changes to Federal antitrust laws to change some railroad practices that may offer rate relief or access to competitive rail service.
In 2005, the Montana Legislature created the Rail Service Competition Council and charged it to promote rail service competition, reevaluate the State’s railroad taxation practices, and perform various coordination efforts to increase competi-tive options for smaller shippers. The 2009 Railroad Rate Report prepared by the State Attorney General’s Office found that Montana shippers continue to be charged high rates compared to other wheat producing states, pay excessive fuel surcharges, and receive inadequate services, such as fewer grain elevators, poor car availability, and poor shipment timing.13 Recent private initiatives include a rate arbitration agreement between BNSF and the Montana Wheat and Barley Commission.
The balancing act for railroads, shippers, and policy-makers is in the difference between rates that are “reasonable” and rates that are “fair.” Rate fairness would give shippers similar rates for similar shipments, while rate reasonableness could allow railroads to set rates by considering fixed network costs and competitive options available to shippers, subject to some upper limit on how much the rate exceeds marginal costs. According to new Federal studies of rail competition, potential changes in the regulation of railroad rate-setting practices might benefit shippers of larger quantities of homogenous products whose quantities and 12 R.L. Banks & Associates. Rail Freight Competition Study as Provided by Montana Senate Bill
315, October 29, 2004, page ES-2.
13 Cutler, John, et al. Railroad Rates and Services Provided to Montana Shippers: A Report Prepared for the State of Montana, prepared by the State Attorney General’s Office, February 2009.
Cambridge Systematics, Inc
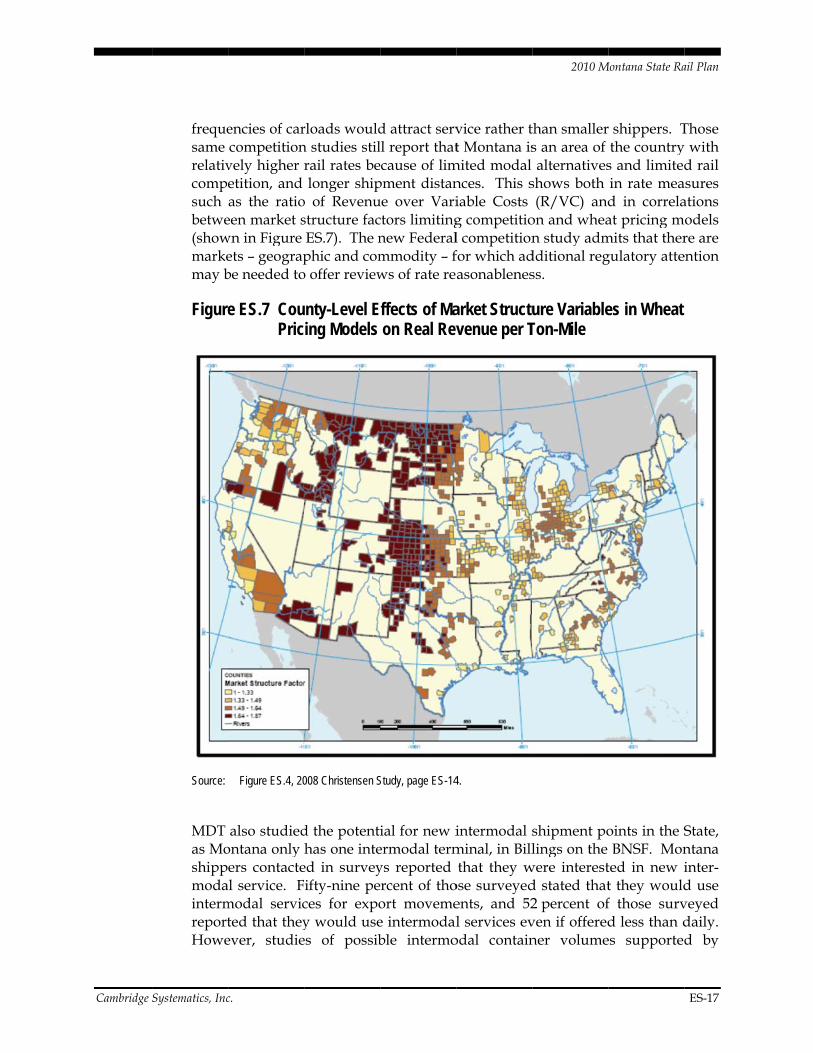
frequesame relativcompesuch betwe(showmarkemay b
Figure
Source:
MDT as MoshippmodaintermreportHowe
c.
encies of carcompetition
vely higher retition, and as the ratio
een market swn in Figure ets – geograpbe needed to
e ES.7 CouPric
Figure ES.4, 20
also studiedontana only ers contacte
al service. Fmodal servicted that theyever, studie
rloads wouldn studies stilrail rates be longer ship
o of Revenustructure fac ES.7). The nphic and com
o offer review
nty-Level Eing Models
008 Christensen S
d the potentihas one inte
ed in surveyifty-nine peces for expoy would use
es of possib
d attract servll report thatecause of limpment distanue over Varictors limitingnew Federalmmodity – fws of rate re
ffects of Ma on Real Rev
Study, page ES-14
ial for new iermodal termys reported rcent of thoort movemee intermodalble intermo
vice rather tt Montana is
mited modal nces. This siable Costs g competitiol competitionfor which adasonablenes
arket Structuvenue per T
4.
intermodal sminal, in Billthat they w
ose surveyedents, and 52l services ev
odal contain
2010 M
than smallers an area of alternativesshows both (R/VC) and
on and whean study adm
dditional regss.
ure VariableTon-Mile
shipment polings on the
were interestd stated that2 percent ofven if offeredner volume
Montana State Ra
r shippers. T the countrys and limitedin rate mead in correlaat pricing m
mits that thergulatory atte
es in Wheat
oints in the S BNSF. Monted in new it they wouldf those survd less than d
es supported
ail Plan
ES-17
Those y with d rail
asures ations odels re are
ention
State, ntana inter-d use veyed daily. d by

2010 Montana State Rail Plan
ES-18 Cambridge Systematics, Inc.
Montana economic activity indicated an insufficient amount of container activity to support another intermodal terminal.
Another issue discussed is possible public support for private rail infrastructure investment. Unlike most other modes of freight transport, railroads are largely responsible for the substantial capital investments necessary to maintain and expand their operations. A study released by the Association of American Railroads in 2007 provided a comprehensive evaluation of long-term capacity needs along major freight rail corridors. Without recommended infrastructure improvements to accommodate the expected increase in overall national freight traffic by the year 2035, the study indicates that several of Montana’s primary main lines could potentially be above capacity. These congested lines in Montana are a result of the increase in overall national freight traffic expected by the year 2035, and are not a short-term projection of rail system congestion. The current economic downturn, and decrease in both rail and highway shipping may affect the pace of overall freight volume growth. In the long term, overall freight expansion will resume and strain the national rail network. With expected growth, Montana rail lines will experience significant congestion unless railroad capital spending expands system capacity. The AAR report suggests that meeting such capital investment needs will require some form of matching public financial assistance.14
A number of major issues also could affect railroad transportation in Montana:
New Federal surface transportation program authorization could expand funding and flexibility for states to fund freight rail improvements or allow incentives for railroads to expand capacity to meet goods movement trends;
New Federal climate change or environmental laws could lead to modal shifts of freight from truck to rail, and could impact long-term prospects for some rail commodities such as coal; and
New Federal energy policy could affect the rail locomotive fleet, or changes in fuel prices could lead to long-term changes in goods movement away from a global sourcing economy and accompanying lengths of movements by rail and truck.
14 American Association of Railroads, National Rail Freight Infrastructure Capacity and
Investment Study, September 2007.