Embed Size (px)
Citation preview


i
Executive Summary
Executive Summary
Tribal Area Electric Supply Company (TESCO) is a wholly-owned Government Distribution
Company with headquarters located in the city of Peshawar. Tribal Area Electric Supply
Company Limited (TESCO) is one of the ten electricity distribution companies (DISCOs).
TESCO was spun out of PESCO in June 2002 to supply electricity to tribal areas of Pakistan.
Peak demand of TESCO in the year 2013-14 was 292 MW, energy sale was 1366 GWh and
energy purchased was 1696 GWh. The shares of domestic sector and industrial sector were
91.89% and 3.24% respectively with respect to total energy sale, which is not a healthy sign. The
total numbers of consumers in this year were 0.441 million out of which domestic consumers
were 0.401 million, commercial were 0.028 million and agricultural consumers were 0.009
million. In the year 2013-14, TESCO total sale in terms of megawatt was 235 MW, for the
domestic sector it was 254 MW while for the medium & large industries and small industries it
was 0 MW and 11 MW respectively.
This forecast has been computed on the basis of Power Market Survey (PMS) methodology by
the TESCO (PMS) team under the supervision of planning power, NTDCL. The year 2013-14
has been taken as base year and the forecast horizon is ten years up to 2023-24. The base year
sale data (feeder wise consumer category-wise energy sale) and the expected spot loads data at
the locations of different sub-stations have been collected by TESCO power market survey team.
Data for the base year has also been adjusted for the estimates of un-served energy (load
shedding) in order to have realistic figures.
Forecast results show that energy sale will be 1626 GWh and 2075 GWh, peak demand will be
752 MW and 918 MW, and energy purchased will be 2546 GWh and 3126 GWh by the years
2017-18 and 2023-24 respectively. For the period 2013-14 to 2023-24, annual average
compound growth rate of energy sale, peak demand and energy purchased will be 4.27%, 3.46%
and 3.57% respectively.
To further refine the forecast and making it helpful for planners following additions have been
made in this issue;
Civil Administrative Division-wise energy and demand forecast
Civil Administrative District-wise energy and demand forecast
Month-wise demand projection
Overloaded 132 kV substations
List of existing substations with their MVA capacities
A realistic forecast, saves over investment as well as under investment, meaning thereby timely
recovery of revenue and no constraints in the supply of power (load shedding) respectively. This
kind of forecast can only be prepared by applying proper methodology with authentic data. The
results of previous PMS forecasts were very close to the actual which proves the authenticity of
methodology and data. This report highlights the salient features of load forecast of the company.
Planning Power, NTDCL firmly believes that the reader’s comments/suggestions on this report
will help in improving energy and demand forecast in future.


ii
Table of Contents
Table of Contents
1 Introduction ........................................................................................................................... 1
2 Historical Supply and Demand Analysis ............................................................................ 3
2.1 Category-wise Sale ........................................................................................................... 3
2.2 Transmission and Distribution Losses ............................................................................. 4
2.3 Recorded and Computed Peak Demand ........................................................................... 5
2.4 Number of Consumers ..................................................................................................... 5
3 Power Market Survey Methodology ................................................................................... 6
3.1 Overview .......................................................................................................................... 6
3.2 Survey Base Data ............................................................................................................. 6
3.3 Input Parameters ............................................................................................................... 7
3.4 Growth Rates .................................................................................................................... 8
3.5 Losses ............................................................................................................................... 8
3.6 Load Factors ..................................................................................................................... 8
3.7 Coincidence Factors ......................................................................................................... 9
3.8 Forecast Calculations ..................................................................................................... 10
3.9 Energy Calculations ....................................................................................................... 10
3.10 Peak Demand Calculations............................................................................................. 10
3.11 Accumulations ................................................................................................................ 10
4 PMS Forecast Results ......................................................................................................... 11
4.1 Recorded Forecast (Excluding Load Shedding)............................................................. 11
4.2 Computed Forecast (Including Load Shedding) ............................................................ 11
4.3 Category-wise Forecasted Energy Sale (GWh) ............................................................. 12
4.4 Category-wise Power Demand (MW) ............................................................................ 12
4.5 Peak Demand of Substations .......................................................................................... 13
4.6 Per Capita Consumption................................................................................................. 13
4.7 Category-wise Substation-wise Energy and Demand Projections ................................. 13
4.8 Civil Administrative Area Forecast................................................................................ 14
4.9 Monthly Demand (MW) Projections.............................................................................. 14
4.10 List of Overloaded Substations ...................................................................................... 14
4.11 List of Grids with their Codes and MVA Capacities ..................................................... 14
Disclaimer .................................................................................................................................... 54


iii
List of Figures
List of Figures
Figure 1- 1: Computed Demand Forecast ..................................................................................................... 1
Figure 1- 2:Historical Category-wise Sale .................................................................................................... 3
Figure 1- 3: Historical Transmission and Distribution Losses ...................................................................... 4
Figure 1- 4: Historical Recorded and Computed Peak Demand ................................................................... 5
Figure 1- 5: Number of Consumers .............................................................................................................. 5
Figure 1- 6: Computed Peak Demand (MW) .............................................................................................. 11
Figure 1- 7: Energy Purchased VS Energy Sale ......................................................................................... 11
Figure 1- 8 Forecasted Category-wise Sale ................................................................................................ 12
Figure 1- 9: Per Capita Consumption (KWh) ............................................................................................. 13
Figure 1- 10: Distribution Network Map .................................................................................................... 53


iv
List of Tables
List of Tables
Table 1- 1: PMS Recorded Forecast (Excluding Load Shedding) ................................................................. 15
Table 1- 2: PMS Base Forecast .................................................................................................................... 16
Table 1- 3: Category-wise Sale – GWh (Base Forecast) .............................................................................. 17
Table 1- 4: Category-wise Sale – GWh (Base Forecast) .............................................................................. 18
Table 1- 5: Category-wise Demand – MW (Excluding Load Shedding) ....................................................... 19
Table 1- 6: Category-wise Demand – MW (Including Load Shedding)........................................................ 20
Table 1- 7: District-wise Sale (GWh) ,Generation(GWh) and Demand (MW) Forecast For District: Ghallanai ..................................................................................................................................................... 21
Table 1- 8: District-wise Sale (GWh), Generation(GWh) and Demand (MW) Forecast For District: Khyber .................................................................................................................................................................... 22
Table 1- 9: District-wise Sale (GWh), Generation(GWh) and Demand (MW) Forecast For District: Bajour .................................................................................................................................................................... 23
Table 1- 10: District-wise Sale (GWh), Generation (GWh) and Demand (MW) Forecast For District: Bara24
Table 1- 11: District-wise Sale (GWh), Generation(GWh) and Demand (MW) Forecast For District: Lakarai .................................................................................................................................................................... 25
Table 1- 12: District-wise Sale (GWh), Generation(GWh) and Demand (MW) Forecast For District: Tangi .................................................................................................................................................................... 26
Table 1- 13: District -wise Sale (GWh), Generation(GWh) and Demand (MW) Forecast For District: Darra .................................................................................................................................................................... 27
Table 1- 14: District -wise Sale (GWh), Generation(GWh) and Demand (MW) Forecast For District: Sadda .................................................................................................................................................................... 28
Table 1- 15: District -wise Sale (GWh), Generation(GWh) and Demand (MW) Forecast For District: Tall . 29
Table 1- 16: District -wise Sale (GWh), Generation(GWh) and Demand (MW) Forecast For District: Mattani........................................................................................................................................................ 30
Table 1- 17: District -wise Sale (GWh), Generation(GWh) and Demand (MW) Forecast For District: Gumbat ....................................................................................................................................................... 31
Table 1- 18: District -wise Sale (GWh), Generation(GWh) and Demand (MW) Forecast For District: Miran Shah............................................................................................................................................................. 32
Table 1- 19: District -wise Sale (GWh), Generation(GWh) and Demand (MW) Forecast For District: Mir Ali .................................................................................................................................................................... 33
Table 1- 20: District -wise Sale (GWh), Generation(GWh) and Demand (MW) Forecast For District: Wana .................................................................................................................................................................... 34
Table 1- 21: District -wise Sale (GWh), Generation(GWh) and Demand (MW) Forecast For District: Kalaya .................................................................................................................................................................... 35


v
List of Tables Table 1- 22: District -wise Sale (GWh), Generation(GWh) and Demand (MW) Forecast For District: Tank .................................................................................................................................................................... 36
Table 1- 23: District -wise Sale (GWh), Generation(GWh) and Demand (MW) Forecast For District: Jandola ........................................................................................................................................................ 37
Table 1- 24: District -wise Sale (GWh), Generation(GWh) and Demand (MW) Forecast For District: Prova .................................................................................................................................................................... 38
Table 1- 25: District -wise Sale (GWh), Generation(GWh) and Demand (MW) Forecast For District: Ramzak ........................................................................................................................................................ 39
Table 1- 26: District -wise Sale (GWh), Generation(GWh) and Demand (MW) Forecast For District: Domail .................................................................................................................................................................... 40
Table 1- 27: Division-wise Sale (GWh), Generation(GWh) and Demand (MW) Forecast For Divison: Peshawar ..................................................................................................................................................... 41
Table 1- 28: Division-wise Sale (GWh), Generation(GWh) and Demand (MW) Forecast For Divison: Hangu .................................................................................................................................................................... 42
Table 1- 29: Division-wise Sale (GWh), Generation(GWh) and Demand (MW) Forecast For Divison: Bannu .................................................................................................................................................................... 43
Table 1- 30: Division-wise Sale (GWh), Generation (GWh) and Demand (MW) Forecast For Divison: Tank .................................................................................................................................................................... 44
Table 1- 31: Monthly Peak Demand Forecast ............................................................................................. 45
Table 1- 32: List of Overloaded Substations during Period 2013-14 to 2023-24 Overloading Criterion=85% ............................................................................................................................................. 46
Table 1- 33: List of Overloaded Substations during Period 2013-14 to 2023-24 Overloading Criterion=100% ........................................................................................................................................... 47
Table 1- 34: List of Grids with their Codes & MVA Capacities .................................................................... 48
Table 1- 35: Maximum Demand (MW) of Substation ................................................................................. 49
Table 1- 36: Category-wise Energy(GWh) and Maximum Demand (MW) of Substations .......................... 51

TESCO

1
TESCO
1 Introduction
The present report of Power Market Survey forecast is the 24th
report in the series of reports
compiled by the planning power department. This report contains year wise detailed forecast
of energy and demand for the whole company, and each sub-station within the company. In
addition to that civil administrative areas’ forecast like division and district within the
company are also computed and depicted in different tables. The forecasted peak demand of
TESCO has graphically presented in Figure 1-1.
Load forecasting is an important element of the power planning process involving prediction
of future level of demand. The forecast serves as the basis for supply-side and demand-side
planning. Load forecasts are typically prepared by utilities for different time frames and
levels of detail and used in different planning applications and operations.
Long term planning requires a system level forecast of total generation requirement and peak
demand. On the other hand transmission and distribution planning require more load level
and geographic detail to assess location, timing and loading of individual lines, substation
and transformation facilities.
Figure 1- 1: Computed Demand Forecast
Forecasting models fall into three general categories:
Trend models.
Econometric based models.
End-use models.
Trend forecasts graphically or mathematically extrapolate past electricity demand trends into
the future. They may be inadequate for shorter time periods where demographic changes in
the underlying casual factors of load growth are not anticipated.
500
550
600
650
700
750
800
850
900
950
Me
ga W
atts
(M
W)

2
TESCO Econometric models represent a more complex ‘top-down’ approach to forecasting and rely
on the observed or the implied relationship between past energy consumption and other
variables defining past economic output, demographics and price or income variables. Such
models employ a combination of econometric, regression and time series forecast techniques.
End-use models relate energy use to the physical appliance stock levels, to the use patterns or
to the industrial process. These end use models represent a ‘bottom-up’ forecasting approach
and normally incorporate disaggregate end use forecast and consumer survey techniques.
This report has been prepared on the basis of Power Market Survey Methodology and the
model used is called Power Market Survey (PMS) model. This model is a form of end use
model which provides energy and power projection for all distribution companies and all grid
stations within the company.
The PMS model relies on an extensive data base of historical sales. The data base includes
consumption by consumer type (i.e. domestic, industrial and commercial etc.) on a grid
station and grid station feeder basis. Actual consumption data are adjusted for unserved
demands attributed to load shedding.
Energy forecasts are computed for each consumption category at the sub area level on the
basis of a trend analysis of recent per consumer sales plus new consumer connection
applications. Industrial forecasts are based on interviews with existing consumer trend
projections and a review of the applications for new and increased service. These analyses
are repeated for each sub area for each of the years to be forecast. The annual peak demand is
determined from the resulting energy forecasts by using the load factors and diversity factors
developed for each consumer category. Forecasts are then aggregated to a system level.
Because the PMS forecast is based on a mix of end-use, trend projection and known
consumer expansion plans, it cannot be used reliably to predict demand over the longer term.
This model had not been created to predict impacts of changes in growth rates of different
economic sectors or consumers categories over time, of changes in both the absolute and
relative prices of electricity, or of changes in the relationships between income growth and
electricity growth over time as a result of market saturation and technological change (in
order to capture these changes NTDC is using another model called regression model). This
model is used for long term forecasting as the changes in growth rate are occurred due to
change in technology, life style over a longer time period.
The Power Market Survey forecast model most closely approaches the requirements of
power system planning. It provides the level of detail required for siting studies and
transmission and substation planning, as well as the sectoral detail necessary to assess
different sector growth rates and their impacts on load shapes, both for the system, DISCOs
and grid stations. In addition, because it also makes specific provision for load shedding i.e.
suppressed demand, it provides a reasonable approximation of unconstrained load growth.

3
TESCO
2 Historical Supply and Demand Analysis
2.1 Category-wise Sale
The customers within the company can be segregated in different categories. The segregation is
usually based upon the type of applications for which electricity is being used. Major categories
include Domestic, Commercial, Small industries, Medium & Large industries and Agriculture.
The category-wise percentage sale for the years 2003-04, 2006-07, and 2013-14 are given in
Figure 1-2.
Figure 1- 2:Historical Category-wise Sale
93%
1% 0% 1% 1% 4%
2003-04 Domestic
Commercial
Public Light
Small Industries
M&L Industries
Tube Well
93%
1%
0% 1% 1% 4% 2006-07
Domestic
Commercial
Public Light
Small Industries
M&L Industries
Tube Well
90%
1% 0% 5% 0% 4%
2013-14
Domestic
Commercial
Public Light
Small Industries
M&L Industries
Tube Well

4
TESCO
314(GWh),19%
38.4(GWh),2%
1295(GWh),79%
2012-13
Distribution Losses
Transmission Losses
Sale
475(GWh),
22.92%
131(GWh),
6.32% 1466(GWh),
70.75%
2011-12
Transmission Losses
Distribution Losses
Sale
2.2 Transmission and Distribution Losses
In our system losses are divided into two types;
Transmission Losses
Distribution Losses
The losses on 132 kV and 11kV transmission lines are considered as Transmission Losses
where as the losses on 11 kV and 440 Volts lines supplying the consumers are called
Distribution Losses. In a system, generally the high losses are due to lack of proper
maintenance and elements of theft. Reduction in losses can be achieved, by installing proper
size of conductor in 11kV feeders, low tension lines and also by installing capacitor banks,
to reduce reactive power and thereby improving power factor. Energy sent out is shown in
the form of its breakup as sale, distribution losses and transmission losses with their
percentages in the figure 1-3 for the year 2011-12, 2012-13 and 2013-14.
Figure 1- 3: Historical Transmission and Distribution Losses
293(GWh) 17%
37(GWh) 2%
1366(GWh) 81%
2013-14
Distribution Losses
Transmission Losses
Sale

5
TESCO
2.3 Recorded and Computed Peak Demand
Recorded demand is the highest electricity demand or maximum power supplied to the
consumers during the base year. Computed peak demand is calculated by adding the
element of unserved power into the figure of the recorded peak demand. Figure 1-4
shows the recorded and computed peak demand (MW) from the year 2009-10 to 2013-
14.
Figure 1- 4: Historical Recorded and Computed Peak Demand
2.4 Number of Consumers
Historical record of number of consumers within TESCO jurisdiction is given in Figure
1-5. These consumers are from all categories; i.e. Domestic, Commercial, Small
industries, Medium & Large industries, Public Lighting, Bulk and Agriculture.
Figure 1- 5: Number of Consumers
0
100
200
300
400
500
600
700
800
2009-10 2010-11 2011-12 2012-13 2013-14
524 568
417
298 298
688
532
622
785
653
PEA
K D
EMA
ND
(M
W)
Recorded PeakDemand
Computed PeakDemand
380000
400000
420000
440000
460000
2009-10 2010-11 2011-12 2012-13 2013-14
410957
440018 440100 441368 441486

6
TESCO
3 Power Market Survey Methodology
3.1 Overview
The Power Market Survey Model forms the basis of the Medium Term Forecast. It
produces an energy and peak demand forecast over a ten year period by consumption
category and by grid station for the entire service area. The Model has three inter-related
components, the main database, the basic input parameters and the calculations
themselves.
The energy consumption data base obtained through the power market survey is
immense. It contains base year consumption data for existing consumers and ten year's
forecast data for new consumers for each consumer category within the company. In
addition, there is separate information for peak demand in medium & large industries
and traction categories. Because of its volume this data is not listed as part of this report.
In addition to the data base, a number of basic input parameters form an integral part of
the forecast model which are separately prepared for each DISCO. These include:
Growth rates: the annual increase in consumption per consumer by consumption
category
Loss rates: transmission and distribution losses expressed as a percentage of
energy purchased and energy sold, respectively
Load factors: relating the amount of energy consumed to the rate at which it is
consumed (that is, the peak demand) for each consumption category
Coincidence factors: describing the load diversity within the system
The forecast calculations within the model combine the energy consumption data and the
input parameters to compute the energy and peak demand requirements within each area
for each year to be forecast. The data are accumulated from the area basis, to grid
stations, to DISCOs and ultimately to produce a forecast for the entire system.
Each of the three model component is discussed in detail below.
3.2 Survey Base Data
An extensive data base has been developed on gross consumption by consumer category
household (domestic), commercial, small industrial, large industrial, tube wells
(agriculture), public lighting, and traction (electric rail). Energy consumption comes
from consumer service meter readings. Maximum demand readings and load factors for
large industrial users and other demand-meteredconsumers are based on service meter
readings. The consumption data is collected from Computer Centers of each DISCO (It
is feeder-wise category-wise consumption data).
Actual consumption data are also adjusted for unserved demands attributable to load
shedding and to voluntary restraint by consumers (e.g. an industrial consumer who
agrees to close his plant or switch to auto-generation during peak hours).
The basic geographic unit represented within the data base is called an area, although
many areas are divided into two or more subareas. This occurs when portions of the

7
TESCO
area are served by different feeders or where a single feeder services different
administrative districts. Each area is assigned a series of codes which identify the
technical boundaries associated with the area.
The technical boundaries, which are emphasized in this report, start at the grid station.
Thus, all areas and subareas are assigned to one of the all the sub-stations in each
DISCO. These are distribution grid stations supplying power at 11 kV after
transformation from a 132 or 66 kV source. Grid stations are combined to form
DISCO.
There can be up to eleven records in the data base for each area or subarea, one record
for each year of forecast. The first year is typically year zero and records the base year
level of consumption for each consumption category as determined in the survey. The
remaining records for the area list the incremental consumption associated with new
consumers to be added to the area within the specified year.
This incremental consumption is based on applications for new or extended service
which are filed at each revenue office and from discussions with the relevant industries
and government agencies. Incremental industrial consumption is based on a
combination of interviews, trend projections, and reviews of applications for new and/or
increased service. Interviews are held with major industrial consumers to identify their
current capacity utilization and any long-term plans they have for future expansion or
changes in their electricity consumption. Auto-generation is also recorded. In addition,
the various branches of the Ministry of Industries are interviewed to determine how
many applications for new developments or plant expansions have been received, and
what the anticipated electrical load associated with each is likely to be. These
anticipated new demands are added to the basic forecast of industrial consumption.
Extension of electricity to new areas over the forecast period is dealt with separately.
The number of new communities to be electrified is also obtained. Initial loads and
load growth are calculated based on past experience in terms of market penetration and
consumption per consumer in newly electrified communities. This analysis is
conducted at DISCO level.
There are over 10,000 area/subarea/year records in the data base.
3.3 Input Parameters
A number of input parameters are defined for use in the Power Market Survey Model.
These parameters are:
Transmission and distribution loss rates
The rates of growth in consumption per consumer
Load factors for each consumption category
Coincidence or diversity factors
The definition and basic derivation of each is discussed below.

8
TESCO
3.4 Growth Rates
The forecast calculations, as will be discussed below, use per consumer growth rates to
update the previous year's consumption before adding the incremental consumption
estimate for the current year. The Power Market Survey Model requires per consumer
growth rates to be specified by DISCO for each consumption category (domestic,
commercial, etc). The rates selected for the Forecast are based on average annual
compound growth rates, calculated from the last six years data of each consumer
category in each DISCO.
3.5 Losses
For every 100 units of electricity purchased from a power station only 75 to 85 units are
actually sold to the ultimate end-user. The remainder is consumed by the power system
itself in the transmission and distribution of the sold energy. These transmission and
distribution losses must be added to the sales forecast in order to determine the total
generation requirement for the system. An additional source of "loss", the consumption
in auxiliaries (also called station service) used by the power plants in the process of
generating electricity. Auxiliary consumption cannot be avoided and is totally
dependent on the type of generation system. For example, a thermal plant would have a
higher station service than a hydro plant to account for the energy consumed by fuel and
waste handling systems. Auxiliary losses are determined and incorporated in the
forecast outside the model.
Within the Power Market Survey Model, distribution losses are expressed as a
percentage of sales and transmission losses as a percentage of the energy purchased from
the generating stations. The model is capable of handling different loss rates for each
year for each DISCO. The distribution and transmission losses used in the Power Market
Survey Model are based on the review of current loss rates and an evaluation of existing
loss reduction initiatives within PEPCO. The losses proposed are differentiated by
DISCOs and distribution at losses 11 kV and transmission losses at 132 kV are applied
DISCO-wise. A separate excel sheet has been developed outside the model to calculate
the loss rates needed for the model. The loss rates have been set to match observed
performance.
3.6 Load Factors
Energy sale in each consumption category is converted to peak power demand through
the use of a load factor. It expresses the ratio of the amount of energy actually consumed
to the amount that would have been consumed had the peak rate been continued over the
entire period. Load factors can be calculated over any time period but the most common
are daily, weekly and annual.
The load factors utilized in the Power Market Survey Model relate annual energy sales to
peak capacity for each consumer category (domestic, commercial, public lighting, small
industries and private tube wells). Input load factors are not required for medium/large
industry, public tube well and traction sales as consumption for these sectors is provided
through the survey in both energy and power terms.

9
TESCO
Maximum demand readings are available directly for large industrial and other demand
metered consumers such as public tube wells. Load factors for non-demand metered
consumers are determined on a sample basis. For example, peak demand is based on
maximum demand readings from substation feeders which are identified as serving
predominantly one sector.
Domestic and commercial load factors are differentiated by community size (village,
town or city). Whereas a single load factor is used for small industrial, private tube
wells, public lighting and traction because of the similar nature in the operation of these
loads. While there is some variation in the load factors within the domestic and
commercial sectors, there are no differences in any of the load factors by DISCO.
3.7 Coincidence Factors
The total energy demand of a number of individual consumers is determined as the
simple sum of their individual energy consumption values. The total peak load,
however, is calculated as the diversified sum of their individual peak load levels. The
coincidence factor, as its name implies, is a general term which measures the
coincidence between the peak loads of any number of individual consumers or consumer
groups over a specified time period in order to compute a combined peak.
Mathematically, it is the inverse of the diversity factor.
The daily coincidence factor is determined by comparing the daily load patterns of each
consumer or group under consideration. In this case, the sum of the individual hourly (or
15-minute) peaks would determine the overall daily load pattern and the overall peak
load. If, for example, one consumer (or group) consumes energy only in the morning
and a second group consume only in the evening, the coincidence factor between these
two consumers would be zero and the peak load of the combined group would be the
peak of the larger consumer. Conversely, if both groups consumed all energy at the
same hour, the coincidence factor would be one and the combined peak would be the
sum of the two peaks. In practice, the coincidence factor is found between these two
extremes.
Coincidence factors can be determined between any group and sub-group of consumers
whether it is domestic versus commercial or Lahore versus Islamabad, provided that
reasonable estimates of the appropriate load patterns are available. Typically, these
patterns are not readily available and must be synthesized from incomplete or estimated
data. In addition, all coincidence factors calculated from these load patterns are
approximations of the corresponding instantaneous peak faced by the system. In fact, a
common practice is to define this instantaneous peak as the bench mark and specify all
coincidence factors in relation to this peak and time. The advantage of this approach is
that all peak can be easily converted into their contribution to the overall system peak,
the disadvantage is that the relationship between any two groups cannot be so clearly
specified and will likely be incorrectly specified.
The Power Market Survey Model depends upon specified coincidence factors between
consumption categories and between consumption areas in the aggregation of peak loads
from consumers to the peaks at grid stations and at DISCO level and at the level of
overall system peak. The coincidence factors estimated for the medium term model have
been based on the limited available PEPCO records of the peak loads at various points in
their respective systems.

10
TESCO
3.8 Forecast Calculations
The forecast calculations involve three basic steps. First, an energy forecast is
determined at the area (or subarea) level using per consumer growth rates and
incremental consumption estimates from the data base. This is then converted to a peak
demand forecast, again at the area (or subarea) level using the input load and diversity
factors. Then transmission and distribution losses are added and final step is to
accumulate the areas into their corresponding grid stations, and grid stations into their
DISCO and finally all DISCOs to form the system.
3.9 Energy Calculations
The basic calculation unit is the area or subarea. The data base provides the base year
energy consumption level for each of six consumption categories: domestic,
commercial, public lighting, small industrial, private tube wells and medium and large
industry. The database also includes the peak demand associated with the medium and
large industry category. The domestic energy forecast for year 1 (the base year is year 0)
is calculated by multiplying the base year consumption by the domestic per consumer
growth rate to account for growth in the intensity of use in the sector then adding the
incremental consumption listed in the data base to account for new use in the sector.
This process is repeated for the remaining five energy sectors (plus the medium and
large industrial demand) for each of the remaining 9 years. The total energy consumed in
the subarea within the year is then computed.
3.10 Peak Demand Calculations
The annual energy values for each of the domestic, commercial, public lighting, small
industry and private tube well categories are converted to peak demand using the load
factors listed in the appropriate input parameter file and adjusted to account for
coincidence within the category. The annual peak demand for the area or subarea is
computed as the sum of the individual category peaks multiplied by coincidence factors
within the subarea and for each subarea within an area.
3.11 Accumulations
The total energy and peak demand at a given grid station is calculated as the sum of all
the areas and subareas in that grid station's service area plus an allowance for distribution
losses. Peak demand estimates are accumulated and different coincidence factors
applied to city, town and village areas within the service area. The total energy and peak
demand within a given DISCO is the sum of all grid stations in that DISCO plus traction
and an allowance for transmission losses. Peak demands are again diversified in the
accumulation, and the system totals are obtained from DISCO’s total with some
coincidence.

11
TESCO
4 PMS Forecast Results
4.1 Recorded Forecast (Excluding Load Shedding)
The term ‘recorded’ means the sale used in forecast has not been adjusted for un-served
energy (load shedding). Forecasted sale, transmission and distribution losses, generation
requirements and peak demand without load shedding has been shown on Table 1-1.
4.2 Computed Forecast (Including Load Shedding)
The term ‘computed’ means the sale used in forecast has been adjusted for un-served
energy (load shedding) and it is considered as base forecast. Computed forecast has been
shown in Table 1-2. Peak demand of this table has been demonstrated graphically in
Figure 1-6. Similarly energy sale and energy purchased also have been shown in Figure
1-7, the difference shows the losses of DISCO.
Figure 1- 6: Computed Peak Demand (MW)
Figure 1- 7: Energy Purchased VS Energy Sale
0
200
400
600
800
1000
Computed Peak Demand
0
500
1000
1500
2000
2500
3000
3500
EnergyPurchased(GWh)
Energy Sale(GWh)

12
TESCO
4.3 Category-wise Forecasted Energy Sale (GWh)
Percentage share of each consumer category in total sale of year 2017-18 and year 2023-
24 has been depicted in Figure 1-8.
Figure 1- 8 Forecasted Category-wise Sale
The category-wise forecasted sale with and without load shedding are shown in Table 1-
3 and 1-4 respectively.
4.4 Category-wise Power Demand (MW)
Power demand projection is the most important parameter for the planning of generation,
transmission facility and distribution, may it be long term planning or short term
1841 (GWh) 88%
15(GWh) 1%
0(GWh) 0%
99(GWh) 5%
30(GWh) 1%
115(GWh) 5% 2017-18
Domestic
Commercial
Public Light
Small Industries
M&L Industries
Tube Well
2269 (GWh) 85%
20(GWh) 1%
0(GWh) 0%
133(GWh) 5% 48 (GWh)
2% 204(GWh)
7% 2023-24
Domestic
Commercial
Public Light
Small Industries
M&L Industries
Tube Well

13
TESCO
planning. Tables 1-5 and 1-6 show the category-wise demand (MW) without and with
load shedding respectively.
4.5 Peak Demand of Substations
A projection at a sub-station is the most peculiar feature of this report. It is indeed a very
rare and useful forecast. It’s the base of transmission system expansion planning. It also
provides a very solid ground for proposing a new sub-station or augmentation, extension
and conversion of a sub-station. All the losses have been considered for calculating the
peak demand of substations.
The peak demand of each substation, weather existing or proposed, situated in the
service area of the DISCO has been shown in the Table 1-25.
4.6 Per Capita Consumption
Per capita consumption is a very vivid indicator of development in a country. Usually
developed countries have very high per capita consumption. The consumption for the
years 2016-17, 2018-19 and 2023-24 are obtained from forecasted data. The population
is projected by using the growth rate of population of FATA given in Census report of
1998. Per capita consumption (kWh/person) is given in Figure 1-9.
Figure 1- 9: Per Capita Consumption (KWh)
4.7 Category-wise Substation-wise Energy and Demand Projections
The category-wise substation-wise energy and demand projections have been presented
in Table 1-26. The last column of the table contains power factor and reactive power
values. In order to reduce the volume of the report, only the values last year are
presented i.e. 2023-24.
0
200
400
600
800
1000
2008-09 2010-11 2013-14 2017-18 2019-20 2023-24
670 673
770 819 844
896

14
TESCO
4.8 Civil Administrative Area Forecast
The TESCO service area comprises of four civil administrative divisions and ten
districts’; Ghallani, Khyber, Bajour, Darra, Para Chinnar, Orakzai, MiranShah, MirAli,
Wana, Tank. The Distric-wise and civil administrative Division -wise energy and
demand projections have been presented in Tables 1-7 to 1-20. The last column of the
table contains peak demand.
4.9 Monthly Demand (MW) Projections
The Month–wise demand (MW) projections of the respected DISCO have been
presented in Table 1-21. To develop this projection, monthly demand factors are
computed for last five years and then its average is taken as a base for monthly demand
projection.
4.10 List of Overloaded Substations
There have been several incidents of damage and fire at a number of sub-stations across
the country due to overloading and they need augmentation or addition of a transformer.
The list of overloaded substation will inform about that particular year in which a
substation will be overloaded. The overloading criterion of a substation has been
considered as 85% i.e. when any substation is 85% loaded the remedial measures should
be taken in the form of new substation or augmentation of the existing transformers.
Table 1-22 and Table 1-23 shows the list of overloaded substations based on overloading
criterion of 85% and 100% respectively.
4.11 List of Grids with their Codes and MVA Capacities
The list of Grids contains each substation having their codes and tranformers’ MVA
capacities are enlisted in the Table 1-24.
15
TESCO
Table 1- 1: PMS Recorded Forecast (Excluding Load Shedding)
Year
Energy Sale
Distribution Losses
Transmission Losses
Energy Sent out
Load Factor
Peak Demand
(GWh) G.R (GWh) (%) (GWh) (%) (GWh) (%) (MW)
2013-14 1366 293 17.3 37 2.18 1696 66 292
2014-15 1420 3.9 295 16.8 38 2.17 1753 66 301
2015-16 1476 4.0 296 16.4 39 2.16 1812 66 311
2016-17 1535 4.0 297 15.9 40 2.15 1873 66 321
2017-18 1626 5.9 304 15.4 42 2.14 1972 67 338
2018-19 1693 4.1 304 14.9 44 2.13 2041 67 349
2019-20 1762 4.1 305 14.4 45 2.12 2112 67 361
2020-21 1835 4.1 304 13.9 46 2.11 2186 67 373
2021-22 1911 4.2 304 13.4 48 2.10 2262 67 386
2022-23 1991 4.2 302 12.9 49 2.10 2343 67 399
2023-24 2075 4.2 300 12.4 51 2.09 2426 67 413
Ave. Growth (2014-2024)
4.27%
3.64%
3.52%

16
TESCO
Table 1- 2: PMS Base Forecast
Year
Computed Energy
Load Shed G.R
Distribution Losses
Transmission Losses
Computed Energy
Sent Out
Load Factor
Computed Peak
Demand G.R
(GWh) (%) (GWh) (%) (GWh) (%) (GWh) (%) (MW) (%)
2013-14 1772 381 17.7 48.0 2.18 2201 38 653
2014-15 1842 3.9 383 17.2 49.4 2.17 2274 39 674 3.2
2015-16 1915 3.9 384 16.7 50.8 2.16 2350 39 696 3.3
2016-17 1990 4.0 386 16.2 52.3 2.15 2428 39 719 3.3
2017-18 2100 5.5 392 15.7 54.6 2.14 2546 39 752 4.6
2018-19 2185 4.1 393 15.2 56.2 2.13 2634 39 777 3.3
2019-20 2274 4.1 393 14.7 57.9 2.12 2724 39 803 3.3
2020-21 2367 4.1 392 14.2 59.6 2.11 2819 39 830 3.4
2021-22 2464 4.1 391 13.7 61.4 2.10 2917 39 858 3.4
2022-23 2567 4.1 390 13.2 63.3 2.10 3019 39 887 3.4
2023-24 2674 4.2 387 12.6 65.2 2.09 3126 39 918 3.4
Ave. Growth (2014-2024)
4.20%
3.57% 3.46%

17
TESCO
Table 1- 3: Category-wise Sale – GWh (Base Forecast)
Year Domestic Commercial Public Light
Small Industries
M&L Industries
Tube Well Total
Energy G.R Energy G.R Energy G.R Energy G.R Energy G.R Energy G.R Energy G.R
2013-14 1234 10 0 62 0 60 1366
2014-15 1278 3.6 11 4.3 0 0.0 65 5.2 0 0.0 66 10.2 1420 3.9
2015-16 1324 3.6 11 4.3 0 0.0 69 5.2 0 0.0 73 10.2 1476 4.0
2016-17 1371 3.6 11 4.3 0 0.0 72 5.2 0 0.0 80 10.2 1535 4.0
2017-18 1420 3.6 12 4.3 0 0.0 76 5.2 30 0.0 88 10.1 1626 5.9
2018-19 1470 3.6 12 4.3 0 0.0 80 5.2 32 8.0 97 10.1 1693 4.1
2019-20 1523 3.6 13 4.2 0 0.0 84 5.2 35 8.0 107 10.1 1762 4.1
2020-21 1577 3.6 14 4.2 0 0.0 89 5.2 38 8.0 118 10.1 1835 4.1
2021-22 1633 3.6 14 4.2 0 0.0 93 5.2 41 8.0 130 10.1 1911 4.2
2022-23 1691 3.6 15 4.2 0 0.0 98 5.2 44 8.0 143 10.1 1991 4.2
2023-24 1751 3.6 15 4.2 0 0.0 103 5.2 48 8.0 158 10.1 2075 4.2
Ave. Growth (2014-2024)
3.57% 4.25%
0.00%
5.19%
0.00% 10.13% 4.27%

18
TESCO
Table 1- 4: Category-wise Sale – GWh (Base Forecast)
Year
Domestic Commercial Public Light Small
Industries M&L
Industries Tube Well Total
Energy G.R Energy G.R Energy G.R Energy G.R Energy G.R Energy G.R Energy G.R
2013-14 1601 13 0 81 0 78 1772
2014-15 1658 3.6 14 4.2 0 0.0 85 5.2 0 0.0 86 10.1 1842 3.9
2015-16 1717 3.6 14 4.2 0 0.0 89 5.2 0 0.0 95 10.1 1915 3.9
2016-17 1778 3.6 15 4.2 0 0.0 94 5.2 0 0.0 104 10.1 1990 4.0
2017-18 1841 3.6 15 4.2 0 0.0 99 5.2 30 0.0 115 10.1 2100 5.5
2018-19 1906 3.6 16 4.2 0 0.0 104 5.2 32 8.0 126 10.1 2185 4.1
2019-20 1974 3.5 17 4.2 0 0.0 109 5.1 35 8.0 139 10.1 2274 4.1
2020-21 2044 3.5 17 4.2 0 0.0 115 5.1 38 8.0 153 10.1 2367 4.1
2021-22 2117 3.5 18 4.2 0 0.0 120 5.1 41 8.0 168 10.1 2464 4.1
2022-23 2192 3.5 19 4.2 0 0.0 127 5.1 44 8.0 185 10.1 2567 4.1
2023-24 2269 3.5 20 4.2 0 0.0 133 5.1 48 8.0 204 10.1 2674 4.2
Ave. Growth
(2014-2024) 3.55% 4.19%
0.00%
5.15%
0.00% 10.10% 4.20%

19
TESCO
Table 1- 5: Category-wise Demand – MW (Excluding Load Shedding)
Year Domestic Commercial Public Light
Small Industries
M&L Industries
Tube Well Total
Demand G.R Demand G.R Demand G.R Demand G.R Demand G.R Demand G.R Demand G.R
2013-14 254 2 0 11 0 9 235
2014-15 263 3.6 2 4.3 0 0.0 11 5.2 0 0.0 10 10.2 244 3.9
2015-16 273 3.6 3 4.3 0 0.0 12 5.2 0 0.0 11 10.2 254 3.9
2016-17 282 3.6 3 4.2 0 0.0 12 5.2 0 0.0 12 10.2 264 3.9
2017-18 292 3.6 3 4.3 0 0.0 13 5.2 6 0.0 14 10.1 278 5.7
2018-19 303 3.6 3 4.2 0 0.0 14 5.2 6 8.0 15 10.1 290 4.0
2019-20 314 3.6 3 4.2 0 0.0 15 5.2 6 8.0 17 10.1 301 4.0
2020-21 325 3.6 3 4.2 0 0.0 15 5.2 7 8.0 18 10.1 313 4.0
2021-22 336 3.6 3 4.2 0 0.0 16 5.2 8 8.0 20 10.1 326 4.0
2022-23 348 3.6 3 4.2 0 0.0 17 5.2 8 8.0 22 10.1 339 4.1
2023-24 361 3.5 4 4.2 0 0.0 18 5.2 9 8.0 24 10.1 353 4.1
Ave. Growth
(2014-2024) 3.56% 4.23%
0.00%
5.20%
8.00% 10.13% 4.14%

20
TESCO
Table 1- 6: Category-wise Demand – MW (Including Load Shedding)
Year Domestic Commercial Public Light
Small Industries
M&L Industries
Tube Well Total
Demand G.R Demand G.R Demand G.R Demand G.R Demand G.R Demand G.R Demand G.R
2013-14 564 5 0 28 0 21 526
2014-15 584 3.6 5 4.2 0 0.0 30 5.2 0 0.0 23 10.1 546 3.9
2015-16 605 3.6 6 4.2 0 0.0 31 5.2 0 0.0 25 10.1 567 3.9
2016-17 627 3.5 6 4.2 0 0.0 33 5.2 0 0.0 28 10.1 589 3.9
2017-18 649 3.5 6 4.2 0 0.0 35 5.2 9 0.0 30 10.1 620 5.3
2018-19 672 3.5 6 4.2 0 0.0 37 5.2 10 8.0 33 10.1 645 4.0
2019-20 696 3.5 7 4.2 0 0.0 38 5.1 11 8.0 37 10.1 670 4.0
2020-21 720 3.5 7 4.2 0 0.0 40 5.1 12 8.0 40 10.1 697 4.0
2021-22 746 3.5 7 4.2 0 0.0 42 5.1 13 8.0 45 10.1 725 4.0
2022-23 772 3.5 8 4.2 0 0.0 45 5.1 14 8.0 49 10.1 754 4.0
2023-24 800 3.5 8 4.2 0 0.0 47 5.1 15 8.0 54 10.1 785 4.1
Ave. Growth (2014-2024)
3.54% 4.18%
0.00%
5.15%
8.00% 10.10% 4.09%

21
TESCO
Table 1- 7: District-wise Sale (GWh) ,Generation(GWh) and Demand (MW) Forecast For District: Ghallanai
Year Energy Sale Distribution Losses Transmission Losses Generation Load Factor Peak
Demand
(GWh) G.R.(%) (GWh) % (GWh) % (GWh) % (MW)
2013-14 840 0.00 180 17.68 23 2.18 1043 47 256
2014-15 872 3.82 181 17.20 23 2.17 1077 47 264
2015-16 906 3.83 182 16.72 24 2.16 1112 47 273
2016-17 940 3.84 182 16.23 25 2.15 1147 46 282
2017-18 1007 7.04 188 15.74 26 2.14 1221 46 302
2018-19 1047 3.98 188 15.24 27 2.13 1262 46 313
2019-20 1089 4.00 188 14.73 28 2.12 1304 46 323
2020-21 1132 4.01 188 14.22 29 2.11 1348 46 335
2021-22 1178 4.03 187 13.70 29 2.10 1394 46 346
2022-23 1226 4.05 186 13.18 30 2.10 1442 46 358
2023-24 1275 4.07 185 12.65 31 2.09 1491 46 371
Ave. Growth (2014-2024)
4.26%
3.64%
3.78%

22
TESCO
Table 1- 8: District-wise Sale (GWh), Generation(GWh) and Demand (MW) Forecast For District: Khyber
Year Energy Sale Distribution Losses Transmission Losses Generation Load Factor
Peak Demand
(GWh) G.R.(%) (GWh) % (GWh) % (GWh) % (MW)
2013-14 67 0.00 14 17.68 2 2.18 83 37 26
2014-15 70 4.66 15 17.20 2 2.17 86 37 27
2015-16 73 4.69 15 16.72 2 2.16 90 37 28
2016-17 77 4.72 15 16.23 2 2.15 94 37 29
2017-18 80 4.76 15 15.74 2 2.14 97 37 30
2018-19 84 4.79 15 15.24 2 2.13 101 37 31
2019-20 88 4.83 15 14.73 2 2.12 106 37 32
2020-21 93 4.88 15 14.22 2 2.11 110 37 34
2021-22 97 4.92 15 13.70 2 2.10 115 37 35
2022-23 102 4.97 15 13.18 3 2.10 120 38 36
2023-24 107 5.02 15 12.65 3 2.09 125 38 38
Ave. Growth (2014-2024)
4.82%
4.19%
4.05%

23
TESCO
Table 1- 9: District-wise Sale (GWh), Generation(GWh) and Demand (MW) Forecast For District: Bajour
Year Energy Sale Distribution Losses Transmission Losses Generation Load Factor
Peak Demand
(GWh) G.R.(%) (GWh) % (GWh) % (GWh) % (MW)
2013-14 34 0.00 7 17.68 1 2.18 42 30 16
2014-15 36 6.20 7 17.20 1 2.17 44 30 17
2015-16 38 6.26 8 16.72 1 2.16 47 30 18
2016-17 40 6.31 8 16.23 1 2.15 49 31 18
2017-18 43 6.37 8 15.74 1 2.14 52 31 19
2018-19 46 6.43 8 15.24 1 2.13 55 31 20
2019-20 49 6.49 8 14.73 1 2.12 58 31 21
2020-21 52 6.55 9 14.22 1 2.11 62 31 22
2021-22 55 6.61 9 13.70 1 2.10 66 32 24
2022-23 59 6.67 9 13.18 1 2.10 69 32 25
2023-24 63 6.74 9 12.65 2 2.09 74 32 26
Ave. Growth (2014-2024)
6.46%
5.82%
5.13%

24
TESCO
Table 1- 10: District-wise Sale (GWh), Generation (GWh) and Demand (MW) Forecast For District: Bara
Year Energy Sale Distribution Losses Transmission Losses Generation Load Factor
Peak Demand
(GWh) G.R.(%) (GWh) % (GWh) % (GWh) % (MW)
2013-14 67 0.00 14 17.68 2 2.18 84 19 49
2014-15 36 3.72 15 17.20 2 2.17 86 19 51
2015-16 38 3.72 15 16.72 2 2.16 89 19 52
2016-17 40 3.73 15 16.23 2 2.15 92 19 54
2017-18 43 3.73 15 15.74 2 2.14 94 20 55
2018-19 46 3.73 15 15.24 2 2.13 97 20 57
2019-20 49 3.73 14 14.73 2 2.12 100 20 59
2020-21 52 3.73 14 14.22 2 2.11 104 20 60
2021-22 55 3.73 14 13.70 2 2.10 107 20 62
2022-23 59 3.73 14 13.18 2 2.10 110 20 64
2023-24 63 3.73 14 12.65 2 2.09 113 20 66
Ave. Growth (2014-2024)
-0.65%
3.10%
3.03%

25
TESCO
Table 1- 11: District-wise Sale (GWh), Generation(GWh) and Demand (MW) Forecast For District: Lakarai
Year Energy Sale Distribution Losses Transmission Losses Generation Load Factor
Peak Demand
(GWh) G.R.(%) (GWh) % (GWh) % (GWh) % (MW)
2013-14 47 0.00 10 17.68 1 2.18 59 30 22
2014-15 49 3.58 10 17.20 1 2.17 60 30 23
2015-16 51 3.59 10 16.72 1 2.16 62 30 24
2016-17 53 3.59 10 16.23 1 2.15 64 30 25
2017-18 54 3.60 10 15.74 1 2.14 66 30 25
2018-19 56 3.60 10 15.24 1 2.13 68 30 26
2019-20 58 3.61 10 14.73 1 2.12 70 30 27
2020-21 61 3.62 10 14.22 2 2.11 72 30 28
2021-22 63 3.62 10 13.70 2 2.10 74 30 28
2022-23 65 3.63 10 13.18 2 2.10 77 30 29
2023-24 67 3.64 10 12.65 2 2.09 79 30 30
Ave. Growth (2014-2024)
3.61%
2.98%
2.95%

26
TESCO
Table 1- 12: District-wise Sale (GWh), Generation(GWh) and Demand (MW) Forecast For District: Tangi
Year Energy Sale Distribution Losses Transmission Losses Generation Load Factor
Peak Demand
(GWh) G.R.(%) (GWh) % (GWh) % (GWh) % (MW)
2013-14 29 0.00 6 17.68 1 2.18 35 37 11
2014-15 30 3.54 6 17.20 1 2.17 37 37 11
2015-16 31 3.55 6 16.72 1 2.16 38 37 12
2016-17 32 3.55 6 16.23 1 2.15 39 37 12
2017-18 33 3.55 6 15.74 1 2.14 40 37 12
2018-19 34 3.55 6 15.24 1 2.13 41 37 13
2019-20 35 3.55 6 14.73 1 2.12 42 37 13
2020-21 36 3.56 6 14.22 37 2.11 43 37 13
2021-22 38 3.56 6 13.70 1 2.10 45 37 14
2022-23 39 3.56 6 13.18 1 2.10 46 37 14
2023-24 40 3.57 6 12.65 1 2.09 47 37 15
Ave. Growth (2014-2024)
3.55%
2.93%
2.92%

27
TESCO
Table 1- 13: District -wise Sale (GWh), Generation(GWh) and Demand (MW) Forecast For District: Darra
Year Energy Sale Distribution Losses Transmission Losses Generation Load Factor
Peak Demand
(GWh) G.R.(%) (GWh) % (GWh) % (GWh) % (MW)
2013-14 31 0.00 7 17.68 1 2.18 39 31 14
2014-15 32 3.56 7 17.20 1 2.17 40 31 15
2015-16 34 3.56 7 16.72 1 2.16 41 31 15
2016-17 35 3.56 7 16.23 1 2.15 42 31 16
2017-18 36 3.56 7 15.74 1 2.14 44 31 16
2018-19 37 3.56 7 15.24 1 2.13 45 31 17
2019-20 39 3.56 7 14.73 1 2.12 46 31 17
2020-21 40 3.56 7 14.22 1 2.11 48 31 18
2021-22 41 3.56 7 13.70 1 2.10 49 31 18
2022-23 43 3.56 7 13.18 1 2.10 50 31 19
2023-24 44 3.56 6 12.65 1 2.09 52 31 19
Ave. Growth (2014-2024)
3.56%
2.94%
2.94%

28
TESCO
Table 1- 14: District -wise Sale (GWh), Generation(GWh) and Demand (MW) Forecast For District: Sadda
Year Energy Sale Distribution Losses Transmission Losses Generation Load Factor
Peak Demand
(GWh) G.R.(%) (GWh) % (GWh) % (GWh) % (MW)
2013-14 163 0.00 35 17.68 4 2.18 202 24 97
2014-15 169 4.12 35 17.20 5 2.17 209 24 100
2015-16 176 4.16 35 16.72 5 2.16 217 24 103
2016-17 184 4.19 36 16.23 5 2.15 224 24 107
2017-18 192 4.23 36 15.74 5 2.14 232 24 110
2018-19 200 4.27 36 15.24 5 2.13 241 24 114
2019-20 208 4.31 36 14.73 5 2.12 250 24 118
2020-21 217 4.35 36 14.22 5 2.11 259 24 121
2021-22 227 4.40 36 13.70 6 2.10 269 24 126
2022-23 237 4.44 36 13.18 6 2.10 279 25 130
2023-24 248 4.49 36 12.65 6 2.09 290 25 134
Ave. Growth (2014-2024)
4.30%
3.67%
3.32%

29
TESCO
Table 1- 15: District -wise Sale (GWh), Generation(GWh) and Demand (MW) Forecast For District: Tall
Year Energy Sale Distribution Losses Transmission Losses Generation Load Factor
Peak Demand
(GWh) G.R.(%) (GWh) % (GWh) % (GWh) % (MW)
2013-14 39 0.00 8 17.68 1 2.18 48 15 37
2014-15 40 3.53 8 17.20 1 2.17 50 15 38
2015-16 42 3.53 8 16.72 1 2.16 51 15 39
2016-17 43 3.53 8 16.23 1 2.15 53 15 40
2017-18 45 3.53 8 15.74 1 2.14 54 15 41
2018-19 46 3.53 8 15.24 1 2.13 56 15 43
2019-20 48 3.53 8 14.73 1 2.12 57 15 44
2020-21 50 3.53 8 14.22 1 2.11 59 15 45
2021-22 51 3.53 8 13.70 1 2.10 61 15 46
2022-23 53 3.54 8 13.18 1 2.10 63 15 48
2023-24 55 3.54 8 12.65 1 2.09 64 15 49
Ave. Growth (2014-2024)
3.53%
2.91%
2.89%

30
TESCO
Table 1- 16: District -wise Sale (GWh), Generation(GWh) and Demand (MW) Forecast For District: Mattani
Year Energy Sale Distribution Losses Transmission Losses Generation Load Factor
Peak Demand
(GWh) G.R.(%) (GWh) % (GWh) % (GWh) % (MW)
2013-14 46 0.00 10 17.68 1 2.18 58 35 19
2014-15 49 5.89 10 17.20 1 2.17 61 35 20
2015-16 52 5.99 10 16.72 1 2.16 64 35 21
2016-17 55 6.08 11 16.23 1 2.15 67 35 22
2017-18 59 6.17 11 15.74 2 2.14 71 35 23
2018-19 62 6.27 11 15.24 2 2.13 75 36 24
2019-20 66 6.36 11 14.73 2 2.12 79 36 25
2020-21 70 6.46 12 14.22 2 2.11 84 36 27
2021-22 75 6.56 12 13.70 2 2.10 89 36 28
2022-23 80 6.66 12 13.18 2 2.10 94 36 30
2023-24 86 6.75 12 12.65 2 2.09 100 37 31
Ave. Growth (2014-2024)
6.32%
5.68%
5.13%

31
TESCO
Table 1- 17: District -wise Sale (GWh), Generation(GWh) and Demand (MW) Forecast For District: Gumbat
Year Energy Sale Distribution Losses Transmission Losses Generation Load Factor
Peak Demand
(GWh) G.R.(%) (GWh) % (GWh) % (GWh) % (MW)
2013-14 15 0.00 3 17.68 0 0.39 18 43 5
2014-15 15 3.51 3 17.20 0 0.40 19 43 5
2015-16 16 3.51 3 16.72 0 2.16 19 43 5
2016-17 16 3.51 3 16.23 0 2.15 20 43 5
2017-18 17 3.51 3 15.74 0 2.14 20 43 5
2018-19 17 3.51 3 15.24 0 2.13 21 43 5
2019-20 18 3.51 3 14.73 0 2.12 21 43 6
2020-21 19 3.51 3 14.22 0 2.11 22 43 6
2021-22 19 3.51 3 13.70 0 2.10 23 43 6
2022-23 20 3.52 3 13.18 0 2.10 23 43 6
2023-24 21 3.52 3 12.65 1 2.09 24 43 6
Ave. Growth (2014-2024)
3.51%
2.89%
2.89%

32
TESCO
Table 1- 18: District -wise Sale (GWh), Generation(GWh) and Demand (MW) Forecast For District: Miran
Shah
Year Energy Sale Distribution Losses Transmission Losses Generation Load Factor
Peak Demand
(GWh) G.R.(%) (GWh) % (GWh) % (GWh) % (MW)
2013-14 82 0.00 18 17.68 2 2.23 102 22 53
2014-15 85 3.69 18 17.20 2 2.29 106 22 54
2015-16 89 3.69 18 16.72 2 2.16 109 22 56
2016-17 92 3.68 18 16.23 2 2.15 112 22 58
2017-18 95 3.68 18 15.74 2 2.14 116 22 60
2018-19 99 3.68 18 15.24 3 2.13 119 22 61
2019-20 102 3.68 18 14.73 3 2.12 123 22 63
2020-21 106 3.68 18 14.22 3 2.11 126 22 65
2021-22 110 3.68 17 13.70 3 2.10 130 22 67
2022-23 114 3.68 17 13.18 3 2.10 134 22 69
2023-24 118 3.68 17 12.65 3 2.09 138 22 71
Ave. Growth (2014-2024)
3.68%
3.06%
2.99%
33
TESCO
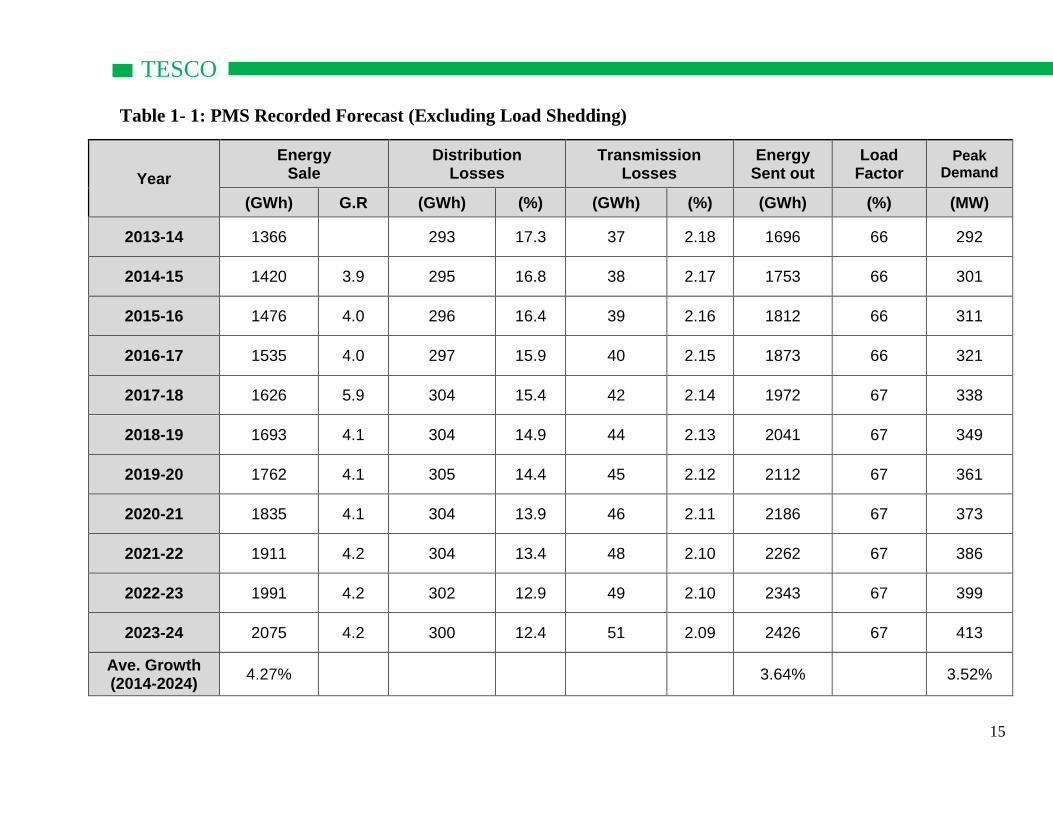
Table 1- 19: District -wise Sale (GWh), Generation(GWh) and Demand (MW) Forecast For District: Mir Ali
Year Energy Sale Distribution Losses Transmission Losses Generation Load Factor
Peak Demand
(GWh) G.R.(%) (GWh) % (GWh) % (GWh) % (MW)
2013-14 61 0.00 13 17.68 2 1.66 76 31 28
2014-15 63 3.70 13 17.20 2 1.70 78 31 29
2015-16 66 3.70 13 16.72 2 2.16 81 31 30
2016-17 68 3.69 13 16.23 2 2.15 83 31 31
2017-18 71 3.69 13 15.74 2 2.14 86 31 32
2018-19 73 3.68 13 15.24 2 2.13 88 31 33
2019-20 76 3.67 13 14.73 2 2.12 91 31 34
2020-21 79 3.67 13 14.22 2 2.11 94 31 35
2021-22 82 3.66 13 13.70 2 2.10 97 31 36
2022-23 85 3.66 13 13.18 2 2.10 100 31 37
2023-24 88 3.65 13 12.65 2 2.09 103 31 38
Ave. Growth (2014-2024)
3.68%
3.05%
3.05%

34
TESCO
Table 1- 20: District -wise Sale (GWh), Generation(GWh) and Demand (MW) Forecast For District: Wana
Year Energy Sale Distribution Losses Transmission Losses Generation Load Factor
Peak Demand
(GWh) G.R.(%) (GWh) % (GWh) % (GWh) % (MW)
2013-14 39 0.00 8 17.68 1 2.18 48 19 30
2014-15 40 3.55 8 17.20 1 1.08 50 19 31
2015-16 42 3.55 8 16.72 1 2.16 51 19 31
2016-17 43 3.55 8 16.23 1 2.15 53 19 32
2017-18 45 3.55 8 15.74 1 2.14 54 19 33
2018-19 46 3.55 8 15.24 1 2.13 56 19 34
2019-20 48 3.55 8 14.73 1 2.12 58 19 35
2020-21 50 3.55 8 14.22 1 2.11 59 19 36
2021-22 51 3.54 8 13.70 1 2.10 61 19 37
2022-23 53 3.54 8 13.18 1 2.10 63 19 38
2023-24 55 3.54 8 12.65 1 2.09 65 19 40
Ave. Growth (2014-2024)
3.55%
2.92%
2.92%

35
TESCO
Table 1- 21: District -wise Sale (GWh), Generation(GWh) and Demand (MW) Forecast For District: Kalaya
Year Energy Sale Distribution Losses Transmission Losses Generation Load Factor
Peak Demand
(GWh) G.R.(%) (GWh) % (GWh) % (GWh) % (MW)
2013-14 17 0.00 4 17.68 0 0.47 22 22 11
2014-15 18 3.57 4 17.20 0 0.48 22 22 11
2015-16 19 3.57 4 16.72 0 2.16 23 22 12
2016-17 19 3.58 4 16.23 1 2.15 24 22 12
2017-18 20 3.58 4 15.74 1 2.14 24 22 12
2018-19 21 3.58 4 15.24 1 2.13 25 22 13
2019-20 21 3.59 4 14.73 1 2.12 26 22 13
2020-21 22 3.59 4 14.22 1 2.11 26 22 13
2021-22 23 3.60 4 13.70 1 2.10 27 22 14
2022-23 24 3.60 4 13.18 1 2.10 28 22 14
2023-24 25 3.61 4 12.65 1 2.09 29 22 15
Ave. Growth (2014-2024)
3.59%
2.96%
2.93%

36
TESCO
Table 1- 22: District -wise Sale (GWh), Generation(GWh) and Demand (MW) Forecast For District: Tank
Year Energy Sale Distribution Losses Transmission Losses Generation Load Factor
Peak Demand
(GWh) G.R.(%) (GWh) % (GWh) % (GWh) % (MW)
2013-14 79 0.00 17 17.68 2 2.15 99 31 36
2014-15 82 3.50 17 17.20 2 2.20 101 31 37
2015-16 85 3.50 17 16.72 2 2.16 104 31 38
2016-17 88 3.50 17 16.23 2 2.15 107 31 40
2017-18 91 3.50 17 15.74 2 2.14 110 31 41
2018-19 94 3.50 17 15.24 2 2.13 114 31 42
2019-20 98 3.50 17 14.73 2 2.12 117 31 43
2020-21 101 3.50 17 14.22 3 2.11 120 31 44
2021-22 104 3.50 17 13.70 3 2.10 124 31 46
2022-23 108 3.50 16 13.18 3 2.10 127 31 47
2023-24 112 3.50 16 12.65 3 2.09 131 31 48
Ave. Growth (2014-2024)
3.50%
2.88%
2.88%

37
TESCO
Table 1- 23: District -wise Sale (GWh), Generation(GWh) and Demand (MW) Forecast For District: Jandola
Year Energy Sale Distribution Losses Transmission Losses Generation Load Factor
Peak Demand
(GWh) G.R.(%) (GWh) % (GWh) % (GWh) % (MW)
2013-14 22 0.00 5 17.68 1 0.59 27 37 8
2014-15 23 5.59 5 17.20 1 0.61 28 37 9
2015-16 24 5.68 5 16.72 1 2.16 30 37 9
2016-17 26 5.76 5 16.23 1 2.15 31 38 9
2017-18 27 5.85 5 15.74 1 2.14 33 38 10
2018-19 29 5.94 5 15.24 1 2.13 35 38 10
2019-20 30 6.04 5 14.73 1 2.12 36 38 11
2020-21 32 6.13 5 14.22 1 2.11 38 38 12
2021-22 34 6.22 5 13.70 1 2.10 41 38 12
2022-23 36 6.32 6 13.18 1 2.10 43 38 13
2023-24 39 6.41 6 12.65 1 2.09 45 38 13
Ave. Growth (2014-2024)
5.99%
5.36%
5.00%

38
TESCO
Table 1- 24: District -wise Sale (GWh), Generation(GWh) and Demand (MW) Forecast For District: Prova
Year Energy Sale Distribution Losses Transmission Losses Generation Load Factor
Peak Demand
(GWh) G.R.(%) (GWh) % (GWh) % (GWh) % (MW)
2013-14 7 0.00 2 17.68 0 0.20 9 25 4
2014-15 7 3.53 2 17.20 0 0.20 9 25 4
2015-16 8 3.53 2 16.72 0 2.16 10 25 4
2016-17 8 3.53 2 16.23 0 2.15 10 25 5
2017-18 8 3.53 2 15.74 0 2.14 10 25 5
2018-19 9 3.53 2 15.24 0 2.13 10 25 5
2019-20 9 3.53 2 14.73 0 2.12 11 25 5
2020-21 9 3.53 2 14.22 0 2.11 11 25 5
2021-22 10 3.53 2 13.70 0 2.10 11 25 5
2022-23 10 3.54 2 13.18 0 2.10 12 25 5
2023-24 10 3.54 1 12.65 0 2.09 12 25 6
Ave. Growth (2014-2024)
3.53%
2.91%
2.90%

39
TESCO
Table 1- 25: District -wise Sale (GWh), Generation(GWh) and Demand (MW) Forecast For District: Ramzak
Year Energy Sale Distribution Losses Transmission Losses Generation Load Factor
Peak Demand
(GWh) G.R.(%) (GWh) % (GWh) % (GWh) % (MW)
2013-14 16 0.00 3 17.68 0 0.43 20 31 7
2014-15 16 3.51 3 17.20 0 0.44 20 31 7
2015-16 17 3.51 3 16.72 0 2.16 21 31 8
2016-17 18 3.51 3 16.23 0 2.15 21 31 8
2017-18 18 3.51 3 15.74 0 2.14 22 31 8
2018-19 19 3.51 3 15.24 0 2.13 23 31 8
2019-20 19 3.51 3 14.73 0 2.12 23 31 9
2020-21 20 3.51 3 14.22 1 2.11 24 31 9
2021-22 21 3.51 3 13.70 1 2.10 25 31 9
2022-23 22 3.51 3 13.18 1 2.10 25 31 9
2023-24 22 3.51 3 12.65 1 2.09 26 31 10
Ave. Growth (2014-2024)
3.51%
2.88%
2.88%

40
TESCO
Table 1- 26: District -wise Sale (GWh), Generation(GWh) and Demand (MW) Forecast For District: Domail
Year Energy Sale Distribution Losses Transmission Losses Generation Load Factor
Peak Demand
(GWh) G.R.(%) (GWh) % (GWh) % (GWh) % (MW)
2013-14 71 0.00 15 17.68 2 1.92 88 50 20
2014-15 73 3.58 15 17.20 2 1.97 91 50 21
2015-16 76 3.57 15 16.72 2 2.16 93 50 22
2016-17 79 3.57 15 16.23 2 2.15 96 50 22
2017-18 82 3.57 15 15.74 2 2.14 99 50 23
2018-19 84 3.57 15 15.24 2 2.13 102 50 23
2019-20 88 3.57 15 14.73 2 2.12 105 50 24
2020-21 91 3.56 15 14.22 2 2.11 108 50 25
2021-22 94 3.56 15 13.70 2 2.10 111 50 26
2022-23 97 3.56 15 13.18 2 2.10 114 50 26
2023-24 101 3.56 15 12.65 2 2.09 118 50 27
Ave. Growth (2014-2024)
3.57%
2.94%
2.95%

41
TESCO
Table 1- 27: Division-wise Sale (GWh), Generation(GWh) and Demand (MW) Forecast For Divison: Peshawar
Year Energy Sale Distribution Losses Transmission Losses Generation Load Factor Peak
Demand
(GWh) G.R.(%) (GWh) % (GWh) % (GWh) % (MW)
2013-14 1084 0.00 233 17.68 29 2.18 1346 42 368
2014-15 1126 3.92 234 17.20 30 2.17 1391 42 380
2015-16 1171 3.94 235 16.72 31 2.16 1437 42 393
2016-17 1217 3.95 236 16.23 32 2.15 1485 42 406
2017-18 1295 6.43 242 15.74 34 2.14 1571 42 430
2018-19 1348 4.07 242 15.24 35 2.13 1625 42 445
2019-20 1403 4.09 242 14.73 36 2.12 1681 42 460
2020-21 1461 4.11 242 14.22 37 2.11 1740 42 476
2021-22 1521 4.13 242 13.70 38 2.10 1800 42 493
2022-23 1584 4.15 240 13.18 39 2.10 1864 42 510
2023-24 1650 4.18 239 12.65 40 2.09 1930 42 529
Ave. Growth (2014-2024)
4.29%
3.67%
3.70%
42
TESCO
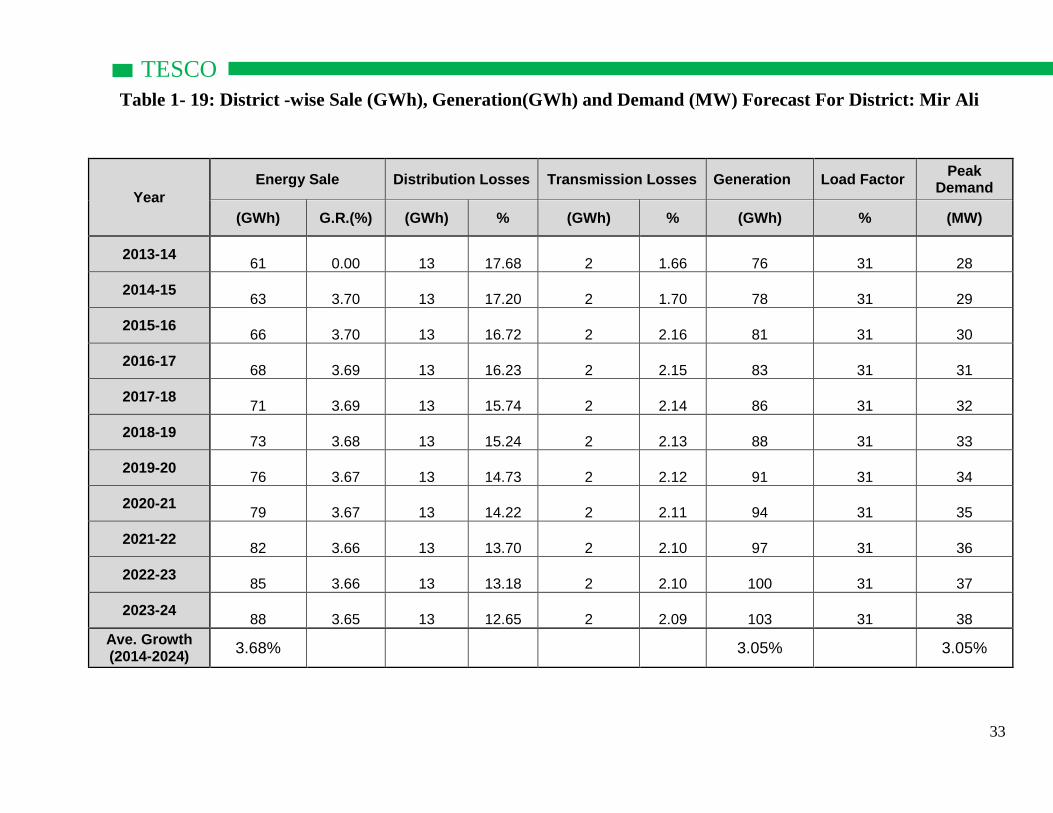
Table 1- 28: Division-wise Sale (GWh), Generation(GWh) and Demand (MW) Forecast For Divison: Hangu
Year Energy Sale Distribution Losses Transmission Losses Generation Load Factor
Peak Demand
(GWh) G.R.(%) (GWh) % (GWh) % (GWh) % (MW)
2013-14 294 0.00 63 17.68 8 2.18 365 25 166
2014-15 306 4.23 64 17.20 8 2.17 378 25 172
2015-16 319 4.27 64 16.72 8 2.16 392 25 178
2016-17 333 4.31 65 16.23 9 2.15 406 25 184
2017-18 348 4.36 65 15.74 9 2.14 422 25 190
2018-19 363 4.40 65 15.24 9 2.13 437 25 196
2019-20 379 4.45 65 14.73 10 2.12 454 26 203
2020-21 396 4.50 66 14.22 10 2.11 472 26 210
2021-22 414 4.55 66 13.70 10 2.10 490 26 217
2022-23 433 4.60 66 13.18 11 2.10 510 26 225
2023-24 453 4.66 66 12.65 11 2.09 530 26 233
Ave. Growth (2014-2024)
4.43%
3.80%
3.40%

43
TESCO
Table 1- 29: Division-wise Sale (GWh), Generation(GWh) and Demand (MW) Forecast For Divison: Bannu
Year Energy Sale Distribution Losses Transmission Losses Generation Load Factor
Peak Demand
(GWh) G.R.(%) (GWh) % (GWh) % (GWh) % (MW)
2013-14 161 0.00 35 17.68 4 2.18 200 26 89
2014-15 167 3.68 35 17.20 4 2.17 206 26 92
2015-16 173 3.68 35 16.72 5 2.16 212 26 95
2016-17 179 3.68 35 16.23 5 2.15 219 26 97
2017-18 186 3.67 35 15.74 5 2.14 226 26 100
2018-19 193 3.67 35 15.24 5 2.13 232 26 103
2019-20 200 3.67 35 14.73 5 2.12 240 26 106
2020-21 207 3.67 34 14.22 5 2.11 247 26 110
2021-22 215 3.66 34 13.70 5 2.10 254 26 113
2022-23 223 3.66 34 13.18 5 2 262 26 116
2023-24 231 3.66 33 12.65 6 2.09 270 26 120
Ave. Growth (2014-2024)
3.67%
3.05%
3.00%

44
TESCO
Table 1- 30: Division-wise Sale (GWh), Generation (GWh) and Demand (MW) Forecast For Divison: Tank
Year Energy Sale Distribution Losses Transmission Losses Generation Load Factor
Peak Demand
(GWh) G.R.(%) (GWh) % (GWh) % (GWh) % (MW)
2013-14 234 0.00 50 17.68 6 2 290 32 103
2014-15 243 3.73 50 17.20 7 2 300 32 106
2015-16 252 3.74 51 16.72 7 2 309 32 109
2016-17 261 3.75 51 16.23 7 2 319 32 112
2017-18 271 3.76 51 15.74 7 2 329 32 116
2018-19 281 3.77 51 15.24 7 2 339 32 119
2019-20 292 3.79 50 14.73 7 2 350 32 123
2020-21 303 3.80 50 14.22 8 2 361 32 127
2021-22 314 3.82 50 13.70 8 2 372 32 131
2022-23 327 3.83 50 13.18 8 2 384 33 135
2023-24 339 3.85 49 12.65 8 2 396 33 139
Ave. Growth (2014-2024)
3.78%
3.16%
3.08%

45
TESCO
Table 1- 31: Monthly Peak Demand Forecast
Year
July August September October November December January February March April May June
(MW) (MW) (MW) (MW) (MW) (MW) (MW) (MW) (MW) (MW) (MW) (MW)
2013-14 590 601 441 605 603 458 623 653 582 552 643 546
2014-15 609 621 456 624 623 473 643 674 601 570 663 564
2015-16 629 641 471 645 643 489 664 696 621 588 685 582
2016-17 649 662 486 666 664 505 686 719 641 607 707 601
2017-18 679 693 508 696 695 528 717 752 671 635 740 629
2018-19 702 716 525 720 718 546 741 777 693 657 765 650
2019-20 725 740 543 744 742 564 766 803 716 679 790 671
2020-21 750 765 561 769 767 583 792 830 741 701 817 694
2021-22 775 790 580 795 793 602 819 858 766 725 844 717
2022-23 801 817 600 822 820 623 847 887 791 750 873 742
2023-24 829 845 620 850 848 644 875 918 818 775 903 767

46
TESCO
Table 1- 32: List of Overloaded Substations during Period 2013-14 to 2023-24 Overloading Criterion=85%
S.No. Name Rating
Grid #
Total Capacity
Total Capacity
Overloading Criterion
Overloading Criterion Year of
Overloading
Overloading Status Power
Factor KV (MVA) (MW) (MW) (%) (MW)
1 Jamrud 132 3002 26 23.14 19.67 85.00 2013-14 71.50 0.89
2 L/Kotal 132 3005 52 45.76 38.90 85.00 2013-14 56.20 0.88
3 Bara 132 3007 52 46.28 39.34 85.00 2013-14 50.50 0.89
4 Jandola 66 3010 13 10.79 9.17 85.00 2014-15 8.90 0.83
5 Hayatabad 132 3014 26 23.40 19.89 85.00 2013-14 50.60 0.90
6 Wana 66 3015 33 29.70 25.25 85.00 2013-14 30.60 0.90
7 Mattani 132 3017 26 21.58 18.34 85.00 2013-14 19.50 0.83
8 Parachinar 132 3018 52 46.28 39.34 85.00 2013-14 65.90 0.89
9 Sadda 66 3019 26 23.40 19.89 85.00 2013-14 26.50 0.90
10 Tall 132 3021 39 35.10 29.84 85.00 2013-14 38.10 0.90
11 Tank 66 3024 26 23.40 19.89 85.00 2013-14 37.40 0.90
12 Kalaya 66 3027 13 11.70 9.95 85.00 2013-14 11.30 0.90
13 Miran Shah 132 3028 52 46.80 39.78 85.00 2013-14 47.50 0.90
14 Mir Ali 132 3031 39 35.10 29.84 85.00 2013-14 29.00 0.90
15 Ghallani 132 3032 65 58.50 49.73 85.00 2013-14 50.20 0.90
16 Lakkari 66 3033 26 23.40 19.89 85.00 2013-14 23.10 0.90
17 Domail 220 3034 26 23.40 19.89 85.00 2013-14 20.90 0.90
18 Tangi 132 3036 13 11.70 9.95 85.00 2013-14 11.20 0.90
19 Warsak 66 3037 26 23.40 19.89 85.00 2013-14 40.30 0.90

47
TESCO
Table 1- 33: List of Overloaded Substations during Period 2013-14 to 2023-24 Overloading Criterion=100%
S.No. Name Rating
Grid #
Total Capacity
Total Capacity
Overloading Criterion
Overloading Criterion Year of
Overloading
Overloading Status Power
Factor KV (MVA) (MW) (MW) (%) (MW)
1 Jamrud 132 3002 26 23.14 23.14 100.00 2013-14 71.50 0.89
2 L/Kotal 132 3005 52 45.76 45.76 100.00 2013-14 56.20 0.88
3 Bara 132 3007 52 46.28 46.28 100.00 2013-14 50.50 0.89
4 Jandola 66 3010 13 10.79 10.79 100.00 2017-18 10.20 0.83
5 Hayatabad 132 3014 26 23.40 23.40 100.00 2013-14 50.60 0.90
6 Wana 66 3015 33 29.70 29.70 100.00 2013-14 30.60 0.90
7 Mattani 132 3017 26 21.58 21.58 100.00 2015-16 21.40 0.83
8 Parachinar 132 3018 52 46.28 46.28 100.00 2013-14 65.90 0.89
9 Sadda 66 3019 26 23.40 23.40 100.00 2013-14 26.50 0.90
10 Tall 132 3021 39 35.10 35.10 100.00 2013-14 38.10 0.90
11 Tank 66 3024 26 23.40 23.40 100.00 2013-14 37.40 0.90
12 Kalaya 66 3027 13 11.70 11.70 100.00 2014-15 11.60 0.90
13 Miran Shah 132 3028 52 46.80 46.80 100.00 2013-14 47.50 0.90
14 Mir Ali 132 3031 39 35.10 35.10 100.00 2019-20 34.80 0.90
15 Ghallani 132 3032 65 58.50 58.50 100.00 2018-19 58.40 0.90
16 Lakkari 66 3033 26 23.40 23.40 100.00 2013-14 23.10 0.90
17 Domail 220 3034 26 23.40 23.40 100.00 2016-17 22.80 0.90
18 Tangi 132 3036 13 11.70 11.70 100.00 2014-15 11.50 0.90
19 Warsak 66 3037 26 23.40 23.40 100.00 2013-14 40.30 0.90

48
TESCO
Table 1- 34: List of Grids with their Codes & MVA Capacities
P O W E R M A R K E T S U R V E Y
List of Grids With Their Codes And MVA Capacities For TESCO
---------------------------------------------------------------------------------------------------------------------------
| SR. Grid Grid Transformers (MVA) | | SR. Grid Grid Transformers (MVA) |
| No. No. KV Name T1 T2 T3 T4 Total | | No. No. KV Name T1 T2 T3 T4 Total |
---------------------------------------------------------------------------------------------------------------------------
1 3001 132 Bannu 26 26 2 3002 132 Jamrud 26 26
3 3004 132 Kohat 26 26 4 3005 132 L/Kotal 26 26 52
5 3006 132 Prova 13 13 6 3007 132 Bara 26 26 52
7 3009 132 Hangu 13 13 8 3010 66 Jandola 13 13
9 3011 66 Bajour 13 13 13 39 10 3014 132 Hayatabad 26 26
11 3015 66 Wana 13 13 7 33 12 3016 66 K/Ghari 13 13
13 3017 132 Mattani 26 26 14 3018 132 Parachinar 26 26 52
15 3019 66 Sadda 13 13 26 16 3020 132 Warsak 13 13
17 3021 132 Tall 26 13 39 18 3023 66 Spar Sang 13 13
19 3024 66 Tank 26 26 20 3027 66 Kalaya 13 13
21 3028 132 Miran Shah 26 13 13 52 22 3029 132 Razmak 13 13
23 3030 132 Gumbat 13 13 24 3031 132 Mir Ali 26 13 39
25 3032 132 Ghallani 26 26 13 65 26 3033 66 Lakkari 13 13 26
27 3034 220 Domail 26 26 28 3036 132 Tangi 13 13
29 3037 66 Warsak 13 13 26

49
TESCO Table 1- 35: Maximum Demand (MW) of Substation
LOAD CENTRE SUMMARY
MAXIMUM DEMAND (MW) OF GRIDSTATIONS DISCO: TESCO --------------------------------------------------------------------------------------------------------------------------------------
|GRID| NAME OF | |_______________________________________________Y____E____A____R______________________________________________|
|NO. | GRIDSTATION |KV | 2013-14 | 2013-14 | 2014-15 | 2015-16 | 2016-17 | 2017-18 | 2018-19 | 2019-20 | 2020-21 | 2021-22 | 2023-24 |
--------------------------------------------------------------------------------------------------------------------------------------
1. 3034 Domail 220 20.9 21.5 22.2 22.8 23.5 24.2 24.9 25.6 26.4 27.2 28.0
2. 3001 Bannu 132 7.0 7.2 7.5 7.7 8.0 8.3 8.5 8.8 9.1 9.4 9.8
3. 3007 Bara 132 50.5 52.0 53.6 55.2 56.9 58.7 60.4 62.3 64.2 66.1 68.1
4. 3032 Ghallani 132 50.2 51.8 53.4 55.0 56.7 58.4 60.2 62.0 63.9 65.9 67.9
5. 3030 Gumbat 132 4.9 5.0 5.2 5.3 5.5 5.7 5.8 6.0 6.2 6.3 6.5
6. 3009 Hangu 132 4.6 4.8 4.9 5.1 5.2 5.4 5.5 5.7 5.8 6.0 6.2
7. 3014 Hayatabad 132 50.6 52.1 53.6 55.2 56.8 58.5 60.2 62.0 63.8 65.7 67.6
8. 3002 Jamrud 132 71.5 74.0 76.7 79.4 82.3 32.0 33.3 34.6 36.1 37.6 39.2
9. 3004 Kohat 132 10.1 10.4 10.7 11.0 11.3 11.7 12.0 12.4 12.8 13.1 13.5
10. 3005 L/Kotal 132 56.2 58.3 60.4 62.6 64.9 67.3 69.8 72.4 75.1 77.8 80.8
11. 3038 Marble City 132 0.0 0.0 0.0 0.0 11.5 12.4 13.3 14.2 15.3 16.4 17.6
12. 3017 Mattani 132 19.5 20.4 21.4 22.4 23.6 24.8 26.0 27.4 28.9 30.5 32.1
13. 3031 Mir Ali 132 29.0 29.9 30.8 31.8 32.8 33.8 34.8 35.9 37.0 38.1 39.2
14. 3028 Miran Shah 132 47.5 48.9 50.3 51.8 53.3 54.9 56.5 58.1 59.8 61.6 63.4
15. 3012 New Bajour 132 0.0 0.0 0.0 0.0 0.0 0.0 0.0 20.9 21.7 22.6 23.5
16. 3003 New Jamrud 132 0.0 0.0 0.0 0.0 0.0 53.4 55.2 57.2 59.2 61.3 63.5
17. 3018 Parachinar 132 65.9 68.2 70.5 73.0 75.5 78.2 80.9 83.8 86.9 90.0 93.4
18. 3006 Prova 132 4.3 4.4 4.5 4.6 4.8 4.9 5.1 5.2 5.4 5.5 5.7
19. 3029 Razmak 132 7.5 7.7 7.9 8.1 8.4 8.6 8.9 9.1 9.4 9.6 9.9
20. 3021 Tall 132 38.1 39.2 40.3 41.5 42.7 44.0 45.2 46.5 47.9 49.3 50.7
21. 3036 Tangi 132 11.2 11.5 11.9 12.2 12.6 13.0 13.3 13.7 14.1 14.5 15.0
22. 3020 Warsak 132 4.1 4.2 4.3 4.5 4.6 4.7 4.9 5.0 5.2 5.3 5.5
23. 3011 Bajour 66 32.4 33.8 35.3 36.9 38.5 40.3 42.1 23.2 24.4 25.7 27.1
24. 3010 Jandola 66 8.5 8.9 9.3 9.8 10.2 10.8 11.3 11.9 12.5 13.2 13.9
25. 3016 K/Ghari 66 7.3 7.5 7.8 8.0 8.2 8.5 8.7 9.0 9.2 9.5 9.8

50
TESCO
P O W E R M A R K E T S U R V E Y
: LOAD CENTRE SUMMARY
MAXIMUM DEMAND (MW) OF GRIDSTATIONS
DISCO: TESCO
--------------------------------------------------------------------------------------------------------------------------------------
|GRID| NAME OF | |_______________________________________________Y____E____A____R______________________________________________|
|NO. | GRIDSTATION |KV | 2013-14 | 2014-15 | 2015-16 | 2016-17 | 2017-18 | 2018-19 | 2019-20 | 2020-21 | 2021-22 | 2022-23 | 2023-24 |
--------------------------------------------------------------------------------------------------------------------------------------
26. 3027 Kalaya 66 11.3 11.6 12.0 12.3 12.7 13.1 13.4 13.8 14.2 14.7 15.1
27. 3033 Lakkari 66 23.1 23.8 24.5 25.3 26.0 26.8 27.6 28.4 29.2 30.1 31.0
28. 3019 Sadda 66 26.5 27.3 28.1 28.9 29.7 30.6 31.5 32.4 33.3 34.3 35.3
29. 3023 Spar Sang 66 0.8 0.9 1.0 1.1 1.2 1.3 1.4 1.5 1.6 1.8 2.0
30. 3024 Tank 66 37.4 38.5 39.6 40.8 41.9 43.1 44.4 45.7 47.0 48.3 49.7
31. 3015 Wana 66 30.6 31.5 32.4 33.4 34.3 35.3 36.4 37.4 38.5 39.7 40.8
32. 3037 Warsak 66 40.3 41.5 42.7 44.0 45.3 46.7 48.0 49.5 50.9 52.4 54.0
------------------------------------------------------------------------------------------------------------------
Total L.C. 771.8 796.8 822.8 849.7 888.9 919.4 949.5 981.6 1015.0 1049.5 1085.8

51
TESCO Table 1- 36: Category-wise Energy(GWh) and Maximum Demand (MW) of Substations
CATEGORY-WISE GRIDSTATION LOAD FOR DISCO
DISCO: TESCO Year:- YEAR :2023-24
-------------------------------------------------------------------------------------------------------------------------------------------------------------------
|SR GRID NAME OF | | | PUBLIC | SMALL | M & L | TUBE WELLS | | TOTAL OF | POWER FACTOR(%) |
|No.NUMBER GRID STATION | DOMESTIC | COMMERCIAL | LIGHTING | INDUSTRIES | INDUSTRIES | PRIVATE | PUBLIC | TRACTION | GRIDSTATION | REACT-POWER(Mvar)|
-------------------------------------------------------------------------------------------------------------------------------------------------------------------
1. 3011 66kV Bajour GWh 12.33 0.14 0.00 30.64 0.00 29.02 0.00 0.00 72.13 0.77
MW 9.38 0.11 0.00 13.06 0.00 9.27 0.00 0.00 27.05 22.00
2. 3001 132kV Bannu GWh 29.95 0.02 0.00 0.01 0.00 0.22 0.00 0.00 30.19 0.90
MW 11.40 0.01 0.00 0.00 0.00 0.07 0.00 0.00 9.76 5.00
3. 3007 132kV Bara GWh 97.95 0.03 0.00 12.75 0.00 0.33 0.00 0.00 111.07 0.89
MW 74.54 0.02 0.00 5.44 0.00 0.11 0.00 0.00 68.09 35.00
4. 3034 220kV Domail GWh 115.05 0.00 0.00 0.00 0.00 0.17 0.00 0.00 115.23 0.90
MW 32.83 0.00 0.00 0.00 0.00 0.06 0.00 0.00 27.96 14.00
5. 3032 132kV Ghallani GWh 225.93 1.88 0.00 1.20 0.00 1.43 0.00 0.00 230.44 0.90
MW 78.15 0.72 0.00 0.51 0.00 0.46 0.00 0.00 67.86 33.00
6. 3030 132kV Gumbat GWh 23.51 0.00 0.00 0.00 0.00 0.04 0.00 0.00 23.56 0.90
MW 7.67 0.00 0.00 0.00 0.00 0.01 0.00 0.00 6.53 3.00
7. 3009 132kV Hangu GWh 24.20 0.00 0.00 0.00 0.00 0.00 0.00 0.00 24.20 0.90
MW 7.27 0.00 0.00 0.00 0.00 0.00 0.00 0.00 6.18 3.00
8. 3014 132kV Hayatabad GWh 385.97 0.46 0.00 1.61 0.00 0.22 0.00 0.00 388.25 0.90
MW 78.68 0.10 0.00 0.69 0.00 0.07 0.00 0.00 67.61 33.00
9. 3002 132kV Jamrud GWh 85.11 11.45 0.00 1.40 0.00 24.57 0.00 0.00 122.54 0.88
MW 32.39 5.23 0.00 0.60 0.00 7.85 0.00 0.00 39.16 21.00
10. 3010 66kV Jandola GWh 23.99 0.04 0.00 0.00 0.00 20.35 0.00 0.00 44.38 0.83
MW 9.78 0.02 0.00 0.00 0.00 6.50 0.00 0.00 13.86 9.00
11. 3016 66kV K/Ghari GWh 23.12 0.00 0.00 0.00 0.00 0.00 0.00 0.00 23.12 0.90
MW 11.47 0.00 0.00 0.00 0.00 0.00 0.00 0.00 9.75 5.00
12. 3027 66kV Kalaya GWh 27.70 0.06 0.00 0.03 0.00 0.46 0.00 0.00 28.24 0.90
MW 17.57 0.04 0.00 0.01 0.00 0.15 0.00 0.00 15.10 7.00
13. 3004 132kV Kohat GWh 26.28 0.07 0.00 0.04 0.00 0.19 0.00 0.00 26.59 0.90
MW 15.79 0.04 0.00 0.02 0.00 0.06 0.00 0.00 13.53 7.00
14. 3005 132kV L/Kotal GWh 216.43 0.12 0.00 73.26 0.00 15.41 0.00 0.00 305.21 0.84
MW 58.83 0.03 0.00 31.22 0.00 4.93 0.00 0.00 80.75 52.00
15. 3033 66kV Lakkari GWh 75.33 0.04 0.00 0.19 0.00 1.60 0.00 0.00 77.17 0.90
MW 35.83 0.02 0.00 0.08 0.00 0.51 0.00 0.00 30.98 15.00
16. 3038 132kV Marble City GWh 0.00 0.00 0.00 0.00 54.50 0.00 0.00 0.00 54.50 0.90
MW 0.00 0.00 0.00 0.00 20.74 0.00 0.00 0.00 17.63 9.00
17. 3017 132kV Mattani GWh 47.60 0.02 0.00 0.05 0.00 50.22 0.00 0.00 97.89 0.82
MW 21.73 0.01 0.00 0.02 0.00 16.05 0.00 0.00 32.15 22.00
18. 3031 132kV Mir Ali GWh 98.26 2.13 0.00 0.08 0.00 0.11 0.00 0.00 100.58 0.90
MW 44.87 1.22 0.00 0.03 0.00 0.03 0.00 0.00 39.23 19.00
19. 3028 132kV Miran Shah GWh 103.70 0.16 0.00 0.08 0.00 1.32 0.00 0.00 105.26 0.90
MW 73.99 0.12 0.00 0.03 0.00 0.42 0.00 0.00 63.38 31.00
20. 3012 0kV New Bajour GWh 18.86 0.00 0.00 25.19 0.00 7.86 0.00 0.00 51.92 0.82
MW 14.35 0.00 0.00 10.74 0.00 2.51 0.00 0.00 23.46 16.00
21. 3003 0kV New Jamrud GWh 167.84 4.42 0.00 0.00 0.00 27.74 0.00 0.00 200.00 0.89
MW 63.87 2.02 0.00 0.00 0.00 8.87 0.00 0.00 63.54 33.00
22. 3018 132kV Parachinar GWh 163.59 0.14 0.00 5.46 0.00 43.93 0.00 0.00 213.12 0.88
MW 93.37 0.09 0.00 2.33 0.00 14.04 0.00 0.00 93.35 50.00
23. 3006 132kV Prova GWh 11.68 0.00 0.00 0.00 0.00 0.05 0.00 0.00 11.73 0.90
MW 6.67 0.00 0.00 0.00 0.00 0.02 0.00 0.00 5.68 3.00
24. 3029 132kV Razmak GWh 25.56 0.01 0.00 0.00 0.00 0.00 0.00 0.00 25.57 0.90
MW 11.67 0.00 0.00 0.00 0.00 0.00 0.00 0.00 9.92 5.00
25. 3019 66kV Sadda GWh 47.15 0.05 0.00 0.06 0.00 0.14 0.00 0.00 47.41 0.90
MW 41.40 0.04 0.00 0.03 0.00 0.05 0.00 0.00 35.29 17.00

52
TESCO
P O W E R M A R K E T S U R V E Y
CATEGORY-WISE GRIDSTATION LOAD FOR DISCO
DISCO: TESCO Year:- YEAR :2023-24
-------------------------------------------------------------------------------------------------------------------------------------------------------------------
|SR GRID NAME OF | | | PUBLIC | SMALL | M & L | TUBE WELLS | | TOTAL OF | POWER FACTOR(%) |
|No.NUMBER GRID STATION | DOMESTIC | COMMERCIAL | LIGHTING | INDUSTRIES | INDUSTRIES | PRIVATE | PUBLIC | TRACTION | GRIDSTATION | REACT-POWER(Mvar)|
-------------------------------------------------------------------------------------------------------------------------------------------------------------------
26. 3023 66kV Spar Sang GWh 0.00 0.00 0.00 0.00 0.00 7.24 0.00 0.00 7.24 0.75
MW 0.00 0.00 0.00 0.00 0.00 2.32 0.00 0.00 1.97 2.00
27. 3021 132kV Tall GWh 61.64 1.12 0.00 0.04 0.00 0.25 0.00 0.00 63.06 0.90
MW 58.64 0.92 0.00 0.02 0.00 0.08 0.00 0.00 50.70 25.00
28. 3036 132kV Tangi GWh 45.88 0.01 0.00 0.00 0.00 0.47 0.00 0.00 46.36 0.90
MW 17.46 0.00 0.00 0.00 0.00 0.15 0.00 0.00 14.97 7.00
29. 3024 66kV Tank GWh 128.09 0.01 0.00 0.01 0.00 0.01 0.00 0.00 128.12 0.90
MW 58.49 0.00 0.00 0.00 0.00 0.00 0.00 0.00 49.73 24.00
30. 3015 66kV Wana GWh 62.81 0.18 0.00 0.14 0.00 0.04 0.00 0.00 63.17 0.90
MW 47.80 0.14 0.00 0.06 0.00 0.01 0.00 0.00 40.81 20.00
31. 3020 132kV Warsak GWh 11.26 0.00 0.00 0.00 0.00 0.00 0.00 0.00 11.26 0.90
MW 6.43 0.00 0.00 0.00 0.00 0.00 0.00 0.00 5.46 3.00
32. 3037 66kV Warsak GWh 211.03 0.04 0.00 0.15 0.00 0.01 0.00 0.00 211.23 0.90
MW 63.39 0.02 0.00 0.06 0.00 0.00 0.00 0.00 53.96 26.00
==============================================================================================================================================================
TOTAL OF DISCO : GWh 2653.13 23.07 0.00 155.63 55.66 238.43 0.00 0.00 3125.92
MW 934.76 9.22 0.00 54.90 17.53 63.08 0.00 0.00 917.58

53
TESCO
Figure 1- 10: Distribution Network Map


54
TESCO
Disclaimer
All data used in this report are provided by TESCO.
Planning Power, NTDCL does not own any error responsibility.


![Food security and nutrition: building a global narrative ... · EXECUTIVE SUMMARY EXECUTIVE SUMMARY EXECUTIVE SUMMARY EXECUTIVE SUMMAR Y [ 2 ] This document contains the Summary and](https://img.pdfslide.net/doc/110x75/5ff5433612d22125fb06e6b5/food-security-and-nutrition-building-a-global-narrative-executive-summary-executive.jpg)